mba 515 financial management. today’s class... introductions and house keeping review of 507...
TRANSCRIPT

MBA 515
Financial Management

Today’s class...
• Introductions and house keeping
• Review of 507 concepts

My Background
• NAME: Ken Shah• PhD: University of Oregon• INDUSTRY EXPERIENCE:
– 4 yrs Floor Trader / Stock Broker - Bombay Stock Exchange
– 3 yrs Quantitative Portfolio Management Research, Portland, Oregon

Academic Experience
• Taught at– University of Oregon– University of Auckland– Southern Methodist University
• Courses in capital budgeting, corporate finance, investments, and money and banking
Recent Research• Analyst Forecasts
• Bond Returns
• Capital Structure
• Initial Public Offerings

Please Introduce yourself...
• Please fill out the student information sheet
• Drop by my office!
• Information sheet with photo next class

Information Sheet
• Attach a photo/photocopy of a photo• Tell me about yourself, if you like – present
career, goals, etc.• Tell me about any anticipated absences• Any other special concerns/considerations
Course Objectives
• Build on MBA 507 concepts
• How investment and financing decisions affect firm value
• Valuation, Sources of financing, and Capital structure

Course Prerequisites
• Understanding of:– Financial statements– Discounting of cash flows– Spreadsheets– Rudimentary statistics
• Pre-requisites: MBA 500-512

Texts
• Required: – Class packet at CopyMart– Lecture notes on the class web page
• Optional: – Brealey & Myers, Principles of Corporate Finance– Damodaran, Investment Valuation (Advanced
reading)

Evaluation
• Final Exam 300• Homeworks 600• Class Participation 100• TOTAL 1000

Grading Policy
• If you attend all classes and diligently complete all required work, you would be assured of a B- grade
• In order to get an A/A-, you must show work of superior quality and make a meaningful contribution to the class discussions– roughly 15% of the class

Class Attendance
• Mandatory
• Please inform me of anticipated absences– First absence will not affect your grade– Each subsequent absence will adversely affect your
grade by half grade point for each absence

HW Assignments
• A group of 3 students turns in one solution– Group work is required
• Each member should make copies of assignment prior to turning in to facilitate discussion
Review
• Discounted Cash Flow/Time Value of Money• Bond Valuation• Stock Valuation• NPV• CAPM• Capital Budgeting

DCF/TVM
• PV and FV of a lump sum
• PV and FV of Annuities
• PV and FV combined
• Perpetuities

PV and FV of a lump sum
• ‘r’ and ‘t’ must match• If t is # of months, r must be a monthly rate
tt rPVFV 1
TVM example
• How many years does it take to double your $100,000 inheritance if you can invest the money earning 11% compounded annually?
Answer: 6.64 years

PV of Annuity
PVofAnnuity Cr
r
t
11
1( )
• Again: ‘r’ and ‘t’ must match• If t is # of months, r must be a monthly rate, and C is the
payment per month
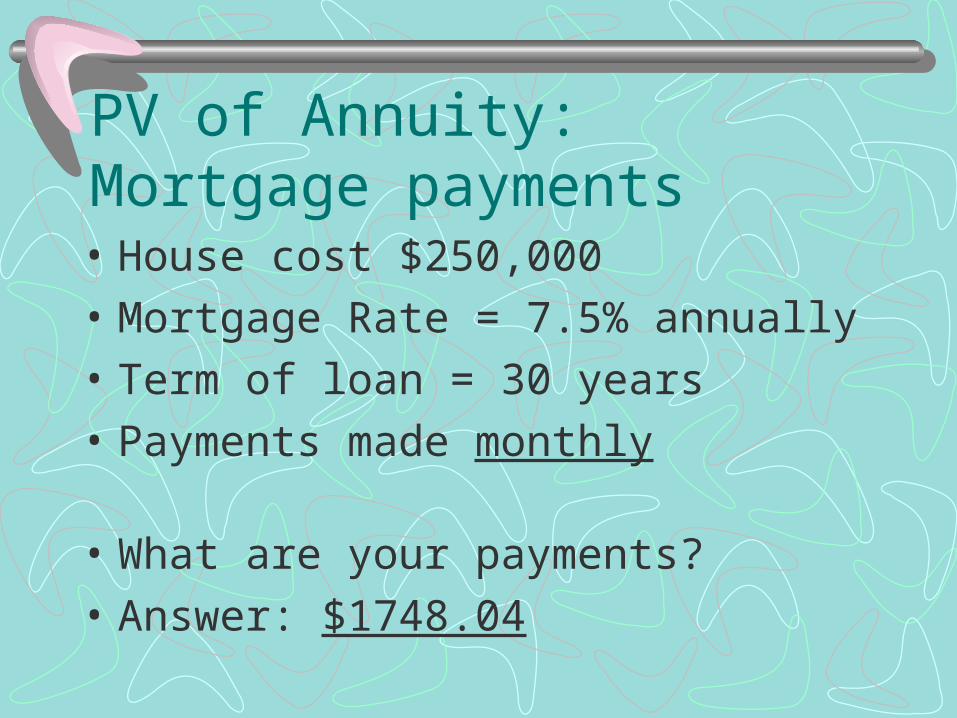
PV of Annuity: Mortgage payments
• House cost $250,000• Mortgage Rate = 7.5% annually• Term of loan = 30 years• Payments made monthly
• What are your payments?• Answer: $1748.04

FV of Annuity
FVofAnnuity C
r
r
t
1 1
• Again: ‘r’ and ‘t’ must match• If t is # of months, r must be a monthly rate, and
C is the payment per month

FV of Annuity Example
• You will contribute $400 per month for the next 35 years into a retirement savings plan. If your money earns 12% interest per year, how much will you have accumulated at retirement?
• Answer: $2,572,383

• How much must you contribute in an IRA per month to have an amount in 20 years that will provide an annual income of $200,000 per year for 10 years? Interest rate is 8% per year.
• Answer: $2,278.28
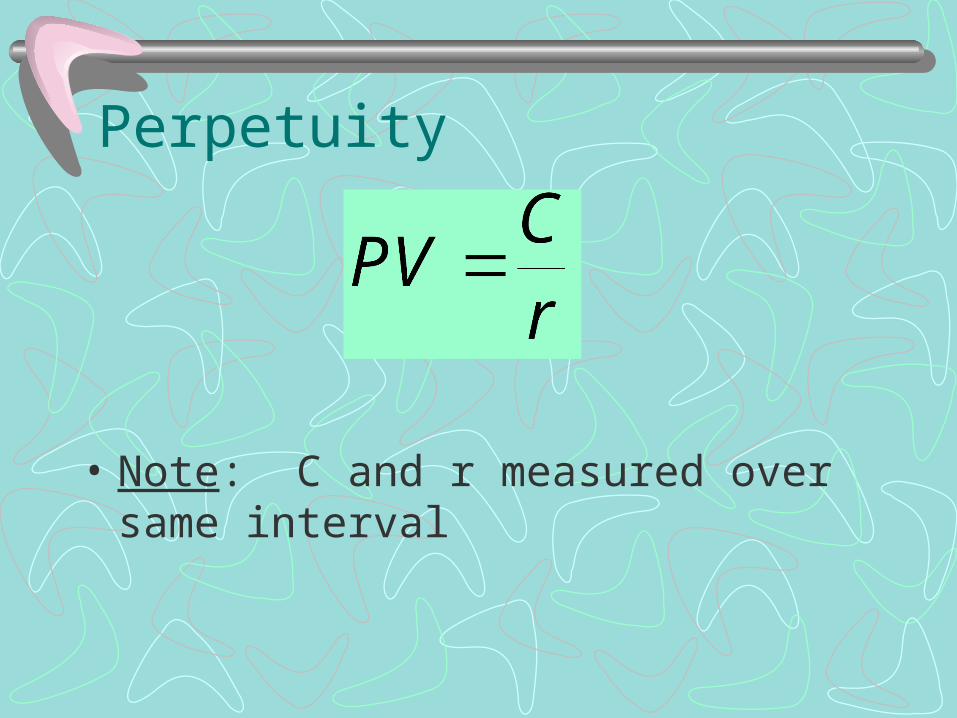
Perpetuity
• Note: C and r measured over same interval

Perpetuity Example
• Preferred stock pays $1.00 dividend per quarter. The required return, r, is 10% per year.
• What is the stock value?• Answer: $40.00

Review: Bond Valuation
• Fixed periodic coupon payments– Typically semi-annual
• Principal payment at maturity
• Yield to maturity (YTM) is that discount rate which makes the PV of all cash flows equal to the price
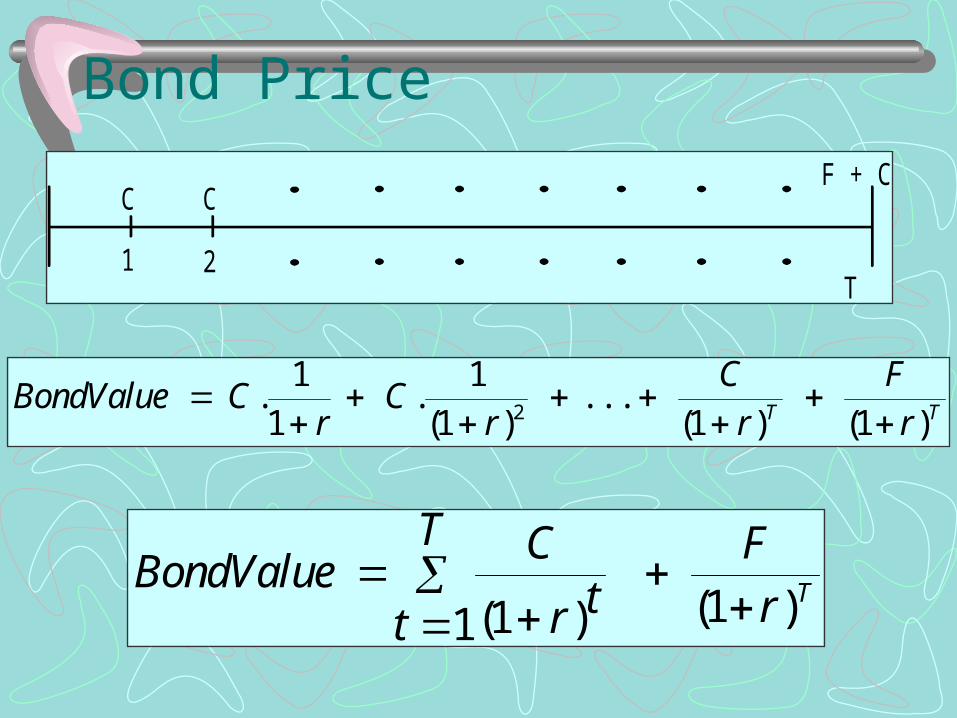
Bond Price
BondValue Cr
Cr
C
r
F
rT T
. .( )
. . .( ) ( )
1
1
1
1 1 12
BondValueC
r tt
T F
r T
( ) ( )11 1
C C
1 2T
F + C

Example• $1000 par bond maturing 15 years from today has an
annual coupon rate of 53/4 % paid semiannually. Required return on bond (r) is 7.5% per year compounded semiannually.
• What is the value today?• Answer: $843.99• If price is 104% of par, what is its YTM?• Answer: 5.36%

Coupon Rate• Coupon Rate
= Annual Coupon Payment Face Value
• Coupon rate is always quoted annually
• Example: 4 3/4% ATT 09– 4 3/4% is the coupon rate

Yield to Maturity (YTM)• It is the yield ‘r’ calculated when market price of bond is
known• If
– bond is held to maturity, AND– bond does not default, AND– bond is not called
• then,– YTM is the return an investor earns on the bond– YTM is the ‘best guess’ of an investor’s expected return

Current Yield• An approximation of YTM
Curr. Yld. = Annual Coupon Payment Market Price
• Reported for Corporate bonds in the WSJ

Important to...• Distinguish between:
– Yield To Maturity– Coupon Rate– Current Yield
• They are not all the same!!

Bond Rates and Yields
• Suppose a bond currently sells for $932.90. It pays a semi-annual coupon of $35, and it matures in 10 years. It has a face value of $1000. What are its coupon rate, current yield, and yield to maturity (YTM)?
1. The coupon rate (or just “coupon”) is the annual dollar coupon expressed as a percentage of the face value:
Coupon rate = $____ /$_____ = 7.00%
2. The current yield is the annual coupon divided by the current market price of the bond:
Current yield = $___ _/_____ = 7.50%
3. The yield to maturity is = 7.99%
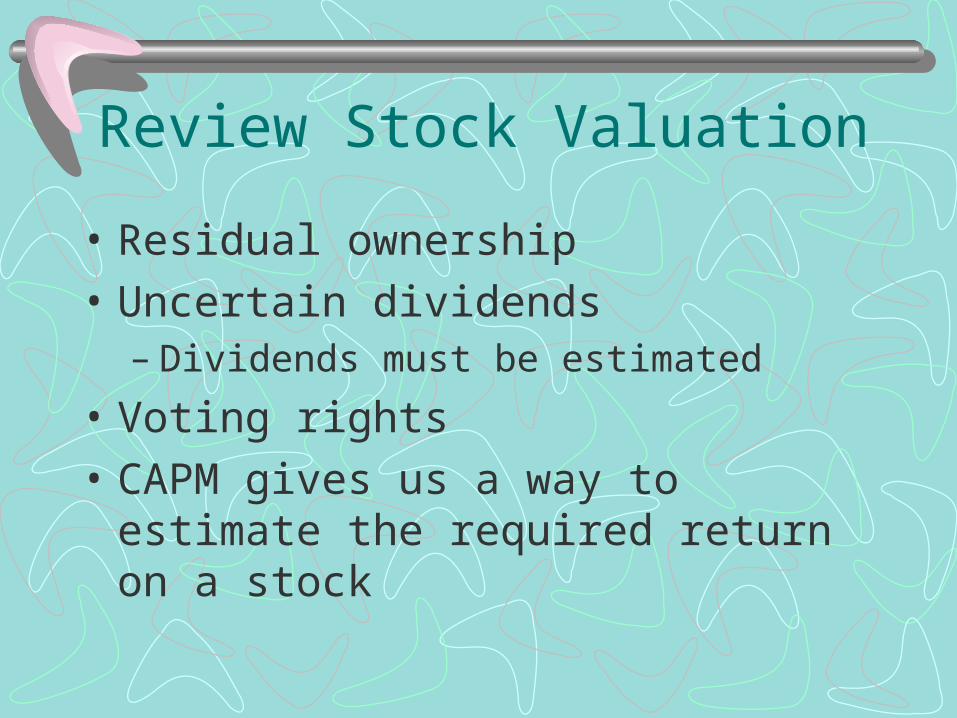
Review Stock Valuation
• Residual ownership• Uncertain dividends
– Dividends must be estimated• Voting rights• CAPM gives us a way to estimate the required
return on a stock

Dividend Discount Model (DDM)
PD
r
D
r
D
rm
m01 2
21 1 1
( ). . .
( ).........
• r = required rate of return on stock• ALL future dividends must be estimated
– “ from here to eternity!!!”• Of little practical importance
Note
• Stock value is the PV of all future expected dividends
• Stock value is NOT the PV of all future expected earnings or EPS– Unless a company pays out all earnings as dividends
• Which implies that there is no growth

Constant Growth DDM
• Notice it is much simpler to estimate:
• You need only THREE inputs: D1, r, g

Caution
• Constant growth model is simple but inappropriate model to use for many or most companies that have abnormal growth phases
• Constant growth model is appropriate only for stable, mature companies like utilities
• Constant growth model is often used to estimate the steady-state terminal values in a multi-stage growth model of valuing stocks
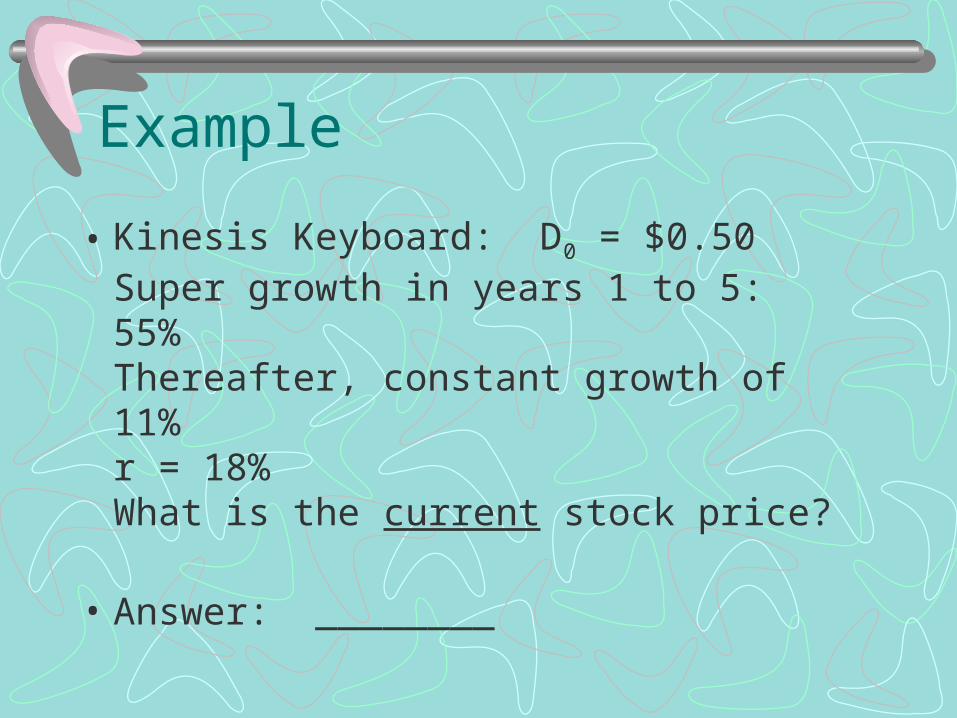
Example
• Kinesis Keyboard: D0 = $0.50Super growth in years 1 to 5: 55%Thereafter, constant growth of 11%r = 18%What is the current stock price?
• Answer: ________

Calculate dividends and terminal value
• Now you have all the numbers needed• Fill in the boxes• Show all the dividends and P5 on the time line
0 1 2 3 4 5 6
+

Using your calculator (HP 10B/12B)• Enter CF0 as: $0.0000
Enter CF1 as: $0.7750• Enter CF2 as: $1.2013• Enter CF3 as: $1.8619• Enter CF4 as: $2.8860• Enter CF5 as D5 + P5: $75.4071• Enter interest rate 11• Hit• Answer: $ 49.68
CFj
NPVShift
CFj
CFj
CFj
CFj
CFj
I/YR

Review of NPV• NPV is the dollar value added to the enterprise
– it’s the amount by which the enterprise is richer!
• For public companies, NPV is the increase in total market value of equity
• Managers should not take negative NPV projects since it reduces the firm value
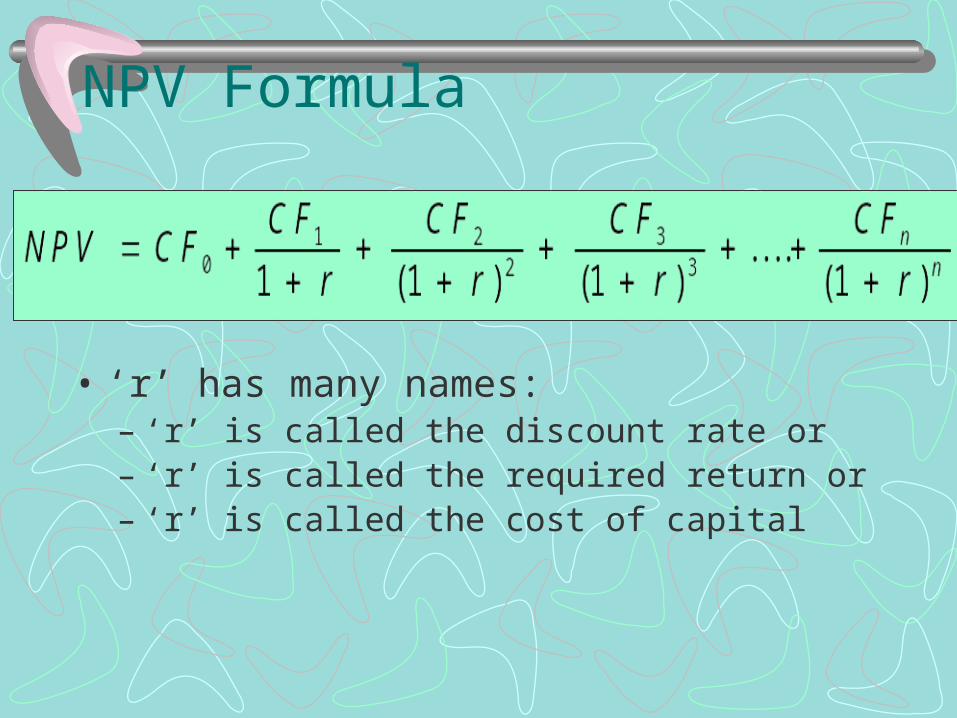
NPV Formula
• ‘r’ has many names:– ‘r’ is called the discount rate or– ‘r’ is called the required return or– ‘r’ is called the cost of capital

Computing NPV on calculator
• Use the CFj key– First entry is at time 0– Subsequent entries are time 1, 2, 3, ... and so on– make sure the cash flows have the proper signs
• Enter ‘r’ as the I/YR• Use the keysNPV

Discounting Cash Flows
• ALWAYS USE A DISCOUNT RATE THAT REFLECTS THE RISK OF THE CASH FLOWS THAT YOU ARE DISCOUNTING
• ‘r’ in the denominator should reflect the risk of the CFt in the numerator
• ‘r’ reflects the risk of the investment, not the risk of the investor!

CAPM• The main contribution of CAPM is to derive an
exact relation between risk and return• The main message of CAPM is that
– Investors hold fully diversified (market) portfolio– Diversified portfolios have no unsystematic risk– Therefore, for individual securities, risk is measured
by the contribution that security makes to the risk of the (market) portfolio, i.e., systematic risk or beta
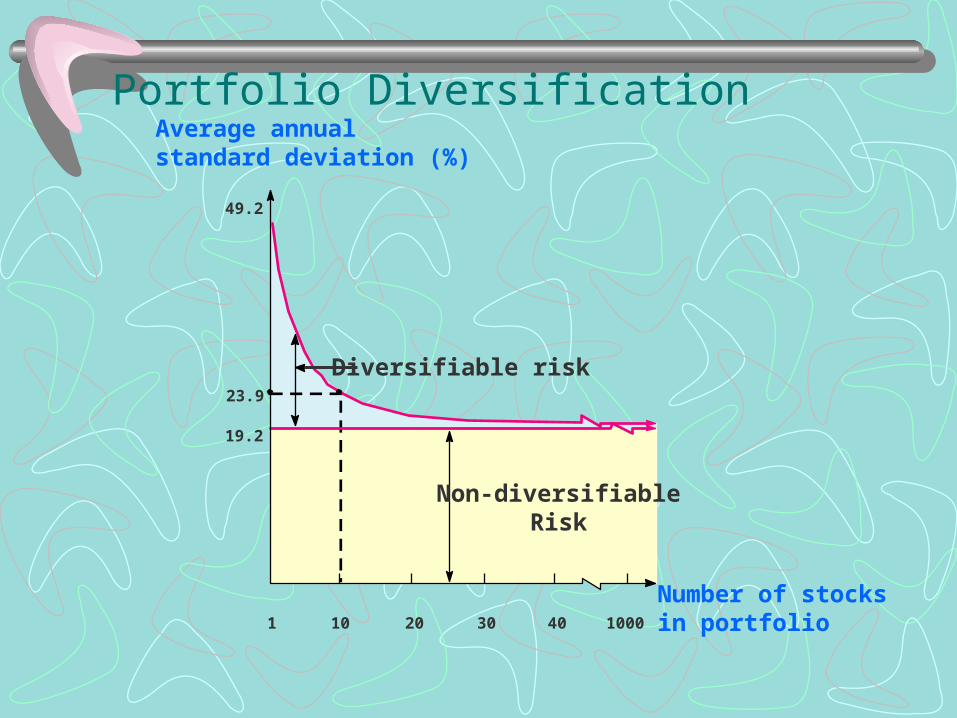
Portfolio DiversificationAverage annualstandard deviation (%)
Number of stocksin portfolio
Diversifiable risk
49.2
23.9
19.2
1 10 20 30 40 1000
Non-diversifiableRisk

CAPM Equation
• [E(Rm) – Rf] = Market Risk Premium (MRP)
• Rf = Risk Free rate
• βi = stock beta

The Security Market Line (SML)Asset expectedreturn E (Ri)
Assetbeta
E (RM)
Rf
M = 1.0
= E (RM ) – Rf
0

Review of Compounding
• To compound or not to compound - that is the question!!
• Compounding means reinvesting the proceeds• SEC requires funds and investment managers to
report returns that account for compounding

EAR
m = number of compounding periods in a year

EAR on Calculator• What is the EAR for quoted rate of 15% per year
compounded quarterly?• Set number of periods per year: 4• Enter quoted annual rate: 15• Compute EAR:• Answer: 15.865%
P/YR
I/YR
EFF%
EAR Example• Compute EAR for 12% compounded
– Annually– Quarterly– Monthly– Daily
• Answers: ____ , ____ , ____ , ____
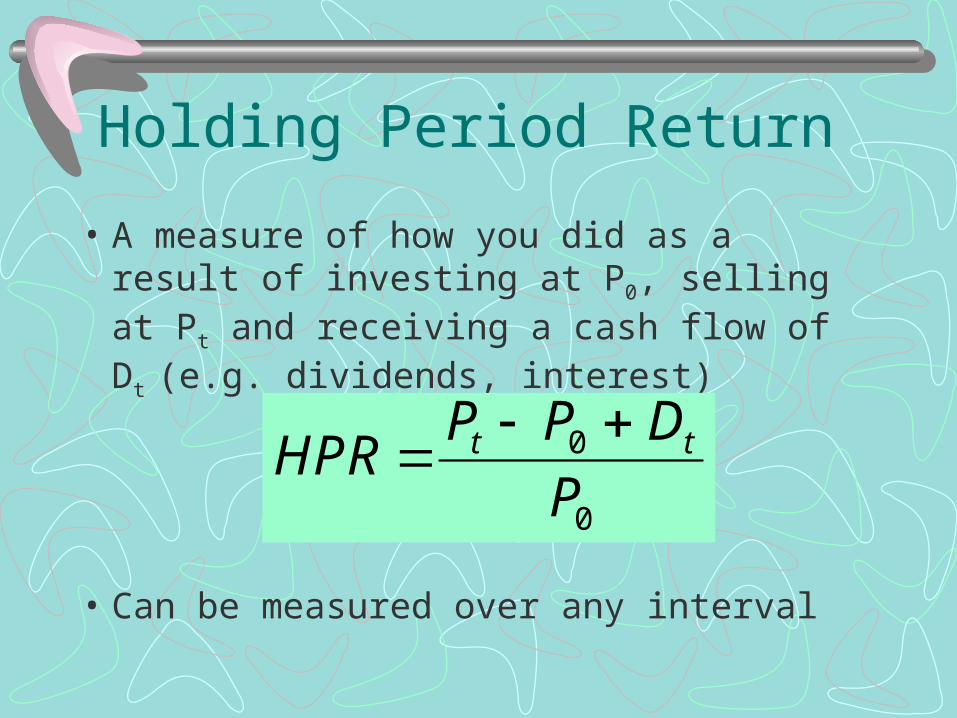
Holding Period Return
• A measure of how you did as a result of investing at P0, selling at Pt and receiving a cash flow of Dt (e.g. dividends, interest)
• Can be measured over any interval
HPRP P D
Pt t 0
0
Example• Purchased ITT March 5, 2000: $46.00• Sold ITT June 5, 2002: $68.25• Total Dividends: $ 6.00
• HPR = _________%
• Note: This is a 9-quarter return

Average Return (from large to small interval)
• Average Return:
R HPR n 1 11/

ITT Example (contd.)
• What is the average quarterly return?
Ans:_________%
• What is the average annual return?
Ans:_________%
Total Return (from small to large interval)
• Example:
1st year return: +100%2nd year return: -50%
• What is the average annual return?• What is the terminal value of $100 investment
above?
Example shows...
• Simple averages are misleading
• Simple averages do not take into account the effect of compounding
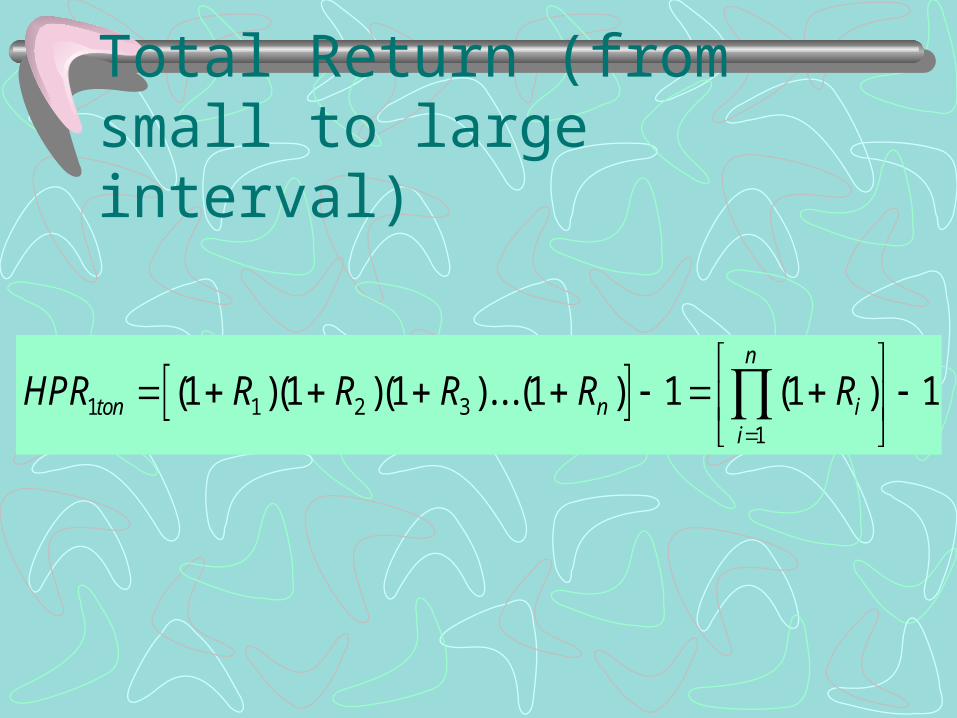
Total Return (from small to large interval)
HPR R R R R Rton n ii
n
1 1 2 31
1 1 1 1 1 1 1
( )( )( )...( ) ( )

VALUE OF PERIOD HPR 1+Ri $100 INVESTMENT
1998 -0.31 0.69 $69.00 1999 0.96 1.96 $135.24 2000 0.19 1.19 $160.94 2001 0.41 1.41 $226.92 2002 0.55 0.45 $102.11
SIMPLE AVG 0.14 = 14%
PRODUCT OF (1+R) 1.0211 = 2.11% HPR OVER
5 YEARS
CMPD AVG ANNUALLY 0.004192 = 0.4% ANNUALLY CMPD AVG QTRLY 0.001046 = 0.1% QUARTERLY CMPD AVG MNTHLY 0.000349 = 0.03% MONTHLY

Capital Budgeting
• A transportation company is considering the replacement of several trucks to reduce down-time, thus providing better on-time delivery service. The existing trucks were purchase three years ago for $75,000 and are depreciated straight-line over their 8-year life to a book value of 15,000. They could be sold today for $35,000. New trucks would cost $100,000, have a five-year life and be depreciated for tax purposes to a $20,000 book value, also using straight-line depreciation. The company forecasts that the new trucks would reduce operating costs by $5,000 per year, in addition, increased customer satisfaction would add $20,000 per year to cash revenues. As long as the new trucks are around, the company must increase its inventory of spare parts which would cost $2,5000. At the end of five years, the new trucks would be sold for $25,000. The appropriate discount rate is 12 percent and the firm is in the 35% tax bracket. Should they invest in the new trucks?

Cash flow calculation
• Only incremental after-tax cash flows matter• Ignore sunk costs, non-cash expenses• Include all opportunity costs• Include tax implication of depreciation• Include inflow/outflow due to change in net
working capital