mazars 2017 food & beverage industry study...
TRANSCRIPT

MAZARS2017 Food & BeverageIndustry Study Results Report
WWW.MAZARSUSA.COMMAZARS USA LLP IS AN INDEPENDENT MEMBER FIRM OF MAZARS GROUP.
2 |
2017 FOOD & BEVERAGE INDUSTRY STUDY REPORT
WWW.MAZARSUSA.COM
The Mazars USA 2017 Food & Beverage Industry Study was developed to seek the views of leaders and decision makers in the food & beverage industry. The survey results found in this report are meant to define industry trends and build a knowledge base of food & beverage challenges, opportunities, and other factors that are critical to shape the future of the food & beverage industry.
The Mazars USA LLP Food & Beverage Industry Study offers benchmarks against which to assess 2016performance, insights into potential drivers for the industry in 2017, and best practices to stay ahead of the competition today and tomorrow. Where applicable, the study separates the responses of small and large firms, affording more nuanced insights into industry trends.
ABOUT THE MAZARS USA FOOD & BEVERAGE INDUSTRY STUDY
Mazars USA provides food and beverage companies with the specialized expertise required toventure further in this dynamic industry environment. The more than 200 leading food and beveragemanufacturers, distributors, restaurants and importers who call us their trusted advisors are a testamentto our deep market knowledge and global capabilities. We give you a competitive edge to maximize results.
Our professionals are involved in, and knowledgeable of, all aspects of the food industry and haveextensive experience in the manufacturing, distribution, retail and marketing areas. We are membersof industry trade associations and frequently attend trade shows and seminars to keep abreast of newproducts and the evolving needs of food industry companies. You will find our clients throughout the supply chain – they include agricultural organizations, processors, packaging, manufacturers, importers, specialty products, ethnic foods, distributors, supermarkets and restaurants.
The Mazars Food & Beverage Group continually develops new solutions and identifies products to bestsatisfy our clients’ needs while adhering to the strict guidelines and regulations for the industry. Ourconsulting services include lean manufacturing, process improvement and recall provisions. We can alsohelp identify opportunities to improve processes and product lines in order to increase inventory turnover,thus improving cash flow and reducing inventory levels and spoilage. We assist clients in identifyingtheir most profitable products and customers, and in developing costing models and analyses that assistmanagement in making effective and timely business decisions.
In addition to our consulting capabilities, we are adept at providing a full array of traditional accounting,tax, financial, and auditing services. We strive to identify opportunities for our clients beyond the financialstatement and tax return. We provide valuation services, management information systems, break-evenand return-on-investment analyses, profit enhancement programs and financing strategies. We are adeptat due diligence and other merger and acquisition services and can assist in strategic planning for futureconsolidation or exit strategies.
ABOUT THE MAZARS USA FOOD & BEVERAGE PRACTICE
3
2017 FOOD & BEVERAGE INDUSTRY STUDY REPORT
WWW.MAZARSUSA.COM |
TABLE OF CONTENTS
Section I: Summary
Section II: Company Outlook
Section III: Company Concerns
Section IV: Company Strategies and Priorities
Section V: Conclusion
4
4
9
11
14
Figure 1: Company Outlook: 2016 – 2017 change Figure 2: Average and Median Growth in Productivity and Costs (2016 – 2017) Figure 3: Company Outlook: Comparisons of Average Growths in 2015, 2016 and 2017Figure 4: Factors Influencing 2017 Sales Growth - Average Ranking Figure 5: Industry Trends Impacting 2017 Sales Increase – All FirmsFigure 6: Ranking of Internal Company Concerns Figure 7: Ranking of External Company Concerns Figure 8: Operations Strategies Planned or Underway – All Firms Figure 9: Investment in New Equipment Based on favorable tax changes – All FirmsFigure 10: Supply Chain Priorities across all Companies Figure 11: Corporate Implementations (Projects implemented or plan to implement) – All Firms
5667891011111213
FIGURES
4 |
2017 FOOD & BEVERAGE INDUSTRY STUDY REPORT
WWW.MAZARSUSA.COM
SECTION I: SUMMARY
2017 was projected to be a modest year of growth for the Food & Beverage industry, with most respondents expecting growth in sales, profit and employment, albeit at a decreased level from 2016. The factors most likely to influence sales growth were new customers, improved sales performance and new products, which remainvirtually unchanged from 2016. The top trends predicted to drive sales growth are private label foods andhealthy/nutritious foods. The top internal concern for participants was increasing sales and the top externalconcerns were food safety/traceability and the new government regulations related to the food safety andmodernization act. A majority of participants (58%) did not expect to increase prices in response to the new FDAmenu labeling requirements.
SECTION II: COMPANY OUTLOOK
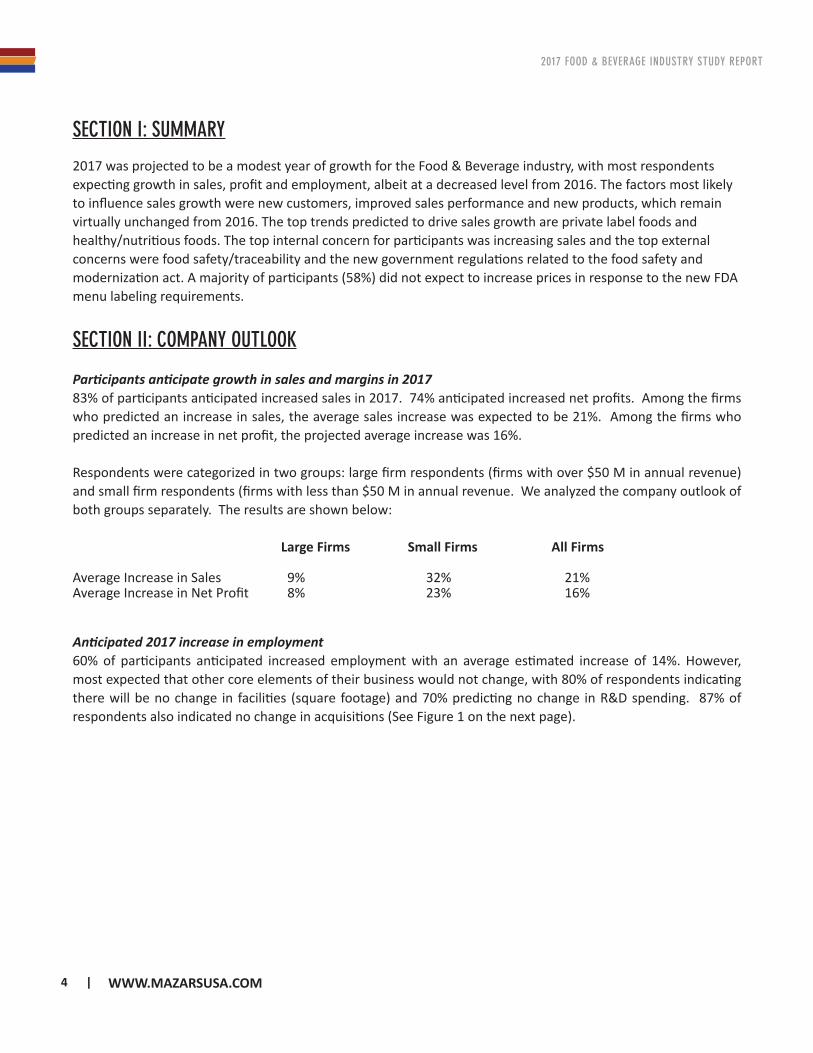
Participants anticipate growth in sales and margins in 201783% of participants anticipated increased sales in 2017. 74% anticipated increased net profits. Among the firms who predicted an increase in sales, the average sales increase was expected to be 21%. Among the firms who predicted an increase in net profit, the projected average increase was 16%.
Respondents were categorized in two groups: large firm respondents (firms with over $50 M in annual revenue) and small firm respondents (firms with less than $50 M in annual revenue. We analyzed the company outlook of both groups separately. The results are shown below:
Large Firms Small Firms All Firms
Average Increase in Sales 9% 32% 21% Average Increase in Net Profit 8% 23% 16%
Anticipated 2017 increase in employment60% of participants anticipated increased employment with an average estimated increase of 14%. However, most expected that other core elements of their business would not change, with 80% of respondents indicating there will be no change in facilities (square footage) and 70% predicting no change in R&D spending. 87% of respondents also indicated no change in acquisitions (See Figure 1 on the next page).
5
2017 FOOD & BEVERAGE INDUSTRY STUDY REPORT
WWW.MAZARSUSA.COM |
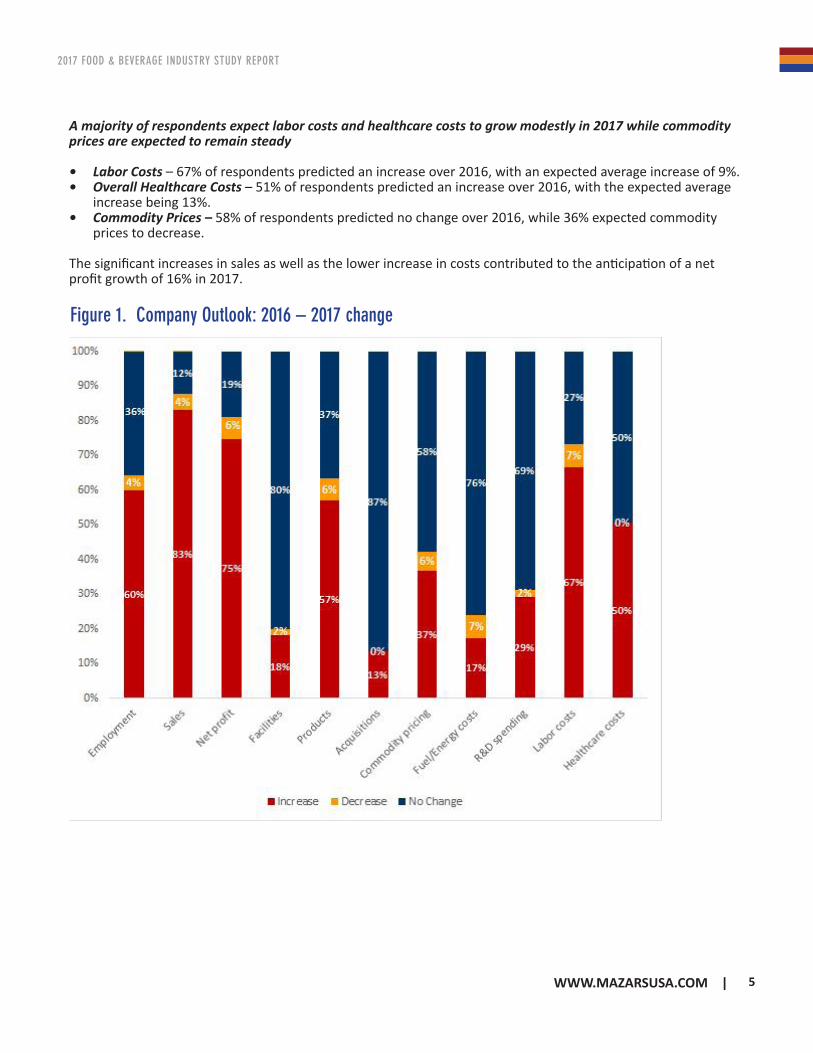
Figure 1. Company Outlook: 2016 – 2017 change
A majority of respondents expect labor costs and healthcare costs to grow modestly in 2017 while commodity prices are expected to remain steady
• Labor Costs – 67% of respondents predicted an increase over 2016, with an expected average increase of 9%.• Overall Healthcare Costs – 51% of respondents predicted an increase over 2016, with the expected average
increase being 13%.• Commodity Prices – 58% of respondents predicted no change over 2016, while 36% expected commodity
prices to decrease.
The significant increases in sales as well as the lower increase in costs contributed to the anticipation of a net profit growth of 16% in 2017.
6 |
2017 FOOD & BEVERAGE INDUSTRY STUDY REPORT
WWW.MAZARSUSA.COM
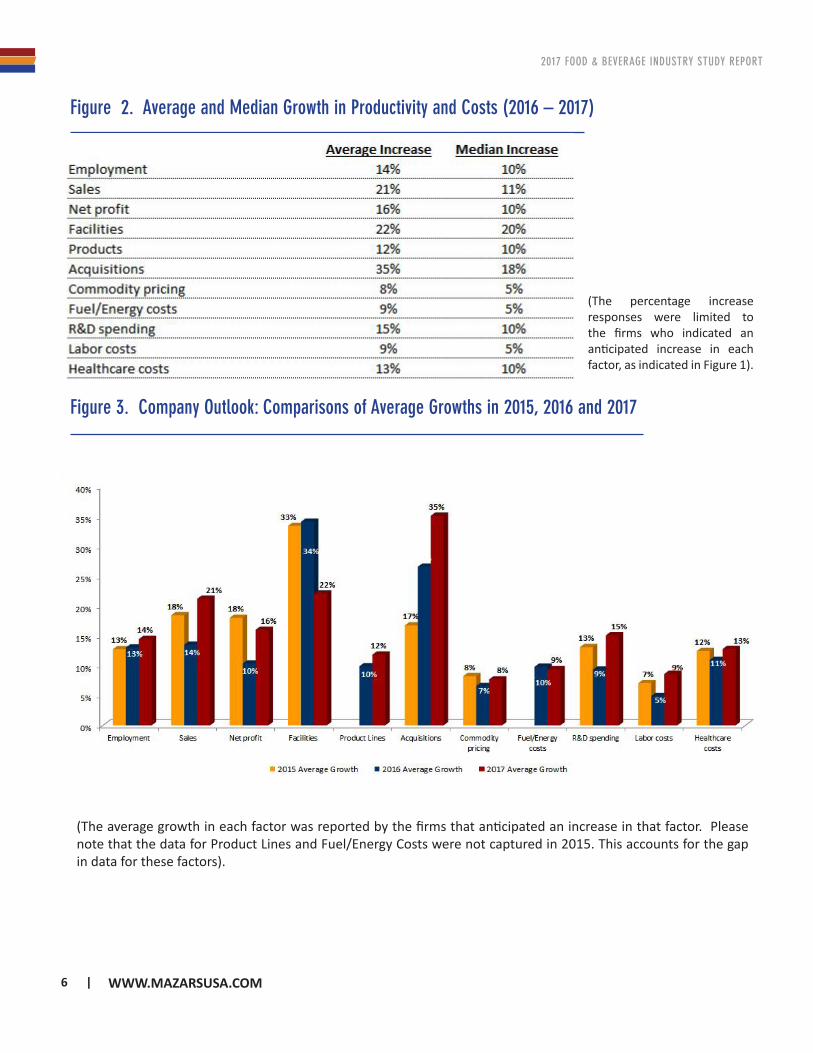
Figure 3. Company Outlook: Comparisons of Average Growths in 2015, 2016 and 2017
(The average growth in each factor was reported by the firms that anticipated an increase in that factor. Please note that the data for Product Lines and Fuel/Energy Costs were not captured in 2015. This accounts for the gap in data for these factors).
Figure 2. Average and Median Growth in Productivity and Costs (2016 – 2017)
(The percentage increase responses were limited to the firms who indicated an anticipated increase in each factor, as indicated in Figure 1).
7
2017 FOOD & BEVERAGE INDUSTRY STUDY REPORT
WWW.MAZARSUSA.COM |
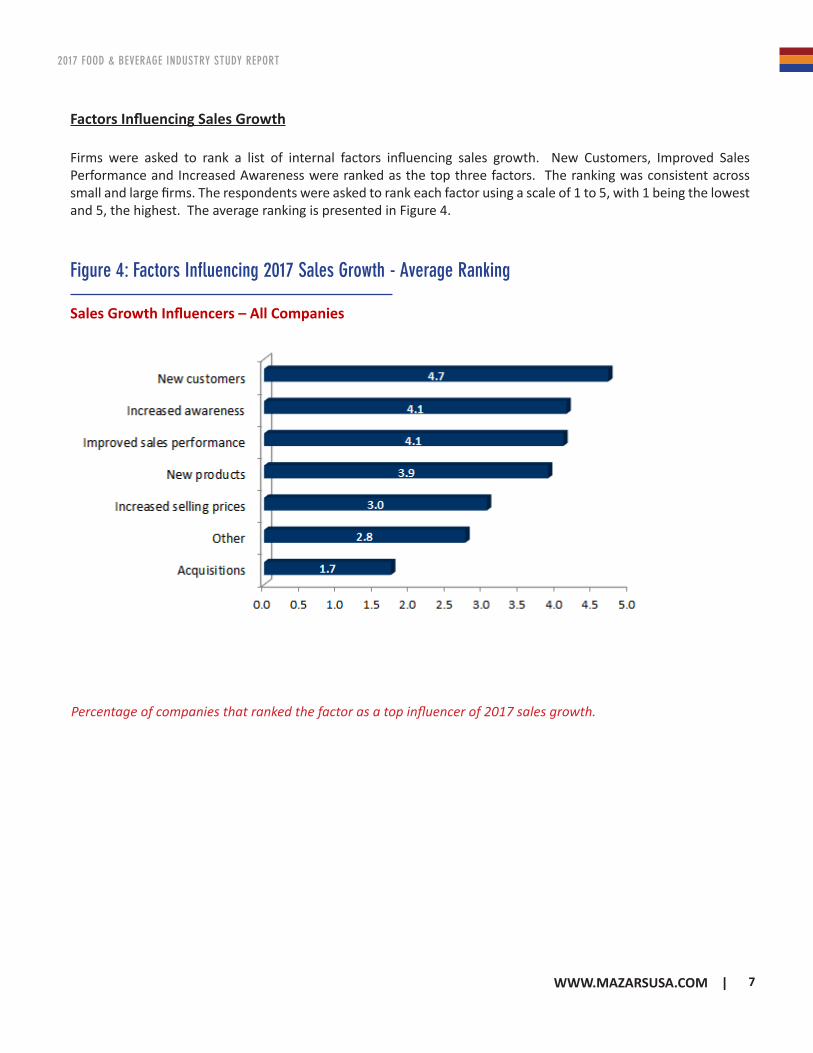
Figure 4: Factors Influencing 2017 Sales Growth - Average Ranking
Firms were asked to rank a list of internal factors influencing sales growth. New Customers, Improved Sales Performance and Increased Awareness were ranked as the top three factors. The ranking was consistent across small and large firms. The respondents were asked to rank each factor using a scale of 1 to 5, with 1 being the lowest and 5, the highest. The average ranking is presented in Figure 4.
Factors Influencing Sales Growth
Percentage of companies that ranked the factor as a top influencer of 2017 sales growth.
Sales Growth Influencers – All Companies
8 |
2017 FOOD & BEVERAGE INDUSTRY STUDY REPORT
WWW.MAZARSUSA.COM
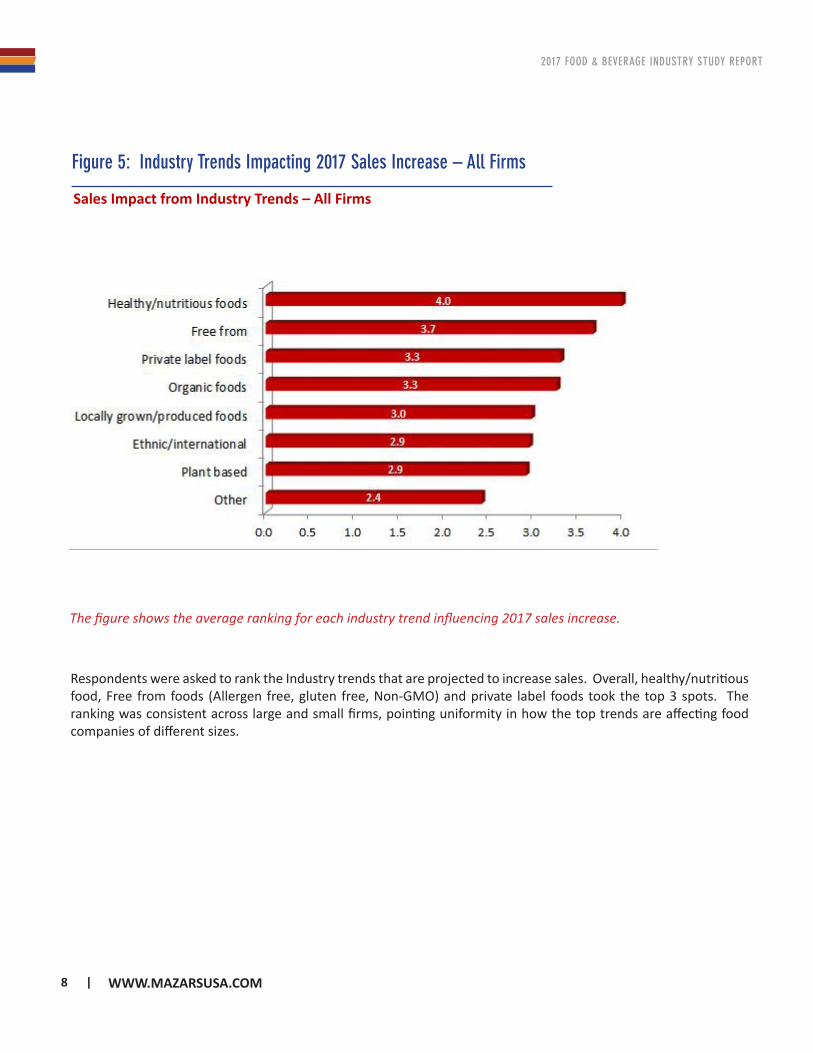
Figure 5: Industry Trends Impacting 2017 Sales Increase – All Firms
The figure shows the average ranking for each industry trend influencing 2017 sales increase.
Sales Impact from Industry Trends – All Firms
Respondents were asked to rank the Industry trends that are projected to increase sales. Overall, healthy/nutritious food, Free from foods (Allergen free, gluten free, Non-GMO) and private label foods took the top 3 spots. The ranking was consistent across large and small firms, pointing uniformity in how the top trends are affecting food companies of different sizes.
9
2017 FOOD & BEVERAGE INDUSTRY STUDY REPORT
WWW.MAZARSUSA.COM |
SECTION III: COMPANY CONCERNS
Internal Concerns
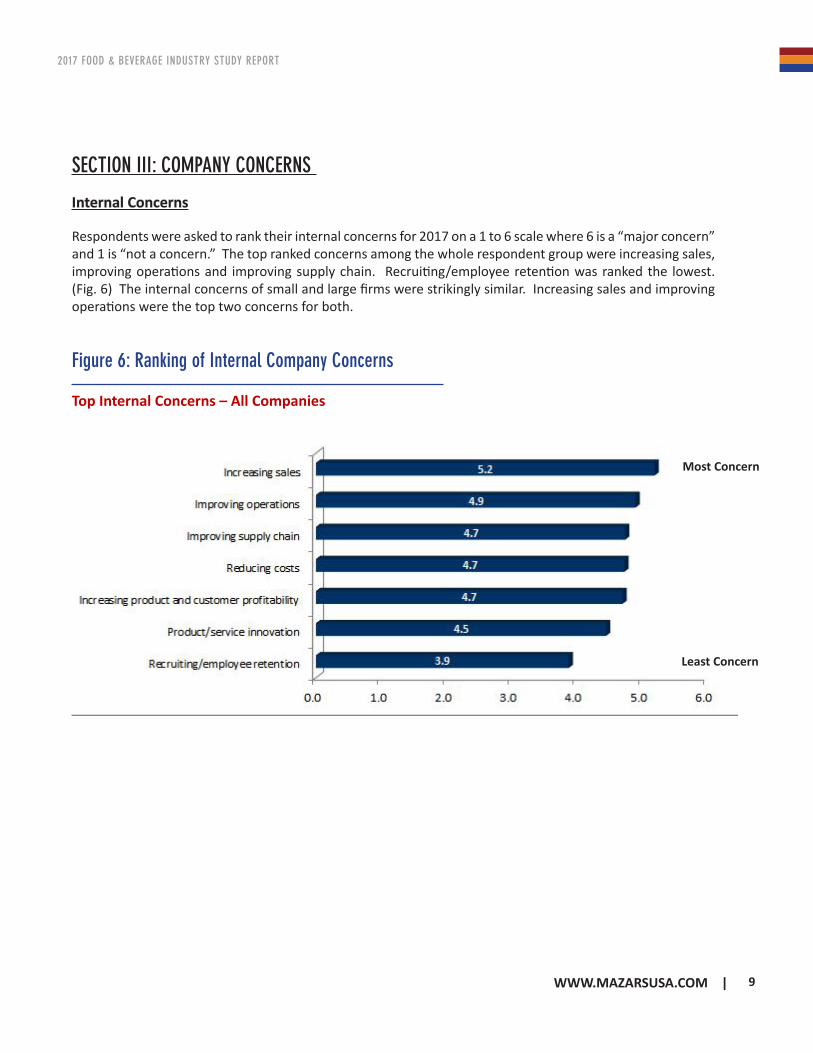
Respondents were asked to rank their internal concerns for 2017 on a 1 to 6 scale where 6 is a “major concern” and 1 is “not a concern.” The top ranked concerns among the whole respondent group were increasing sales, improving operations and improving supply chain. Recruiting/employee retention was ranked the lowest. (Fig. 6) The internal concerns of small and large firms were strikingly similar. Increasing sales and improving operations were the top two concerns for both.
Figure 6: Ranking of Internal Company Concerns
Top Internal Concerns – All Companies
Most Concern
Least Concern
10 |
2017 FOOD & BEVERAGE INDUSTRY STUDY REPORT
WWW.MAZARSUSA.COM
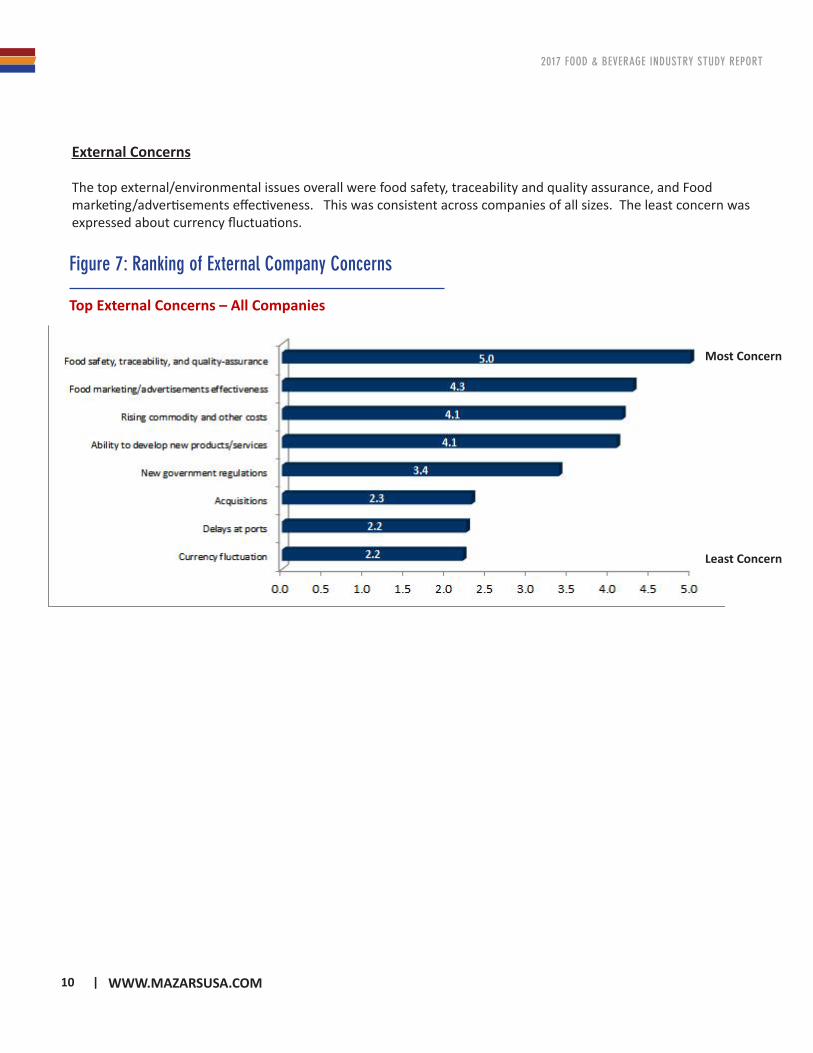
Figure 7: Ranking of External Company Concerns
Top External Concerns – All Companies
Most Concern
Least Concern
External Concerns
The top external/environmental issues overall were food safety, traceability and quality assurance, and Food marketing/advertisements effectiveness. This was consistent across companies of all sizes. The least concern was expressed about currency fluctuations.
11
2017 FOOD & BEVERAGE INDUSTRY STUDY REPORT
WWW.MAZARSUSA.COM |
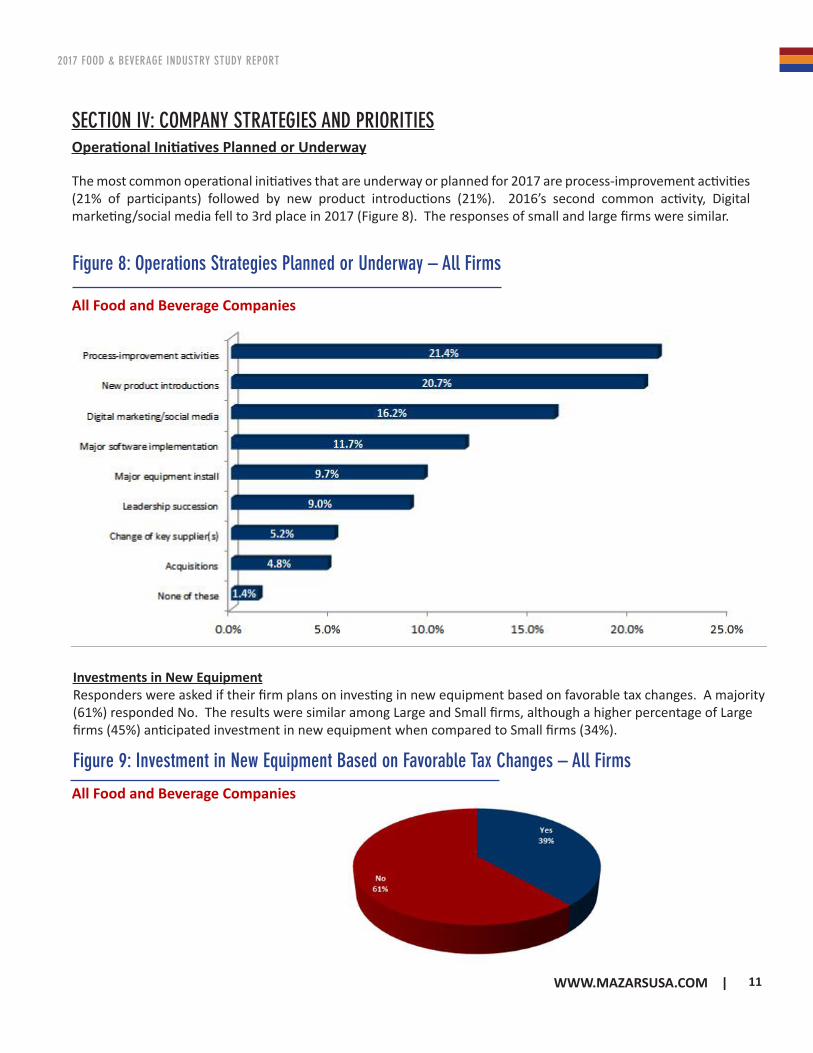
SECTION IV: COMPANY STRATEGIES AND PRIORITIESOperational Initiatives Planned or Underway
The most common operational initiatives that are underway or planned for 2017 are process-improvement activities (21% of participants) followed by new product introductions (21%). 2016’s second common activity, Digital marketing/social media fell to 3rd place in 2017 (Figure 8). The responses of small and large firms were similar.
Figure 8: Operations Strategies Planned or Underway – All Firms
All Food and Beverage Companies
Figure 9: Investment in New Equipment Based on Favorable Tax Changes – All Firms
All Food and Beverage Companies
Investments in New EquipmentResponders were asked if their firm plans on investing in new equipment based on favorable tax changes. A majority (61%) responded No. The results were similar among Large and Small firms, although a higher percentage of Large firms (45%) anticipated investment in new equipment when compared to Small firms (34%).
12 |
2017 FOOD & BEVERAGE INDUSTRY STUDY REPORT
WWW.MAZARSUSA.COM
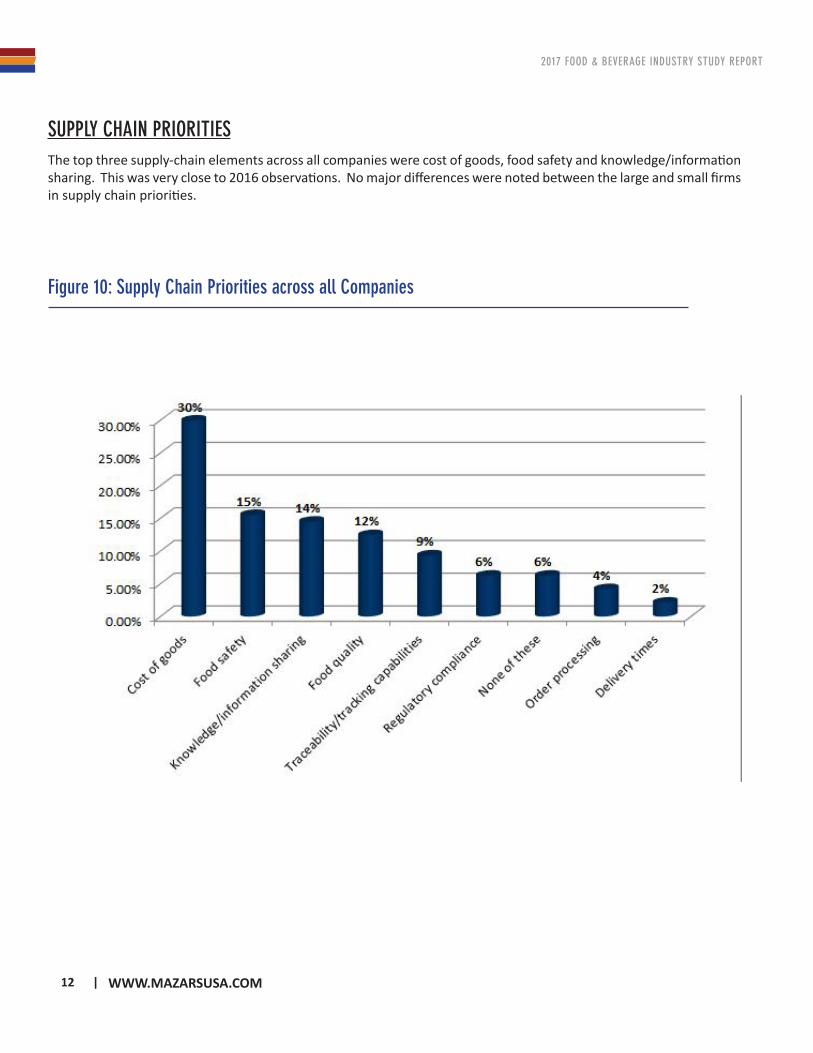
SUPPLY CHAIN PRIORITIESThe top three supply-chain elements across all companies were cost of goods, food safety and knowledge/information sharing. This was very close to 2016 observations. No major differences were noted between the large and small firms in supply chain priorities.
Figure 10: Supply Chain Priorities across all Companies

13
2017 FOOD & BEVERAGE INDUSTRY STUDY REPORT
WWW.MAZARSUSA.COM |
PROJECT IMPLEMENTATIONSFood & Beverage companies were asked to identify the implementation state of various projects that can impact their bottom lines. The most common projects are compliance procedures for labeling laws and succession plans - 24% and 18% respectively have already implemented or plan to implement these projects. Last year, compliance procedured for labeling laws and succession plans took the top two spots with 21% and 16% respectively of respondents indicating that they have implemented or planned to implement. Respondents were least likely to be planning to implement Interest Charge Domestic International Sales Corporation or to make use of a micro-captive insurance company (only 3% implemented or plan to implement).
Figure 11. Corporate Implementations (Projects implemented or plan to implement) – All Firms
14 |
2017 FOOD & BEVERAGE INDUSTRY STUDY REPORT
WWW.MAZARSUSA.COM
SECTION V: CONCLUSIONThe dynamic nature of the U.S. Food & Beverage industry — changing consumer trends, proposed government regulations, new companies, and new product and service offerings — challenges organizations to remain competitive. The responses we received shed light on some of the opportunities and challenges facing the industry in 2017 and beyond. The majority of the industry expects sales to increase substantially, with a relatively modest increase in costs. This is leading to forecasts of a profitable year. Process improvement activities are taking center stage and the industry is responding to new government regulations through investments to comply with the new labeling laws. Digital marketing and social media continue to be a main focus through 2017.

15
2017 FOOD & BEVERAGE INDUSTRY STUDY REPORT
WWW.MAZARSUSA.COM |
Profile of Food & Beverage Industry Study Participants
• Industry: The majority of participants were wholesalers/distributors and manufacturers.• Sales: Study participants represented a range of annual sales volumes — 55% had sales of $50 million
and less with 22% of respondents having sales of less than a million. 45% had sales of more than $50 million, with 9% reporting sales of more than $500 million.
• Employees: 52% of participants reported fewer than 100 employees, while 12% reported more than 1,000.
• Ownership: 78% of participants described their ownership structures as private, with 10% being private equity. 6% of respondents were public companies.
Food & Beverage Industry Study Methodology
Mazars USA, conducted the 2017 Food & Beverage Industry Study, coordinated by iLumen, an independent research firm, through an online questionnaire. Responses were received from February through April 2017, entered into a database, edited, and cleansed to ensure answers were plausible, where necessary.
All responses to the survey are confidential. Participants who provided contact information were offered specialized industry insights based on the study, along with other work of the study sponsors.
Only study sponsors and iLumen have access to participants’ individual responses. Study findings are only published based on the overall sample or aggregated groups of participants.
2017 Food & Beverage Industry Study participants reported the following:
Louis Biscotti Partner - Global Food & Beverage Practice LeaderMazars USA LLPDirect line: 516.282.7201 E-mail: [email protected]
CONTACT
THANK YOU TO:
WWW.MAZARSUSA.COM