may 2015 | inland empire real estate market update
DESCRIPTION
Riverside and San Bernardino County real estate market data, The Inland Empire real estate report has city specific data for each area in the IE.TRANSCRIPT

MAY 2015

Inland Empire Market Report MAY 2015
Riverside County San Bernardino County
Banning La Quinta Adelanto Ontario
Beaumont Lake Elsinore Apple Valley Rancho Cucamonga
Blythe Menifee Barstow Redlands
Calimesa Moreno Valley Chino Rialto
Canyon Lake Murrieta Chino Hills San Bernardino (city)
Cathedral City Norco Colton Upland
Corona Palm Desert Fontana Victorville
Coachella Palm Springs Grand Terrace Yucaipa
Desert Hot Springs Perris Hesperia Yucca Valley
Eastvale Rancho Mirage Highland
Hemet Riverside (city) Loma Linda
Indian Wells San Jacinto Montclair
Indio Temecula
Jurupa Valley Wildomar
TABLE OF CONTENTS
All reports presented within this document are based on data supplied by the CARETS (CLAW, CRISNet MLS, DAMLS, CRMLS, i-‐Tech MLS, and/or VCRDS) or their MLSs. Neither the AssociaGons nor their MLSs guarantee or are in anyway responsible for their accuracy. Data maintained by the AssociaGons or their MLSs may not reflect all real estate acGviGes in the market. InformaGon deemed reliable but not guaranteed.
Inland Empire Market Report | MAY 2015
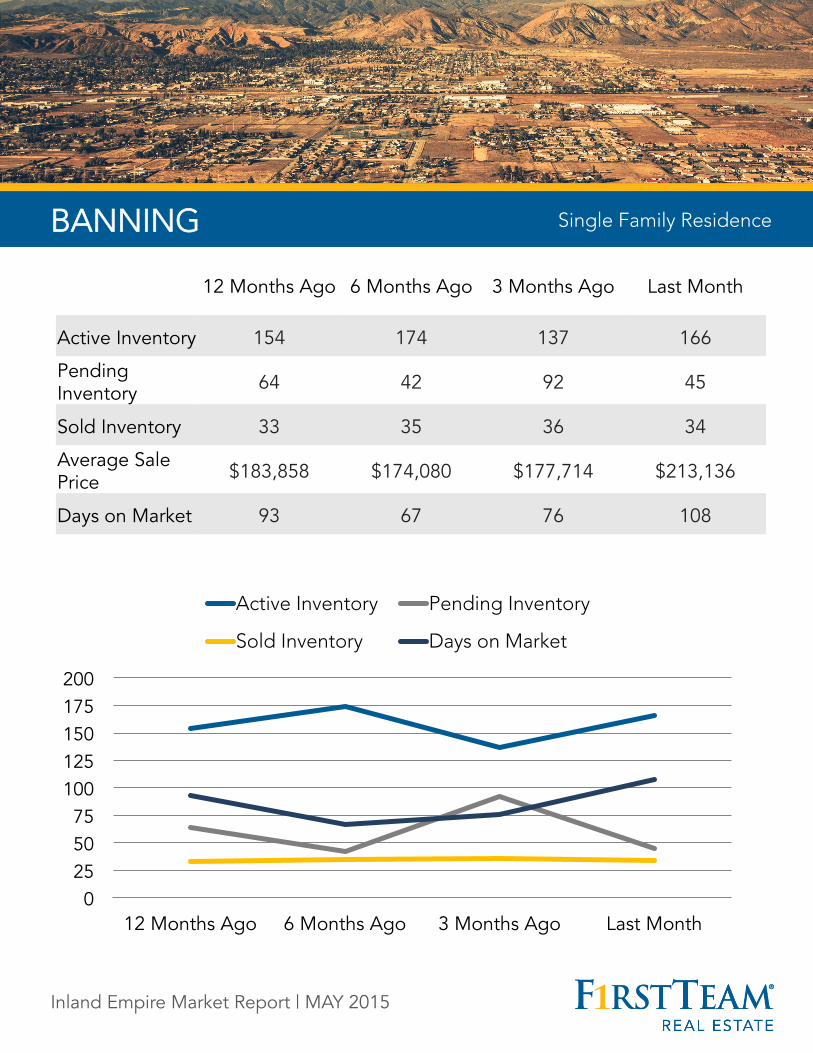
BANNING Single Family Residence
BANNING
0 25 50 75
100 125 150 175 200
12 Months Ago 6 Months Ago 3 Months Ago Last Month
Active Inventory Pending Inventory
Sold Inventory Days on Market
Single Family Residence
12 Months Ago 6 Months Ago 3 Months Ago Last Month
Active Inventory 154 174 137 166
Pending Inventory 64 42 92 45
Sold Inventory 33 35 36 34
Average Sale Price $183,858 $174,080 $177,714 $213,136
Days on Market 93 67 76 108
Inland Empire Market Report | MAY 2015

BEAUMONT
View homes for sale in Aliso Viejo >>
0
50
100
150
200
250
300
12 Months Ago 6 Months Ago 3 Months Ago Last Month
Active Inventory Pending Inventory
Sold Inventory Days on Market
Single Family Residence BEAUMONT
12 Months Ago 6 Months Ago 3 Months Ago Last Month
Active Inventory 238 219 220 270
Pending Inventory 117 79 123 97
Sold Inventory 64 71 73 52
Average Sale Price $270,890 $265,250 $261,640 $267,858
Days on Market 68 65 114 70
Inland Empire Market Report | MAY 2015
BLYTHE
View homes for sale in Aliso Viejo >>
0 20 40 60 80
100 120 140 160
12 Months Ago 6 Months Ago 3 Months Ago Last Month
Active Inventory Pending Inventory
Sold Inventory Days on Market
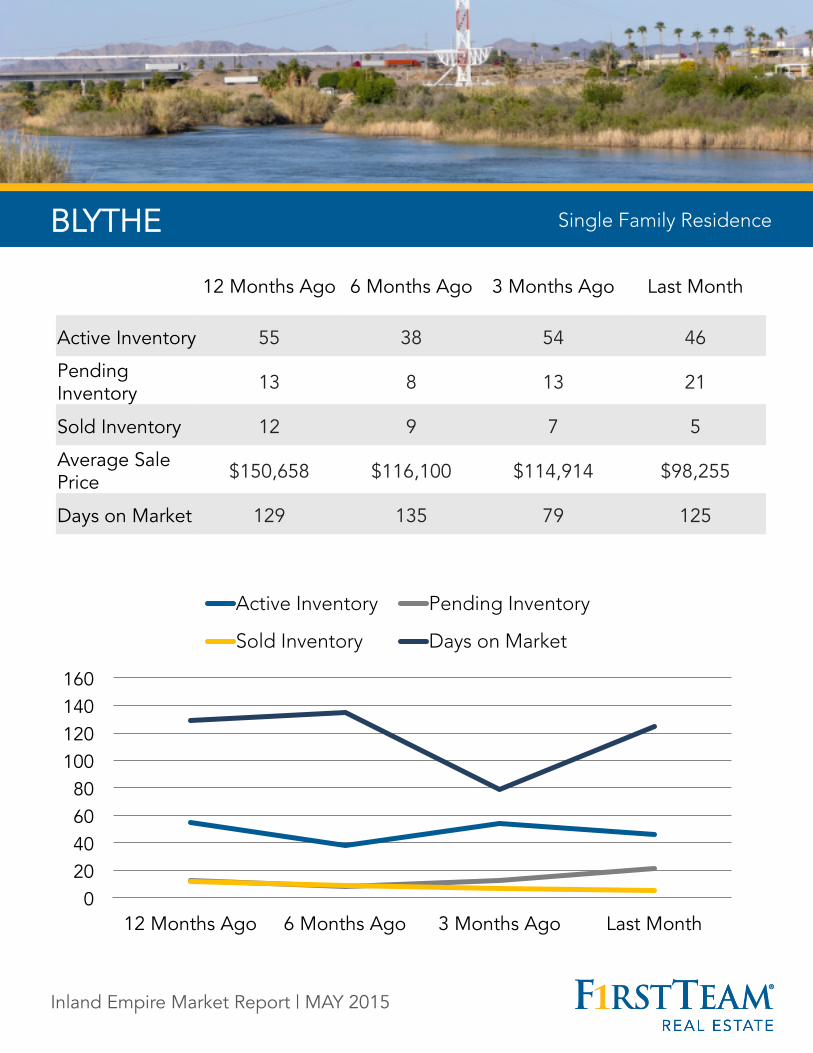
BLYTHE Single Family Residence
12 Months Ago 6 Months Ago 3 Months Ago Last Month
Active Inventory 55 38 54 46
Pending Inventory 13 8 13 21
Sold Inventory 12 9 7 5
Average Sale Price $150,658 $116,100 $114,914 $98,255
Days on Market 129 135 79 125
Inland Empire Market Report | MAY 2015
CALIMESA
0 20 40 60 80
100 120 140 160
12 Months Ago 6 Months Ago 3 Months Ago Last Month
Active Inventory Pending Inventory
Sold Inventory Days on Market
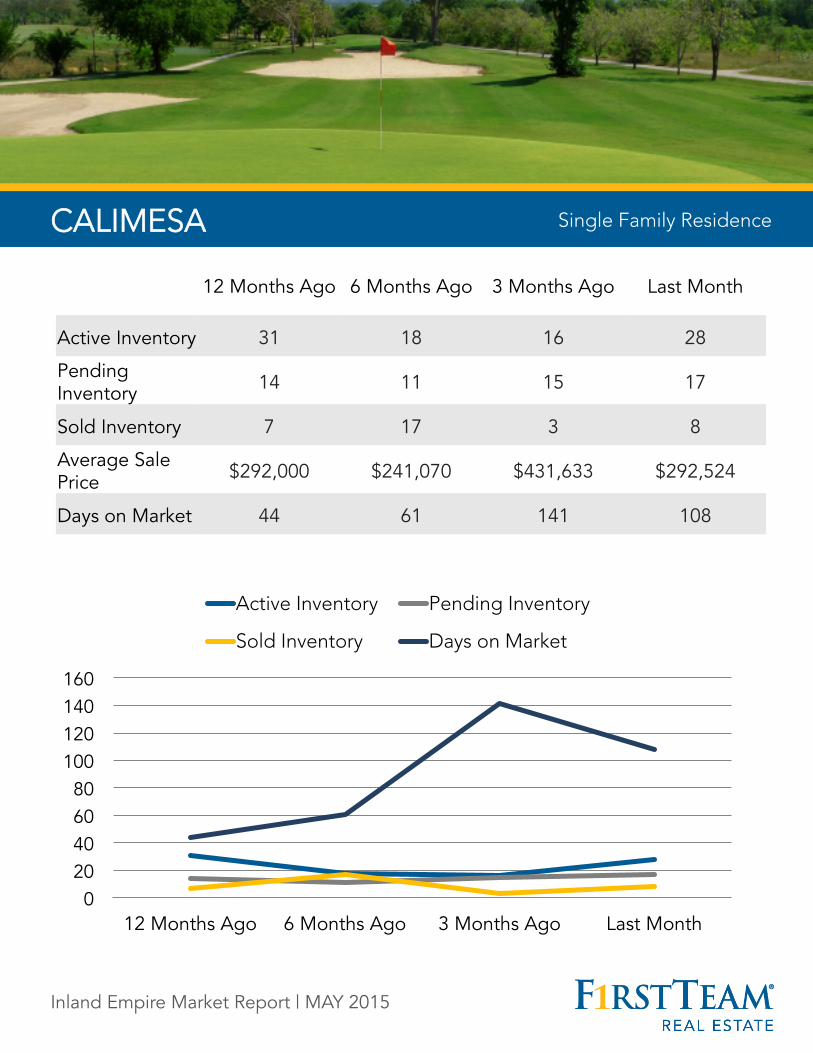
CALIMESA Single Family Residence
12 Months Ago 6 Months Ago 3 Months Ago Last Month
Active Inventory 31 18 16 28
Pending Inventory 14 11 15 17
Sold Inventory 7 17 3 8
Average Sale Price $292,000 $241,070 $431,633 $292,524
Days on Market 44 61 141 108
Inland Empire Market Report | MAY 2015

CANYON LAKE
0 25 50 75
100 125 150 175 200
12 Months Ago 6 Months Ago 3 Months Ago Last Month
Active Inventory Pending Inventory
Sold Inventory Days on Market
CANYON LAKE Single Family Residence
12 Months Ago 6 Months Ago 3 Months Ago Last Month
Active Inventory 165 141 128 179
Pending Inventory 34 22 47 26
Sold Inventory 28 22 24 13
Average Sale Price $367,196 $379,909 $355,613 $411,915
Days on Market 77 139 106 88
Inland Empire Market Report | MAY 2015

CATHEDRAL CITY
0
45
90
135
180
225
270
315
12 Months Ago 6 Months Ago 3 Months Ago Last Month
Active Inventory Pending Inventory
Sold Inventory Days on Market
Single Family Residence CATHEDRAL CITY Single Family Residence
12 Months Ago 6 Months Ago 3 Months Ago Last Month
Active Inventory 202 258 247 217
Pending Inventory 56 55 71 56
Sold Inventory 64 43 58 53
Average Sale Price $247,808 $270,882 $275,992 $275,309
Days on Market 90 86 85 92
Inland Empire Market Report | MAY 2015
CORONA
0 100 200 300 400 500 600 700 800 900
12 Months Ago 6 Months Ago 3 Months Ago Last Month
Active Inventory Pending Inventory
Sold Inventory Days on Market
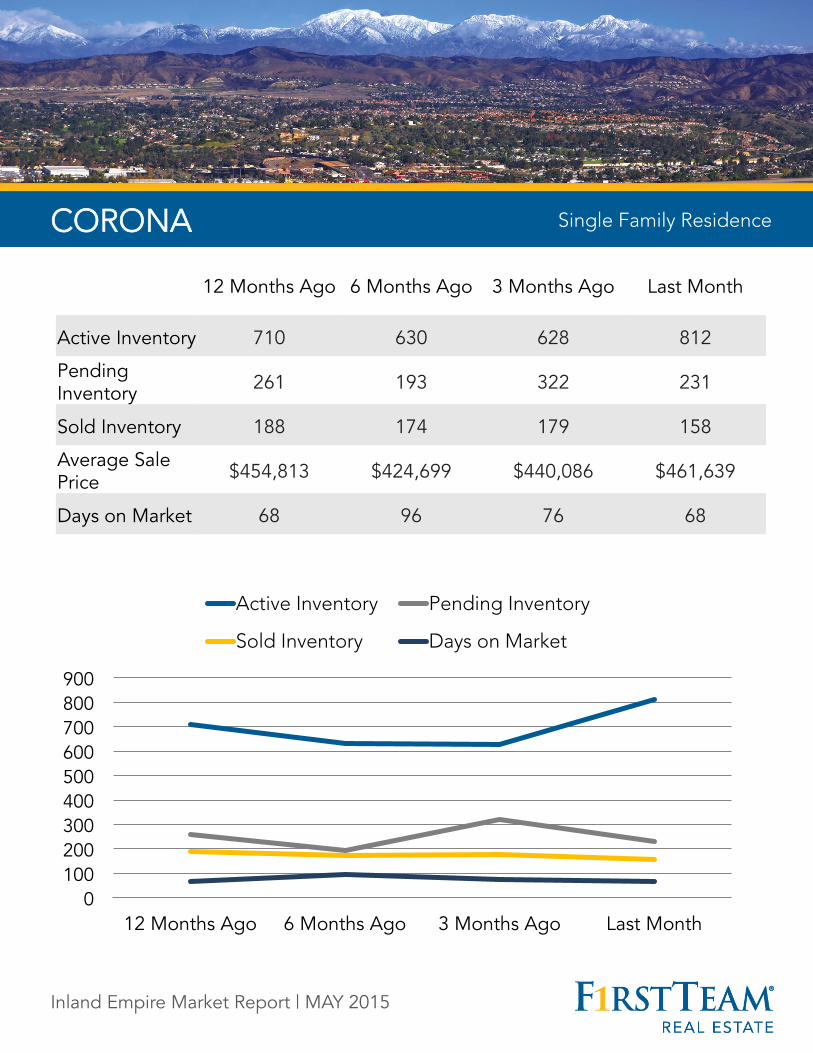
CORONA Single Family Residence
12 Months Ago 6 Months Ago 3 Months Ago Last Month
Active Inventory 710 630 628 812
Pending Inventory 261 193 322 231
Sold Inventory 188 174 179 158
Average Sale Price $454,813 $424,699 $440,086 $461,639
Days on Market 68 96 76 68
Inland Empire Market Report | MAY 2015

COACHELLA
0 20 40 60 80
100 120 140 160
12 Months Ago 6 Months Ago 3 Months Ago Last Month
Active Inventory Pending Inventory
Sold Inventory Days on Market
Single Family Residence COACHELLA Single Family Residence
12 Months Ago 6 Months Ago 3 Months Ago Last Month
Active Inventory 53 51 62 60
Pending Inventory 30 17 21 28
Sold Inventory 10 12 12 10
Average Sale Price $218,800 $200,775 $192,908 $182,299
Days on Market 53 140 93 90
Inland Empire Market Report | MAY 2015

DESERT HOT SPRINGS
0 45 90
135 180 225 270 315 360
12 Months Ago 6 Months Ago 3 Months Ago Last Month
Active Inventory Pending Inventory
Sold Inventory Days on Market
DESERT HOT SPRINGS Single Family Residence
12 Months Ago 6 Months Ago 3 Months Ago Last Month
Active Inventory 232 281 312 292
Pending Inventory 69 40 60 59
Sold Inventory 51 41 42 40
Average Sale Price $153,317 $158,331 $152,694 $160,785
Days on Market 63 79 113 101
Inland Empire Market Report | MAY 2015

EASTVALE
0
40
80
120
160
200
240
280
12 Months Ago 6 Months Ago 3 Months Ago Last Month
Active Inventory Pending Inventory
Sold Inventory Days on Market
Single Family Residence EASTVALE Single Family Residence
12 Months Ago 6 Months Ago 3 Months Ago Last Month
Active Inventory 211 166 166 231
Pending Inventory 76 59 77 49
Sold Inventory 61 52 62 44
Average Sale Price $488,810 $486,480 $491,899 $479,823
Days on Market 78 88 68 54
Inland Empire Market Report | MAY 2015

HEMET
0
100
200
300
400
500
600
700
12 Months Ago 6 Months Ago 3 Months Ago Last Month
Active Inventory Pending Inventory
Sold Inventory Days on Market
Single Family Residence HEMET Single Family Residence
12 Months Ago 6 Months Ago 3 Months Ago Last Month
Active Inventory 601 597 511 537
Pending Inventory 204 179 269 254
Sold Inventory 161 170 153 132
Average Sale Price $188,173 $198,416 $195,084 $196,231
Days on Market 108 74 89 84
Inland Empire Market Report | MAY 2015

INDIAN WELLS
0
45
90
135
180
225
270
315
12 Months Ago 6 Months Ago 3 Months Ago Last Month
Active Inventory Pending Inventory
Sold Inventory Days on Market
Single Family Residence INDIAN WELLS Single Family Residence
12 Months Ago 6 Months Ago 3 Months Ago Last Month
Active Inventory 141 192 258 215
Pending Inventory 17 6 10 15
Sold Inventory 23 10 22 20
Average Sale Price $957,370 $1,413,167 $957,977 $913,545
Days on Market 175 136 169 175
Inland Empire Market Report | MAY 2015

INDIO
0
100
200
300
400
500
600
700
12 Months Ago 6 Months Ago 3 Months Ago Last Month
Active Inventory Pending Inventory
Sold Inventory Days on Market
Single Family Residence INDIO Single Family Residence
12 Months Ago 6 Months Ago 3 Months Ago Last Month
Active Inventory 470 566 632 535
Pending Inventory 100 70 115 100
Sold Inventory 95 72 126 109
Average Sale Price $268,890 $281,133 $316,310 $297,835
Days on Market 72 93 98 143
Inland Empire Market Report | MAY 2015

JURUPA VALLEY
0 15 30 45 60 75 90
105 120
12 Months Ago 6 Months Ago 3 Months Ago Last Month
Active Inventory Pending Inventory
Sold Inventory Days on Market
Single Family Residence JURUPA VALLEY Single Family Residence
12 Months Ago 6 Months Ago 3 Months Ago Last Month
Active Inventory 73 83 103 111
Pending Inventory 40 34 43 38
Sold Inventory 27 22 23 26
Average Sale Price $326,996 $284,873 $332,041 $325,050
Days on Market 46 51 60 50
Inland Empire Market Report | MAY 2015

LA QUINTA
0 110 220 330 440 550 660 770 880 990
12 Months Ago 6 Months Ago 3 Months Ago Last Month
Active Inventory Pending Inventory
Sold Inventory Days on Market
Single Family Residence LA QUINTA Single Family Residence
12 Months Ago 6 Months Ago 3 Months Ago Last Month
Active Inventory 673 747 939 859
Pending Inventory 77 67 106 84
Sold Inventory 100 75 113 101
Average Sale Price $511,280 $562,636 $722,988 $632,880
Days on Market 99 100 150 133
Inland Empire Market Report | MAY 2015

LAKE ELSINORE
0 50
100 150 200 250 300 350 400 450
12 Months Ago 6 Months Ago 3 Months Ago Last Month
Active Inventory Pending Inventory
Sold Inventory Days on Market
Single Family Residence LAKE ELSINORE Single Family Residence
12 Months Ago 6 Months Ago 3 Months Ago Last Month
Active Inventory 391 343 314 384
Pending Inventory 185 106 181 137
Sold Inventory 90 102 105 71
Average Sale Price $270,344 $289,544 $280,868 $289,707
Days on Market 63 88 60 86
Inland Empire Market Report | MAY 2015
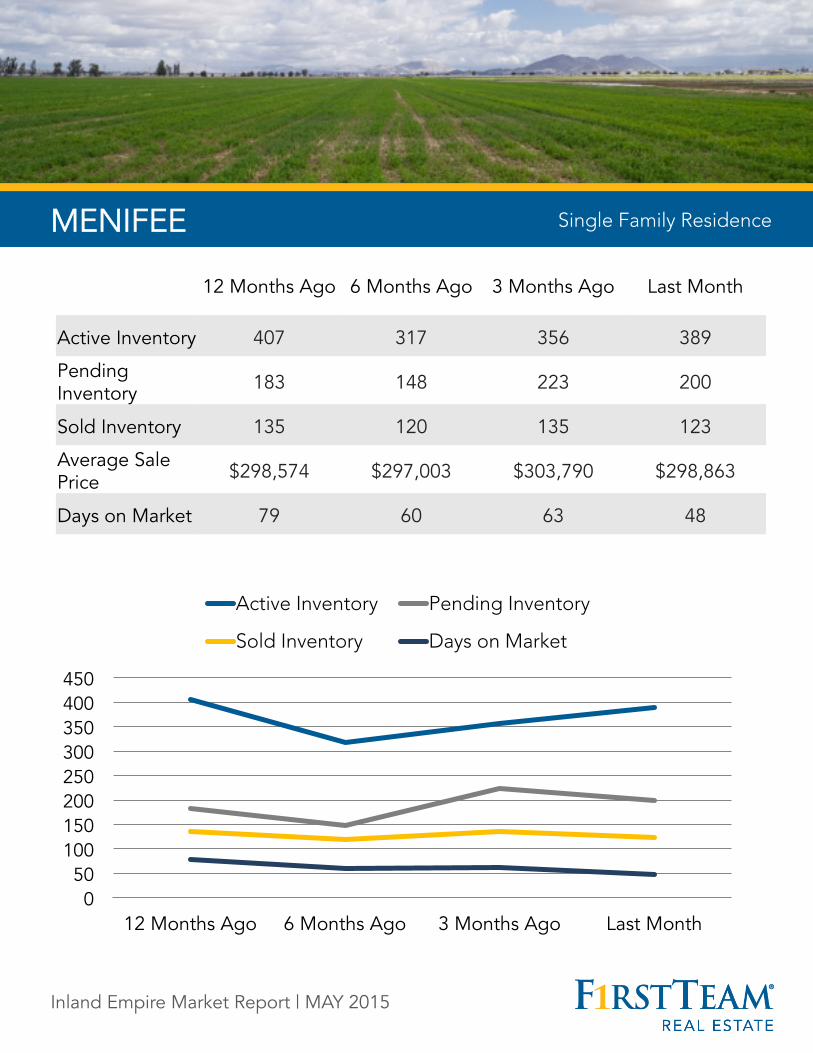
MENIFEE
0 50
100 150 200 250 300 350 400 450
12 Months Ago 6 Months Ago 3 Months Ago Last Month
Active Inventory Pending Inventory
Sold Inventory Days on Market
Single Family Residence MENIFEE Single Family Residence
12 Months Ago 6 Months Ago 3 Months Ago Last Month
Active Inventory 407 317 356 389
Pending Inventory 183 148 223 200
Sold Inventory 135 120 135 123
Average Sale Price $298,574 $297,003 $303,790 $298,863
Days on Market 79 60 63 48
Inland Empire Market Report | MAY 2015
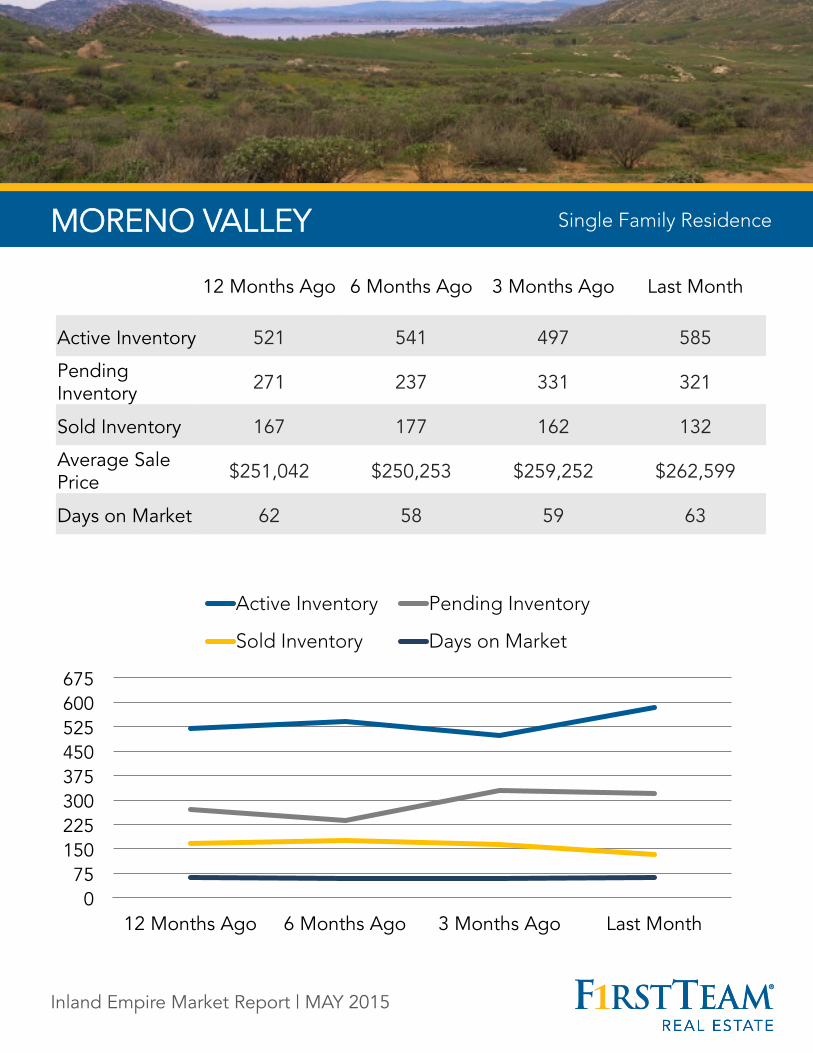
MORENO VALLEY
0 75
150 225 300 375 450 525 600 675
12 Months Ago 6 Months Ago 3 Months Ago Last Month
Active Inventory Pending Inventory
Sold Inventory Days on Market
Single Family Residence MORENO VALLEY Single Family Residence
12 Months Ago 6 Months Ago 3 Months Ago Last Month
Active Inventory 521 541 497 585
Pending Inventory 271 237 331 321
Sold Inventory 167 177 162 132
Average Sale Price $251,042 $250,253 $259,252 $262,599
Days on Market 62 58 59 63
Inland Empire Market Report | MAY 2015

MURRIETA
0 100 200 300 400 500 600 700 800
12 Months Ago 6 Months Ago 3 Months Ago Last Month
Active Inventory Pending Inventory
Sold Inventory Days on Market
Single Family Residence MURRIETA Single Family Residence
12 Months Ago 6 Months Ago 3 Months Ago Last Month
Active Inventory 721 609 546 668
Pending Inventory 246 190 298 259
Sold Inventory 196 153 184 158
Average Sale Price $367,424 $394,327 $363,205 $357,246
Days on Market 106 138 118 61
Inland Empire Market Report | MAY 2015

NORCO
0
20
40
60
80
100
120
140
12 Months Ago 6 Months Ago 3 Months Ago Last Month
Active Inventory Pending Inventory
Sold Inventory Days on Market
Single Family Residence NORCO Single Family Residence
12 Months Ago 6 Months Ago 3 Months Ago Last Month
Active Inventory 86 93 103 130
Pending Inventory 30 23 40 30
Sold Inventory 23 29 24 24
Average Sale Price $452,124 $547,247 $489,763 $484,033
Days on Market 73 104 115 58
Inland Empire Market Report | MAY 2015

PALM DESERT
0 100 200 300 400 500 600 700 800
12 Months Ago 6 Months Ago 3 Months Ago Last Month
Active Inventory Pending Inventory
Sold Inventory Days on Market
Single Family Residence PALM DESERT Single Family Residence
12 Months Ago 6 Months Ago 3 Months Ago Last Month
Active Inventory 456 603 724 620
Pending Inventory 57 56 78 56
Sold Inventory 85 84 91 98
Average Sale Price $605,044 $436,731 $458,333 $539,299
Days on Market 124 90 131 132
Inland Empire Market Report | MAY 2015

PALM SPRINGS
0 75
150 225 300 375 450 525 600
12 Months Ago 6 Months Ago 3 Months Ago Last Month
Active Inventory Pending Inventory
Sold Inventory Days on Market
Single Family Residence PALM SPRINGS Single Family Residence
12 Months Ago 6 Months Ago 3 Months Ago Last Month
Active Inventory 353 421 537 487
Pending Inventory 90 64 132 76
Sold Inventory 85 78 95 101
Average Sale Price $529,833 $617,455 $581,352 $667,721
Days on Market 94 84 101 133
Inland Empire Market Report | MAY 2015
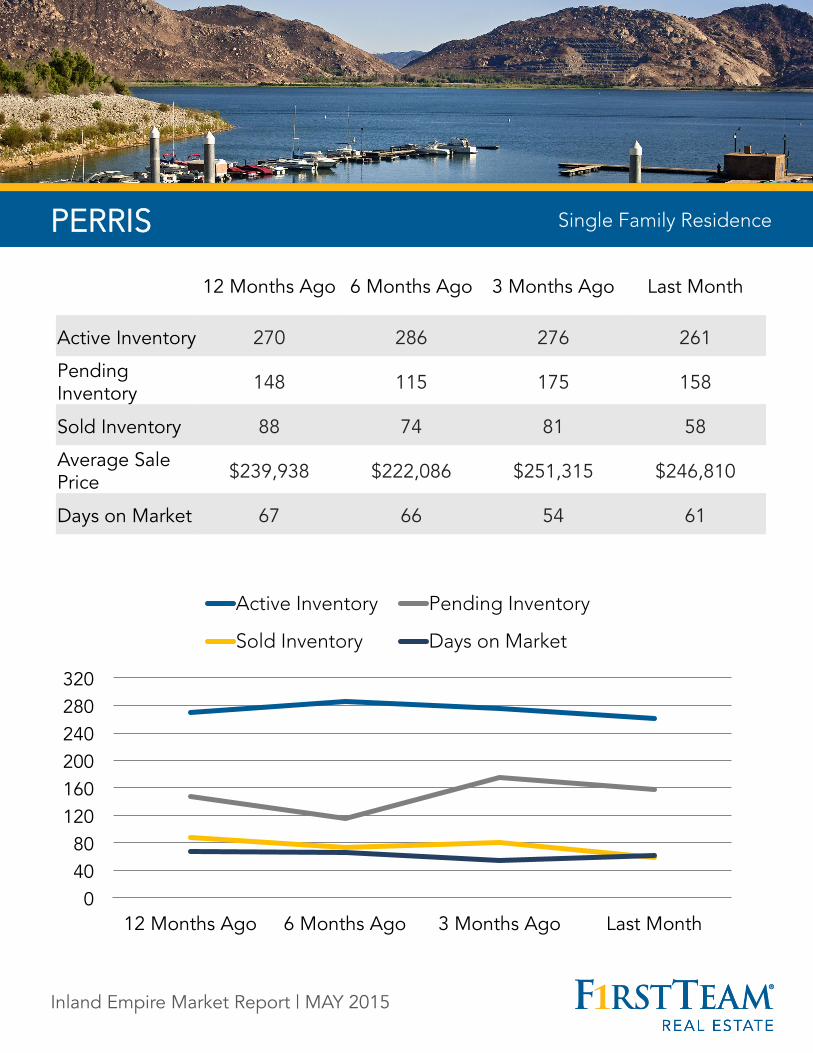
PERRIS
0 40 80
120 160 200 240 280 320
12 Months Ago 6 Months Ago 3 Months Ago Last Month
Active Inventory Pending Inventory
Sold Inventory Days on Market
Single Family Residence PERRIS Single Family Residence
12 Months Ago 6 Months Ago 3 Months Ago Last Month
Active Inventory 270 286 276 261
Pending Inventory 148 115 175 158
Sold Inventory 88 74 81 58
Average Sale Price $239,938 $222,086 $251,315 $246,810
Days on Market 67 66 54 61
Inland Empire Market Report | MAY 2015

RANCHO MIRAGE
0
75
150
225
300
375
450
525
12 Months Ago 6 Months Ago 3 Months Ago Last Month
Active Inventory Pending Inventory
Sold Inventory Days on Market
Single Family Residence RANCHO MIRAGE Single Family Residence
12 Months Ago 6 Months Ago 3 Months Ago Last Month
Active Inventory 304 358 468 404
Pending Inventory 39 26 36 35
Sold Inventory 34 35 41 35
Average Sale Price $662,273 $733,948 $879,658 $1,021,640
Days on Market 118 224 144 158
Inland Empire Market Report | MAY 2015

RIVERSIDE (city)
0 150 300 450 600 750 900
1050 1200
12 Months Ago 6 Months Ago 3 Months Ago Last Month
Active Inventory Pending Inventory
Sold Inventory Days on Market
Single Family Residence RIVERSIDE (city) Single Family Residence
12 Months Ago 6 Months Ago 3 Months Ago Last Month
Active Inventory 907 890 859 1085
Pending Inventory 447 322 463 389
Sold Inventory 313 251 289 212
Average Sale Price $334,708 $343,481 $354,196 $340,269
Days on Market 76 72 93 97
Inland Empire Market Report | MAY 2015

SAN JACINTO
0
35
70
105
140
175
210
245
12 Months Ago 6 Months Ago 3 Months Ago Last Month
Active Inventory Pending Inventory
Sold Inventory Days on Market
Single Family Residence SAN JACINTO Single Family Residence
12 Months Ago 6 Months Ago 3 Months Ago Last Month
Active Inventory 207 224 193 214
Pending Inventory 94 77 110 98
Sold Inventory 48 41 59 45
Average Sale Price $192,339 $199,366 $202,239 $195,609
Days on Market 73 70 73 47
Inland Empire Market Report | MAY 2015

TEMECULA TEMECULA
0 100 200 300 400 500 600 700 800 900
12 Months Ago 6 Months Ago 3 Months Ago Last Month
Active Inventory Pending Inventory
Sold Inventory Days on Market
Single Family Residence
12 Months Ago 6 Months Ago 3 Months Ago Last Month
Active Inventory 771 562 588 756
Pending Inventory 266 199 315 245
Sold Inventory 195 172 209 168
Average Sale Price $444,365 $426,978 $423,804 $448,730
Days on Market 67 114 76 119
Inland Empire Market Report | MAY 2015

WILDOMAR WILDOMAR
0 20 40 60 80
100 120 140 160
12 Months Ago 6 Months Ago 3 Months Ago Last Month
Active Inventory Pending Inventory
Sold Inventory Days on Market
Single Family Residence
12 Months Ago 6 Months Ago 3 Months Ago Last Month
Active Inventory 149 121 121 134
Pending Inventory 48 43 65 68
Sold Inventory 48 39 31 34
Average Sale Price $292,197 $301,151 $320,577 $320,066
Days on Market 59 69 54 83
Inland Empire Market Report | MAY 2015

ADELANTO
0
20
40
60
80
100
120
140
12 Months Ago 6 Months Ago 3 Months Ago Last Month
Active Inventory Pending Inventory
Sold Inventory Days on Market
Single Family Residence ADELANTO Single Family Residence
12 Months Ago 6 Months Ago 3 Months Ago Last Month
Active Inventory 96 118 119 120
Pending Inventory 39 29 61 58
Sold Inventory 34 24 25 23
Average Sale Price $133,608 $163,922 $156,702 $157,661
Days on Market 56 57 58 67
Inland Empire Market Report | MAY 2015

APPLE VALLEY
0 45 90
135 180 225 270 315 360
12 Months Ago 6 Months Ago 3 Months Ago Last Month
Active Inventory Pending Inventory
Sold Inventory Days on Market
Single Family Residence APPLE VALLEY Single Family Residence
12 Months Ago 6 Months Ago 3 Months Ago Last Month
Active Inventory 246 283 282 311
Pending Inventory 84 74 102 104
Sold Inventory 52 52 46 32
Average Sale Price $202,441 $205,113 $188,084 $221,031
Days on Market 55 71 70 62
Inland Empire Market Report | MAY 2015

BARSTOW
0 35 70
105 140 175 210 245 280
12 Months Ago 6 Months Ago 3 Months Ago Last Month
Active Inventory Pending Inventory
Sold Inventory Days on Market
Single Family Residence BARSTOW Single Family Residence
12 Months Ago 6 Months Ago 3 Months Ago Last Month
Active Inventory 63 58 46 51
Pending Inventory 13 5 7 10
Sold Inventory 4 5 7 5
Average Sale Price $51,875 $118,500 $123,186 $77,680
Days on Market 156 66 202 240
Inland Empire Market Report | MAY 2015

CHINO
0
35
70
105
140
175
210
245
12 Months Ago 6 Months Ago 3 Months Ago Last Month
Active Inventory Pending Inventory
Sold Inventory Days on Market
Single Family Residence CHINO Single Family Residence
12 Months Ago 6 Months Ago 3 Months Ago Last Month
Active Inventory 196 153 170 222
Pending Inventory 87 50 90 65
Sold Inventory 58 57 48 37
Average Sale Price $436,794 $457,071 $434,001 $459,962
Days on Market 72 64 79 71
Inland Empire Market Report | MAY 2015

CHINO HILLS
0
45
90
135
180
225
270
315
12 Months Ago 6 Months Ago 3 Months Ago Last Month
Active Inventory Pending Inventory
Sold Inventory Days on Market
Single Family Residence CHINO HILLS Single Family Residence
12 Months Ago 6 Months Ago 3 Months Ago Last Month
Active Inventory 240 211 232 292
Pending Inventory 97 67 102 84
Sold Inventory 69 55 61 48
Average Sale Price $596,696 $579,412 $595,909 $688,015
Days on Market 69 76 73 61
Inland Empire Market Report | MAY 2015

COLTON
0 15 30 45 60 75 90
105 120
12 Months Ago 6 Months Ago 3 Months Ago Last Month
Active Inventory Pending Inventory
Sold Inventory Days on Market
Single Family Residence COLTON Single Family Residence
12 Months Ago 6 Months Ago 3 Months Ago Last Month
Active Inventory 85 104 95 108
Pending Inventory 68 51 57 80
Sold Inventory 30 39 22 22
Average Sale Price $238,139 $301,992 $276,145 $236,273
Days on Market 60 54 36 57
Inland Empire Market Report | MAY 2015

FONTANA
0 75
150 225 300 375 450 525 600 675
12 Months Ago 6 Months Ago 3 Months Ago Last Month
Active Inventory Pending Inventory
Sold Inventory Days on Market
Single Family Residence FONTANA Single Family Residence
12 Months Ago 6 Months Ago 3 Months Ago Last Month
Active Inventory 583 540 504 545
Pending Inventory 296 250 340 281
Sold Inventory 172 176 172 140
Average Sale Price $320,492 $316,610 $329,300 $327,982
Days on Market 58 52 68 53
Inland Empire Market Report | MAY 2015
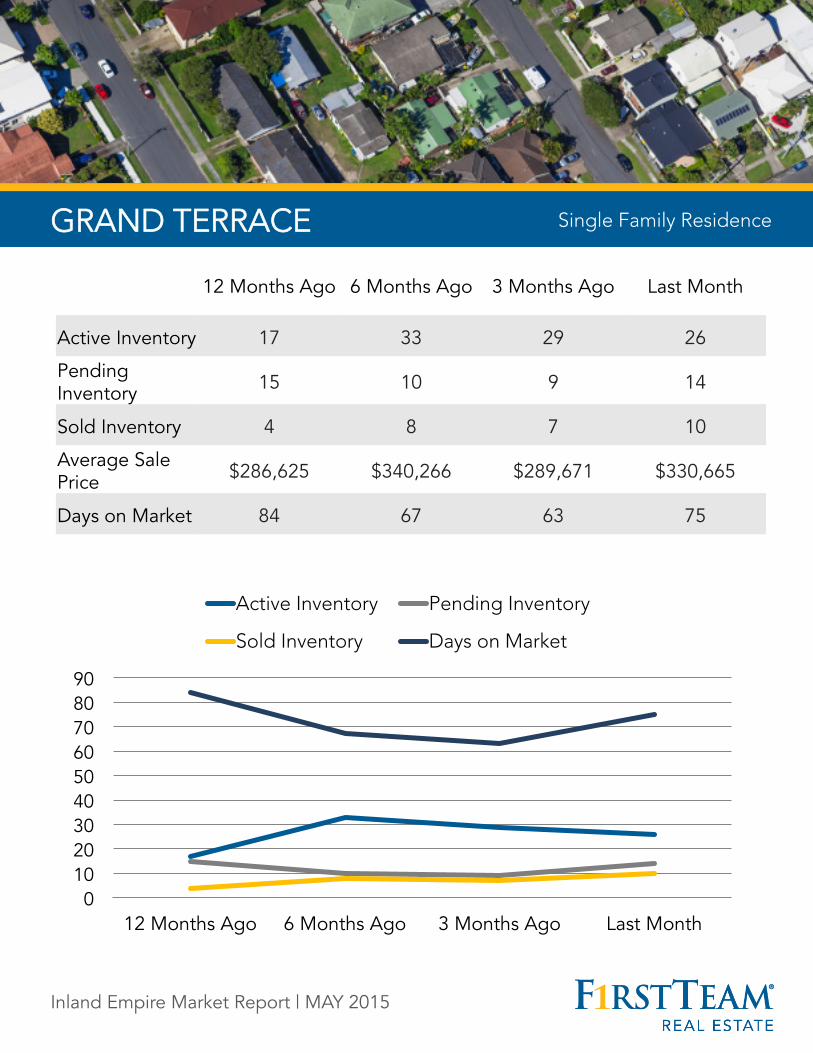
GRAND TERRACE
0 10 20 30 40 50 60 70 80 90
12 Months Ago 6 Months Ago 3 Months Ago Last Month
Active Inventory Pending Inventory
Sold Inventory Days on Market
Single Family Residence GRAND TERRACE Single Family Residence
12 Months Ago 6 Months Ago 3 Months Ago Last Month
Active Inventory 17 33 29 26
Pending Inventory 15 10 9 14
Sold Inventory 4 8 7 10
Average Sale Price $286,625 $340,266 $289,671 $330,665
Days on Market 84 67 63 75
Inland Empire Market Report | MAY 2015

HESPERIA
0 40 80
120 160 200 240 280 320
12 Months Ago 6 Months Ago 3 Months Ago Last Month
Active Inventory Pending Inventory
Sold Inventory Days on Market
Single Family Residence HESPERIA Single Family Residence
12 Months Ago 6 Months Ago 3 Months Ago Last Month
Active Inventory 223 283 245 274
Pending Inventory 124 84 140 137
Sold Inventory 57 67 76 55
Average Sale Price $188,479 $194,131 $201,149 $206,909
Days on Market 60 78 43 54
Inland Empire Market Report | MAY 2015

HIGHLAND
0 20 40 60 80
100 120 140 160
12 Months Ago 6 Months Ago 3 Months Ago Last Month
Active Inventory Pending Inventory
Sold Inventory Days on Market
Single Family Residence HIGHLAND Single Family Residence
12 Months Ago 6 Months Ago 3 Months Ago Last Month
Active Inventory 126 147 121 145
Pending Inventory 76 52 113 64
Sold Inventory 45 39 63 41
Average Sale Price $285,575 $271,211 $261,692 $281,996
Days on Market 49 71 55 64
Inland Empire Market Report | MAY 2015

LOMA LINDA
0 20 40 60 80
100 120 140 160
12 Months Ago 6 Months Ago 3 Months Ago Last Month
Active Inventory Pending Inventory
Sold Inventory Days on Market
Single Family Residence LOMA LINDA Single Family Residence
12 Months Ago 6 Months Ago 3 Months Ago Last Month
Active Inventory 38 47 47 52
Pending Inventory 25 5 23 22
Sold Inventory 9 6 10 12
Average Sale Price $354,200 $315,850 $430,300 $370,087
Days on Market 39 134 60 74
Inland Empire Market Report | MAY 2015

MONTCLAIR
0 10 20 30 40 50 60 70 80
12 Months Ago 6 Months Ago 3 Months Ago Last Month
Active Inventory Pending Inventory
Sold Inventory Days on Market
Single Family Residence MONTCLAIR Single Family Residence
12 Months Ago 6 Months Ago 3 Months Ago Last Month
Active Inventory 46 44 51 58
Pending Inventory 28 18 26 14
Sold Inventory 13 21 16 7
Average Sale Price $335,154 $319,652 $346,125 $371,129
Days on Market 33 72 56 57
Inland Empire Market Report | MAY 2015

ONTARIO
0 45 90
135 180 225 270 315 360
12 Months Ago 6 Months Ago 3 Months Ago Last Month
Active Inventory Pending Inventory
Sold Inventory Days on Market
Single Family Residence ONTARIO Single Family Residence
12 Months Ago 6 Months Ago 3 Months Ago Last Month
Active Inventory 255 243 227 301
Pending Inventory 145 103 164 133
Sold Inventory 83 70 78 53
Average Sale Price $341,366 $339,961 $342,592 $353,710
Days on Market 60 72 83 72
Inland Empire Market Report | MAY 2015

RANCHO CUCAMONGA
0
75
150
225
300
375
450
525
12 Months Ago 6 Months Ago 3 Months Ago Last Month
Active Inventory Pending Inventory
Sold Inventory Days on Market
Single Family Residence RANCHO CUCAMONGA Single Family Residence
12 Months Ago 6 Months Ago 3 Months Ago Last Month
Active Inventory 395 348 356 441
Pending Inventory 182 154 183 146
Sold Inventory 110 100 123 93
Average Sale Price $524,748 $476,182 $525,381 $495,312
Days on Market 61 68 102 60
Inland Empire Market Report | MAY 2015

REDLANDS
0
45
90
135
180
225
270
315
12 Months Ago 6 Months Ago 3 Months Ago Last Month
Active Inventory Pending Inventory
Sold Inventory Days on Market
Single Family Residence REDLANDS Single Family Residence
12 Months Ago 6 Months Ago 3 Months Ago Last Month
Active Inventory 198 194 199 273
Pending Inventory 100 56 108 71
Sold Inventory 66 48 73 43
Average Sale Price $398,020 $354,929 $382,104 $364,745
Days on Market 66 74 70 69
Inland Empire Market Report | MAY 2015

RIALTO
0 30 60 90
120 150 180 210 240
12 Months Ago 6 Months Ago 3 Months Ago Last Month
Active Inventory Pending Inventory
Sold Inventory Days on Market
Single Family Residence RIALTO Single Family Residence
12 Months Ago 6 Months Ago 3 Months Ago Last Month
Active Inventory 221 223 203 200
Pending Inventory 137 88 152 129
Sold Inventory 91 63 64 65
Average Sale Price $255,021 $277,173 $268,404 $270,300
Days on Market 44 45 65 53
Inland Empire Market Report | MAY 2015

SAN BERNARDINO (city)
0 75
150 225 300 375 450 525 600
12 Months Ago 6 Months Ago 3 Months Ago Last Month
Active Inventory Pending Inventory
Sold Inventory Days on Market
Single Family Residence SAN BERNARDINO (city) Single Family Residence
12 Months Ago 6 Months Ago 3 Months Ago Last Month
Active Inventory 495 550 502 566
Pending Inventory 324 239 372 330
Sold Inventory 178 142 144 143
Average Sale Price $209,563 $198,564 $225,532 $223,499
Days on Market 97 56 53 56
Inland Empire Market Report | MAY 2015

UPLAND
0 35 70
105 140 175 210 245 280
12 Months Ago 6 Months Ago 3 Months Ago Last Month
Active Inventory Pending Inventory
Sold Inventory Days on Market
Single Family Residence UPLAND Single Family Residence
12 Months Ago 6 Months Ago 3 Months Ago Last Month
Active Inventory 178 172 184 242
Pending Inventory 74 64 97 70
Sold Inventory 57 49 53 42
Average Sale Price $557,122 $536,091 $505,794 $482,274
Days on Market 54 72 59 101
Inland Empire Market Report | MAY 2015

VICTORVILLE
0
75
150
225
300
375
450
525
12 Months Ago 6 Months Ago 3 Months Ago Last Month
Active Inventory Pending Inventory
Sold Inventory Days on Market
Single Family Residence VICTORVILLE Single Family Residence
12 Months Ago 6 Months Ago 3 Months Ago Last Month
Active Inventory 392 485 460 484
Pending Inventory 185 156 206 209
Sold Inventory 93 81 94 94
Average Sale Price $175,381 $189,109 $181,665 $192,973
Days on Market 74 105 92 93
Inland Empire Market Report | MAY 2015

YUCAIPA Single Family Residence
YUCAIPA Single Family Residence
12 Months Ago 6 Months Ago 3 Months Ago Last Month
Active Inventory 185 166 177 236
Pending Inventory 81 60 87 64
Sold Inventory 51 46 48 35
Average Sale Price $286,708 $319,206 $311,684 $306,266
Days on Market 59 72 161 78
Inland Empire Market Report | MAY 2015
0 35 70
105 140 175 210 245 280
12 Months Ago 6 Months Ago 3 Months Ago Last Month
Active Inventory Pending Inventory
Sold Inventory Days on Market

YUCCA VALLEY
0 45 90
135 180 225 270 315 360
12 Months Ago 6 Months Ago 3 Months Ago Last Month
Active Inventory Pending Inventory
Sold Inventory Days on Market
Single Family Residence YUCCA VALLEY Single Family Residence
12 Months Ago 6 Months Ago 3 Months Ago Last Month
Active Inventory 224 240 308 258
Pending Inventory 60 46 71 52
Sold Inventory 31 35 32 22
Average Sale Price $160,679 $139,917 $133,606 $136,209
Days on Market 73 81 77 107
Inland Empire Market Report | MAY 2015

Contact one of our local neighborhood experts for more exclusive market data, or to help you get started with buying or selling your next home.
Email: [email protected]
Phone: 888-870-1142
Web: FirstTeam.com
Connect With Us!
WANT MORE INFO?
Inland Empire Market Report | MAY 2015