may 2013 reducing uncertainty in solar energy estimates...
TRANSCRIPT

Albany, New York | Barcelona, Spain | Bangalore, India | awstruepower.com | +1 877‐899‐3463
©2011 AWS Truepower, LLC
Marie SchnitzerVice President of Consulting Services
Presented at the 2013 Sandia PV Performance Modeling WorkshopSanta Clara, CA. May 1‐2, 2013Published by Sandia National Laboratories with the Permission of the Author.
May 2013
Reducing Uncertainty in Solar Energy EstimatesA Case Study

Albany, New York | Barcelona, Spain | Bangalore, India | awstruepower.com | +1 877‐899‐3463
©2011 AWS Truepower, LLC
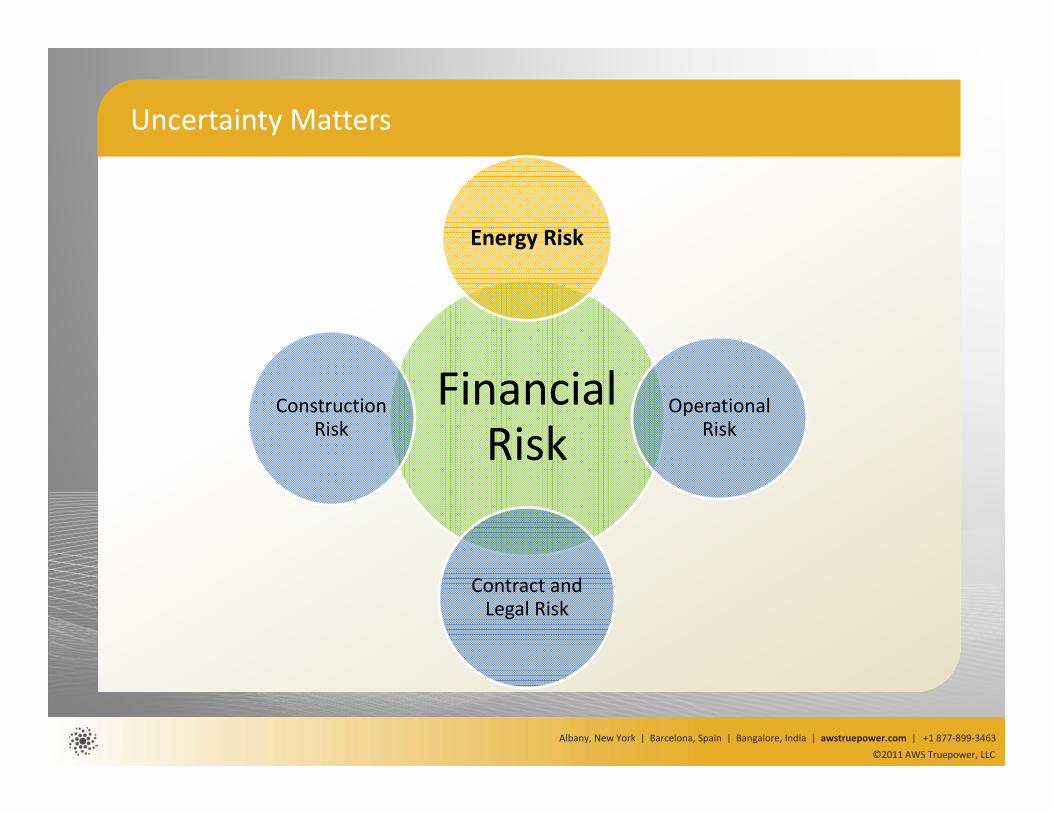
Uncertainty Matters
Financial Risk
Energy Risk
Operational Risk
Contract and Legal Risk
Construction Risk
Albany, New York | Barcelona, Spain | Bangalore, India | awstruepower.com | +1 877‐899‐3463
©2011 AWS Truepower, LLC
Uncertainty Matters
Financial Risk
Energy Risk
Operational Risk
Contract and Legal Risk
Construction Risk
Albany, New York | Barcelona, Spain | Bangalore, India | awstruepower.com | +1 877‐899‐3463
©2011 AWS Truepower, LLC
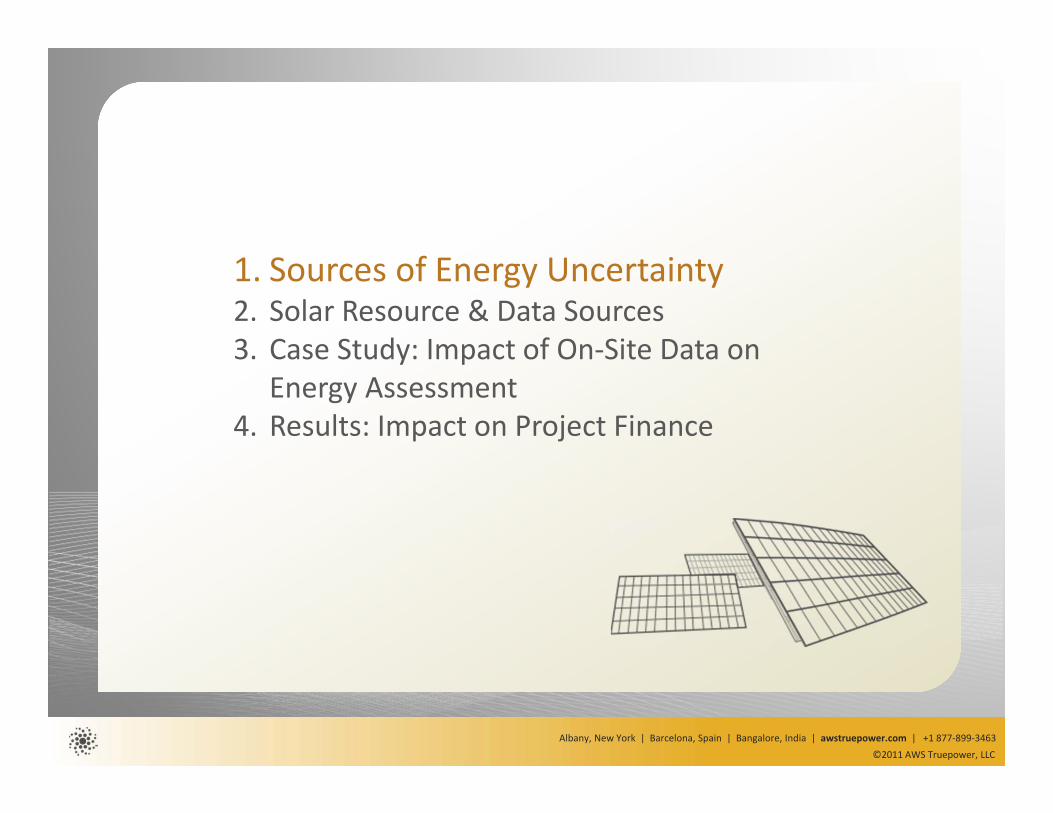
1. Sources of Energy Uncertainty2. Solar Resource & Data Sources3. Case Study: Impact of On‐Site Data on
Energy Assessment4. Results: Impact on Project Finance

Albany, New York | Barcelona, Spain | Bangalore, India | awstruepower.com | +1 877‐899‐3463
©2011 AWS Truepower, LLC
Probability of exceedance: the level of confidence that a plant’s actual energy production will be at least a certain value
Example 1: Base Case
Example 2: Reduction of risk
Energy Estimates and Probability of Exceedance
Reduced Uncertainty
Increased Value of P90
Albany, New York | Barcelona, Spain | Bangalore, India | awstruepower.com | +1 877‐899‐3463
©2011 AWS Truepower, LLC
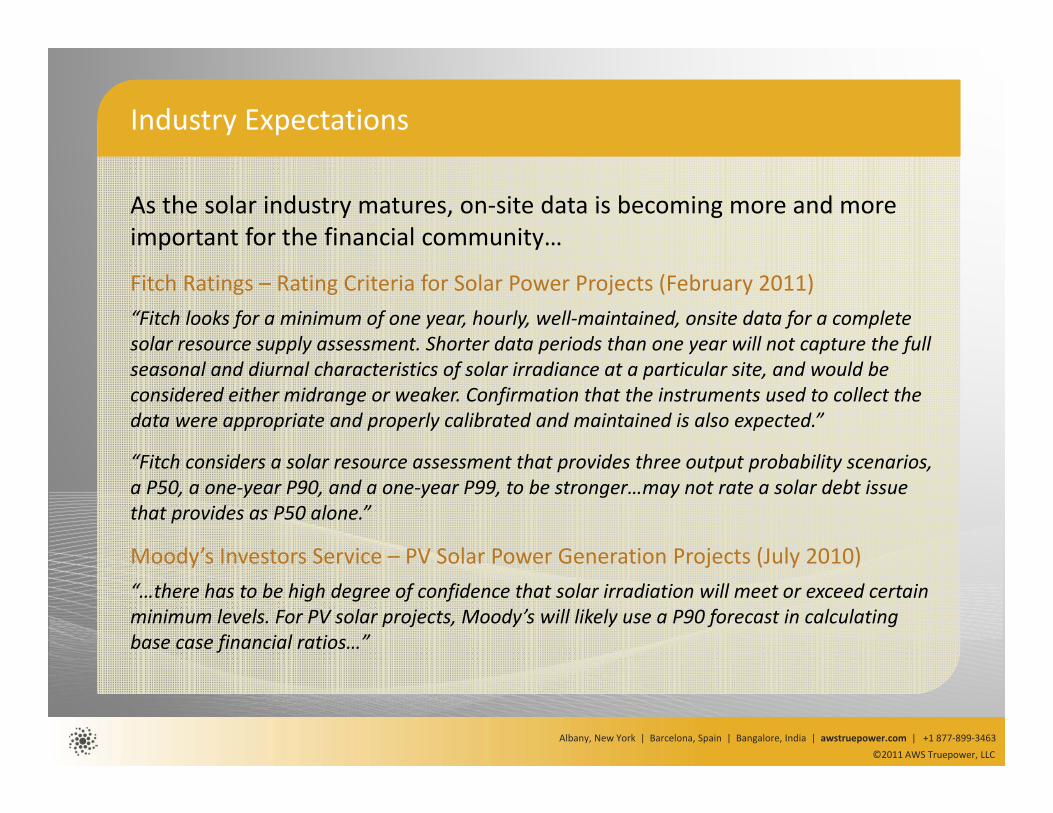
Industry Expectations
As the solar industry matures, on‐site data is becoming more and more important for the financial community…
Fitch Ratings – Rating Criteria for Solar Power Projects (February 2011)“Fitch looks for a minimum of one year, hourly, well‐maintained, onsite data for a complete solar resource supply assessment. Shorter data periods than one year will not capture the full seasonal and diurnal characteristics of solar irradiance at a particular site, and would be considered either midrange or weaker. Confirmation that the instruments used to collect the data were appropriate and properly calibrated and maintained is also expected.”
“Fitch considers a solar resource assessment that provides three output probability scenarios, a P50, a one‐year P90, and a one‐year P99, to be stronger…may not rate a solar debt issue that provides as P50 alone.”
Moody’s Investors Service – PV Solar Power Generation Projects (July 2010)“…there has to be high degree of confidence that solar irradiation will meet or exceed certain minimum levels. For PV solar projects, Moody’s will likely use a P90 forecast in calculating base case financial ratios…”

Albany, New York | Barcelona, Spain | Bangalore, India | awstruepower.com | +1 877‐899‐3463
©2011 AWS Truepower, LLC
Sources of Energy Uncertainty
Annual Degradation(0.5 – 1 %)
Transposition To Plane of Array
(0.5 – 2%)
Energy Simulation & Plant Losses(3 – 5 %)
Solar Resource Uncertainty(Measurement, IA Variability, POR, Spatial)
(5 – 17%)
Albany, New York | Barcelona, Spain | Bangalore, India | awstruepower.com | +1 877‐899‐3463
©2011 AWS Truepower, LLC
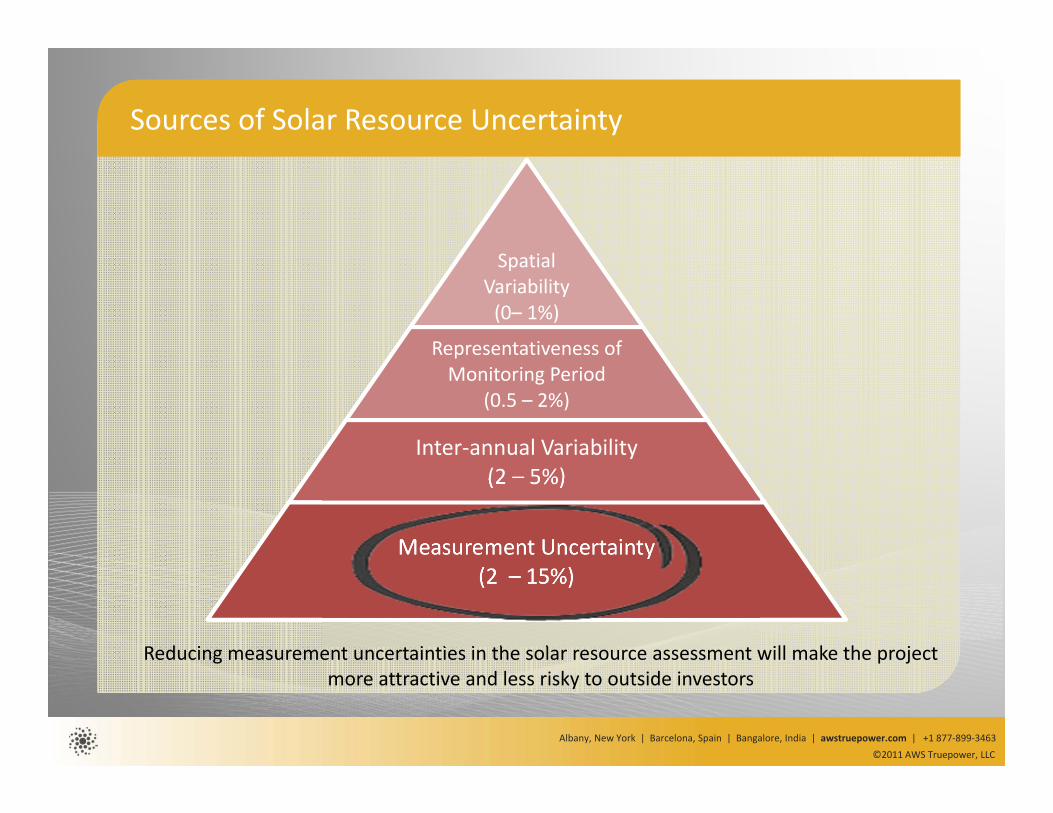
Sources of Solar Resource Uncertainty
Reducing measurement uncertainties in the solar resource assessment will make the project more attractive and less risky to outside investors
Spatial Variability(0– 1%)
Representativeness of Monitoring Period
(0.5 – 2%)
Inter‐annual Variability(2 – 5%)
Measurement Uncertainty(2 – 15%)
Albany, New York | Barcelona, Spain | Bangalore, India | awstruepower.com | +1 877‐899‐3463
©2011 AWS Truepower, LLC
1. Sources of Energy Uncertainty2. Solar Resource & Data Sources3. Case Study: Impact of On‐Site Data on Energy
Assessment4. Results: Impact on Project Finance
Albany, New York | Barcelona, Spain | Bangalore, India | awstruepower.com | +1 877‐899‐3463
©2011 AWS Truepower, LLC
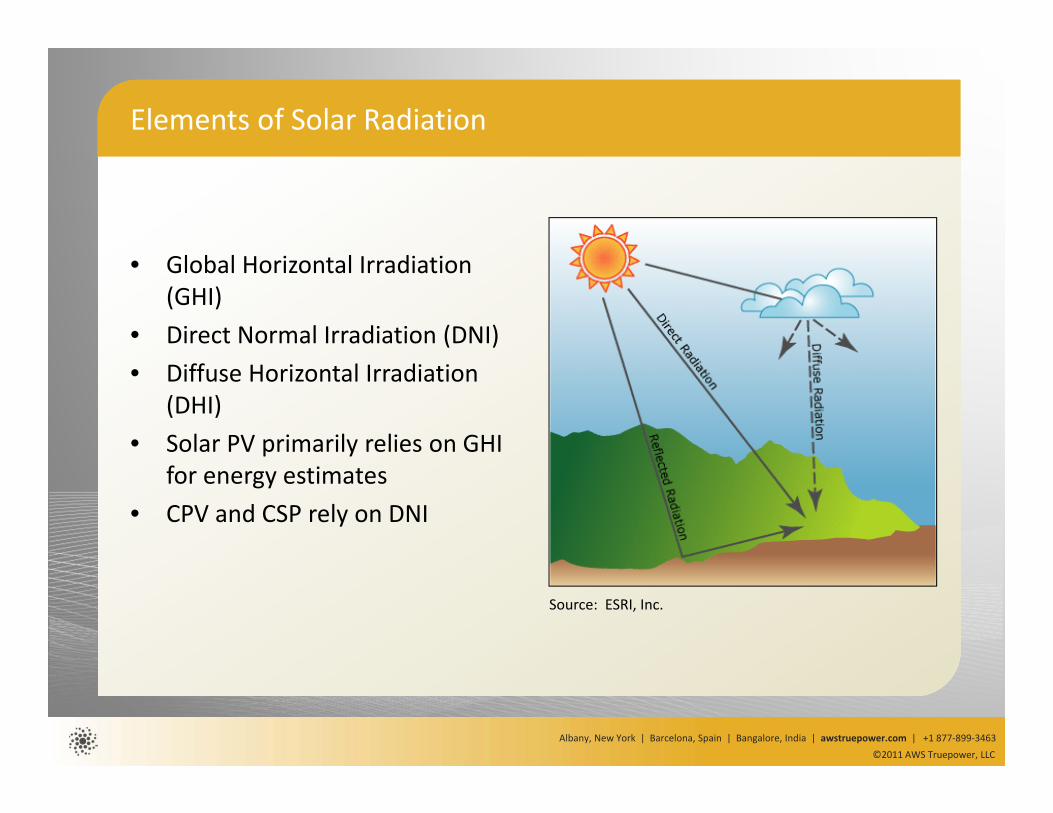
Elements of Solar Radiation
• Global Horizontal Irradiation (GHI)
• Direct Normal Irradiation (DNI)• Diffuse Horizontal Irradiation
(DHI)• Solar PV primarily relies on GHI
for energy estimates• CPV and CSP rely on DNI
Source: ESRI, Inc.
Albany, New York | Barcelona, Spain | Bangalore, India | awstruepower.com | +1 877‐899‐3463
©2011 AWS Truepower, LLC
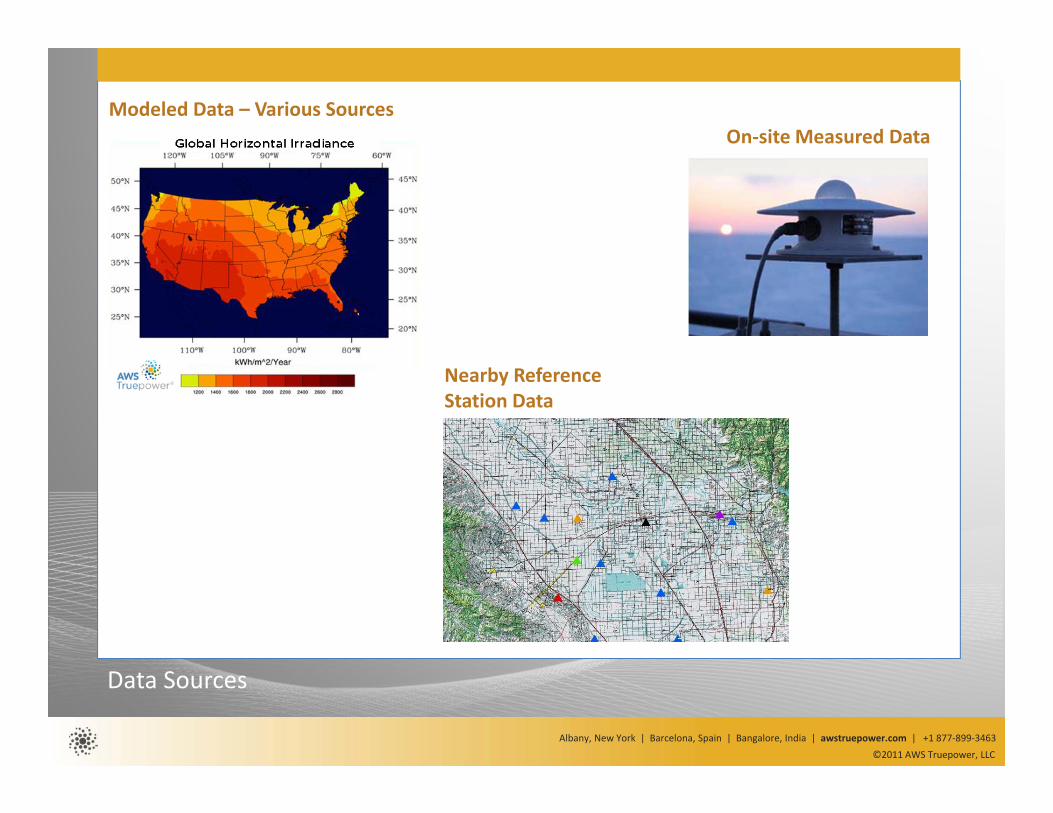
Data Sources
Modeled Data – Various SourcesOn‐site Measured Data
Nearby Reference Station Data
Albany, New York | Barcelona, Spain | Bangalore, India | awstruepower.com | +1 877‐899‐3463
©2011 AWS Truepower, LLC
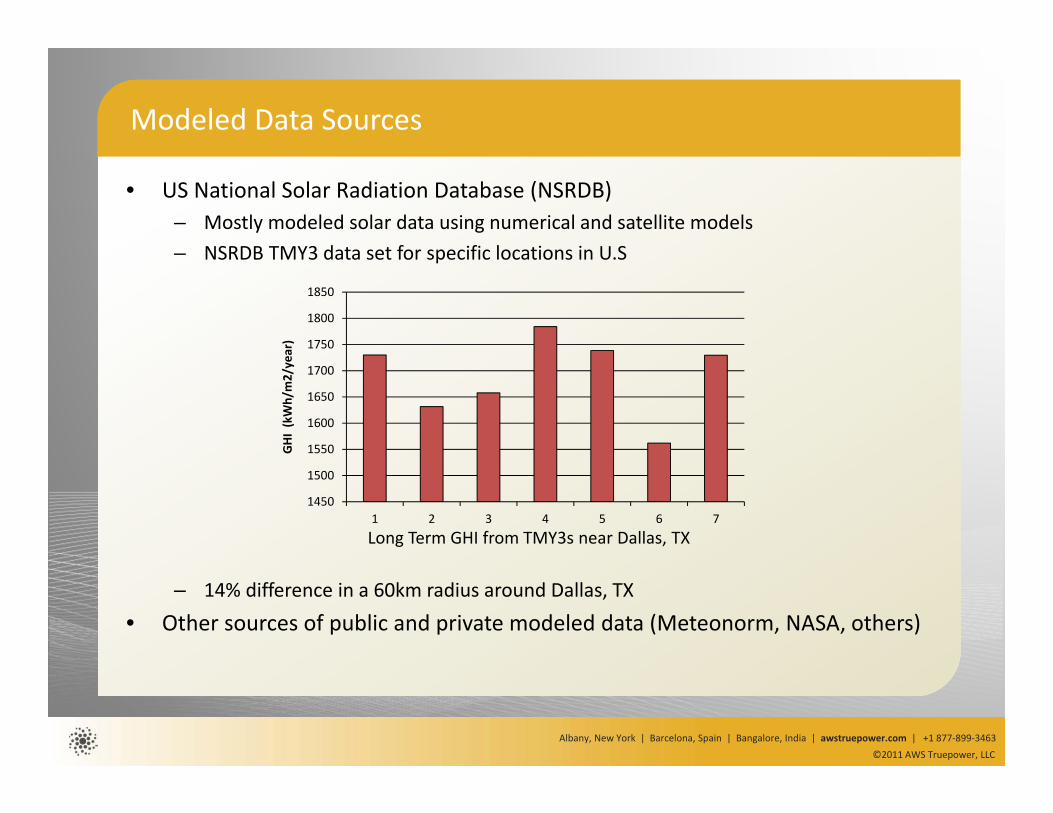
Modeled Data Sources
• US National Solar Radiation Database (NSRDB)– Mostly modeled solar data using numerical and satellite models– NSRDB TMY3 data set for specific locations in U.S
– 14% difference in a 60km radius around Dallas, TX
• Other sources of public and private modeled data (Meteonorm, NASA, others)
1450
1500
1550
1600
1650
1700
1750
1800
1850
1 2 3 4 5 6 7
GHI (kWh/m2/year)
Long Term GHI from TMY3s near Dallas, TX

Albany, New York | Barcelona, Spain | Bangalore, India | awstruepower.com | +1 877‐899‐3463
©2011 AWS Truepower, LLC
An Example Solar Resource Monitoring System
Rotating Shadowband Radiometer Wind Anemometer and Vane
Temperature and Relative Humidity Probe Data Logger
Tipping Bucket Rain Gauge
Albany, New York | Barcelona, Spain | Bangalore, India | awstruepower.com | +1 877‐899‐3463
©2011 AWS Truepower, LLC
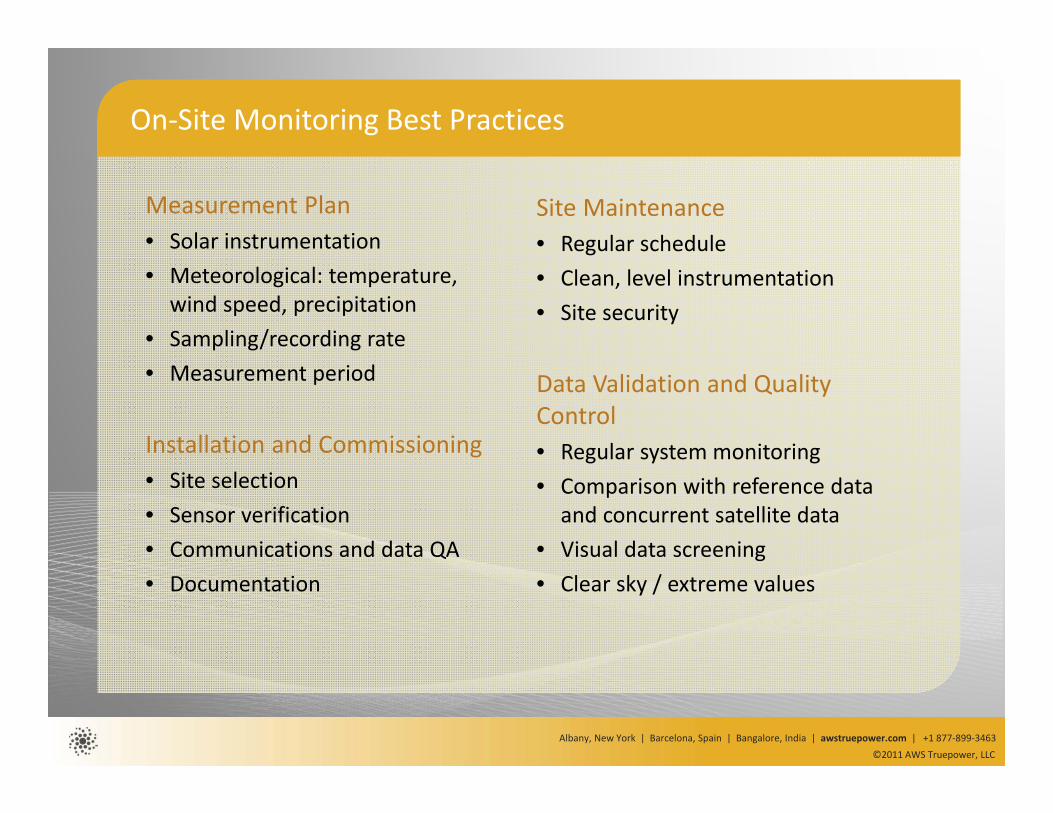
On‐Site Monitoring Best Practices
Measurement Plan• Solar instrumentation• Meteorological: temperature, wind speed, precipitation
• Sampling/recording rate• Measurement period
Installation and Commissioning• Site selection• Sensor verification• Communications and data QA• Documentation
Site Maintenance• Regular schedule• Clean, level instrumentation• Site security
Data Validation and Quality Control• Regular system monitoring• Comparison with reference data and concurrent satellite data
• Visual data screening• Clear sky / extreme values
Albany, New York | Barcelona, Spain | Bangalore, India | awstruepower.com | +1 877‐899‐3463
©2011 AWS Truepower, LLC
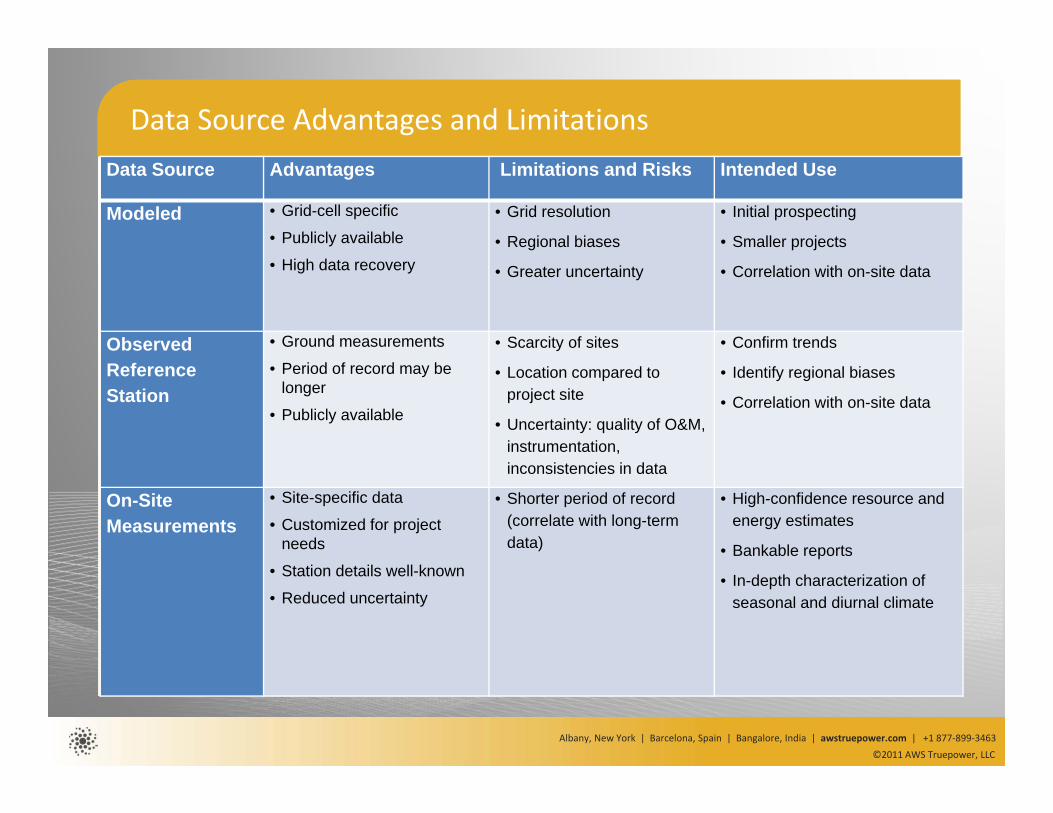
Data Source Advantages and LimitationsData Source Advantages Limitations and Risks Intended Use
Modeled • Grid-cell specific
• Publicly available
• High data recovery
• Grid resolution
• Regional biases
• Greater uncertainty
• Initial prospecting
• Smaller projects
• Correlation with on-site data
Observed Reference Station
• Ground measurements
• Period of record may be longer
• Publicly available
• Scarcity of sites
• Location compared toproject site
• Uncertainty: quality of O&M, instrumentation,inconsistencies in data
• Confirm trends
• Identify regional biases
• Correlation with on-site data
On-Site Measurements
• Site-specific data
• Customized for project needs
• Station details well-known
• Reduced uncertainty
• Shorter period of record (correlate with long-term data)
• High-confidence resource and energy estimates
• Bankable reports
• In-depth characterization of seasonal and diurnal climate
Albany, New York | Barcelona, Spain | Bangalore, India | awstruepower.com | +1 877‐899‐3463
©2011 AWS Truepower, LLC
1. Sources of Energy Uncertainty2. Solar Resource & Data Sources3. Case Study: Impact of On‐Site Data on Energy Assessment
4. Results: Impact on Project Finance
Albany, New York | Barcelona, Spain | Bangalore, India | awstruepower.com | +1 877‐899‐3463
©2011 AWS Truepower, LLC
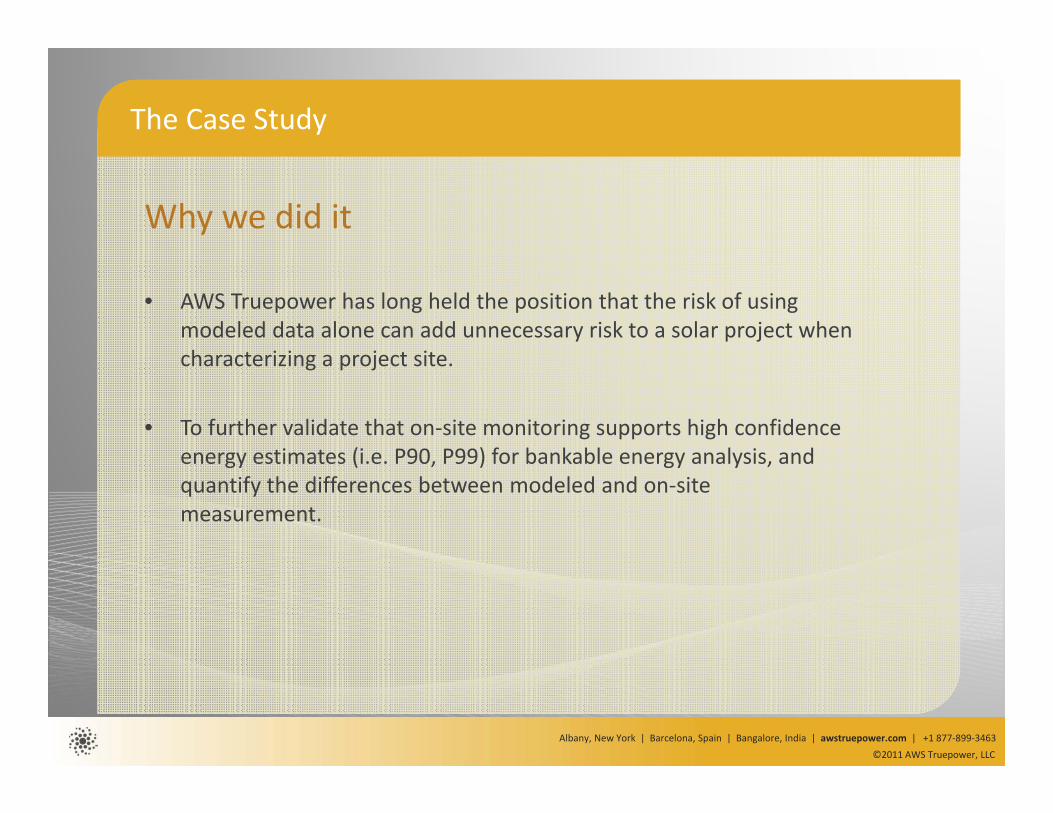
The Case Study
Why we did it
• AWS Truepower has long held the position that the risk of using modeled data alone can add unnecessary risk to a solar project when characterizing a project site.
• To further validate that on‐site monitoring supports high confidence energy estimates (i.e. P90, P99) for bankable energy analysis, and quantify the differences between modeled and on‐site measurement.

Albany, New York | Barcelona, Spain | Bangalore, India | awstruepower.com | +1 877‐899‐3463
©2011 AWS Truepower, LLC
The Case Study
How we did it• 11 sites with 1‐2 years of data
• 2 solar energy assessments for each site• Modeled data alone• On‐site measurements projected over project life
• Uncertainty assessment for each scenario
Albany, New York | Barcelona, Spain | Bangalore, India | awstruepower.com | +1 877‐899‐3463
©2011 AWS Truepower, LLC
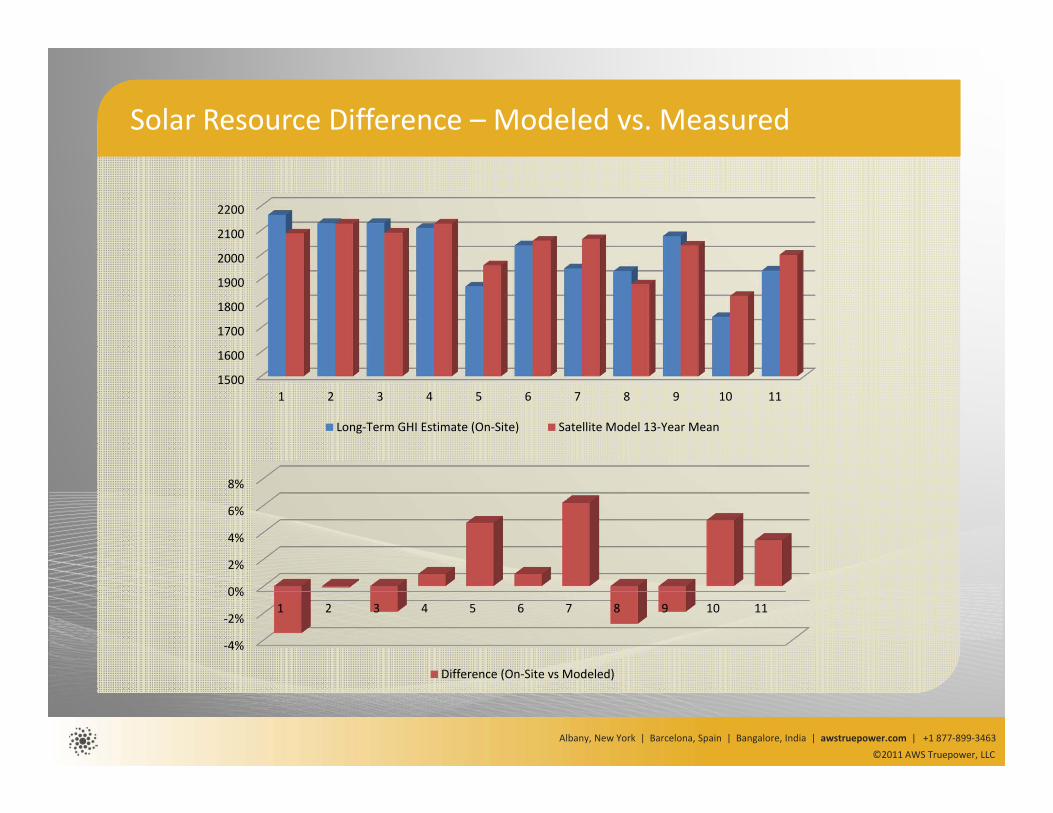
Solar Resource Difference – Modeled vs. Measured
1500
1600
1700
1800
1900
2000
2100
2200
1 2 3 4 5 6 7 8 9 10 11
Long‐Term GHI Estimate (On‐Site) Satellite Model 13‐Year Mean
‐4%
‐2%
0%
2%
4%
6%
8%
1 2 3 4 5 6 7 8 9 10 11
Difference (On‐Site vs Modeled)
Albany, New York | Barcelona, Spain | Bangalore, India | awstruepower.com | +1 877‐899‐3463
©2011 AWS Truepower, LLC
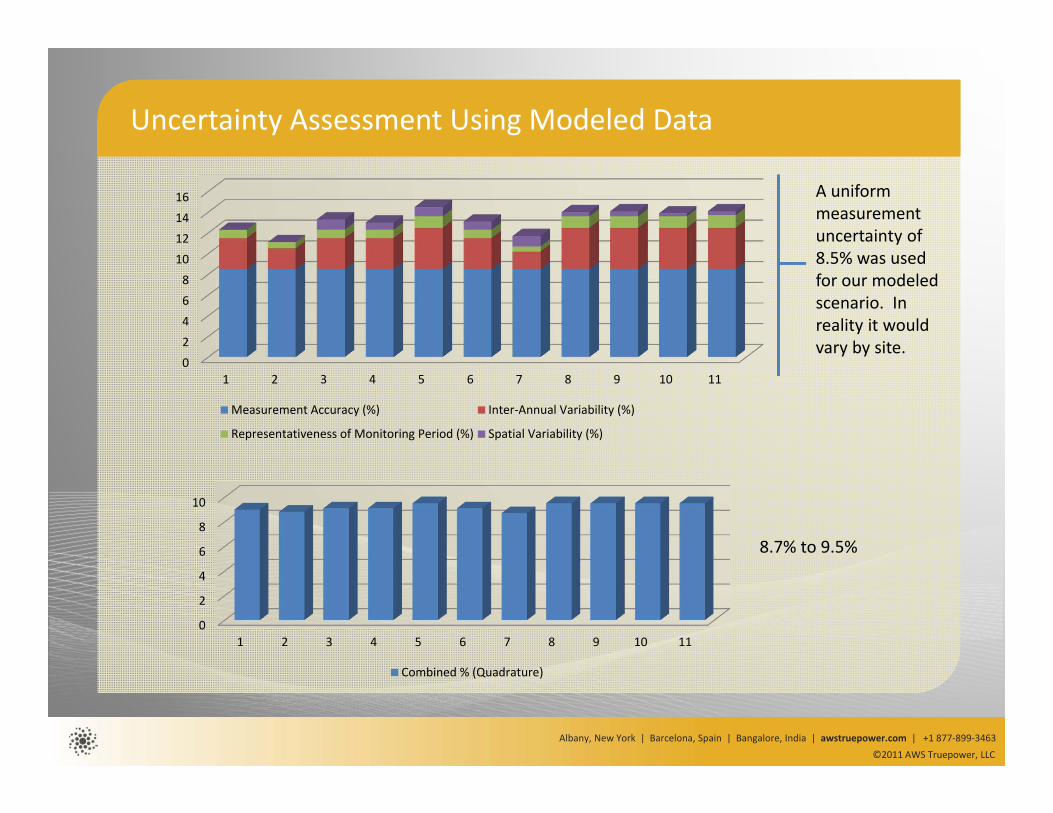
Uncertainty Assessment Using Modeled Data
02468
10121416
1 2 3 4 5 6 7 8 9 10 11
Measurement Accuracy (%) Inter‐Annual Variability (%)
Representativeness of Monitoring Period (%) Spatial Variability (%)
0
2
4
6
8
10
1 2 3 4 5 6 7 8 9 10 11
Combined % (Quadrature)
A uniform measurement uncertainty of 8.5% was used for our modeled scenario. In reality it would vary by site.
8.7% to 9.5%

Albany, New York | Barcelona, Spain | Bangalore, India | awstruepower.com | +1 877‐899‐3463
©2011 AWS Truepower, LLC
Uncertainty Assessment Using On‐site Measurements
0
2
4
6
8
10
12
1 2 3 4 5 6 7 8 9 10 11
Measurement Accuracy (%) Inter‐Annual Variability (%)
Representativeness of Monitoring Period (%) Spatial Variability (%)
0
2
4
6
8
1 2 3 4 5 6 7 8 9 10 11
Combined % (Quadrature)
4.5% to 5.9%*
*excludes outliers (10&11)

Albany, New York | Barcelona, Spain | Bangalore, India | awstruepower.com | +1 877‐899‐3463
©2011 AWS Truepower, LLC
Uncertainty Difference: Modeled vs. Onsite
012345678910
1 2 3 4 5 6 7 8 9 10 11
Uncertainty Using Modeled Data Only (%) Uncertainty Using On‐Site Data (%) Reduction in Uncertainty (%)
Average uncertainty reduction of over 3.5%, range from 2.2% to 4.6%(3.9% reduction excluding outliers for maintenance practices)
Sites 10 and 11 represent monitoring programs that didn’t employ best practices, corresponding to higher uncertainty.
Albany, New York | Barcelona, Spain | Bangalore, India | awstruepower.com | +1 877‐899‐3463
©2011 AWS Truepower, LLC
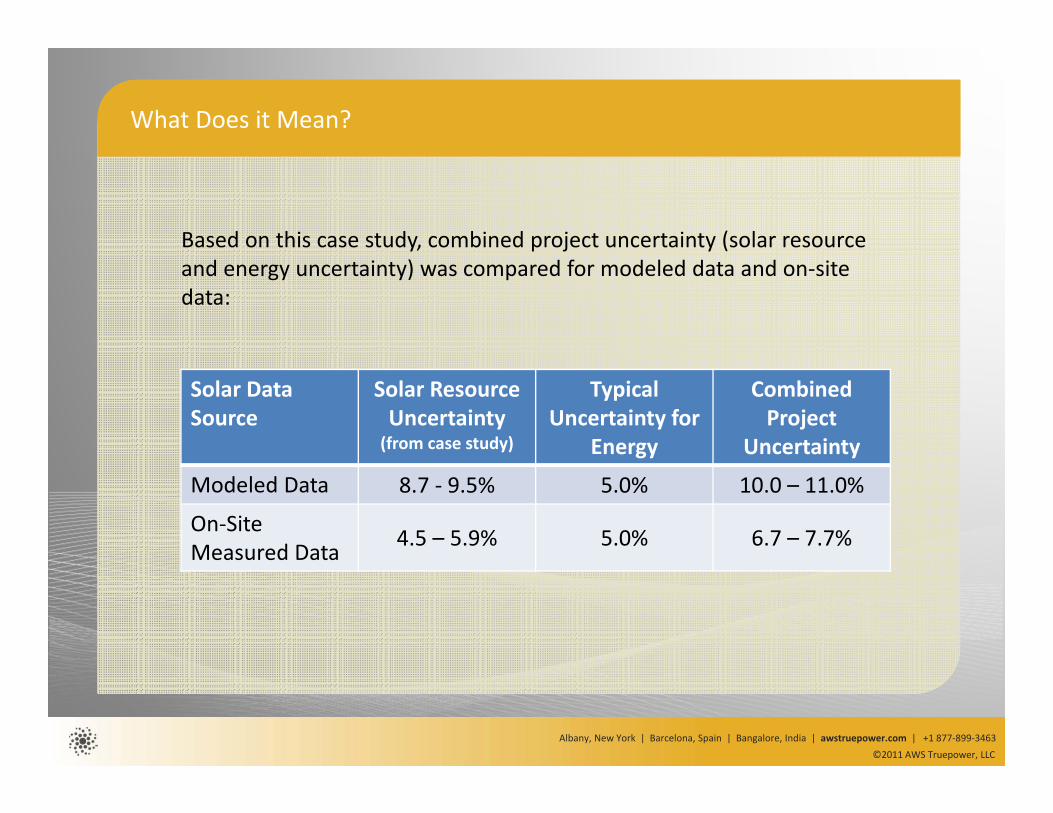
What Does it Mean?
Based on this case study, combined project uncertainty (solar resource and energy uncertainty) was compared for modeled data and on‐site data:
Solar Data Source
Solar ResourceUncertainty (from case study)
Typical Uncertainty for
Energy
Combined Project
Uncertainty
Modeled Data 8.7 ‐ 9.5% 5.0% 10.0 – 11.0%
On‐Site Measured Data 4.5 – 5.9% 5.0% 6.7 – 7.7%
Albany, New York | Barcelona, Spain | Bangalore, India | awstruepower.com | +1 877‐899‐3463
©2011 AWS Truepower, LLC
1. Sources of Energy Uncertainty2. Solar Resource & Data Sources3. Case Study: Impact of On‐Site Data on Energy
Assessment4. Results: Impact on Project Finance
Albany, New York | Barcelona, Spain | Bangalore, India | awstruepower.com | +1 877‐899‐3463
©2011 AWS Truepower, LLC
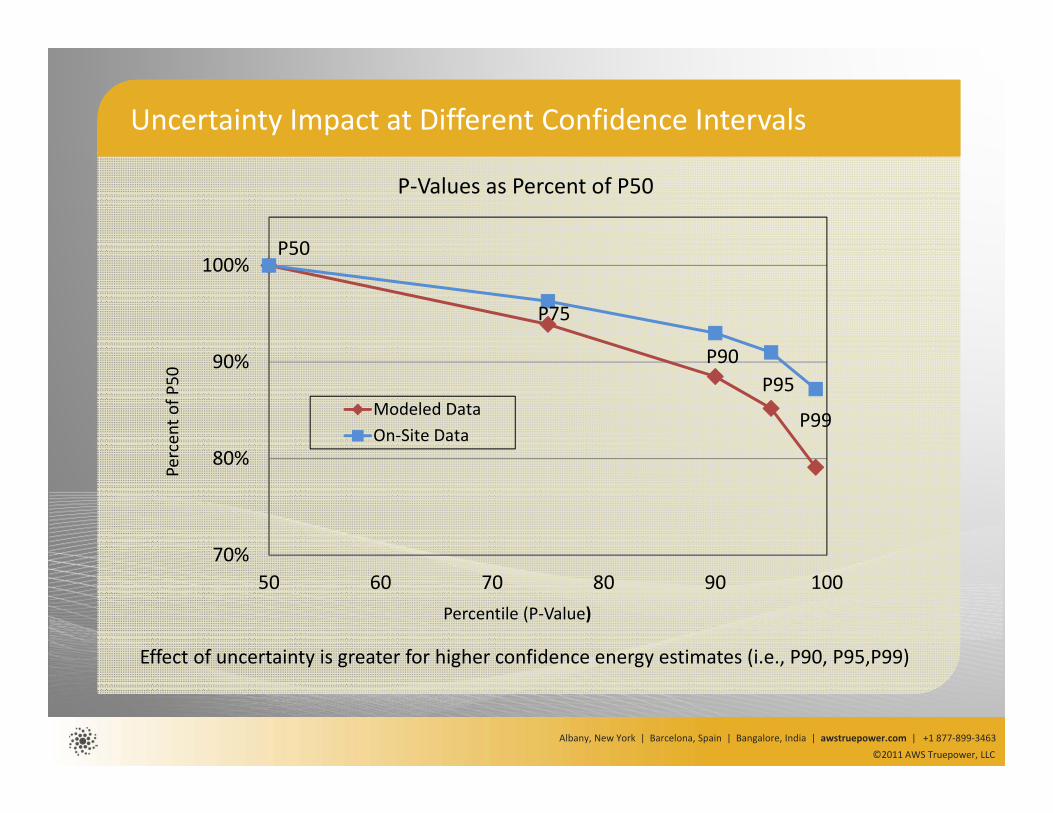
Uncertainty Impact at Different Confidence Intervals
Effect of uncertainty is greater for higher confidence energy estimates (i.e., P90, P95,P99)
P50
P75
P90P95
P99
70%
80%
90%
100%
50 60 70 80 90 100
Percent o
f P50
Percentile (P‐Value)
P‐Values as Percent of P50
Modeled DataOn‐Site Data

Albany, New York | Barcelona, Spain | Bangalore, India | awstruepower.com | +1 877‐899‐3463
©2011 AWS Truepower, LLC
Impact on Project Finance
An accurate P50 is important because:• P50 too low additional potential funding left on table• P50 too high project returns reduced during operational phase
Low uncertainty is important because:• P90 and P99 are higher• Level of debt is dependent
on value of P90/P99• Greater P90/P99 = greater debt sizing

Albany, New York | Barcelona, Spain | Bangalore, India | awstruepower.com | +1 877‐899‐3463
©2011 AWS Truepower, LLC
Effect of Uncertainty
On‐Site Solar Data
Reduced Uncertainty
Higher Confidence in Project Return
Project More Attractive To Investors
Albany, New York | Barcelona, Spain | Bangalore, India | awstruepower.com | +1 877‐899‐3463
©2011 AWS Truepower, LLC
Conclusions
• On‐site monitoring increases accuracy of P50.
• On‐site monitoring with best practices reduces energy uncertainty by 3.5% or greater.
• On‐site monitoring can increase the P90 by over 5% and the P99 by over 10%.
• Best practices for on‐site monitoring mitigate risks from the start to avoid bigger risks later in the project.
• On‐site monitoring = lower financial risk
Albany, New York | Barcelona, Spain | Bangalore, India | awstruepower.com | +1 877‐899‐3463
©2011 AWS Truepower, LLC
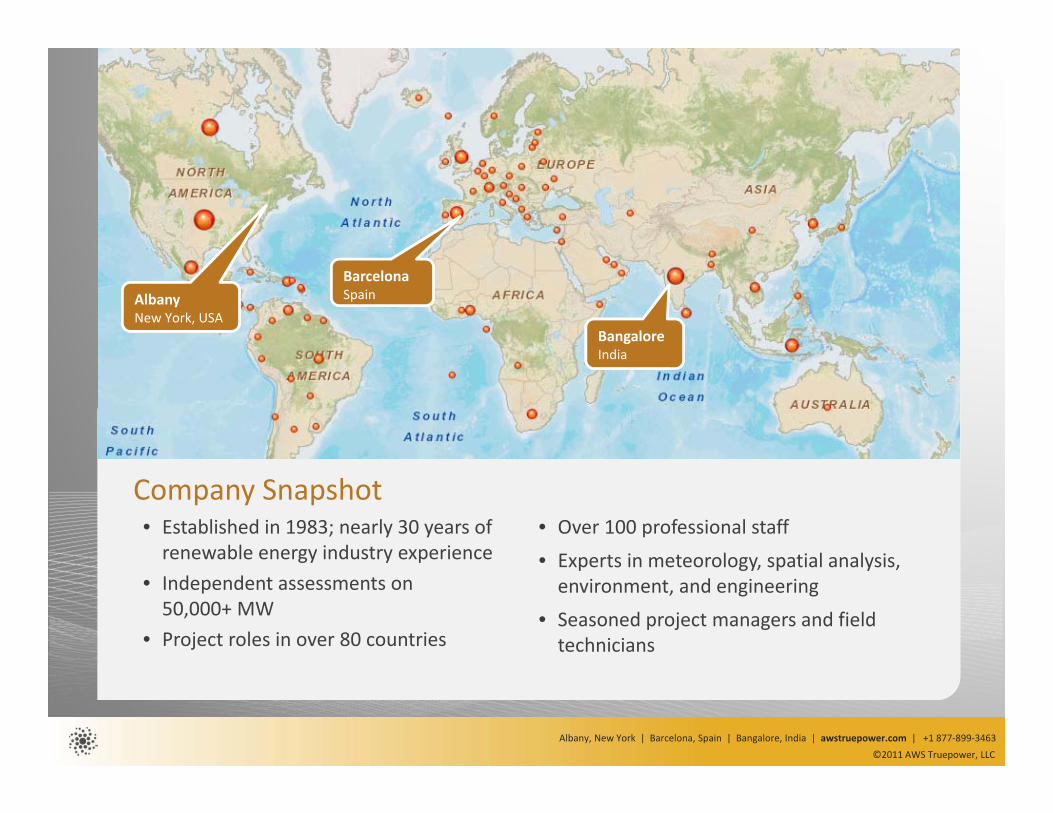
• Over 100 professional staff
• Experts in meteorology, spatial analysis, environment, and engineering
• Seasoned project managers and field technicians
AlbanyNew York, USA
BarcelonaSpain
BangaloreIndia
Company Snapshot• Established in 1983; nearly 30 years of renewable energy industry experience
• Independent assessments on 50,000+ MW
• Project roles in over 80 countries
• Over 100 professional staff
• Experts in meteorology, spatial analysis, environment, and engineering
• Seasoned project managers and field technicians
AlbanyNew York, USA
BarcelonaSpain
BangaloreIndia

Albany, New York | Barcelona, Spain | Bangalore, India | awstruepower.com | +1 877‐899‐3463
©2011 AWS Truepower, LLC
Marie SchnitzerVice President of Consulting Services
Questions
+1 877‐899‐3463
www.awstruepower.com