may-18 aug-18 nov-18 jan-19 initiation · centres (puskesmas, the first level referral under uhc...
TRANSCRIPT

Company Note | Alpha series Hospitals │ Indonesia │ April 15, 2019
IMPORTANT DISCLOSURES, INCLUDING ANY REQUIRED RESEARCH CERTIFICATIONS, ARE PROVIDED AT THE END OF THIS REPORT. IF THIS REPORT IS DISTRIBUTED IN THE UNITED STATES IT IS DISTRIBUTED BY CGS-CIMB SECURITIES (USA), INC. AND IS CONSIDERED THIRD-PARTY AFFILIATED RESEARCH.
Powered by the EFA Platform
INITIATION
Medikaloka Hermina The healthiest growth
■ A well-paced expansion plan could enable HEAL to reach c.40 hospitals by 2020F, driving FY18-21F revenue CAGR of 16%, EBITDA margin of 18-20%.
■ The time-tested doctor partnership business model allows for balanced UHC and private patient growth, despite the scarcity of doctors in Indonesia.
■ UHC rollout completion could spark investor interest and we think HEAL is the best Indonesia healthcare proxy. Initiate Add, DCF-based TP of Rp4,000.
Growing at a healthy pace With 32 hospitals and 3,350 beds as at end-2018, HEAL plans to add four new hospitals
p.a. in FY19-20F, to reach a total of 40 hospitals and c.4,000 beds. Its moderate growth
strategy allows for mature hospitals to support new hospitals, which in turn, would enable
the company to sustain overall EBITDA margin of 18-20% in FY19-21F, with the ratio of
mature/new hospitals at 50:50. While its revenue/EBITDA rose by CAGR of 21%/20% in
FY15-18, we project slower revenue CAGR over FY18-21F, albeit at a decent pace of
c.16%, against the current 8% average for the Indonesian healthcare sector.
A tried and true model HEAL is one of the oldest private hospital chains in Indonesia with a simple hospital
design, in our view. Its capex per hospital is relatively low, at Rp150bn, vs. SILO’s and
MIKA’s c.Rp300bn. Its patient mix has also been consistent, i.e. more broad-based and
middle class, unlike the latter two players that targeted the upper-class segment but later
were compelled to have more UHC (Universal Healthcare) exposure. This results in more
consistent financial returns. Its doctor partnership model also allows for a more stringent
capital structure, which provides stability and supports consistent dividend payout.
Well suited to serve the middle class We believe HEAL was well positioned to benefit from the UHC rollout in 2014, given that
its low-cost model and patient profile are very compatible with the healthcare regulation
changes. Additional patient volume growth from UHC referrals could be absorbed by its
portfolio that is skewed towards Type C hospitals (78.5%). Its profit margins remain
robust under the Indonesia Case Base Group (INA-CBG) reimbursement scheme as it
treats simpler cases. As the middle class comprises 67% of the population in 2018 (56%
in 2010), we think HEAL will benefit as its business model caters to this demographic.
The best healthcare proxy We think HEAL’s business model promises healthier earnings growth than peers, and is
well-positioned to benefit from changing demographics in the long term. The hospital
sector has de-rated by 44% since UHC was rolled out in 2014, shedding most of the
euphoric premium, in our view. We believe the conclusion of UHC rollout in 2019F should
provide more certainty and, hence, visibility which could reignite investors’ interest in the
sector. Initiate coverage with an Add rating and DCF-based TP of Rp4,000 (WACC 10%,
LTG 6%), implying 19x FY19F EV/EBITDA. Downside risks include regulatory changes.
#DO NOT Leave Any Unused Text, Para etc. below this Line! as it will appear in the Email
SOURCES: CGS-CIMB RESEARCH, COMPANY REPORTS
Indonesia
ADD
Consensus ratings*: Buy 5 Hold 0 Sell 0
Current price: Rp3,320
Target price: Rp4,000
Previous target: N/A
Up/downside: 20.5%
CIMB / Consensus: -4.8%
Reuters: HEAL.JK
Bloomberg: HEAL IJ
Market cap: US$699.0m
Rp9,870,360m
Average daily turnover: US$0.10m
Rp1,427m
Current shares o/s: 2,973m
Free float: 31.5% *Source: Bloomberg
Key changes in this note
N/A.
Source: Bloomberg
Price performance 1M 3M 12M
Absolute (%) -0.9 30.7
Relative (%) -1.7 30
Major shareholders % held Yulisar Khiat 11.8
Non Widjaja Kusuma 7.3
Binsar Parasian Simorangkir 5.8
Insert
Analyst(s)
Patricia GABRIELA
T (62) 21 3006 1734 E [email protected]
Vilhelmina T (62) 21 3006 1732 E [email protected]
Financial Summary Dec-17A Dec-18A Dec-19F Dec-20F Dec-21F
Revenue (Rpb) 2,678 3,058 3,599 4,211 4,744
Operating EBITDA (Rpb) 542 553 664 859 1,066
Net Profit (Rpb) 72.4 124.4 156.8 226.9 304.7
Core EPS (Rp) 29.2 41.8 52.7 76.3 102.5
Core EPS Growth (71.8%) 43.1% 26.0% 44.8% 34.3%
FD Core P/E (x) 95.75 72.71 62.96 43.50 32.40
DPS (Rp) 21.15 0.00 16.06 22.60 38.16
Dividend Yield 0.64% 0.00% 0.48% 0.68% 1.15%
EV/EBITDA (x) 17.81 19.76 16.72 13.27 10.78
P/FCFE (x) NA NA NA NA 720.8
Net Gearing 97.4% 23.7% 25.5% 30.4% 25.7%
P/BV (x) 18.09 5.29 4.89 4.53 4.16
ROE 8.8% 10.7% 8.1% 10.8% 13.4%
% Change In Core EPS Estimates
CIMB/consensus EPS (x) 0.90 1.15
51.0
69.8
88.5
107.3
2,300
2,800
3,300
3,800
Price Close Relative to JCI (RHS)
10
20
30
40
May-18 Aug-18 Nov-18 Jan-19
Vo
l m
Hospitals │ Indonesia
Medikaloka Hermina │ April 15, 2019
2
Healthy growth
BACKGROUND AND OVERVIEW
Company background
PT Medikaloka Hermina Tbk (HEAL) was first established in 1985 under the
licensed operation of a maternity hospital, Rumah Sakit Bersalin (RSB) Hermina.
Since then, the hospitals have undergone continuous expansion, adding beds
through new hospitals, development of existing hospitals, as well as acquisitions.
It now has 32 hospitals with 3,350 operational beds.
Under its expansion pipeline, four new hospitals will be built each year until
2020F, i.e. an additional 400 operational beds p.a. (from greenfield) to reach 40
hospitals in total. Although HEAL is more prominent in the women & children
subspecialty, its range of services include complex operating procedures,
laboratory services, radiology and imaging facilities, fertility treatment and public
health services, pharmacy, as well as diagnostic and emergency services.
HEAL is the largest private hospital group in the Greater Jakarta area and the
second largest private hospital on a national scale in terms of number of
hospitals and operational beds as at 2017. Its women & children services
provides one of the most comprehensive facilities compared to others in the
private segment, according to Frost & Sullivan in 2017.
Its operational scale allows it to be an early adopter of the Universal Healthcare
Coverage (UHC) programme while its business continues thriving. HEAL’s
EBITDA margin stayed at c.20% in 2016-18 with blended UHC patient
proportion increasing from 29% to 50% during the same period.
HEAL is the only listed hospital operator that adopts a doctor-partnership
business model (source: Frost & Sullivan). Under this scheme, doctors hold up
to 30% minority stake in each of the hospitals, which allows them to receive
dividends.
After adopting this model for more than 20 years, HEAL deems this approach
successful in retaining its main group of specialists (92% retention as of 2017),
recruiting qualified doctors, as well as preserving a loyal team of doctors and
medical staff who are familiar with each hospital’s operations. We believe this is
especially important in the midst of the scarcity of doctors observable across the
industry.
We expect HEAL to maintain its high retention rate, as their doctors benefit from
the operations of a large-scale hospital, sans worries about its management and
internal processes. This allows them to focus on their expertise while enjoying
the hospital’s growth.

Hospitals │ Indonesia
Medikaloka Hermina │ April 15, 2019
3
Figure 1: HEAL’s list of hospitals and operational beds as of 2018
Note: *RS Hermina Grand Wisata recently upgraded to Type B hospital as of Jan 2019
SOURCES: CGS-CIMB RESEARCH, COMPANY REPORTS
Hospitals in Indonesia are generally categorised into five different types – Class
A, B, C, D, and E. Different hospital types offer different facilities and are
equipped with different medical equipment. Here are the facilities provided in
each type of hospital:
- Hospital Type A: These are the top referral hospitals. They have a wide
range of specialists and subspecialists offering medical services from the
government. This is the highest form of reference available under UHC.
- Hospital Type B: Provides a wide range of specialist services, but limited
subspecialists. Type B hospitals are built in each province’s capital, to
accept referrals from regional hospitals.
- Hospital Type C: Provides limited subspecialist medical services. Type C
hospitals are built as regional hospitals to accept referral from local health
centres (Puskesmas, the first level referral under UHC referral system).
- Hospital Type D: These are hospitals in transition. They will soon convert to
Type C hospitals.
- Hospital Type E: These are special hospitals, offering only one specialised
medical service at each hospital (i.e. psychiatric, leprosy, pulmonary,
cardiology, and maternity hospitals). Most Type E hospitals are opened by
government bodies.
The UHC system currently applies the referral system for patients, making it
mandatory for patients to first visit lower ranked hospitals (Type C or D) before
they can see specialists in Type B or C hospitals.
Hospital nameCommencement of
operations (year)
Number of
operational bedsHospital type
RS Hermina Jatinegara 1985 170 B
RS Hermina Kemayoran 1995 108 B
RS Hermina Bekasi 1997 250 B
RS Hermina Depok 2000 180 B
RS Hermina Daan Mogot 2002 190 B
RS Hermina Bogor 2002 140 B
RS Hermina Grand Wisata 2009 150 *B
RS Hermina Pasteur 2004 130 C
RS Hermina Pandaran 2005 75 C
RS Hermina Tangkubanprahu 2006 85 C
RS Hermina Sukabumi 2007 95 C
RS Hermina Tangerang 2008 135 C
RS Hermina Arcamanik 2010 105 C
RS Hermina Galaxy 2010 90 C
RS Hermina Palembang 2011 150 C
RS Hermina Ciputat 2011 70 C
RS Hermina Mekarsari 2013 80 C
RS Hermina Serpong 2013 50 C
RS Hermina Banyumanik 2014 45 C
RS Hermina Solo 2014 50 C
RS Hermina Ciruas 2014 90 C
RS Hermina Yogya 2015 42 C
RS Hermina Bitung 2016 50 C
RS Hermina Makassar 2017 50 C
RS Hermina Balikpapan 2017 50 C
RS Hermina Medan 2017 50 C
RS Hermina Podomoro 2017 50 C
RS Hermina Purwokerto 2017 50 C
RS Hermina Samarinda 2018 50* C
RS Hermina Palembang 2018 50* C
RS Hermina Padang 2018 50* C
RS Hermina Lampung 2018 50* C

Hospitals │ Indonesia
Medikaloka Hermina │ April 15, 2019
4
Management profile
Most of HEAL’s directors and commissioners are experienced doctors who have
been with the company since the start in 1985. Hence, they have hands-on
knowledge and experience with hospital operations. Most of them are also the
founding partners of the company.
Figure 2: HEAL's board of commissioners
SOURCES: COMPANY REPORTS
Name Position Background
Dr. Paulus Kusuma Gunawan,
SpOG
President
Commissioner
(2017-present)
73 years. Obsgyn Specialist and General Practitioners
from University of Indonesia.
A practicing doctor in RS Hermina Jatinegara (from
1975).
Dr. Husen Sutakaria, SpOG Vice President
Commissioner
(1982-present)
77 years. Obsgyn Specialist from University of
Padjajaran and General Practitioners from University of
Indonesia.
A practicing doctor in RS Hermina Jatinegara (from
1982).
Dr. Sudarsono, SpRM Commissioner
(2012-present)
56 years. Specialist degree for Physical Medicine and
Rehabilitation and General Practitioners from University
of Indonesia.
A practicing doctor in RS Hermina Jatinegara (from
2010).
Dr. Ir. Darwin Cyrill Noerhadi, MBA Commissioner
(2017-present)
56 years. Strategic Management Doctorate degree from
University of Indonesia, MBA in Finance & Economics
from University of Houston, Bachelor degree in Oil &
Geological Engineering from Institut Teknologi Bandung.
An Independent Commissioner for PT Austindo
Nusantara Jaya Tbk (2017-present), Independent
Commissioner for PT Mandiri Sekuritas (2012-present),
and President Director in PT Creador (2011-present).
Alexander Steven Rusli, PhD, MBA Independent
Commissioner
(2018-present)
47 years. Ph.D in Information Technology, Bachelor of
Commerce (Hons) in Information Technology and
Bachelor of Business from Curtin University of
Technology.
President Director for PT Indosat, Tbk (2012-2017),
Managing Director in PT Northstar Pacific (2009-2012),
Minister's expert staff at the Indonesian Ministry of
BUMN (2007-2009), Minister's expert staff at the
Indonesian Ministry of Information and Communication
(2001-2007), and Senior Consultant in
PricewaterhouseCoopers Consulting Asia Pacific (1997-
2001).
Dr. Heridadi Independent
Commissioner
(2018-present)
65 years. Doctorate degree from the School of Medicine
of Universitas Gajah Mada, Master in Healthcare
Planning and Management, and General Practitioners
from University of Indonesia.
Head of Alumni for FKUI 1977 (2012-present), Chairman
of Purna Warga Kesehatan TNI AD (2015-present), Vice
Chairman for Relations Section of Persatuan
Purnawirawan Angkatan Darat Relations (2012-present),
Master's Degree Professor in Universitas Pertahanan
(2012-present), and Commissioner in PT Biofarma (2014-
present).

Hospitals │ Indonesia
Medikaloka Hermina │ April 15, 2019
5
Figure 3: HEAL's board of directors
SOURCES: COMPANY REPORTS
Private equity firms enter as shareholders and HEAL goes public
HEAL was listed on the Indonesia Stock Exchange (IDX) on 4 May 2018. It listed
351m ordinary shares at Rp3,700/share and raised Rp1.3tr.
Prior to this, in Sep 2017 the company went through financial restructuring with
the entry of private equity (PE) companies such as Creador Sdn Bhd through
preemptive rights issue, raising over Rp600bn. This diluted existing
shareholders’ stake by about 7.8%.
In addition to 351m ordinary shares issued for the public, 94.5m new shares
were issued for conversion of Mandatory Convertible Notes (MCN) to Apollo
Aurora Pte Ltd (Singapore) (Unlisted) and Andira Cordata Sdn Bhd (Unlisted)
and PT Sentul Cycling Klub (Unlisted). The current shareholder composition
shows that no single shareholder owns more than 15% of the total shares
outstanding. The shareholders include the company’s senior management. This
is again a unique model vs. other listed peers in Indonesia.
Under the listing covenant, it cannot issue additional shares or other instruments
that can be equivalently converted to shares within the next 12 months after the
IPO date.
Patient profile
In FY18, HEAL served a total of 5.6m patients, of which 5.3m were outpatients.
49% of total outpatients were UHC patients while 65% of total inpatient
admissions were UHC patients. Overall blended UHC patient proportion for
HEAL is 50% as of 2018, vs. Mitra Keluarga Karyasehat’s (MIKA IJ, Reduce, TP:
Rp1,450) 21% and Siloam International Hospital’s (SILO IJ, Hold, TP: Rp2,800)
27%. Note that blended UHC patient portion refers to total number of UHC
patients from both outpatient and inpatient combined, against total patients.
Name Position Background
Dr. Hasmoro, SpAn, MM, MHA President
Director (1991-
present)
75 years. Doctorate degree specialising in Anestensice
care and Anesthesia from University of Indonesia,
Master's degree focusing on Management from
Universitas Indonusa Esa Unggul, Master's degree for
Hospital Administration from IEU Institute of
Management, Anesthesia specialist from University of
Indonesia, General Practitioners University of
Padjajaran.
Member the Indonesian government team of doctors
(1979-2000).
Dr. Binsar Parasian Simorangkit,
SpOG
Medical and
Compliance
Director (1998-
present)
75 years. Obsgyn specialist and General Practitioners
from University of Indonesia.
Head of Hospital for RS Pusat Polri Raden Said
Sukanto (1994-1997).
Yulisar Khiar, SE, MARS Operational &
General Director
(1997-present)
60 years. Master's degree on Hospital Management
from University of Indonesia and Bachelor of Economics
from STIE PBM.
Vice General Director in RS Hermina Jatinegara (1985-
1997), Finance Manager in RS Hermina Hatinegara
(1983-1985).
Aristo Setiawidjaja, B.Sc, MBA Finance &
Strategic
Planning Director
(2019-present)
39 years. MBA from Dartmouth College, Bachelor's
degree in Chemical Engineering from University of
Wisconsin.
Senior Advisor position in Olympus Capital.

Hospitals │ Indonesia
Medikaloka Hermina │ April 15, 2019
6
Figure 4: Shareholder structure, pre- and post-IPO as at May 2018
Note: Employee Stock Allocation (ESA) and Management and Employee Stock Option Plan (MESOP)
SOURCES: CGS-CIMB RESEARCH, COMPANY REPORTS
Description
No of shares Nominal value (Rp) % No of shares Nominal value (Rp) %
Total Capital 10,000,000,000 1,000,000,000,000 10,000,000,000 1,000,000,000,000
Paid in Capital
Board of Commissioners:
- Husen Sutakaria 120,160,000 12,016,000,000 4.76% 104,110,500 10,411,050,000 3.40%
- Sudarsono 195,190,000 19,519,000,000 7.72% 169,118,900 16,911,890,000 5.52%
Board of Directors:
- Hasmoro 130,620,000 13,062,000,000 5.17% 113,173,300 11,317,330,000 3.70%
- Yulisar Khiat 403,830,000 40,383,000,000 15.98% 349,891,200 34,989,120,000 11.43%
- Binsar Parasian Simorangkir 199,180,000 19,918,000,000 7.88% 172,575,900 17,257,590,000 5.64%
Others:
- Non Widjaja Kusuma 250,640,000 25,064,000,000 9.92% 217,162,300 21,716,230,000 7.09%
- Soepardiman 190,570,000 19,057,000,000 7.54% 165,116,000 16,511,600,000 5.39%
- Tjiptawati Budiharta 171,820,000 17,182,000,000 6.80% 148,870,400 14,887,040,000 4.86%
- Soedibijo Toeloes 190,460,000 19,046,000,000 7.54% 165,020,700 16,502,070,000 5.39%
- Iskandar Wahidayat 125,890,000 12,589,000,000 4.98% 109,075,100 10,907,510,000 3.56%
- Raden Endjun 174,260,000 17,426,000,000 6.90% 150,984,500 15,098,450,000 4.93%
- Lydia Immanuel 197,380,000 19,738,000,000 7.81% 171,016,400 17,101,640,000 5.58%
- PT Citra Artha Niramaya 176,890,000 17,689,000,000 7.00% 79,685,800 7,968,580,000 2.60%
- Apollo Aurora (Singapore) - - 0.00% 77,167,400 7,716,740,000 2.52%
- Andira Cordata Sdn. Bhd - - 0.00% 155,095,900 15,509,590,000 5.06%
- PT Sentul Cycling Klub - - 0.00% 10,050,800 1,005,080,000 0.33%
- MHAI Master (Singapura) Pte. Ltd - - 0.00% 85,135,300 8,513,530,000 2.78%
- Brickellia Limited - - 0.00% 85,568,800 8,556,880,000 2.79%
- Masyarakat - - 0.00% 444,180,800 44,418,080,000 14.51%
- Program MESOP - - 0.00% 89,190,000 8,919,000,000 2.91%
Total Paid in Capital 2,526,890,000 252,689,000,000 100.00% 3,062,190,000 306,219,000,000 100.00%
Remaining Stocks 7,473,110,000 747,311,000,000 6,937,810,000 693,781,000,000
Before preemptive rights issue of shares, IPO, execution
of convertibles, ESA and MESOP programme, and selling
of shares by existing shareholders
After preemptive rights issue of shares, IPO, execution of
convertibles, ESA and MESOP programme, and selling of
shares by existing shareholders
Share Capital
Ordinary shares with Rp100 nominal value per stock

Hospitals │ Indonesia
Medikaloka Hermina │ April 15, 2019
7
Figure 5: Patient volume breakdown Figure 6: Inpatient and outpatient volume
contribution from UHC
Figure 7: Revenue breakdown
SOURCES: CGS-CIMB RESEARCH ESTIMATES, COMPANY
REPORTS SOURCES: CGS-CIMB RESEARCH ESTIMATES, COMPANY
REPORTS SOURCES: CGS-CIMB RESEARCH ESTIMATES, COMPANY
REPORTS
Similar to most hospitals, HEAL’s patient volume distribution has always been
dominated by outpatient visits, representing 95% of total patient volume but
outpatient visits contribute a relatively lower 33% of total revenue as at 2018.
Inpatient admissions, on the other hand, represent only 5% of total patient
volume but contribute 67% of total revenue. This percentage of volume and
revenue contribution from inpatient and outpatient has remained more or less
constant over the past three years. We expect the proportion to remain the same
in FY19-21F.
INDUSTRY OVERVIEW
Indonesia’s Universal Healthcare (UHC)
Indonesia officially launched the UHC programme – with Badan Penyelenggara
Jaminan Sosial (BJPS, Social Insurance Administration Body,) Health as its
running body – on 1 Jan 2014. Through this, the government expects 100% of
Indonesian citizens to have access to basic health coverage by 2019. The rollout
of UHC consists of a 5-year plan to fully cover all Indonesians and it has been
on track thus far (85% coverage as of 2M19).
Since its first year of operation, BPJS Health has been running a budget deficit.
One of the main reasons for this is the monthly premium fee that is set at an
affordable Rp23,000 for the subsidised populace (citizens entitled to Penerima
Bantuan Iuran, PBI), vs. the actuarial calculation of Rp36,000. Class III pays
Rp25,500/month though the actuarial estimate is more than double at Rp53,000.
Meanwhile, Class II forks out Rp51,000/month vs. the actuarially calculated fee
of Rp63,000. Though Class I is charged the same amount as that suggested
through actuarial calculations at Rp80,000/month.
In 2018 alone, BPJS Health incurred an Rp11tr deficit and received an Rp11tr
injection from the government to cover it. Given that escalating healthcare cost
outpaces premium fees, this deficit is unlikely to be resolved, in our view, unless
the government increases the monthly premium fee significantly and
continuously.
As part of the effort to manage ballooning cost, treatment curtailment has
become inevitable. The government has been pursuing this strategy (matching
disease coverage with available funding) in an effort to control the deficit
incurred by the programme.
Title:
Source:
Please fill in the values above to have them entered in your report
-
1,000
2,000
3,000
4,000
5,000
6,000
7,000
8,000
0%
10%
20%
30%
40%
50%
60%
70%
80%
90%
100%
2015 2016 2017 2018 2019F 2020F
Outpatient visits (%)
Inpatient admissions (%)
Inpatient admissions ('000)
Outpatient visits ('000)
Title:
Source:
Please fill in the values above to have them entered in your report
0%
20%
40%
60%
80%
100%
120%
140%
2016 2017 2018 2019F 2020F
Inpatient admissions Outpatient visits
Title:
Source:
Please fill in the values above to have them entered in your report
0
500
1,000
1,500
2,000
2,500
3,000
3,500
0%
10%
20%
30%
40%
50%
60%
70%
80%
90%
100%
2015 2016 2017 2018 2019F 2020F
Outpatient visits revenue (%)
Inpatient admissions revenue (%)
Inpatient admissions revenue
Outpatient visits revenue
Rp (bn)

Hospitals │ Indonesia
Medikaloka Hermina │ April 15, 2019
8
To recap, Figure 8 summarises the UHC journey, which includes recent efforts to
lower the programme’s budget deficit. Most recently in Feb 2019, the new
ministerial decree excluded two drugs that treat metastatic colorectal cancer –
Bevacizumbab and Cetuximbab – which prompted quite a number of complaints.
A few weeks later in Mar 2019, the government announced its decision to cancel
the exclusion until further notice. Meanwhile, the government is reassessing the
drugs’ effectiveness in patient life extension.
Coordination of Benefit (COB) is another term intertwined with UHC. With the
COB facility, a patient is allowed to top-up medical benefits that were originally
eligible under UHC. The surplus cost incurred from treating the patient will be
borne by the insurance company while the cost which the patient was originally
eligible for will be paid for by BPJS Health. Although the COB mechanism has
been made available since 2014, we believe that it was only put into practice this
year. The recent 2019 ministerial decree allowing patients a maximum upgrade
of one level (for example, if UHC identified a person’s eligibility to be Class III,
the maximum upgrade is to Class II) is viewed positively by industry players, as
it finally allows insurance companies to implement better pricing and hence,
attract more prospective clients.
Nevertheless, given the political will, we expect the UHC programme to continue
to be well supported by the government.
Figure 8: UHC progress – UHC system as at Apr 2019
Note: *Formularium Nasional (ForNas) is a list of drugs covered by the BPJS Health system.
SOURCES: CGS-CIMB RESEARCH, MINISTRY OF HEALTH
It is noteworthy to us that Indonesia’s UHC programme has been very well
reviewed by the international community (source: Turkey Global Leaders Award
2018) despite the disparaging headlines locally. In addition, most Indonesians
have generally been very pleased with the programme despite the long
treatment queue (source: Kompas Dec 2018).
Effective Date Item
2014All diseases are covered under UHC with exception being: aesthetic procedures and infertility
treatment
2017 Eliminate possibility for patients to choose a specific hospital from referral system.
2018Exclusion of Pediatrician treatment for healthy babies, cataract operation procedure, and
physiotheraphy
2018Exclusion and re-inclusion of Trastuzumab (breast cancer drug) from (and to) ForNas/
Formularium Nasional*
2018Implemented supply chain financing (SCF) for claim payments through coordination with
Banks. Lower down late payment charge from initial 1%.
2018 Announced re-inclusion of pediatrician service for healthy baby, cataract operation for vision
quality worse than 6/18, and physiotheraphy for a maximum of 8x visit per month in Oct18.
2019 Applicable cost for patients Rp10-20k outpatient and 10% of INA-CBG tariff for inpatient
2019 Maximum of one level up in treatment class through co-payment
2019Exclusion and re-inclusion of Bevacizumbab and Cetuximbab (metastatic colorectal cancer
drug). Drugs are currently under assessment for its effectiveness.

Hospitals │ Indonesia
Medikaloka Hermina │ April 15, 2019
9
Figure 9: Number of people covered by BPJS Health Figure 10: % of Indonesian population under coverage – 2019F
is the target for full coverage
SOURCES: CGS-CIMB RESEARCH, BPJS HEALTH SOURCES: CGS-CIMB RESEARCH, BPJS HEALTH
Applicable UHC monthly premium payments differ for each population group
(Figure 11), with main categories and their contributions detailed below.
a) Subsidised group: Rp23,000 monthly premium paid by government
b) Paid workers (Pekerja Penerima Upah, PPU)
b.1) PPU working in government institutions
Monthly premium of 5% of salary (maximum salary calculation at
Rp8m). 3% contribution from company and 2% contribution from worker.
b.2) PPU working in public or private companies
Monthly premium of 5% of salary (maximum salary calculation at
Rp8m). 4% contribution from company and 1% contribution from worker.
Additional members starting from the 4th child will be charged 1% of salary
monthly premium paid by worker.
c) Non-paid workers
Monthly premium paid by individual, depending on class preference.
d) Non-working group
Monthly premium paid by individual, depending on class preference.
Figure 11: Premium paid for UHC as at 2018
SOURCES: CGS-CIMB RESEARCH, MINISTY OF HEALTH
Title:
Source:
Please fill in the values above to have them entered in your report
133,423,653
156,790,287
171,939,254
187,982,949
215,860,046
-
50,000,000
100,000,000
150,000,000
200,000,000
250,000,000
2014 2015 2016 2017 2018
No of people
Title:
Source:
Please fill in the values above to have them entered in your report
52.3%
60.7%
66.3%71.6%
80.9%
100.0%
0%
20%
40%
60%
80%
100%
120%
2014 2015 2016 2017 2018 2019F
Title:
Source:
Please fill in the values above to have them entered in your report
Rp23,000
Rp240,000
Rp120,000
Rp320,000
Rp160,000
Rp160,000
Rp80,000
Rp80,000
Rp40,000
Rp80,000
Rp40,000
Rp80,000
Rp51,000Rp25,500
Rp80,000
Rp51,000Rp25,500
0
50,000
100,000
150,000
200,000
250,000
300,000
350,000
400,000
450,000
Cla
ss I
Cla
ss II
Cla
ss I
Cla
ss II
Cla
ss I
Cla
ss II
Cla
ss I
Cla
ss II
Cla
ss III
Cla
ss I
Cla
ss II
Cla
ss III
PBI Paid workers (PPU)in gov institutions
Paid workers (PPU)in BUMN, BUMD
and private sector
PPU additional fammembers (from 4th
child)
Non-paid workers Non working group
Paid by Government Paid by Company Paid by Individual
Rp

Hospitals │ Indonesia
Medikaloka Hermina │ April 15, 2019
10
Fragmented market
Indonesia’s healthcare industry is highly fragmented, with HEAL’s private
hospitals only representing 2.2% of the country’s private hospitals. Its
operational beds form a mere 0.8% of the country’s total beds in 2017 – despite
being the second-largest private hospital group in Indonesia. Mitra Keluarga’s
and Siloam Hospitals’ operational beds accounted for 0.7% and 1.0%,
respectively, of the country’s total beds in 2017. Given the small bed capacity of
individual hospitals and Indonesia’s growing population that continually pushes
for higher bed capacity, we expect both public and private hospital groups to
compete aggressively for a share of the expanding market.
Figure 12: Market share of private hospital groups in Indonesia (2017)
SOURCES: CGS-CIMB RESEARCH, COMPANY REPORTS, MINISTRY OF HEALTH
Figure 13: Number of national beds and % share for listed hospitals
SOURCES: CGS-CIMB RESEARCH, MINISTRY OF HEALTH, COMPANY REPORTS
Figure 14: Breakdown of hospitals in Indonesia by type - hospitals in Indonesia are
still dominated by private healthcare providers as at 2017
Note: *Government General Hospitals (GH)
SOURCES: SOURCES: CGS-CIMB RESEARCH, MINISTRY OF HEALTH
Hospital GroupMarket share (% of total
national hospitals)
Market share (% of total
national beds)
Medikaloka Hermina 1.0% 0.8%
Siloam Hospitals 1.1% 1.0%
RS Mitra Keluarga 0.7% 0.7%
RS Awal Bros 0.4% 0.6%
Mayapada Hospital 0.1% 0.1%
RS Pondok Indah 0.1% 0.1%
Title:
Source:
Please fill in the values above to have them entered in your report
0.6%0.7% 0.8%, HEAL
1.0%, SILO
0.7%, MIKA
0%
1%
290,000
295,000
300,000
305,000
310,000
315,000
320,000
325,000
330,000
335,000
340,000
345,000
2015 2016 2017
National # of operational bed (LHS) (HEAL) % of national operational bed
(SILO) % of national operational bed (MIKA) % of national operational bed
Number of beds
Title:
Source:
Please fill in the values above to have them entered in your report
Government GH, 7%
Provincial government GH,
24%
Private GH, 48%
Special hospital, 21%

Hospitals │ Indonesia
Medikaloka Hermina │ April 15, 2019
11
Doctor and bed scarcity
Indonesia has a shortage of doctors in the healthcare industry. Doctors per
1,000 capita was recorded at 0.5 in 2016, the lowest compared to neighbouring
Asian countries, i.e. Vietnam, Thailand, Malaysia, and India which were at 0.7,
0.6, 1.3, and 0.7, respectively. The Ministry of Health targets to improve the ratio
to 0.6 by 2021F (7% CAGR over FY18-21F), in part due to the government’s
2019F UHC programme. The UHC system is predicted by healthcare industry
players to increase the demand for doctors, along with an increase in number of
patients across Indonesia, as a greater part of the population utilises healthcare
services under the system.
Coupled with its relatively low doctor per capita ratio, Indonesia also has the
second-lowest ratio for hospital beds per 1,000 capita (source: CIA, Central
Intelligence Agency). In 2015, Indonesia maintained hospital beds per 1,000
capita at 1.2, about half compared to that of Singapore. We expect this to
improve by 2019F, boosted by UHC expenditure which should provide access to
health insurance for the greater public and increase the need for additional bed
capacity.
Figure 15: Doctors per 1,000 capita in
various countries (2016)
Figure 16: Hospital beds per 1,000 capita
in various countries (2015)
Figure 17: Indonesia's healthcare
expenditure as a % of GDP
SOURCES: CGS-CIMB RESEARCH, COMPANY REPORTS SOURCES: CGS-CIMB RESEARCH, CIA LIBRARY SOURCES: CGS-CIMB RESEARCH, MINISTRY OF HEALTH,
FROST & SULLIVAN ESTIMATES
Growth driven by changing demographics and improving purchasing power
The expected increase in the demand for healthcare services is the main driver
for Indonesia’s continual expansion of hospital capacity. We believe the
assumption by healthcare industry players is that additional supply can be
absorbed completely by demand, given Indonesia’s relatively low percentage of
healthcare expenditure to GDP (3.6% in 2015). Global average healthcare
expenditure as a percentage of GDP is 9.9% as at 2015 according to the World
Healthcare Organization (WHO) Global Health Expenditure Database. According
to Frost & Sullivan, Indonesia’s healthcare expenditure as a percentage of GDP
is expected to rise to 4.3% (US$50.8bn) by 2020F.
Title:
Source:
Please fill in the values above to have them entered in your report
0.5
0.6
0.7 0.7
1.3
0
0.2
0.4
0.6
0.8
1
1.2
1.4
Indonesia Thailand Vietnam India Malaysia
Title:
Source:
Please fill in the values above to have them entered in your report
0.81.2 1.3
1.92.4 2.5 2.7
3.43.8
5.8
11.5
0
2
4
6
8
10
12
14 Title:
Source:
Please fill in the values above to have them entered in your report
3.3%
3.6%
4.3%
0%
1%
2%
3%
4%
5%
2010 2015 2020F

Hospitals │ Indonesia
Medikaloka Hermina │ April 15, 2019
12
Figure 18: Comparison of healthcare expenditure per capita in different countries
(2014)
SOURCES: CGS-CIMB RESEARCH, FROST & SULLIVAN
The middle class in Indonesia represents 67% of the country’s population as at
2018 (source: Statistics Indonesia, Badan Pusat Statistik, BPS) vs. 56% in 2010,
largely due to a shift towards urbanisation. While urbanisation is highly
correlated (source: WHO) with more people moving up from the lower-income to
the middle-income class, it also translates to a rising demand for healthcare
services due to an increase in lifestyle-related diseases, such as cardiovascular
disease, cancer and diabetes, to name a few. This inevitable byproduct of
urbanisation gives rise to the need for more sophisticated medical tools for
diagnostic and treatment purposes. In turn, this creates opportunity for players in
the healthcare industry in terms of new patients and volumes.
Since the implementation of the UHC in 2014, payment methods have changed,
with the out-of-pocket proportion of national healthcare expenditure decreasing
to c.48% in 2015 (vs. 57% in 2010). Over the same period, government
spending increased from 28% to 36%. The absolute value of out-of-pocket
expense, however, has increased. This indicates a better national healthcare
insurance system, in our view, and higher demand for healthcare services due to
an overall improvement in economic growth. Moving forward, we believe the
positive outlook on the country’s economic growth, coupled with 2019F UHC
coverage, could further boost the performance of the healthcare industry.
Figure 19: Indonesia's income level distribution
Note: *Population in 2010 amounted to 234.1m individuals and **population in 2018 amounted to 266.9m individuals
SOURCES: CGS-CIMB RESEARCH, INDONESIAN BANK RESTRUCTURING AGENCY (BANK PERBANKAN NASIONAL, BPPN), BPS
Title:
Source:
Please fill in the values above to have them entered in your report
99 135 142360 420 456
2,752
3,935
9,403
0
1,000
2,000
3,000
4,000
5,000
6,000
7,000
8,000
9,000
10,000
Indonesia Philippines Vietnam Thailand China Malaysia Singapore UnitedKingdom
UnitedStates
US$
Title:
Source:
Please fill in the values above to have them entered in your report
0.5
42.14
90.1
68.6
32.8
0.8
58.7
120.1
61.5
25.8
0 20 40 60 80 100 120 140
Affluent
Middle Class
Aspiring Middle Class
Poor
Below Poverty Line
>7300
1460 -
7300
730 -
1460
278-7
30
<278
No. of individuals (m)
Per
ca
pit
a E
xpen
dit
ure
/ ye
ar
(US$
)
2018 2010

Hospitals │ Indonesia
Medikaloka Hermina │ April 15, 2019
13
Figure 20: Shift in healthcare payment schemes (pre- and post-UHC in 2010-2015)
SOURCES: CGS-CIMB RESEARCH, MINISTRY OF HEALTH
A MORE STABLE MODEL
Pursuing growth at different paces
While MIKA has expanded at a cautious pace (six new hospitals in 2015-18),
SILO is more aggressive, with the opening of 15 new hospitals over 2015-18.
HEAL’s expansion strategy is more moderate than SILO’s, opening a total of
twelve new hospitals during the same period. We believe this strategy strikes the
right balance between development and growth while also supporting stable
margins. HEAL’s gross profit/EBITDA grew at a CAGR of 22%/20% over 2015-
18, much higher than peers, MIKA and SILO, at 10%/12% and 18%/9% over the
same period – mostly due to the balance between expansion and the proportion
of mature hospitals in the group’s portfolio. HEAL’s revenue growth was also at
a faster CAGR of 21.4% in 2015-18 (vs. MIKA’s and SILO’s CAGR at 8.2% and
12.9%, respectively, in the same period).
Figure 21: Comparison of HEAL, MIKA & SILO expansion plans,
based on respective companies’ guidance
Figure 22: HEAL's mature hospitals as a % of total hospitals vs.
expansion
SOURCES: CGS-CIMB RESEARCH, COMPANY REPORTS SOURCES: CGS-CIMB RESEARCH ESTIMATES, COMPANY REPORTS
Title:
Source:
Please fill in the values above to have them entered in your report
0%
10%
20%
30%
40%
50%
60%
70%
0
50
100
150
200
250
300
350
400
450
2010 2011 2012 2013 2014 2015
Spending by Government (LHS) Spending from Out of pocket (LHS)
Spending by Private companies/ insurance (LHS) % Contribution from Government
% Contribution from Out of pocket expense % Contribution from Private/ insurance companies
Rptr
Title:
Source:
Please fill in the values above to have them entered in your report
22
24 28
32
36
40
20
23
31
35
40 42
12 12 12
21
27
33
0
5
10
15
20
25
30
35
40
45
2015 2016 2017 2018 2019F 2020F
SILO MIKA HEAL
No. of hospitals
Title:
Source:
Please fill in the values above to have them entered in your report54.5%
58.3%
57.1%
50.0% 50.0%
52.5%
44%
46%
48%
50%
52%
54%
56%
58%
60%
0
5
10
15
20
25
30
35
40
45
2015 2016 2017 2018 2019F 2020F
Total no of hospitals No. of new hospitals % of mature hospitals (RHS)
No. of hospitals

Hospitals │ Indonesia
Medikaloka Hermina │ April 15, 2019
14
Greenfield expansion/hospital acquisition tends to lead to margin contraction, in
our view. The opening of new hospitals causes G&A expense (fixed costs) to
spike while revenue lags as patient traffic tends to be slower initially for new
hospitals. The opening of many new hospitals can have an adverse impact on
profitability. This was seen in SILO’s aggressive expansion in 2017 when it
opened eight new hospitals, which caused operating expense to rise to 36.7%
(vs. 2016’s 33.1%) while revenue grew by only 3% yoy. This is compared to
HEAL’s operating expense at 29.5% of revenue and 20% revenue growth for the
same period.
In HEAL’s case, its well-paced expansion has allowed for solid earnings growth.
This allows it to maintain a better proportion of mature hospitals in its portfolio. In
2015-18, HEAL’s mature hospitals formed 50-58% of its portfolio (Figure 23),
compared to SILO’s 30%. Mature hospitals, unlike new ones, contribute the
majority of revenue and are important, especially during the expansion period
when most new hospitals contribute losses.
To further illustrate, in 2015, six out of a total of 22 hospitals of HEAL’s oldest
hospitals that had operating for more than 10 years contributed to 52% of total
revenue. While we expect the proportion of HEAL’s mature hospitals to decline
to c.50% of total hospitals in 2019F due to the opening of four new hospitals in
both years (FY18-19F), we do not expect much erosion on profitability due to its
strategy of focusing on volumes instead of profit.
Figure 23: HEAL’s revenue contribution from mature hospitals
SOURCES: CGS-CIMB RESEARCH, COMPANY REPORTS
Consistency and predictability
HEAL uses a simple and standardised design for its hospital buildings, which
allows it to benefit from cost efficiencies. In FY17, while its competitors MIKA
and SILO spent Rp300bn capex to build a new hospital, HEAL spent Rp150bn
for each new hospital (average cost per bed for HEAL is Rp0.91bn, vs. Rp1.5bn
for SILO and MIKA over a 5-year expansion period). We note that average cost
per bed is higher in the first phase of hospital operations due to land acquisition.
The impact of lower capex per new hospital is a shorter payback period, given
similar profitability profile (based on patient volume and cost of treatment) as its
competitors, in this case SILO. In 2019F, we expect HEAL’s ROE/ROIC to be
more attractive at 6%/11% compared to SILO’s 1.2%/1.9%, based on our
estimates.
Title:
Source:
Please fill in the values above to have them entered in your report52.0% 51.1%
48.4%
54.5%
58.3% 57.1%
0%
10%
20%
30%
40%
50%
60%
70%
2015 2016 2017
Revenue contribution from (Top 6) oldest hospitals Mature hospitals as a % of total hospitals

Hospitals │ Indonesia
Medikaloka Hermina │ April 15, 2019
15
Figure 24: Comparison of hospitals' profitability matrix
SOURCES: CGS-CIMB RESEARCH ESTIMATES, COMPANY REPORTS
Although MIKA’s historical performance suggests higher profitability in terms of
both ROIC and ROE, its future profitability may not be replicable, in our view, as
the company just started accepting more UHC patients through Kasih Group
(acquired in 4Q17) which we believe may hurt margins.
Focused market segment
HEAL has generally always been persistent in targeting the middle class, and
focusing more on patient volumes than margins, in our view. In 2018, MIKA and
SILO’s blended proportion of UHC patients amounted to around 21% and 28%,
respectively. In the same period, HEAL maintained a 50% blended UHC
proportion (65% of total inpatient admissions and 49% of outpatient visits), which
we attribute to being an early adopter of the programme.
Its proportion of UHC patients has risen to 50% as at 2018 and we believe it is
unlikely to increase further. UHC patients tend to mean slower per patient
revenue growth, thus a saturated proportion of UHC patient revenue is positive,
in our view. A recovery in private sector patients could also provide upside risk
for the company.
HEAL’s approach to market positioning is different from MIKA and SILO, which
have continual fluctuations in their allocated portion of UHC patients. SILO
started allocating 10% of total patient volume to UHC patients in 2015, while
MIKA extended its services for UHC patients in 4Q17.
Figure 25: Higher UHC contribution tends to lower revenue per
patient…
Figure 26: … which results in modest revenue growth from
pricing because as the number of patients from BPJS increases,
revenue per patient grows at a slower pace.
SOURCES: CGS-CIMB RESEARCH ESTIMATES, COMPANY REPORTS SOURCES: CGS-CIMB RESEARCH ESTIMATES, COMPANY REPORTS
ROE 2015 2016 2017 2018 2019F 2020F
HEAL N/A 5.6% 8.8% 7.5% 6.3% 8.3%
MIKA 22.5% 20.1% 17.7% 14.5% 15.7% 17.7%
SILO 4.1% 3.5% 2.0% 0.3% 1.2% 1.2%
ROIC 2015 2016 2017 2018 2019F 2020F
HEAL N/A 15.8% 16.4% 13.2% 11.4% 14.0%
MIKA 61.7% 40.4% 23.2% 18.5% 21.3% 25.3%
SILO 6.5% 7.6% 3.9% 0.8% 1.9% 2.7%
Title:
Source:
Please fill in the values above to have them entered in your report
7.47.5
7.37.1 7.1
0.25 0.230.20 0.16 0.15
29%
45%50% 50% 50%
0%
10%
20%
30%
40%
50%
60%
0
1
2
3
4
5
6
7
8
2016 2017 2018 2019F 2020F
Avg revenue per inpatient Avg revenue per outpatient
BPJS contribution (RHS)
Rp m
Title:
Source:
Please fill in the values above to have them entered in your report
2.5%
-2.6%
-2.8%
0.0%
2.0%
-9.3%
-12.7%
-20.9%
-5.0%
0.0%
0%
10%
20%
30%
40%
50%
60%
-25%
-20%
-15%
-10%
-5%
0%
5%
2016 2017 2018 2019F 2020F
per Inpatient revenue growth (%) per Outpatient revenue growth (%)
BPJS contribution (%)
Hospitals │ Indonesia
Medikaloka Hermina │ April 15, 2019
16
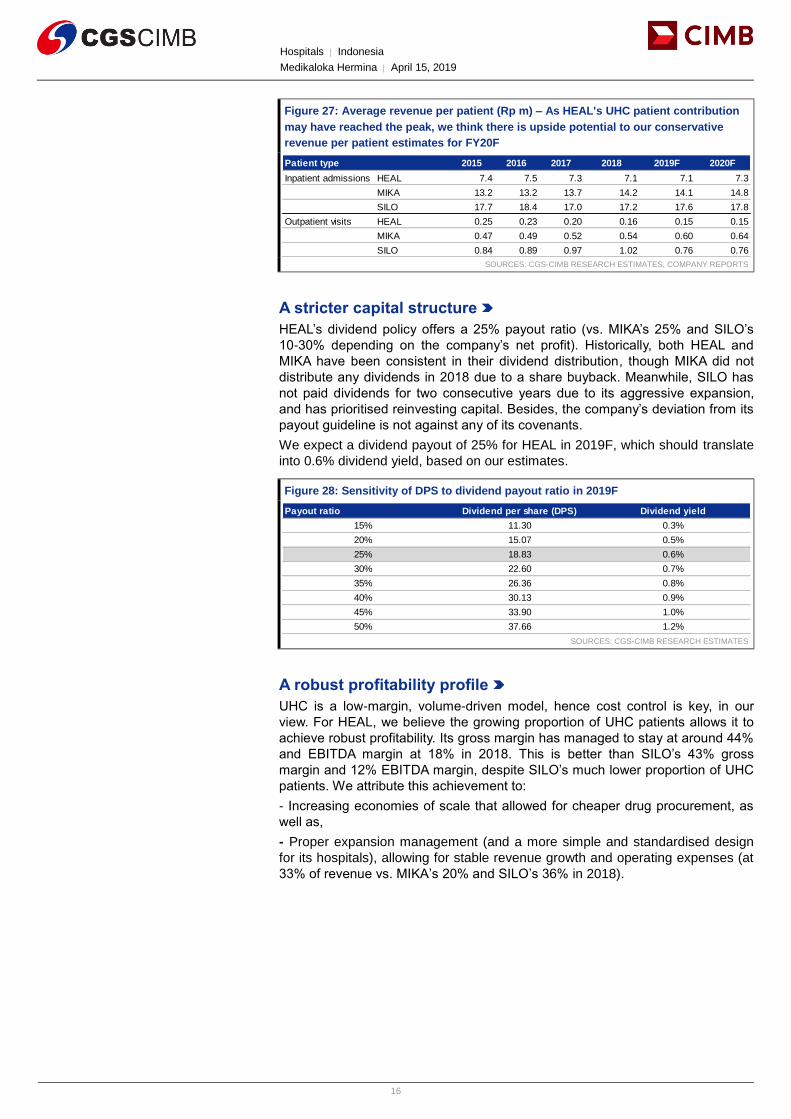
Figure 27: Average revenue per patient (Rp m) – As HEAL's UHC patient contribution
may have reached the peak, we think there is upside potential to our conservative
revenue per patient estimates for FY20F
SOURCES: CGS-CIMB RESEARCH ESTIMATES, COMPANY REPORTS
A stricter capital structure
HEAL’s dividend policy offers a 25% payout ratio (vs. MIKA’s 25% and SILO’s
10-30% depending on the company’s net profit). Historically, both HEAL and
MIKA have been consistent in their dividend distribution, though MIKA did not
distribute any dividends in 2018 due to a share buyback. Meanwhile, SILO has
not paid dividends for two consecutive years due to its aggressive expansion,
and has prioritised reinvesting capital. Besides, the company’s deviation from its
payout guideline is not against any of its covenants.
We expect a dividend payout of 25% for HEAL in 2019F, which should translate
into 0.6% dividend yield, based on our estimates.
Figure 28: Sensitivity of DPS to dividend payout ratio in 2019F
SOURCES: CGS-CIMB RESEARCH ESTIMATES
A robust profitability profile
UHC is a low-margin, volume-driven model, hence cost control is key, in our
view. For HEAL, we believe the growing proportion of UHC patients allows it to
achieve robust profitability. Its gross margin has managed to stay at around 44%
and EBITDA margin at 18% in 2018. This is better than SILO’s 43% gross
margin and 12% EBITDA margin, despite SILO’s much lower proportion of UHC
patients. We attribute this achievement to:
- Increasing economies of scale that allowed for cheaper drug procurement, as
well as,
- Proper expansion management (and a more simple and standardised design
for its hospitals), allowing for stable revenue growth and operating expenses (at
33% of revenue vs. MIKA’s 20% and SILO’s 36% in 2018).
Patient type 2015 2016 2017 2018 2019F 2020F
Inpatient admissions HEAL 7.4 7.5 7.3 7.1 7.1 7.3
MIKA 13.2 13.2 13.7 14.2 14.1 14.8
SILO 17.7 18.4 17.0 17.2 17.6 17.8
Outpatient visits HEAL 0.25 0.23 0.20 0.16 0.15 0.15
MIKA 0.47 0.49 0.52 0.54 0.60 0.64
SILO 0.84 0.89 0.97 1.02 0.76 0.76
Payout ratio Dividend per share (DPS) Dividend yield
15% 11.30 0.3%
20% 15.07 0.5%
25% 18.83 0.6%
30% 22.60 0.7%
35% 26.36 0.8%
40% 30.13 0.9%
45% 33.90 1.0%
50% 37.66 1.2%

Hospitals │ Indonesia
Medikaloka Hermina │ April 15, 2019
17
Figure 29: HEAL’s EBITDA margin is
stable despite growing UHC contribution
Figure 30: HEAL's economies of scale
allows its avg. cost per patient (for drugs)
to decline
Figure 31: Rise in operating expenses is
aligned with growing revenue
SOURCES: CGS-CIMB RESEARCH ESTIMATES, COMPANY
REPORTS SOURCES: CGS-CIMB RESEARCH ESTIMATES, COMPANY
REPORTS SOURCES: CGS-CIMB RESEARCH ESTIMATES, COMPANY
REPORTS
MIKA’s EBITDA margin was the highest among the three at 36% in 2018.
However, moving forward, we have increasing concerns that this could decline
due to the company’s attempts to diversify its patient portfolio and extend
services to reach more UHC patients.
More able to ride UHC growth
2019 is the final year of the implementation of the government’s UHC initiative.
However, as UHC has been running at a deficit since its commencement in
2014, the government has been introducing a number of follow-up ministerial
decrees in order to suppress its ballooning deficit. As a hospital with high
exposure to UHC patients, HEAL is more vulnerable towards changes in
healthcare regulations, in our view. Yet, we see HEAL weathering the regulatory
changes. Patient volume managed to increase at a CAGR of 24% over FY15-18,
resulting in overall revenue CAGR of 21% in the same period (vs. MIKA’s 8%
and SILO’s 13%).
The steady growth, in our view, is mostly due to the referral system and disease
curtailment (listed above) under UHC. We believe HEAL’s hospital profile, which
is highly concentrated in type C hospitals (the first referral for general hospitals
under UHC) (81.3%, or 26 out of 32 hospitals in 2018), provides upside to its
patient base and profitability mix. A less complicated case mix results in higher
margins under the Indonesia Case Base Group (INA-CBG, which defines the
standard tariff under the UHC system) reimbursement scheme. On the other
hand, the effect on disease curtailment could lead to an improvement in the
hospital’s trade receivables from 25.4% of revenue in 2018 to 23% of revenue in
2019F, based on our estimates. This is based on the expectation that hospitals
will receive more upfront payments from patients (both out-of-pocket and
through insurance companies). We also expect better cashflow management by
BPJS Health to lead to stable receivable days at 84 in 2019F.
With 85% UHC coverage now, we are seeing extremely high waiting times,
especially when patients are seeking treatment for non-catastrophic diseases.
We expect to see a gradual increase in private healthcare services given the
separate queues for UHC and private patients, as seen over the past four
quarters, according to HEAL. Thus, we expect HEAL to maintain its strong
reputation and patient base, and streamline its efforts to focus on retention
instead of patient acquisition.
Title:
Source:
Please fill in the values above to have them entered in your report
19.7% 20.2%18.1% 18.4%
20.4%
29%
45%
50% 50% 50%
0%
10%
20%
30%
40%
50%
60%
2016 2017 2018 2019F 2020F
BPJS contribution (%) EBITDA margin (%)
Title:
Source:
Please fill in the values above to have them entered in your report
160.0
153.9
147.0
143.3
146.2
130
135
140
145
150
155
160
165
2016 2017 2018 2019F 2020F
Avg cost per patient
Rp m
Title:
Source:
Please fill in the values above to have them entered in your report31%
20%
14%
18%
17%
33%
16%
27%
18%
16%
0%
5%
10%
15%
20%
25%
30%
35%
2016 2017 2018 2019F 2020F
Revenue growth Operating expenses growth
Hospitals │ Indonesia
Medikaloka Hermina │ April 15, 2019
18
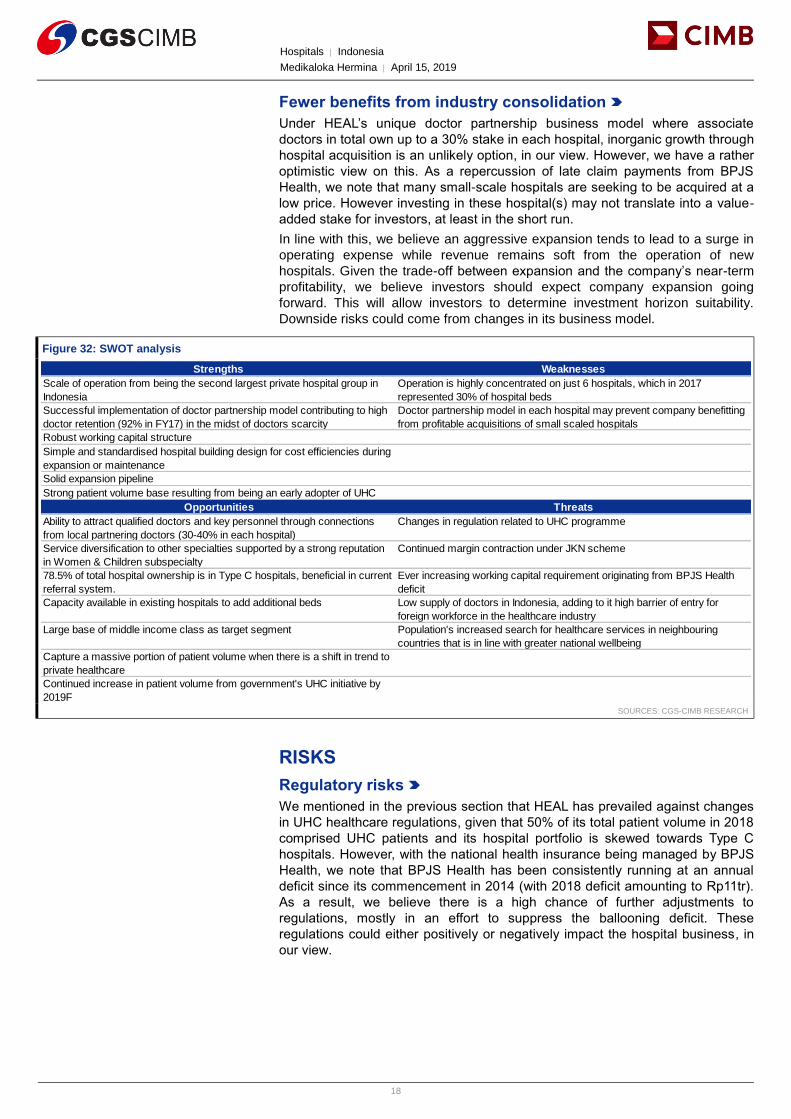
Fewer benefits from industry consolidation
Under HEAL’s unique doctor partnership business model where associate
doctors in total own up to a 30% stake in each hospital, inorganic growth through
hospital acquisition is an unlikely option, in our view. However, we have a rather
optimistic view on this. As a repercussion of late claim payments from BPJS
Health, we note that many small-scale hospitals are seeking to be acquired at a
low price. However investing in these hospital(s) may not translate into a value-
added stake for investors, at least in the short run.
In line with this, we believe an aggressive expansion tends to lead to a surge in
operating expense while revenue remains soft from the operation of new
hospitals. Given the trade-off between expansion and the company’s near-term
profitability, we believe investors should expect company expansion going
forward. This will allow investors to determine investment horizon suitability.
Downside risks could come from changes in its business model.
Figure 32: SWOT analysis
SOURCES: CGS-CIMB RESEARCH
RISKS
Regulatory risks
We mentioned in the previous section that HEAL has prevailed against changes
in UHC healthcare regulations, given that 50% of its total patient volume in 2018
comprised UHC patients and its hospital portfolio is skewed towards Type C
hospitals. However, with the national health insurance being managed by BPJS
Health, we note that BPJS Health has been consistently running at an annual
deficit since its commencement in 2014 (with 2018 deficit amounting to Rp11tr).
As a result, we believe there is a high chance of further adjustments to
regulations, mostly in an effort to suppress the ballooning deficit. These
regulations could either positively or negatively impact the hospital business, in
our view.
Strengths Weaknesses
Scale of operation from being the second largest private hospital group in
Indonesia
Operation is highly concentrated on just 6 hospitals, which in 2017
represented 30% of hospital beds
Successful implementation of doctor partnership model contributing to high
doctor retention (92% in FY17) in the midst of doctors scarcity
Doctor partnership model in each hospital may prevent company benefitting
from profitable acquisitions of small scaled hospitals
Robust working capital structure
Simple and standardised hospital building design for cost efficiencies during
expansion or maintenance
Solid expansion pipeline
Strong patient volume base resulting from being an early adopter of UHC
Opportunities Threats
Ability to attract qualified doctors and key personnel through connections
from local partnering doctors (30-40% in each hospital)
Changes in regulation related to UHC programme
Service diversification to other specialties supported by a strong reputation
in Women & Children subspecialty
Continued margin contraction under JKN scheme
78.5% of total hospital ownership is in Type C hospitals, beneficial in current
referral system.
Ever increasing working capital requirement originating from BPJS Health
deficit
Capacity available in existing hospitals to add additional beds Low supply of doctors in Indonesia, adding to it high barrier of entry for
foreign workforce in the healthcare industry
Large base of middle income class as target segment Population's increased search for healthcare services in neighbouring
countries that is in line with greater national wellbeing
Capture a massive portion of patient volume when there is a shift in trend to
private healthcare
Continued increase in patient volume from government's UHC initiative by
2019F
Hospitals │ Indonesia
Medikaloka Hermina │ April 15, 2019
19
Demographics and globalisation
Globalisation could lead to a pick-up in medical tourism to neighbouring
countries (i.e. Singapore, Malaysia, or Thailand) which are perceived to offer
superior quality, in our view, but with premium pricing – a downside to local
hospital patient volumes. So far, we have not seen nor do we expect this trend to
materialise, at least not in the next 12 months, as the affluent population still
represents a minuscule 0.3% of the total population (as at 2018).
Development risks
Risks embedded in the development of each greenfield hospital are timing and
licensing. Our channel checks suggest that construction of one hospital in
Indonesia takes around 12-18 months. If a company faces a delay in
construction or fixed costs, including the initial hiring of employees, this could
significantly raise operating expense – with no income support, in our view. We
believe this execution risk could have a significant impact, given the company’s
expansion guidelines (four new hospitals each year) until 2020F. The company
has stated that land acquisition has been secured for all of its expansion sites.
FORECASTS AND FINANCIALS
Net profit CAGR of 35% in FY18-21F
We project HEAL’s revenue to grow at a CAGR of 16% in 2018-21F – with
2019F revenue up by 18% yoy (vs. 2018’s 14% yoy). The company targets to
open four new hospitals this year, which we think could bring 2019F operational
beds to c.3,800. As we expect the 2019F occupancy rate to improve to 68% (vs.
66% in 2018), patient volume could grow by 15% yoy (vs. 2018’s 18%), based
on our estimates.
We forecast average per patient revenue growth at 0%/-5% for
inpatient/outpatient in 2019F (vs. 2018’s -3%/-21%). The improvement in per
patient revenue is due to the stabilising UHC proportion at 65%/49% for
inpatient/outpatient, as well as some tax adjustments that are no longer
expected in 2019F, according to management. We note that HEAL faced a deep
correction in outpatient revenue in 4Q18. Its outpatient revenue declined by 33%
yoy as the company incurred some tax adjustments in the quarter. Excluding this
adjustment, outpatient revenue declined by 9% yoy (vs. 9M18’s 1%).
HEAL’s economies of scale should bring its cost of revenue down, at a projected
0.5% pt yoy rate in 2019F, resulting in a GPM improvement to 44.8% (+0.2% pt
yoy). 2019F opex as a percentage of revenue may rise by 0.2% pt yoy due to
the opening of new hospitals, but 2019F EBIT margin should remain stable at
11.7% (vs. 2018’s 11.4%), based on our estimates.
Our 2019F net profit forecast is 18% below the Bloomberg consensus estimates,
mostly due to our recognising 70% of attributable net profit to the parent list co.
Other major differences relative to consensus forecasts, are our expectations of
higher cost savings as a result of economies of scale leading to a 44.8% 2019F
GPM (vs. consensus’ 42.9%), and a 2019F tax rate of around 31%, similar to
2018’s (vs. consensus which appears to be projecting a tax rate of 51%, in our
view).

Hospitals │ Indonesia
Medikaloka Hermina │ April 15, 2019
20
Figure 33: Our forecast assumptions
SOURCES: CGS-CIMB RESEARCH ESTIMATES, COMPANY REPORTS
FY18 net profit exceeded consensus
HEAL’s 2018 net profit reached Rp124bn, up 28% yoy. The results were above
Bloomberg consensus estimates by 117%. Meanwhile, revenue of Rp3.1tr
(+14% yoy) was in line with consensus forecasts.
Total patient volume grew by 18% yoy in 2018, with inpatient at +28% yoy and
outpatient at +18%, yoy. Its revenue per patient still declined, however- inpatient
by -3% yoy and outpatient by -21% yoy. The deep decline in outpatient revenue
was a result of the tax adjustment for pharmaceutical sales, as mentioned
above.
In terms of profitability, 2018 GPM rose 0.7% pt yoy. However, operating
expenditure as a percentage of revenue, spiked by 3.3% pts yoy (due to the
opening of four new hospitals), resulting in 2018 EBIT margin dropping by 2.7%
pts yoy to 11.4%. All in, 2018 net margin still improved as the company’s tax rate
fell from 38% in 2017 to 31%.
Figure 34: HEAL's FY18 results
SOURCES: CGS-CIMB RESEARCH, COMPANY REPORTS
2019F 2020F 2021F
No. of new hospitals 4 4 -
Total no. of hospitals 36 40 40
Total operational bed 3,778 4,178 4,378
Occupany rate 68% 72% 76%
Avg length of inpatient stay (ALoS) 2.5 2.5 2.5
Patient volume
Inpatient admissions 375 439 486
Outpatient visits 6,095 6,705 7,375
Avg. revenue per patient (Rpm)
Inpatient 7.14 7.28 7.43
Outpatient 0.15 0.15 0.15
FYE Dec (Rp bn) 4Q18 4Q17 yoy % 3Q18 qoq % 4QFY18 4QFY17 yoy %
chg chg Cum Cum chg
Revenue 770 714 7.7% 770.91 -0.1% 3,058 2,678 14.2%
COGS (409) (393) (441.49) (1,704) (1,509)
Gross profit 361 321 12.3% 329 9.6% 1,354 1,169 15.8%
Gross margin (%) 46.9% 45.0% 42.7% 44.3% 43.6%
Operating expenses (300) (222) (232.37) (1,004) (791)
EBITDA 122 150 -18.5% 147 -16.5% 553 542 2.1%
EBITDA margin (%) 15.9% 21.0% 19.0% 18.1% 20.2%
Depr & amort. 61 51 49.45 203 164
EBIT 61 99 -38.0% 97 -36.7% 350 378 -7.3%
EBIT margin (%) 8.0% 13.9% 12.6% 11.4% 14.1%
Interest expense (23) (40) (19.82) (131) (115)
Interest income 4 1 6.14 20 9
Others 20 (3) (1.87) 36 8
Pretax profit 62 57 9.8% 81.52 -23.5% 276 279 -1.2%
Tax (33) (31) (17.91) (85) (105)
Tax rate (%) -53.4% -54.3% -22.0% (0) (0)
Minority interests 15 39 22.47 67 101
Net profit 14 12 18.7% 41 -65.6% 124 98 27.5%
Core net profit 14 12 18.7% 41 -65.6% 124 98 27.5%

Hospitals │ Indonesia
Medikaloka Hermina │ April 15, 2019
21
Impact of BPJS deficit
Under UHC, potential patients utilising the facility are either charged a small
amount (new regulations in 2019F) or are free of charge. The remaining cost of
services incurred by patients is regarded by the hospital as trade receivables
from BPJS Health. Hence, the BPJS deficit – and consequently, late payments –
has almost an immediate impact on the hospital’s working capital. This is a
common issue among healthcare industry players, which has led to a rise in the
acquisition of small-scale hospitals by major players.
We expect HEAL’s receivable days to improve from 2019F, on the back of
changes in BPJS Health regulations, as well as expectations of a recovery in
private healthcare services, translating to an increase in contribution from out-of-
pocket expenses and private insurance companies (with a stricter payment
scheme). We expect its receivables to stay at 84 days in 2019F from an
increasing trend of 43/60/84 days in 2016/17/18.
Figure 35: HEAL's payables, receivables, and inventory days
SOURCES: CGS-CIMB RESEARCH ESTIMATES, COMPANY REPORTS
Efficiency drive
Historically, trade payable days (Figure 35) have shown a prolonged time for the
company to pay off its liabilities from an average of 115 days to 144 days in
2016-17. BPJS Health’s deficit has also contributed to a historical increase in
trade payable days, with hospitals often being forced to delay payments to
pharmaceutical companies due to the late payments received from BPJS Health.
However, we expect HEAL’s payable days to decrease in 2019F as
pharmaceutical companies are drawing attention to the necessity for the
government to control reimbursements to pharma and avoid cashflow problems
for pharmaceutical companies, especially taking into account payment
extensions from pharma suppliers overseas whereby Indonesia just represents a
mere 1% of their distribution.
Funding risk
Management guides for an optimal level of net debt-to-EBITDA ratio of 1-1.3x in
FY19F, taking into account the required funding for its expansion. In 2017, the
ratio exceeded its optimal level at 2x, but 2018 was back to 0.9x. We expect its
net debt-to-EBITDA to reach 0.9x in 2019F and 1x in 2020F – within its optimal
level.
Title:
Source:
Please fill in the values above to have them entered in your report
0
20
40
60
80
100
120
140
160
2016 2017 2018 2019F 2020F
Inventory days Receivable days Payables days

Hospitals │ Indonesia
Medikaloka Hermina │ April 15, 2019
22
Figure 36: HEAL’s net debt-to-EBITDA ratio
SOURCES: CGS-CIMB RESEARCH ESTIMATES, COMPANY REPORTS
Free cash flow to turn positive by 2019F
HEAL’s free cash flow (FCF) has historically been negative; it reached -Rp654bn
in 2018 and -Rp212bn in 2017. However, we expect FCF to turn positive in
2019F at Rp9bn.
Its 2020F FCF may return to negative territory, but should recover in 2021F as
we expect to see lower capex (the company guides for brownfield expansion
starting in 2021F).
Figure 37: HEAL's FCF vs. capex % to revenue
SOURCES: CGS-CIMB RESEARCH ESTIMATES, COMPANY REPORTS
VALUATION AND RECOMMENDATION
Sector has de-rated by 44% since UHC implementation
Despite contributing to society’s welfare (improving national health status), the
introduction of the UHC programme has deteriorated the healthcare industry’s
valuation, in our view. The sector traded at 22x forward EV/EBITDA in Jan 2014
but now trades at 12.3x forward EV/EBITDA (at -2 s.d. below its historical 5-year
mean of 26x). We believe the de-rating was mainly driven by investor’s concerns
over the impact of the BPJS deficit on working capital insufficiency (liquidity) and
lower profitability resulting from changes in the patient mix.
Title:
Source:
Please fill in the values above to have them entered in your report
0.9x
1.8x
1.0x 1.0x 1.0x
-
0.2
0.4
0.6
0.8
1.0
1.2
1.4
1.6
1.8
2.0
2016 2017 2018 2019F 2020F
Title:
Source:
Please fill in the values above to have them entered in your report
(74)
(212)
(654)
9
(41)21%
26%
23%19%
17%
0%
5%
10%
15%
20%
25%
30%
(700)
(600)
(500)
(400)
(300)
(200)
(100)
-
100
2016 2017 2018 2019F 2020F
FCFF (Rp bn) Capex % to revenue (RHS)

Hospitals │ Indonesia
Medikaloka Hermina │ April 15, 2019
23
Figure 38: Healthcare sector forward EV/EBITDA de-rated as
BPJS Health deficit ballooned
Figure 39: …as did the sector’s forward P/E valuation
SOURCES: CGS-CIMB RESEARCH, BLOOMBERG SOURCES: CGS-CIMB RESEARCH, BLOOMBERG
Figure 40: MIKA’s forward EV/EBITDA Figure 41: MIKA’s forward P/E
SOURCES: CGS-CIMB RESEARCH, BLOOMBERG SOURCES: CGS-CIMB RESEARCH, BLOOMBERG
Figure 42: SILO’s forward EV/EBITDA Figure 43: SILO's forward P/E
SOURCES: CGS-CIMB RESEARCH, BLOOMBERG SOURCES: CGS-CIMB RESEARCH, BLOOMBERG
Title:
Source:
Please fill in the values above to have them entered in your report
-
5
10
15
20
25
30
35
40
45
Healthcare - rolling fwd EV/EBITDA 5-year mean
+1 s.d. +2 s.d.
-1 s.d. -2 s.d.
x
15x
12x
19x
26x
34x
41x
22x
Title:
Source:
Please fill in the values above to have them entered in your report
(100)
(50)
-
50
100
150
200
250
300
Healthcare - rolling fwd P/E 5-year mean
+1 s.d. +2 s.d.
-1 s.d. -2 s.d.
x
51x
-40x
26x
156x
221x
173x
Title:
Source:
Please fill in the values above to have them entered in your report
10
15
20
25
30
35
40
45
50
55
Mar-
15
May-
15
Jul-15
Sep-1
5
Nov-
15
Jan-1
6
Mar-
16
May-
16
Jul-16
Sep-1
6
Nov-
16
Jan-1
7
Mar-
17
May-
17
Jul-17
Sep-1
7
Nov-
17
Jan-1
8
Mar-
18
May-
18
Jul-18
Sep-1
8
Nov-
18
Jan-1
9
Mar-
19
Rolling EV/EBITDA 5-year mean +1 s.d.
+2 s.d. -1 s.d. -2 s.d.
x
25x
17x
25x
34x
42x
51x
40x
Title:
Source:
Please fill in the values above to have them entered in your report
-
10
20
30
40
50
60
70
Mar-
15
May-
15
Jul-15
Sep-1
5
Nov-
15
Jan-1
6
Mar-
16
May-
16
Jul-16
Sep-1
6
Nov-
16
Jan-1
7
Mar-
17
May-
17
Jul-17
Sep-1
7
Nov-
17
Jan-1
8
Mar-
18
May-
18
Jul-18
Sep-1
8
Nov-
18
Jan-1
9
Mar-
19
Rolling P/E 5-year mean +1 s.d.
+2 s.d. -1 s.d. -2 s.d.
x
41x
33x
41x
57x
65x
49x
Title:
Source:
Please fill in the values above to have them entered in your report
-
5
10
15
20
25
30
35
40
Rolling EV/EBITDA 5-year mean +1 s.d.
+2 s.d. -1 s.d. -2 s.d.
x
5x
2x
10x
19x
27x
36x
24x
Title:
Source:
Please fill in the values above to have them entered in your report
(100)
-
100
200
300
400
500
600
700
800
Rolling P/E 5-year mean +1 s.d.
+2 s.d. -1 s.d. -2 s.d.
x
76x
-24x
90x
204x
318x
432x
168x

Hospitals │ Indonesia
Medikaloka Hermina │ April 15, 2019
24
After the general elections in Apr 2019, if the incumbent wins, we believe the
healthcare sector could gain some traction given that Mr. Jokowi is likely to
focus on the industry, in our view. This could lead to an increase in premium
membership fees and fee adjustments to INA-CBG reimbursement program,
which may help to improve hospital profitability. The new regulations on cost
sharing should help to improve hospital receivables as well – though the impact
could be minimal, in our view. As a result, we expect the sector to re-rate by
2019F.
Initiate coverage with an Add rating
We initiate coverage on HEAL with an Add rating and target price of Rp4,000
based on DCF valuation (WACC 10%, LTG 6%), implying 19x FY19F
EV/EBITDA (given 70% ownership) or 27x FY19F EV/EBITDA given 100%
ownership). The stock currently trades at 23x FY19F EV/EBITDA (assuming
70% ownership) or 16x FY19 EV/EBITDA (based on consolidated 100%
ownership), at a 23% discount to MIKA’s 30x FY19F EV/EBITDA but at a 188%
premium over SILO’s 8x FY19F EV/EBITDA. Nevertheless, HEAL offers a net
profit CAGR of 35% in 2018-21F (vs. MIKA’s 13%) – much more attractive
compared to peers.
We view HEAL as a good proxy for Indonesia’s healthcare industry as it is the
second-largest hospital group in terms of number of hospitals and operational
beds. It is also a good proxy for the UHC programme. As a first-mover, we
believe its revenue per patient has limited downside risk, unlike peers whose
revenue per patient may still decline, underpinned by rising contribution from
UHC patients. Its four new hospitals p.a. should support earnings growth without
much erosion on overall profitability, in our view.
Figure 44: Our DCF assumptions
SOURCES: CGS-CIMB RESEARCH ESTIMATES, COMPANY REPORTS
Risk free rate 8%
Market risk premium 7%
Equity beta 0.32
Cost of equity 10%
Cost of debt 13%
Cost of debt (1-T) 9%
Target debt 33%
Target equity 67%
Tax rate 31%
WACC 10%
LTG 6.0%
Assumptions

Hospitals │ Indonesia
Medikaloka Hermina │ April 15, 2019
25
Figure 45: DCF-based target price
SOURCES: CGS-CIMB RESEARCH ESTIMATES
DCF sensitivity to long-term growth rate (LTG)
We assume a 6% LTG, which we believe is reasonably conservative compared
to Indonesia’s nominal GDP growth of c.9.5% in FY18E and Bloomberg
consensus estimates of Indonesia’s GDP growth in FY20-21F of 8-9% (real
growth of 5-5.5% and inflation at 3-3.5%). Given the country’s relatively low
healthcare expenditure to GDP at c.3.4% in 2015 (vs. world average of 9.9%,
according to WHO), the 10 years’ FY10-20F projected CAGR is at 5.4%. The
challenge in Indonesia is hospital and doctor scarcity. While the higher tendency
to use generic drugs may have resulted in a relatively lower growth in
pharmaceutical spending (use of cheaper generic versions vs. patented drugs),
the last 5 years has nevertheless seen tremendous growth in pharmaceutical
spending.
Figure 46: Target price sensitivity to LTG
SOURCES: CGS-CIMB RESEARCH
EV/EBITDA comparison with regional peers
In general, Indonesian hospitals’ EBITDA CAGRs in FY15-18 are higher than
those of their regional peers. The UHC factor aside, we believe the improvement
in purchasing factor is also a driver. We expect HEAL’s EBITDA to grow at 24%
CAGR in FY18-21F, backed by stable hospital expansion until 2020F (our
forecast period). The other growth driver is the addition of more operational
beds. In comparison, the simple average of peers’ EBITDA growth is at a CAGR
of 12.8% over the FY18-21F. HEAL’s average EV/EBITDA in FY18-21F is 22x,
higher than the 19x simple average of its regional healthcare peers under our
coverage (based on our estimates).
Stage 1
DCF (in Rp bn, unless stated
otherwise) 2019F 2020F 2021F 2022F 2023F
EBIT 423 581 750 872 998
EBIT (1-tax) 292 401 517 602 688
Capex (700) (700) (550) (550) (550)
Changes in working capital 176 (20) (26) (12) (10)
Depreciation and amortization 241 279 316 349 381
FCFF 9 (41) 257 388 509
Discounted FCFF 9 (37) 213 293 350
Stage 2
Terminal FCFF 14,135
Discount factor 68.8%
Discounted terminal FCFF 9,718
Total company value 10,546
+ Cash 204
- Debt 866
Value to equity holders 11,616
Value per share (Rp) 3,907
Target price (rounded, Rp) 4,000
LTG Target price (Rp/share)
5.0% 3,300
5.5% 3,600
6.0% 4,000
6.5% 4,500
7.0% 5,200
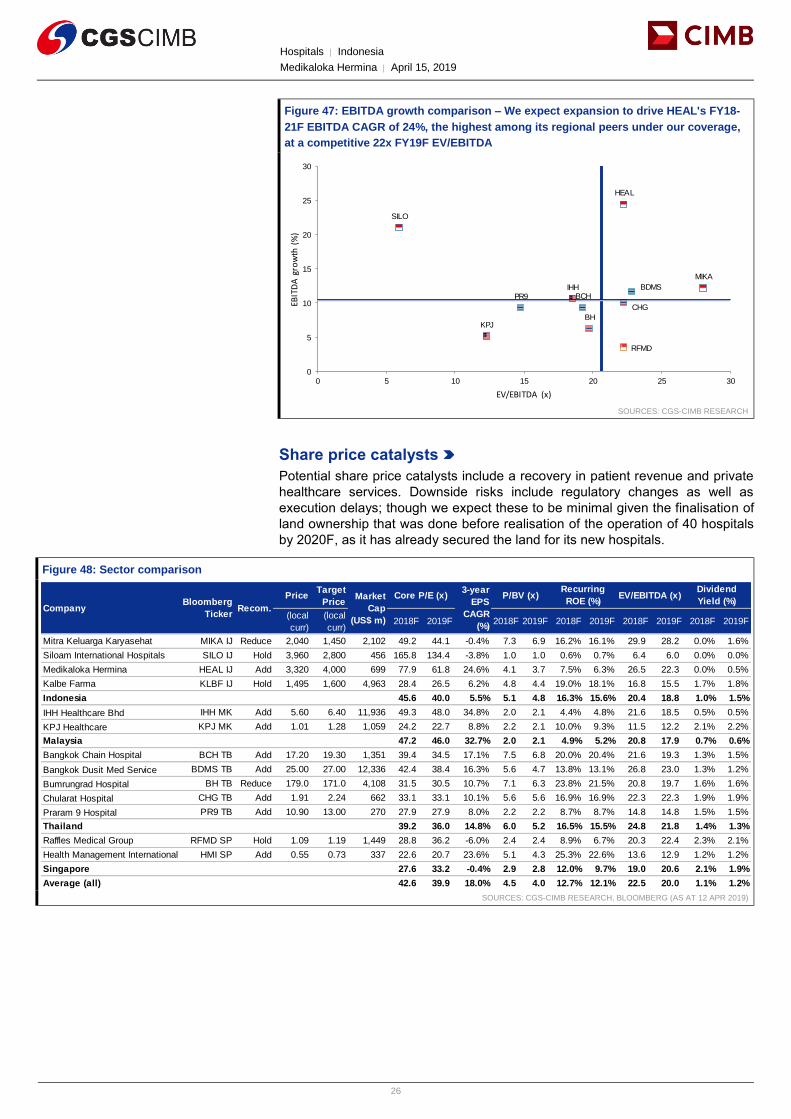
Hospitals │ Indonesia
Medikaloka Hermina │ April 15, 2019
26
Figure 47: EBITDA growth comparison – We expect expansion to drive HEAL's FY18-
21F EBITDA CAGR of 24%, the highest among its regional peers under our coverage,
at a competitive 22x FY19F EV/EBITDA
SOURCES: CGS-CIMB RESEARCH
Share price catalysts
Potential share price catalysts include a recovery in patient revenue and private
healthcare services. Downside risks include regulatory changes as well as
execution delays; though we expect these to be minimal given the finalisation of
land ownership that was done before realisation of the operation of 40 hospitals
by 2020F, as it has already secured the land for its new hospitals.
Figure 48: Sector comparison
SOURCES: CGS-CIMB RESEARCH, BLOOMBERG (AS AT 12 APR 2019)
Title:
Source:
Please fill in the values above to have them entered in your report
MIKA
SILO
HEAL
IHH
KPJ
BCHBDMS
BH
CHG
PR9
RFMD
0
5
10
15
20
25
30
0 5 10 15 20 25 30
EBIT
DA
gro
wth
(%)
EV/EBITDA (x)
PriceTarget
Price
(local
curr)
(local
curr)2018F 2019F 2018F 2019F 2018F 2019F 2018F 2019F 2018F 2019F
Mitra Keluarga Karyasehat MIKA IJ Reduce 2,040 1,450 2,102 49.2 44.1 -0.4% 7.3 6.9 16.2% 16.1% 29.9 28.2 0.0% 1.6%
Siloam International Hospitals SILO IJ Hold 3,960 2,800 456 165.8 134.4 -3.8% 1.0 1.0 0.6% 0.7% 6.4 6.0 0.0% 0.0%
Medikaloka Hermina HEAL IJ Add 3,320 4,000 699 77.9 61.8 24.6% 4.1 3.7 7.5% 6.3% 26.5 22.3 0.0% 0.5%
Kalbe Farma KLBF IJ Hold 1,495 1,600 4,963 28.4 26.5 6.2% 4.8 4.4 19.0% 18.1% 16.8 15.5 1.7% 1.8%
Indonesia 45.6 40.0 5.5% 5.1 4.8 16.3% 15.6% 20.4 18.8 1.0% 1.5%
IHH Healthcare Bhd IHH MK Add 5.60 6.40 11,936 49.3 48.0 34.8% 2.0 2.1 4.4% 4.8% 21.6 18.5 0.5% 0.5%
KPJ Healthcare KPJ MK Add 1.01 1.28 1,059 24.2 22.7 8.8% 2.2 2.1 10.0% 9.3% 11.5 12.2 2.1% 2.2%
Malaysia 47.2 46.0 32.7% 2.0 2.1 4.9% 5.2% 20.8 17.9 0.7% 0.6%
Bangkok Chain Hospital BCH TB Add 17.20 19.30 1,351 39.4 34.5 17.1% 7.5 6.8 20.0% 20.4% 21.6 19.3 1.3% 1.5%
Bangkok Dusit Med Service BDMS TB Add 25.00 27.00 12,336 42.4 38.4 16.3% 5.6 4.7 13.8% 13.1% 26.8 23.0 1.3% 1.2%
Bumrungrad Hospital BH TB Reduce 179.0 171.0 4,108 31.5 30.5 10.7% 7.1 6.3 23.8% 21.5% 20.8 19.7 1.6% 1.6%
Chularat Hospital CHG TB Add 1.91 2.24 662 33.1 33.1 10.1% 5.6 5.6 16.9% 16.9% 22.3 22.3 1.9% 1.9%
Praram 9 Hospital PR9 TB Add 10.90 13.00 270 27.9 27.9 8.0% 2.2 2.2 8.7% 8.7% 14.8 14.8 1.5% 1.5%
Thailand 39.2 36.0 14.8% 6.0 5.2 16.5% 15.5% 24.8 21.8 1.4% 1.3%
Raffles Medical Group RFMD SP Hold 1.09 1.19 1,449 28.8 36.2 -6.0% 2.4 2.4 8.9% 6.7% 20.3 22.4 2.3% 2.1%
Health Management International HMI SP Add 0.55 0.73 337 22.6 20.7 23.6% 5.1 4.3 25.3% 22.6% 13.6 12.9 1.2% 1.2%
Singapore 27.6 33.2 -0.4% 2.9 2.8 12.0% 9.7% 19.0 20.6 2.1% 1.9%
Average (all) 42.6 39.9 18.0% 4.5 4.0 12.7% 12.1% 22.5 20.0 1.1% 1.2%
P/BV (x)Recurring
ROE (%)EV/EBITDA (x)
Dividend
Yield (%)Company
Bloomberg
TickerRecom.
Market
Cap
(US$ m)
Core P/E (x)3-year
EPS
CAGR
(%)
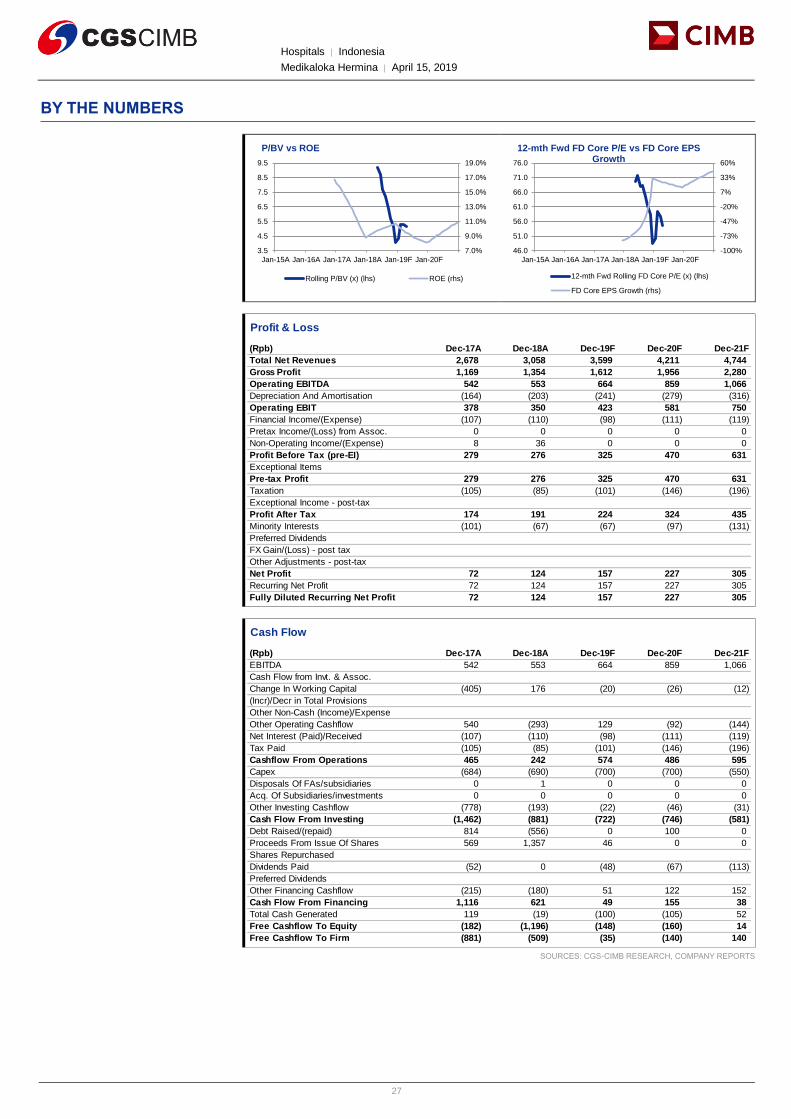
Hospitals │ Indonesia
Medikaloka Hermina │ April 15, 2019
27
BY THE NUMBERS
SOURCES: CGS-CIMB RESEARCH, COMPANY REPORTS
7.0%
9.0%
11.0%
13.0%
15.0%
17.0%
19.0%
3.5
4.5
5.5
6.5
7.5
8.5
9.5
Jan-15A Jan-16A Jan-17A Jan-18A Jan-19F Jan-20F
P/BV vs ROE
Rolling P/BV (x) (lhs) ROE (rhs)
-100%
-73%
-47%
-20%
7%
33%
60%
46.0
51.0
56.0
61.0
66.0
71.0
76.0
Jan-15A Jan-16A Jan-17A Jan-18A Jan-19F Jan-20F
12-mth Fwd FD Core P/E vs FD Core EPS Growth
12-mth Fwd Rolling FD Core P/E (x) (lhs)
FD Core EPS Growth (rhs)
Profit & Loss
(Rpb) Dec-17A Dec-18A Dec-19F Dec-20F Dec-21F
Total Net Revenues 2,678 3,058 3,599 4,211 4,744
Gross Profit 1,169 1,354 1,612 1,956 2,280
Operating EBITDA 542 553 664 859 1,066
Depreciation And Amortisation (164) (203) (241) (279) (316)
Operating EBIT 378 350 423 581 750
Financial Income/(Expense) (107) (110) (98) (111) (119)
Pretax Income/(Loss) from Assoc. 0 0 0 0 0
Non-Operating Income/(Expense) 8 36 0 0 0
Profit Before Tax (pre-EI) 279 276 325 470 631
Exceptional Items
Pre-tax Profit 279 276 325 470 631
Taxation (105) (85) (101) (146) (196)
Exceptional Income - post-tax
Profit After Tax 174 191 224 324 435
Minority Interests (101) (67) (67) (97) (131)
Preferred Dividends
FX Gain/(Loss) - post tax
Other Adjustments - post-tax
Net Profit 72 124 157 227 305
Recurring Net Profit 72 124 157 227 305
Fully Diluted Recurring Net Profit 72 124 157 227 305
Cash Flow
(Rpb) Dec-17A Dec-18A Dec-19F Dec-20F Dec-21F
EBITDA 542 553 664 859 1,066
Cash Flow from Invt. & Assoc.
Change In Working Capital (405) 176 (20) (26) (12)
(Incr)/Decr in Total Provisions
Other Non-Cash (Income)/Expense
Other Operating Cashflow 540 (293) 129 (92) (144)
Net Interest (Paid)/Received (107) (110) (98) (111) (119)
Tax Paid (105) (85) (101) (146) (196)
Cashflow From Operations 465 242 574 486 595
Capex (684) (690) (700) (700) (550)
Disposals Of FAs/subsidiaries 0 1 0 0 0
Acq. Of Subsidiaries/investments 0 0 0 0 0
Other Investing Cashflow (778) (193) (22) (46) (31)
Cash Flow From Investing (1,462) (881) (722) (746) (581)
Debt Raised/(repaid) 814 (556) 0 100 0
Proceeds From Issue Of Shares 569 1,357 46 0 0
Shares Repurchased
Dividends Paid (52) 0 (48) (67) (113)
Preferred Dividends
Other Financing Cashflow (215) (180) 51 122 152
Cash Flow From Financing 1,116 621 49 155 38
Total Cash Generated 119 (19) (100) (105) 52
Free Cashflow To Equity (182) (1,196) (148) (160) 14
Free Cashflow To Firm (881) (509) (35) (140) 140

Hospitals │ Indonesia
Medikaloka Hermina │ April 15, 2019
28
BY THE NUMBERS… cont’d
SOURCES: CGS-CIMB RESEARCH, COMPANY REPORTS
Balance Sheet
(Rpb) Dec-17A Dec-18A Dec-19F Dec-20F Dec-21F
Total Cash And Equivalents 322 304 204 99 151
Total Debtors 547 861 829 970 1,093
Inventories 45 55 58 66 72
Total Other Current Assets 7 8 9 11 12
Total Current Assets 922 1,229 1,100 1,145 1,328
Fixed Assets 2,170 2,656 3,115 3,536 3,770
Total Investments 0 0 0 0 0
Intangible Assets 0 0 0 0 0
Total Other Non-Current Assets 254 286 309 354 385
Total Non-current Assets 2,424 2,943 3,424 3,891 4,156
Short-term Debt 585 0 0 0 0
Current Portion of Long-Term Debt 111 265 265 265 265
Total Creditors 708 614 750 851 930
Other Current Liabilities 318 162 173 202 228
Total Current Liabilities 1,722 1,040 1,187 1,318 1,422
Total Long-term Debt 434 601 601 701 701
Hybrid Debt - Debt Component
Total Other Non-Current Liabilities 234 161 144 169 190
Total Non-current Liabilities 668 761 745 869 891
Total Provisions 0 0 0 0 0
Total Liabilities 2,390 1,801 1,932 2,187 2,313
Shareholders' Equity 454 1,866 2,020 2,180 2,371
Minority Interests 502 504 571 668 799
Total Equity 957 2,370 2,592 2,849 3,170
Key Ratios
Dec-17A Dec-18A Dec-19F Dec-20F Dec-21F
Revenue Growth 19.9% 14.2% 17.7% 17.0% 12.7%
Operating EBITDA Growth 23.1% 2.1% 20.0% 29.4% 24.0%
Operating EBITDA Margin 20.2% 18.1% 18.4% 20.4% 22.5%
Net Cash Per Share (Rp) (376.5) (189.0) (222.5) (291.6) (274.1)
BVPS (Rp) 183.6 627.6 679.6 733.3 797.6
Gross Interest Cover 3.27 2.68 3.73 4.84 5.93
Effective Tax Rate 37.8% 30.7% 31.0% 31.0% 31.0%
Net Dividend Payout Ratio 61.5% NA 25.9% 25.2% 31.7%
Accounts Receivables Days 53.62 75.83 81.44 78.16 79.34
Inventory Days 10.88 10.80 10.45 10.13 10.28
Accounts Payables Days 37.46 40.79 18.68 0.00 0.00
ROIC (%) 13.7% 12.1% 9.4% 11.8% 13.3%
ROCE (%) 19.0% 13.6% 13.1% 16.2% 19.0%
Return On Average Assets 8.21% 7.12% 6.71% 8.38% 9.84%
Key Drivers
Dec-17A Dec-18A Dec-19F Dec-20F Dec-21F
No. Of Patient Admissions (m P.a.) 242.7 310.2 375.1 439.2 485.8
Revenue Per Patient Bed (Rp) 7.3 7.1 7.1 7.3 7.4
Occupancy Rate Of Beds (%) 65.6% 65.8% 68.0% 72.0% 76.0%
Average Length Of Stay (days) 2.6 2.5 2.5 2.5 2.5
Beds Opened (units) 2,780.0 3,378.0 3,778.0 4,178.0 4,378.0
Bed Turnover A Year (x) N/A N/A N/A N/A N/A
% of fgn patients to patient load N/A N/A N/A N/A N/A

Hospitals │ Indonesia
Medikaloka Hermina │ April 15, 2019
29
DISCLAIMER The content of this report (including the views and opinions expressed therein, and the information comprised therein) has been prepared by and belongs to CGS-CIMB or CIMB Investment Bank Berhad (“CIMB”), as the case may be. Reports relating to a specific geographical area are produced and distributed by the corresponding CGS-CIMB entity as listed in the table below. Reports relating to Malaysia are produced and distributed by CIMB.
This report is not directed to, or intended for distribution to or use by, any person or entity who is a citizen or resident of or located in any locality, state, country or other jurisdiction where such distribution, publication, availability or use would be contrary to law or regulation.
By accepting this report, the recipient hereof represents and warrants that he is entitled to receive such report in accordance with the restrictions set forth below and agrees to be bound by the limitations contained herein (including the “Restrictions on Distributions” set out below). Any failure to comply with these limitations may constitute a violation of law. This publication is being supplied to you strictly on the basis that it will remain confidential. No part of this report may be (i) copied, photocopied, duplicated, stored or reproduced in any form by any means or (ii) redistributed or passed on, directly or indirectly, to any other person in whole or in part, for any purpose without the prior written consent of CGS-CIMB or CIMB, as the case may be.
The information contained in this research report is prepared from data believed to be correct and reliable at the time of issue of this report. CGS-CIMB or CIMB, as the case may be, may or may not issue regular reports on the subject matter of this report at any frequency and may cease to do so or change the periodicity of reports at any time. Neither CGS-CIMB nor CIMB has an obligation to update this report in the event of a material change to the information contained in this report. Neither CGS-CIMB nor CIMB accepts any, obligation to (i) check or ensure that the contents of this report remain current, reliable or relevant, (ii) ensure that the content of this report constitutes all the information a prospective investor may require, (iii) ensure the adequacy, accuracy, completeness, reliability or fairness of any views, opinions and information, and accordingly, CGS-CIMB and CIMB, their respective affiliates and related persons including China Galaxy International Financial Holdings Limited (“CGIFHL”) and CIMB Group Sdn. Bhd. (“CIMBG”) and their respective related corporations (and their respective directors, associates, connected persons and/or employees) shall not be liable in any manner whatsoever for any consequences (including but not limited to any direct, indirect or consequential losses, loss of profits and damages) of any reliance thereon or usage thereof. In particular, CGS-CIMB and CIMB disclaim all responsibility and liability for the views and opinions set out in this report.
Unless otherwise specified, this report is based upon sources which CGS-CIMB or CIMB, as the case may be, considers to be reasonable. Such sources will, unless otherwise specified, for market data, be market data and prices available from the main stock exchange or market where the relevant security is listed, or, where appropriate, any other market. Information on the accounts and business of company(ies) will generally be based on published statements of the company(ies), information disseminated by regulatory information services, other publicly available information and information resulting from our research.
Whilst every effort is made to ensure that statements of facts made in this report are accurate, all estimates, projections, forecasts, expressions of opinion and other subjective judgments contained in this report are based on assumptions considered to be reasonable as of the date of the document in which they are contained and must not be construed as a representation that the matters referred to therein will occur. Past performance is not a reliable indicator of future performance. The value of investments may go down as well as up and those investing may, depending on the investments in question, lose more than the initial investment. No report shall constitute an offer or an invitation by or on behalf of CGS-CIMB or CIMB, as the case may be, or any of their respective affiliates (including CGIFHL, CIMBG and their respective related corporations) to any person to buy or sell any investments.
CGS-CIMB, CIMB, their respective affiliates and related corporations (including CGIFHL, CIMBG and their respective related corporations) and/or their respective directors, associates, connected parties and/or employees may own or have positions in securities of the company(ies) covered in this research report or any securities related thereto and may from time to time add to or dispose of, or may be materially interested in, any such securities. Further, CGS-CIMB, CIMB, their respective affiliates and their respective related corporations (including CGIFHL, CIMBG and their respective related corporations) do and seek to do business with the company(ies) covered in this research report and may from time to time act as market maker or have assumed an underwriting commitment in securities of such company(ies), may sell them to or buy them from customers on a principal basis and may also perform or seek to perform significant investment banking, advisory, underwriting or placement services for or relating to such company(ies) as well as solicit such investment, advisory or other services from any entity mentioned in this report.
CGS-CIMB, CIMB or their respective affiliates (including CGIFHL, CIMBG and their respective related corporations) may enter into an agreement with the company(ies) covered in this report relating to the production of research reports. CGS-CIMB or CIMB, as the case may be, may disclose the contents of this report to the company(ies) covered by it and may have amended the contents of this report following such disclosure.
The analyst responsible for the production of this report hereby certifies that the views expressed herein accurately and exclusively reflect his or her personal views and opinions about any and all of the issuers or securities analysed in this report and were prepared independently and autonomously. No part of the compensation of the analyst(s) was, is, or will be directly or indirectly related to the inclusion of specific recommendations(s) or view(s) in this report. The analyst(s) who prepared this research report is prohibited from receiving any compensation, incentive or bonus based on specific investment banking transactions or for providing a specific recommendation for, or view of, a particular company. Information barriers and other arrangements may be established where necessary to prevent conflicts of interests arising. However, the analyst(s) may receive compensation that is based on his/their coverage of company(ies) in the performance of his/their duties or the performance of his/their recommendations and the research personnel involved in the preparation of this report may also participate in the solicitation of the businesses as described above. In reviewing this research report, an investor should be aware that any or all of the foregoing, among other things, may give rise to real or potential conflicts of interest. Additional information is, subject to the duties of confidentiality, available on request.
Reports relating to a specific geographical area are produced by the corresponding CGS-CIMB entity as listed in the table below. The term “CGS-CIMB” shall denote, where appropriate, the relevant entity distributing or disseminating the report in the particular jurisdiction referenced below, or, in every other case except as otherwise stated herein, CGS-CIMB Securities International Pte. Ltd. and its affiliates, subsidiaries and related corporations.

Hospitals │ Indonesia
Medikaloka Hermina │ April 15, 2019
30
Country CGS-CIMB Entity Regulated by
Hong Kong CGS-CIMB Securities (Hong Kong) Limited Securities and Futures Commission Hong Kong
India CGS-CIMB Securities (India) Private Limited Securities and Exchange Board of India (SEBI)
Indonesia PT CGS-CIMB Sekuritas Indonesia Financial Services Authority of Indonesia
Singapore CGS-CIMB Research Pte. Ltd. Monetary Authority of Singapore
South Korea CGS-CIMB Securities (Hong Kong) Limited, Korea Branch Financial Services Commission and Financial Supervisory Service
Thailand CGS-CIMB Securities (Thailand) Co. Ltd. Securities and Exchange Commission Thailand
Reports relating to Malaysia are produced by CIMB as listed in the table below:
Country CIMB Entity Regulated by
Malaysia CIMB Investment Bank Berhad Securities Commission Malaysia
Other Significant Financial Interests:
(i) As of April 12, 2019 CGS-CIMB / CIMB has a proprietary position in the securities (which may include but not limited to shares, warrants, call warrants and/or any other derivatives) in the following company or companies covered or recommended in this report:
(a) -
(ii) Analyst Disclosure: As of April 15, 2019, the analyst(s) who prepared this report, and the associate(s), has / have an interest in the securities (which may include but not limited to shares, warrants, call warrants and/or any other derivatives) in the following company or companies covered or recommended in this report:
(a) -
This report does not purport to contain all the information that a prospective investor may require. Neither CGS-CIMB or CIMB, as the case may be, nor any of their respective affiliates (including CGIFHL, CIMBG and their related corporations) make any guarantee, representation or warranty, express or implied, as to the adequacy, accuracy, completeness, reliability or fairness of any such information and opinion contained in this report. Neither CGS-CIMB or CIMB, as the case may be, nor any of their respective affiliates nor their related persons (including CGIFHL, CIMBG and their related corporations) shall be liable in any manner whatsoever for any consequences (including but not limited to any direct, indirect or consequential losses, loss of profits and damages) of any reliance thereon or usage thereof.
This report is general in nature and has been prepared for information purposes only. It is intended for circulation amongst CGS-CIMB’s or CIMB’s (as the case may be) clients generally and does not have regard to the specific investment objectives, financial situation and the particular needs of any specific person who may receive this report. The information and opinions in this report are not and should not be construed or considered as an offer, recommendation or solicitation to buy or sell the subject securities, related investments or other financial instruments or any derivative instrument, or any rights pertaining thereto.
Investors are advised to make their own independent evaluation of the information contained in this research report, consider their own individual investment objectives, financial situation and particular needs and consult their own professional and financial advisers as to the legal, business, financial, tax and other aspects before participating in any transaction in respect of the securities of company(ies) covered in this research report.
The securities of such company(ies) may not be eligible for sale in all jurisdictions or to all categories of investors.
Australia: Despite anything in this report to the contrary, this research is provided in Australia by CGS-CIMB Securities (Singapore) Pte. Ltd. and CGS-CIMB Securities (Hong Kong) Limited. This research is only available in Australia to persons who are “wholesale clients” (within the meaning of the Corporations Act 2001 (Cth) and is supplied solely for the use of such wholesale clients and shall not be distributed or passed on to any other person. You represent and warrant that if you are in Australia, you are a “wholesale client”. This research is of a general nature only and has been prepared without taking into account the objectives, financial situation or needs of the individual recipient. CGS-CIMB Securities (Singapore) Pte. Ltd. and CGS-CIMB Securities (Hong Kong) Limited do not hold, and are not required to hold an Australian financial services license. CGS-CIMB Securities (Singapore) Pte. Ltd. and CGS-CIMB Securities (Hong Kong) Limited rely on “passporting” exemptions for entities appropriately licensed by the Monetary Authority of Singapore (under ASIC Class Order 03/1102) and the Securities and Futures Commission in Hong Kong (under ASIC Class Order 03/1103).
Canada: This research report has not been prepared in accordance with the disclosure requirements of Dealer Member Rule 3400 – Research Restrictions and Disclosure Requirements of the Investment Industry Regulatory Organization of Canada. For any research report distributed by CIBC, further disclosures related to CIBC conflicts of interest can be found at https://researchcentral.cibcwm.com .
China: For the purpose of this report, the People’s Republic of China (“PRC”) does not include the Hong Kong Special Administrative Region, the Macau Special Administrative Region or Taiwan. The distributor of this report has not been approved or licensed by the China Securities Regulatory Commission or any other relevant regulatory authority or governmental agency in the PRC. This report contains only marketing information. The distribution of this report is not an offer to buy or sell to any person within or outside PRC or a solicitation to any person within or outside of PRC to buy or sell any instruments described herein. This report is being issued outside the PRC to a limited number of institutional investors and may not be provided to any person other than the original recipient and may not be reproduced or used for any other purpose.
France: Only qualified investors within the meaning of French law shall have access to this report. This report shall not be considered as an offer to subscribe to, or used in connection with, any offer for subscription or sale or marketing or direct or indirect distribution of financial instruments and it is not intended as a solicitation for the purchase of any financial instrument.
Germany: This report is only directed at persons who are professional investors as defined in sec 31a(2) of the German Securities Trading Act (WpHG). This publication constitutes research of a non-binding nature on the market situation and the investment instruments cited here at the time of the publication of the information.
The current prices/yields in this issue are based upon closing prices from Bloomberg as of the day preceding publication. Please note that neither the German Federal Financial Supervisory Agency (BaFin), nor any other supervisory authority exercises any control over the content of this report.
Hong Kong: This report is issued and distributed in Hong Kong by CGS-CIMB Securities (Hong Kong) Limited (“CHK”) which is licensed in Hong Kong by the Securities and Futures Commission for Type 1 (dealing in securities), Type 4 (advising on securities) and Type 6 (advising on corporate

Hospitals │ Indonesia
Medikaloka Hermina │ April 15, 2019
31
finance) activities. Any investors wishing to purchase or otherwise deal in the securities covered in this report should contact the Head of Sales at CGS-CIMB Securities (Hong Kong) Limited. The views and opinions in this research report are our own as of the date hereof and are subject to change. If the Financial Services and Markets Act of the United Kingdom or the rules of the Financial Conduct Authority apply to a recipient, our obligations owed to such recipient therein are unaffected. CHK has no obligation to update its opinion or the information in this research report.
This publication is strictly confidential and is for private circulation only to clients of CHK.
CHK does not make a market on other securities mentioned in the report.
India: This report is issued and distributed in India by CGS-CIMB Securities (India) Private Limited (“CGS-CIMB India”). CGS-CIMB India is a subsidiary of CGS-CIMB Securities International Pte. Ltd. which is in turn is a 50:50 joint venture company of CGIFHL and CIMBG. The details of the members of the group of companies of CGS-CIMB can be found at www.cgs-cimb.com, CGIFHL at www.chinastock.com.hk/en/ACG/ContactUs/index.aspx and CIMBG at www.cimb.com/en/who-we-are.html. CGS-CIMB India is registered with the National Stock Exchange of India Limited and BSE Limited as a trading and clearing member (Merchant Banking Number: INM000012037) under the Securities and Exchange Board of India (Stock Brokers and Sub-Brokers) Regulations, 1992. In accordance with the provisions of Regulation 4(g) of the Securities and Exchange Board of India (Investment Advisers) Regulations, 2013, CGS-CIMB India is not required to seek registration with the Securities and Exchange Board of India (“SEBI”) as an Investment Adviser. CGS-CIMB India is registered with SEBI (SEBI Registration Number: INZ000157134) as a Research Analyst (INH000000669) pursuant to the SEBI (Research Analysts) Regulations, 2014 ("Regulations").
This report does not take into account the particular investment objectives, financial situations, or needs of the recipients. It is not intended for and does not deal with prohibitions on investment due to law/jurisdiction issues etc. which may exist for certain persons/entities. Recipients should rely on their own investigations and take their own professional advice before investment.
The report is not a “prospectus” as defined under Indian Law, including the Companies Act, 2013, and is not, and shall not be, approved by, or filed or registered with, any Indian regulator, including any Registrar of Companies in India, SEBI, any Indian stock exchange, or the Reserve Bank of India. No offer, or invitation to offer, or solicitation of subscription with respect to any such securities listed or proposed to be listed in India is being made, or intended to be made, to the public, or to any member or section of the public in India, through or pursuant to this report.
The research analysts, strategists or economists principally responsible for the preparation of this research report are segregated from the other activities of CGS-CIMB India and they have received compensation based upon various factors, including quality, accuracy and value of research, firm profitability or revenues, client feedback and competitive factors. Research analysts', strategists' or economists' compensation is not linked to investment banking or capital markets transactions performed or proposed to be performed by CGS-CIMB India or its affiliates.
CGS-CIMB India does not have actual / beneficial ownership of 1% or more securities of the subject company in this research report, at the end of the month immediately preceding the date of publication of this research report. However, since affiliates of CGS-CIMB are engaged in the financial services business, they might have in their normal course of business financial interests or actual / beneficial ownership of one per cent or more in various companies including the subject company in this research report.
CGS-CIMB or its associates, may: (a) from time to time, have long or short position in, and buy or sell the securities of the subject company in this research report; or (b) be engaged in any other transaction involving such securities and earn brokerage or other compensation or act as a market maker in the financial instruments of the subject company in this research report or act as an advisor or lender/borrower to such company or may have any other potential conflict of interests with respect to any recommendation and other related information and opinions.
CGS-CIMB India, its associates and the analyst engaged in preparation of this research report have not received any compensation for investment banking, merchant banking or brokerage services from the subject company mentioned in the research report in the past 12 months.
CGS-CIMB India, its associates and the analyst engaged in preparation of this research report have not managed or co-managed public offering of securities for the subject company mentioned in the research report in the past 12 months. The analyst from CGS-CIMB India engaged in preparation of this research report or his/her relative (a) do not have any financial interests in the subject company mentioned in this research report; (b) do not own 1% or more of the equity securities of the subject company mentioned in the research report as of the last day of the month preceding the publication of the research report; (c) do not have any material conflict of interest at the time of publication of the research report.
Indonesia: This report is issued and distributed by PT CGS-CIMB Sekuritas Indonesia (“CGS-CIMB Indonesia”). The views and opinions in this research report are our own as of the date hereof and are subject to change. CGS-CIMB Indonesia has no obligation to update its opinion or the information in this research report. Neither this report nor any copy hereof may be distributed in Indonesia or to any Indonesian citizens wherever they are domiciled or to Indonesian residents except in compliance with applicable Indonesian capital market laws and regulations.
This research report is not an offer of securities in Indonesia. The securities referred to in this research report have not been registered with the Financial Services Authority (Otoritas Jasa Keuangan) pursuant to relevant capital market laws and regulations, and may not be offered or sold within the territory of the Republic of Indonesia or to Indonesian citizens through a public offering or in circumstances which constitute an offer within the meaning of the Indonesian capital market law and regulations.
Ireland: CGS-CIMB is not an investment firm authorised in the Republic of Ireland and no part of this document should be construed as CGS-CIMB acting as, or otherwise claiming or representing to be, an investment firm authorised in the Republic of Ireland.
Malaysia: This report is distributed in Malaysia by CIMB solely for the benefit of and for the exclusive use of our clients. Recipients of this report are to contact CIMB, at 17th Floor Menara CIMB No. 1 Jalan Stesen Sentral 2, Kuala Lumpur Sentral 50470 Kuala Lumpur, Malaysia, in respect of any matters arising from or in connection with this report. CIMB has no obligation to update, revise or reaffirm its opinion or the information in this research reports after the date of this report.
New Zealand: In New Zealand, this report is for distribution only to persons who are wholesale clients pursuant to section 5C of the Financial Advisers Act 2008.
Singapore: This report is issued and distributed by CGS-CIMB Research Pte Ltd (“CGS-CIMBR”). CGS-CIMBR is a financial adviser licensed under the Financial Advisers Act, Cap 110 (“FAA”) for advising on investment products, by issuing or promulgating research analyses or research reports, whether in electronic, print or other form. Accordingly CGS-CIMBR is a subject to the applicable rules under the FAA unless it is able to avail itself to any prescribed exemptions.
Recipients of this report are to contact CGS-CIMB Research Pte Ltd, 50 Raffles Place, #16-02 Singapore Land Tower, Singapore in respect of any

Hospitals │ Indonesia
Medikaloka Hermina │ April 15, 2019
32
matters arising from, or in connection with this report. CGS-CIMBR has no obligation to update its opinion or the information in this research report. This publication is strictly confidential and is for private circulation only. If you have not been sent this report by CGS-CIMBR directly, you may not rely, use or disclose to anyone else this report or its contents.
If the recipient of this research report is not an accredited investor, expert investor or institutional investor, CGS-CIMBR accepts legal responsibility for the contents of the report without any disclaimer limiting or otherwise curtailing such legal responsibility. If the recipient is an accredited investor, expert investor or institutional investor, the recipient is deemed to acknowledge that CGS-CIMBR is exempt from certain requirements under the FAA and its attendant regulations, and as such, is exempt from complying with the following :
(a) Section 25 of the FAA (obligation to disclose product information);
(b) Section 27 (duty not to make recommendation with respect to any investment product without having a reasonable basis where you may be reasonably expected to rely on the recommendation) of the FAA;
(c) MAS Notice on Information to Clients and Product Information Disclosure [Notice No. FAA-N03];
(d) MAS Notice on Recommendation on Investment Products [Notice No. FAA-N16];
(e) Section 36 (obligation on disclosure of interest in specified products), and
(f) any other laws, regulations, notices, directive, guidelines, circulars and practice notes which are relates to the above, to the extent permitted by applicable laws, as may be amended from time to time, and any other laws, regulations, notices, directive, guidelines, circulars, and practice notes as we may notify you from time to time. In addition, the recipient who is an accredited investor, expert investor or institutional investor acknowledges that as CGS-CIMBR is exempt from Section 27 of the FAA, the recipient will also not be able to file a civil claim against CGS-CIMBR for any loss or damage arising from the recipient’s reliance on any recommendation made by CGS-CIMBR which would otherwise be a right that is available to the recipient under Section 27 of the FAA, the recipient will also not be able to file a civil claim against CGS-CIMBR for any loss or damage arising from the recipient’s reliance on any recommendation made by CGS-CIMBR which would otherwise be a right that is available to the recipient under Section 27 of the FAA.
CGS-CIMBR, its affiliates and related corporations, their directors, associates, connected parties and/or employees may own or have positions in specified products of the company(ies) covered in this research report or any specified products related thereto and may from time to time add to or dispose of, or may be materially interested in, any such specified products. Further, CGS-CIMBR, its affiliates and its related corporations do and seek to do business with the company(ies) covered in this research report and may from time to time act as market maker or have assumed an underwriting commitment in specified products of such company(ies), may sell them to or buy them from customers on a principal basis and may also perform or seek to perform significant investment banking, advisory, underwriting or placement services for or relating to such company(ies) as well as solicit such investment, advisory or other services from any entity mentioned in this report.
As of April 12, 2019, CGS-CIMBR does not have a proprietary position in the recommended specified products in this report.
CGS-CIMBR does not make a market on the securities mentioned in the report.
South Korea: This report is issued and distributed in South Korea by CGS-CIMB Securities (Hong Kong) Limited, Korea Branch (“CGS-CIMB Korea”) which is licensed as a cash equity broker, and regulated by the Financial Services Commission and Financial Supervisory Service of Korea. In South Korea, this report is for distribution only to professional investors under Article 9(5) of the Financial Investment Services and Capital Market Act of Korea (“FSCMA”).
Spain: This document is a research report and it is addressed to institutional investors only. The research report is of a general nature and not personalised and does not constitute investment advice so, as the case may be, the recipient must seek proper advice before adopting any investment decision. This document does not constitute a public offering of securities.
CGS-CIMB is not registered with the Spanish Comision Nacional del Mercado de Valores to provide investment services.
Sweden: This report contains only marketing information and has not been approved by the Swedish Financial Supervisory Authority. The distribution of this report is not an offer to sell to any person in Sweden or a solicitation to any person in Sweden to buy any instruments described herein and may not be forwarded to the public in Sweden.
Switzerland: This report has not been prepared in accordance with the recognized self-regulatory minimal standards for research reports of banks issued by the Swiss Bankers’ Association (Directives on the Independence of Financial Research).
Thailand: This report is issued and distributed by CGS-CIMB Securities (Thailand) Co. Ltd. (“CGS-CIMB Thailand”) based upon sources believed to be reliable (but their accuracy, completeness or correctness is not guaranteed). The statements or expressions of opinion herein were arrived at after due and careful consideration for use as information for investment. Such opinions are subject to change without notice and CGS-CIMB Thailand has no obligation to update its opinion or the information in this research report.
CGS-CIMB Thailand may act or acts as Market Maker, and issuer and offerer of Derivative Warrants and Structured Note which may have the following securities as its underlying securities. Investors should carefully read and study the details of the derivative warrants in the prospectus before making investment decisions.
AAV, ADVANC, AMATA, AOT, AP, BANPU, BBL, BCH, BCP, BCPG, BDMS, BEAUTY, BEM, BGRIM, BJC, BH, BLA, BLAND, BPP, BTS, CBG, CENTEL, CHG, CK, CKP, COM7, CPALL, CPF, CPN, DELTA, DTAC, EA, EGCO, EPG, ERW, ESSO, GGC, GFPT, GLOBAL, GLOW, GPSC, GUNKUL, HANA, HMPRO, INTUCH, IRPC, ITD, IVL, KBANK, KCE, KKP, KTB, KTC, LH, LPN, MAJOR, MEGA, MINT, MTLS, ORI, PRM, PSH, PSL, PTG, PTT, PTTEP, PTTGC, QH, RATCH, ROBINS, RS, SAWAD, SCB, SCC, SGP, SIRI, SPALI, SPRC, STA, STEC, SUPER, TASCO, TCAP, THAI, THANI, TISCO, TKN, TMB, TOA, TOP, TPIPL, TPIPP, TRUE, TTW, TU, TVO, UV, WHA, WHAUP, WORK.
Corporate Governance Report:
The disclosure of the survey result of the Thai Institute of Directors Association (“IOD”) regarding corporate governance is made pursuant to the policy of the Office of the Securities and Exchange Commission. The survey of the IOD is based on the information of a company listed on the Stock Exchange of Thailand and the Market for Alternative Investment disclosed to the public and able to be accessed by a general public investor. The result, therefore, is from the perspective of a third party. It is not an evaluation of operation and is not based on inside information.
The survey result is as of the date appearing in the Corporate Governance Report of Thai Listed Companies. As a result, the survey result may be changed after that date. CGS-CIMB Thailand does not confirm nor certify the accuracy of such survey result.

Hospitals │ Indonesia
Medikaloka Hermina │ April 15, 2019
33
Score Range: 90 - 100 80 – 89 70 - 79 Below 70 or No Survey Result
Description: Excellent Very Good Good N/A
United Arab Emirates: The distributor of this report has not been approved or licensed by the UAE Central Bank or any other relevant licensing authorities or governmental agencies in the United Arab Emirates. This report is strictly private and confidential and has not been reviewed by, deposited or registered with UAE Central Bank or any other licensing authority or governmental agencies in the United Arab Emirates. This report is being issued outside the United Arab Emirates to a limited number of institutional investors and must not be provided to any person other than the original recipient and may not be reproduced or used for any other purpose. Further, the information contained in this report is not intended to lead to the sale of investments under any subscription agreement or the conclusion of any other contract of whatsoever nature within the territory of the United Arab Emirates.
United Kingdom and European Economic Area (EEA): In the United Kingdom and European Economic Area, this material is also being distributed by CGS-CIMB Securities (UK) Limited (“CGS-CIMB UK”). CGS-CIMB UK is authorized and regulated by the Financial Conduct Authority and its registered office is at 27 Knightsbridge, London, SW1X7YB. The material distributed by CGS-CIMB UK has been prepared in accordance with CGS-CIMB’s policies for managing conflicts of interest arising as a result of publication and distribution of this material. This material is for distribution only to, and is solely directed at, selected persons on the basis that those persons: (a) are eligible counterparties and professional clients of CGS-CIMB UK; (b) have professional experience in matters relating to investments falling within Article 19(5) of the Financial Services and Markets Act 2000 (Financial Promotion) Order 2005 (as amended, the “Order”), (c) fall within Article 49(2)(a) to (d) (“high net worth companies, unincorporated associations etc”) of the Order; (d) are outside the United Kingdom subject to relevant regulation in each jur isdiction, material(all such persons together being referred to as “relevant persons”). This material is directed only at relevant persons and must not be acted on or relied on by persons who are not relevant persons. Any investment or investment activity to which this material relates is available only to relevant persons and will be engaged in only with relevant persons.
Where this material is labelled as non-independent, it does not provide an impartial or objective assessment of the subject matter and does not constitute independent “research” (cannot remove research from here under the applicable rules of the Financial Conduct Authority in the UK. Consequently, any such non-independent material will not have been prepared in accordance with legal requirements designed to promote the independence of research (cannot remove research from here) and will not subject to any prohibition on dealing ahead of the dissemination of research. Any such non-independent material must be considered as a marketing communication.
United States: This research report is distributed in the United States of America by CGS-CIMB Securities (USA) Inc, a U.S. registered broker-dealer and a related company of CGS-CIMB Research Pte Ltd, PT CGS-CIMB Sekuritas Indonesia, CGS-CIMB Securities (Thailand) Co. Ltd, CGS-CIMB Securities (Hong Kong) Limited, CGS-CIMB Securities (India) Private Limited, and is distributed solely to persons who qualify as “U.S. Institutional Investors” as defined in Rule 15a-6 under the Securities and Exchange Act of 1934. This communication is only for Institutional Investors whose ordinary business activities involve investing in shares, bonds, and associated securities and/or derivative securities and who have professional experience in such investments. Any person who is not a U.S. Institutional Investor or Major Institutional Investor must not rely on this communication. The delivery of this research report to any person in the United States of America is not a recommendation to effect any transactions in the securities discussed herein, or an endorsement of any opinion expressed herein. CGS-CIMB Securities (USA) Inc, is a FINRA/SIPC member and takes responsibility for the content of this report. For further information or to place an order in any of the above-mentioned securities please contact a registered representative of CGS-CIMB Securities (USA) Inc.
CGS-CIMB Securities (USA) Inc. does not make a market on other securities mentioned in the report.
CGS-CIMB Securities (USA) Inc. has not managed or co-managed a public offering of any of the securities mentioned in the past 12 months.
CGS-CIMB Securities (USA) Inc. has not received compensation for investment banking services from any of the company mentioned in the past 12 months.
CGS-CIMB Securities (USA) Inc. neither expects to receive nor intends to seek compensation for investment banking services from any of the company mentioned within the next 3 months.
Other jurisdictions: In any other jurisdictions, except if otherwise restricted by laws or regulations, this report is only for distribution to professional, institutional or sophisticated investors as defined in the laws and regulations of such jurisdictions.
Rating Distribution (%) Inv estment Banking clients (%)
Add 57.8% 4.0%
Hold 27.0% 2.1%
Reduce 15.2% 0.4%
Distribution of stock ratings and inv estment banking clients for quarter ended on 08 April 2019
771 companies under cov erage for quarter ended on 08 April 2019
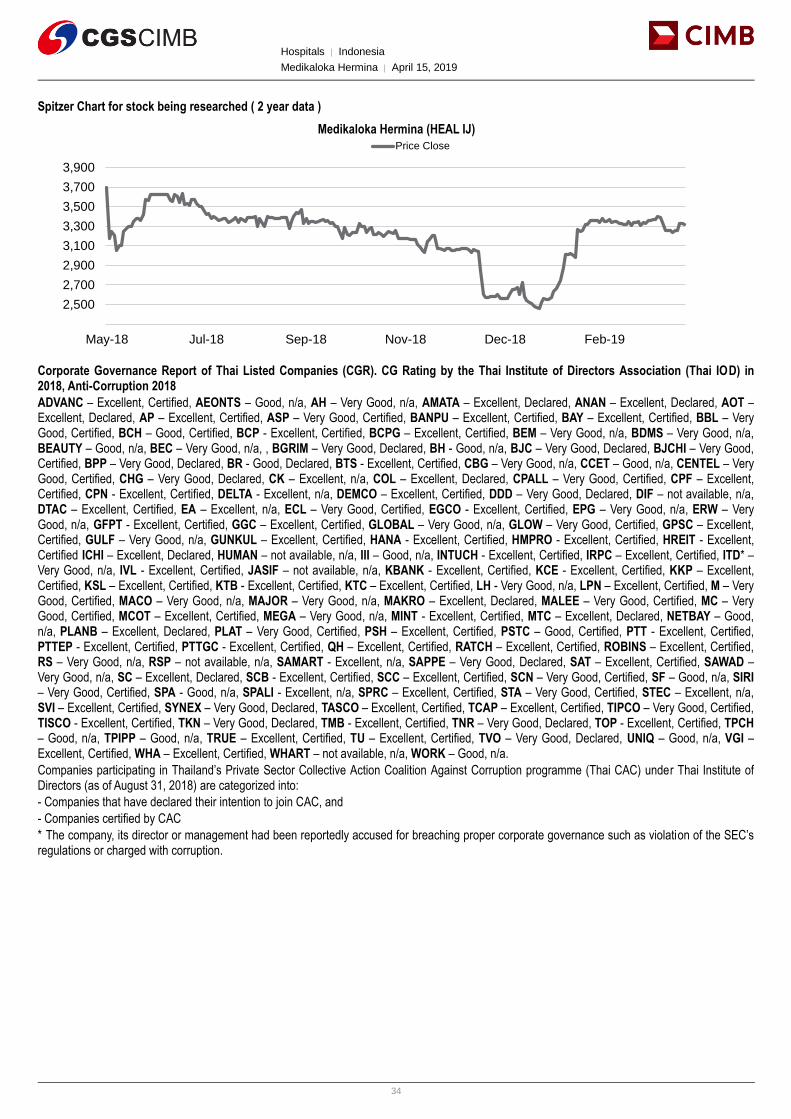
Hospitals │ Indonesia
Medikaloka Hermina │ April 15, 2019
34
Spitzer Chart for stock being researched ( 2 year data )
Medikaloka Hermina (HEAL IJ)
Corporate Governance Report of Thai Listed Companies (CGR). CG Rating by the Thai Institute of Directors Association (Thai IOD) in 2018, Anti-Corruption 2018
ADVANC – Excellent, Certified, AEONTS – Good, n/a, AH – Very Good, n/a, AMATA – Excellent, Declared, ANAN – Excellent, Declared, AOT – Excellent, Declared, AP – Excellent, Certified, ASP – Very Good, Certified, BANPU – Excellent, Certified, BAY – Excellent, Certified, BBL – Very Good, Certified, BCH – Good, Certified, BCP - Excellent, Certified, BCPG – Excellent, Certified, BEM – Very Good, n/a, BDMS – Very Good, n/a, BEAUTY – Good, n/a, BEC – Very Good, n/a, , BGRIM – Very Good, Declared, BH - Good, n/a, BJC – Very Good, Declared, BJCHI – Very Good, Certified, BPP – Very Good, Declared, BR - Good, Declared, BTS - Excellent, Certified, CBG – Very Good, n/a, CCET – Good, n/a, CENTEL – Very Good, Certified, CHG – Very Good, Declared, CK – Excellent, n/a, COL – Excellent, Declared, CPALL – Very Good, Certified, CPF – Excellent, Certified, CPN - Excellent, Certified, DELTA - Excellent, n/a, DEMCO – Excellent, Certified, DDD – Very Good, Declared, DIF – not available, n/a, DTAC – Excellent, Certified, EA – Excellent, n/a, ECL – Very Good, Certified, EGCO - Excellent, Certified, EPG – Very Good, n/a, ERW – Very Good, n/a, GFPT - Excellent, Certified, GGC – Excellent, Certified, GLOBAL – Very Good, n/a, GLOW – Very Good, Certified, GPSC – Excellent, Certified, GULF – Very Good, n/a, GUNKUL – Excellent, Certified, HANA - Excellent, Certified, HMPRO - Excellent, Certified, HREIT - Excellent, Certified ICHI – Excellent, Declared, HUMAN – not available, n/a, III – Good, n/a, INTUCH - Excellent, Certified, IRPC – Excellent, Certified, ITD* – Very Good, n/a, IVL - Excellent, Certified, JASIF – not available, n/a, KBANK - Excellent, Certified, KCE - Excellent, Certified, KKP – Excellent, Certified, KSL – Excellent, Certified, KTB - Excellent, Certified, KTC – Excellent, Certified, LH - Very Good, n/a, LPN – Excellent, Certified, M – Very Good, Certified, MACO – Very Good, n/a, MAJOR – Very Good, n/a, MAKRO – Excellent, Declared, MALEE – Very Good, Certified, MC – Very Good, Certified, MCOT – Excellent, Certified, MEGA – Very Good, n/a, MINT - Excellent, Certified, MTC – Excellent, Declared, NETBAY – Good, n/a, PLANB – Excellent, Declared, PLAT – Very Good, Certified, PSH – Excellent, Certified, PSTC – Good, Certified, PTT - Excellent, Certified, PTTEP - Excellent, Certified, PTTGC - Excellent, Certified, QH – Excellent, Certified, RATCH – Excellent, Certified, ROBINS – Excellent, Certified, RS – Very Good, n/a, RSP – not available, n/a, SAMART - Excellent, n/a, SAPPE – Very Good, Declared, SAT – Excellent, Certified, SAWAD – Very Good, n/a, SC – Excellent, Declared, SCB - Excellent, Certified, SCC – Excellent, Certified, SCN – Very Good, Certified, SF – Good, n/a, SIRI – Very Good, Certified, SPA - Good, n/a, SPALI - Excellent, n/a, SPRC – Excellent, Certified, STA – Very Good, Certified, STEC – Excellent, n/a, SVI – Excellent, Certified, SYNEX – Very Good, Declared, TASCO – Excellent, Certified, TCAP – Excellent, Certified, TIPCO – Very Good, Certified, TISCO - Excellent, Certified, TKN – Very Good, Declared, TMB - Excellent, Certified, TNR – Very Good, Declared, TOP - Excellent, Certified, TPCH – Good, n/a, TPIPP – Good, n/a, TRUE – Excellent, Certified, TU – Excellent, Certified, TVO – Very Good, Declared, UNIQ – Good, n/a, VGI – Excellent, Certified, WHA – Excellent, Certified, WHART – not available, n/a, WORK – Good, n/a.
Companies participating in Thailand’s Private Sector Collective Action Coalition Against Corruption programme (Thai CAC) under Thai Institute of Directors (as of August 31, 2018) are categorized into:
- Companies that have declared their intention to join CAC, and
- Companies certified by CAC
* The company, its director or management had been reportedly accused for breaching proper corporate governance such as violation of the SEC’s regulations or charged with corruption.
2,300
2,500
2,700
2,900
3,100
3,300
3,500
3,700
3,900
May-18 Jul-18 Sep-18 Nov-18 Dec-18 Feb-19
Price Close

Hospitals │ Indonesia
Medikaloka Hermina │ April 15, 2019
35
Recommendation Framework
Stock Ratings Definition:
Add The stock’s total return is expected to exceed 10% over the next 12 months.
Hold The stock’s total return is expected to be between 0% and positive 10% over the next 12 months.
Reduce The stock’s total return is expected to fall below 0% or more over the next 12 months.
The total expected return of a stock is defined as the sum of the: (i) percentage difference between the target price and the current price and (ii) the forward net dividend yields of the stock. Stock price targets have an investment horizon of 12 months.
Sector Ratings Definition:
Overweight An Overweight rating means stocks in the sector have, on a market cap-weighted basis, a positive absolute recommendation.
Neutral A Neutral rating means stocks in the sector have, on a market cap-weighted basis, a neutral absolute recommendation.
Underweight An Underweight rating means stocks in the sector have, on a market cap-weighted basis, a negative absolute recommendation.
Country Ratings Definition:
Overweight An Overweight rating means investors should be positioned with an above-market weight in this country relative to benchmark.
Neutral A Neutral rating means investors should be positioned with a neutral weight in this country relative to benchmark.
Underweight An Underweight rating means investors should be positioned with a below-market weight in this country relative to benchmark.
#01