maximum permissible concentrations and negligible
TRANSCRIPT

research forman and
environment
RIJKSINSTITUUT VOOR VOLKSGEZONDHEID EN MILIEUNATIONAL INSTITUTE OF PUBLIC HEALTH AND THE ENVIRONMENT
RIVM report 601501 008
Maximum permissible concentrations andnegligible concentrations for antifoulingsubstancesIrgarol 1051, dichlofluanid, ziram, chlorothaloniland TCMTB
A.P. van Wezel, P. van VlaardingenMay 2001
This investigation has been performed for the account Directorate-General for EnvironmentalProtection, Directorate for Chemicals, Waste and Radiation, in the context of the project"Setting Integrated Environmental Quality Standards", RIVM-project no. 601501.
National Institute of Public Health and the Environment, PO Box 1, 3720 BA Bilthoven, The Netherlands.Tel. 31-30-2749111, fax. 31-30-2742971

pag. 2 of 59 RIVM report 601501008
Abstract
In this report maximum permissible concentrations and negligible concentrations are derivedfor various antifouling substances, which are used as substitute for TBT such as Irgarol 1051,dichlofluanid, ziram, chlorothalonil and TCMTB.

RIVM report 601501 008 pag. 3 of 59
Preface
Thanks are due to dr. M. van der Weiden, who was contact person at the ministry of housing,spatial planning and the environment (VROM-DGM/SAS). We want to acknowledge dr. D.Sijm, and drs. T. Traas who are involved in the RIVM-project 601501 in which the work wasperformed.
The results as presented in this report are discussed by the members of the ‘Setting IntegratedEnvironmental Quality Standards Advisory Group’, who are acknowledged for theircontribution. The members are: dr. T. Brock (Alterra), drs. S. Dogger (Health Council of theNetherlands), dr. J. Faber (Alterra), dr. K. den Haan (Shell International Chemical BV), drs. J.Peijnenburg (National Institute for Coastal and Marine Management), drs. M. Koene(Foundation for Nature and Environment), dr. D. Sijm (National Institute of Public Health andthe Environment), dr. E. Sneller (National Institute of Inland Water Management), dr. J.Appelman (Board for the Authorisation of Pesticides), dr. W. van Tilborg (VTBC), dr. J. vanWensem (Technical Soil Protection Committee), dr. T. Traas (National Institute of PublicHealth and the Environment).
The work described in this report relies partly upon recently published CSR-advisory reports:nr. 06456a00 on TCMTB, nr. 06105a00 on chlorothalonil and nr. 8241a01 on chlorothalonil.Therefore we want to acknowledge J. van der Pol, A. van der Linde, M.H.M.M. Montforts, R.Posthumus and C.E. Smit (all RIVM-CSR) who contributed to these reports.

pag. 4 of 59 RIVM report 601501008
Contents
SAMENVATTING................................................................................................................................................ 6
SUMMARY............................................................................................................................................................ 8
1 INTRODUCTION...................................................................................................................................... 11
1.1 THE PROJECT ‘SETTING INTEGRATED ENVIRONMENTAL QUALITY STANDARDS’..................................... 111.2 ANTIFOULING SUBSTANCES ..................................................................................................................... 12
1.2.1 Background.................................................................................................................................... 121.2.2 Authorisation in the Netherlands................................................................................................... 131.2.3 Antifouling substances evaluated in the present report ................................................................. 13
2 METHODS................................................................................................................................................. 17
2.1 GENERAL SCHEME ................................................................................................................................... 172.2 DATA COLLECTION .................................................................................................................................. 172.3 DATA SELECTION ..................................................................................................................................... 172.4 EXTRAPOLATION TOWARDS MPCS AND NCS.......................................................................................... 18
2.4.1 Preliminary effect assessment........................................................................................................ 182.4.2 Refined effect assessment............................................................................................................... 182.4.3 Derivation of negligible concentrations (NCs).............................................................................. 18
2.5 EQUILIBRIUM PARTITIONING AND HARMONISATION BETWEEN THE COMPARTMENTS............................... 19
3 TOXICITY DATA AND DERIVATION OF MPCS AND NCS FOR WATER.................................. 21
3.1 IRGAROL 1051 ......................................................................................................................................... 213.2 DICHLOFLUANID ...................................................................................................................................... 223.3 ZIRAM...................................................................................................................................................... 233.4 CHLOROTHALONIL................................................................................................................................... 233.5 TCMTB................................................................................................................................................... 24
4 TOXICITY DATA AND DERIVATION OF MPCS AND NCS FOR SOIL AND SEDIMENT........ 25
4.1 MPCS FOR SEDIMENT............................................................................................................................... 254.1.1 Partition coefficients used for the antifoulings.............................................................................. 25
4.2 MPCS FOR SOIL........................................................................................................................................ 264.2.1 Irgarol 1051................................................................................................................................... 264.2.2 Dichlofluanid................................................................................................................................. 264.2.3 Ziram ............................................................................................................................................. 264.2.4 Chlorothalonil ............................................................................................................................... 264.2.5 TCMTB .......................................................................................................................................... 26
5 DISCUSSION ............................................................................................................................................. 29
5.1 OCCURRENCE........................................................................................................................................... 295.2 EFFECTS OBSERVED IN THE FIELD ............................................................................................................ 305.3 STABILITY OF THE ANTIFOULING SUBSTANCES ........................................................................................ 30
5.3.1 Irgarol 1051................................................................................................................................... 305.3.2 Dichlofluanid................................................................................................................................. 315.3.3 Chlorothalonil ............................................................................................................................... 325.3.4 Ziram ............................................................................................................................................. 325.3.5 TCMTB .......................................................................................................................................... 32
5.4 MIXTURE TOXICITY.................................................................................................................................. 32
REFERENCES .................................................................................................................................................... 34
APPENDIX 1: MAILING LIST......................................................................................................................... 38
APPENDIX 2. INFORMATION ON THE AQUATIC TOXICITY OF THE ANTIFOULINGS ............... 40

RIVM report 601501 008 pag. 5 of 59
APPENDIX 3. INFORMATION ON THE SOIL OR SEDIMENT TOXICITY OF THE ANTIFOULINGS............................................................................................................................................................................... 52
REFERENCES TO APPENDIX 2 AND 3 ........................................................................................................ 58

pag. 6 of 59 RIVM report 601501008
Samenvatting
In dit rapport zijn maximaal toelaatbare risiconiveaus (MTRs) en verwaarloosbarerisiconiveaus (VRs) afgeleid voor vijf verbindingen die gebruikt worden als aangroeiwerendmiddel op onder andere schepen. MTRs worden afgeleid met gebruik van ecotoxicologischeen milieuchemische data, en representeren het potentiële risico van stoffen voor eenecosysteem. MTRs vormen de wetenschappelijke basis voor milieukwaliteitsnormen dieworden vastgesteld door het ministerie van VROM.In het verleden werd tributyltin (TBT) als belangrijk aangroeiwerend middel toegepast. Echtervanwege de aantoonbare ecotoxicologische effecten, en de wijdverbreide verspreiding diesamenhangen met het gebruik van TBT, zijn politieke maatregelen genomen welke leiden toteen wereldwijd verbod op TBT in 2003. Als vervanger voor TBT komen nieuweaangroeiwerende middelen op de verfmarkt. In dit rapport worden MTRs afgeleid voor dezeTBT-vervangers.Voor de stoffen Irgarol 1051, dichlofluanid, ziram, chlorothalonil en TCMTB is een MTRafgeleid, voor de verbindingen SeaNine 211 en TCMS pyridine was te weinig informatievoorhanden om een MTR af te leiden. Naast de openbare literatuur is gebruik gemaakt vanzogenaamde adviesrapporten om de toelating van bestrijdingsmiddelen te beoordelen. Dezeadviesrapporten zijn opgesteld door het RIVM, Centrum voor Stoffen en Risico’s, in opdrachtvan het College Toelating Bestrijdingsmiddelen (CTB). Alleen toxiciteitstudies meteindpunten die gerelateerd zijn aan overleving, groei of reproductie zijn in beschouwinggenomen.Ten opzichte van de tot nog toe gebruikte methodieken in het project ‘Integrale normstellingstoffen’ is een verandering aangebracht overeenkomstig Aldenberg and Jaworska (2000).Voor Irgarol 1051 blijken vooral de planten gevoelig te zijn; het mechanisme van toxiciteit isinhibitie van het fotosynthetisch elektronen transport. Een log-normale fit aan detoxiciteitgegevens van alle soorten, maar ook aan alleen de plantgegevens was statistischacceptabel. Ondanks de hogere gevoeligheid van de planten is het berekende MTRwater diegebaseerd werd op alleen de plant gegevens hoger dan het MTRwater die is berekend over allegegevens, dit is te verklaren uit de lagere spreiding in de plantendataset. Er wordt voorgesteldhet MTRwater te baseren op de plantgegevens.Dichlofluanide is erg instabiel in water, de stof is niet meer te detecteren aan het eind vantoxiciteittesten. Er wordt aanbevolen om het MTRwater te baseren op de gevormdemetabolieten in plaats van op de moederverbinding.Voor de toxiciteit in sediment van de onderzochte verbindingen zijn geen specifieke gegevensgevonden, de MTRsediment is voor alle stoffen afgeleid met behulp van de evenwichts-partitietheorie. Voor TCMTB kan geen Koc gemeten worden, en dus ook geen evenwichts-partitietoegepast worden, vanwege de hydrolyse en methylatie van TCMTB in 2-(methylthio)benzothiazol.Voor bodem waren voor dichlofluanide, ziram en chlorothalonil bruikbare gegevensvoorhanden over de toxiciteit naar terrestrische organismen of processen. Voor dichlofluaniden chlorothalonil is de MTRbodem afgeleid op basis van deze terrestrische gegevens, en voor

RIVM report 601501 008 pag. 7 of 59
Irgarol 1051 en ziram is de MTRbodem afgeleid met gebruik van de evenwichts-partitie theorie.Voor een overzicht van de afgeleide MTRs zie tabel I.
Tabel I. MTRs en VRs voor aangroeiwerende middelen, respectievelijk voor water (opgelost), standaardsediment en standaard bodemStof Methode MTRwater
(ng/l)VRwater(ng/l)
Methode MTRsediment(µg/kg)
VRsediment(ng/kg)
Methode MTRbodem(µg/kg)
VRbodem(ng/kg)
Kpb
(l/kg)Irgarol1051
A&Jc 24 (2.7-73)
0.24 EP 1.4 14 EP 1.4 14 58
Dichlo-fluanidea
- - - - - - NOEC/50 190 1900 -
Ziram LC50/1000 9.7 0.097 EP 0.011 0.11 EP 0.011 0.11 1.16Chloro-thalonil
A&J 530 (38-2300)
5.3 EP 50.6 506 NOEC/50 10 100 92
TCMTB NOEC/10 380 3.8 - - - - - - -aOnstabiele verbindingbBerekend uit KoccVolgens Aldenberg and Jaworska, 2000
Behalve voor Irgarol 1051, is geen informatie aangetroffen in de open literatuur over hetvoorkomen in het milieu in Nederland van de hier behandelde verbindingen. Irgarol 1051komt wijdverbreid voor in Europese estuariene en kust- wateren en sedimenten. Concentratieszijn gevonden tot 0,19 µg/l in water en tot 1,7 µg/l in havens. Er is een seizoensgebondenpatroon in de concentraties, welke pieken in de vroege zomer. Langs een saliniteitsgradiënt inde Westerschelde werden concentraties gevonden tussen de 1 en 10 ng/l. Concentraties inhavens zullen vermoedelijk hierboven liggen. De gemeten concentraties liggen dicht bij hetMTR.Milieuconcentraties van TBT-vervangers anders dan Irgarol kunnen geschat worden metbehulp van modellen. Het ‘MAM-PEC’ model (Van Hattum et al., 1999) is speciaal voor ditdoeleinde ontwikkeld. Wanneer de geschatte concentraties gecombineerd worden met deinformatie uit het huidige rapport, kunnen de milieurisico’s van de diverse TBT-vervangersmet elkaar vergeleken worden.

pag. 8 of 59 RIVM report 601501008
Summary
In this report maximum permissible concentrations (MPCs) and negligible concentrations(NCs) are derived for five compounds used as antifouling substances on e.g. ships. MPCs arederived using data on (eco)toxicology and environmental chemistry, and represent thepotential risk of the substances to the ecosystem. They are the scientific basis forEnvironmental Quality Standards (EQSs) set by the Ministry of VROM.Tributyl-tin (TBT) was used as major antifouling substance on ships in the past. Manyadverse ecotoxicological effects caused by TBT are reported, and butyltin contamination iswidespread. In 1989 the EU restricted the use of TBT on boats under 25 m and theInternational Maritime Organisation decided for a world-wide ban on TBT in 2003. As areplacement for TBT, new antifouling agents are coming up to the paint market. In this reportMPCs are derived for substances that are used as TBT-substitutes.MPCs are derived for the compounds Irgarol 1051, dichlofluanid, ziram, chlorothalonil andTCMTB. For SeaNine 211 and TCMS pyridine, there appeared to be insufficient informationto derive an MPC. In addition to the open literature, advisory reports that are prepared for theauthorisation of pesticides were a source of information. These advisory reports are preparedby RIVM, for the account of the Dutch Board for the Authorisation of Pesticides (CTB). Onlytoxicity studies with endpoints related to survival, growth or reproduction are taken intoaccount. A modification to the generally used procedures in the project ‘Setting IntegratedEnvironmental Quality Standards’ is made according to Aldenberg and Jaworska (2000).For Irgarol 1051 especially plants appear to be sensitive; the mode of action is inhibition ofphotosynthetic electron transport. The log-normal fit to toxicity data of all species as well asto only the plant data was statistically acceptable. In spite of the higher sensitivity of theplants, the calculated MPCwater based on the ‘plants only’ dataset is higher than the MPCwater
calculated over all data, due to the lower variability in the plant only dataset. It is proposed tobase the MPCwater on the plants only dataset.Dichlofluanid is highly unstable in the water phase, the parent compound was below detectionlimit at the end of the toxicity tests. Therefore, it is recommended to base the MPC on themetabolites formed and not on the parent compound.No data for toxicity of the studied compounds to organisms living in sediments were found.For all compounds the MPCsediment is derived with help of the equilibrium partitioning theory.For TCMTB the Koc could not be measured due to hydrolysis and methylation of TCMTB into2-(methylthio)benzothiazole (MTBT). Therefore, the equilibrium partitioning theory is notapplicable for TCMTB.Data on the toxicity to soil organisms or soil processes are available for dichlofluanid, ziramand chlorothalonil. For dichlofluanid and chlorothalonil MPCsoil is directly based on theseterrestrial data, for Irgarol 1051 and ziram the MPCsoil is derived using equilibriumpartitioning. For an overview of the MPCs derived in this report see Table I.

RIVM report 601501 008 pag. 9 of 59
Table I. MPCs and NCs for antifouling substances, respectively for water (dissolved), standard sediment andstandard soilCom-pound
Methodused
MPCwater(ng/l)
NCwater(ng/l)
Methodused
MPCsediment(µg/kg)
NCsediment(ng/kg)
Methodused
MPCsoil(µg/kg)
NCsoil(ng/kg)
Kpb
(l/kg)
Irgarol1051
A&Jc 24 (2.7-73)
0.24 EP 1.4 14 EP 1.4 14 58
Dichlo-fluanida
- - - - - - NOEC/50 190 1900 -
Ziram LC50/1000 9.7 0.097 EP 0.011 0.11 EP 0.011 0.11 1.16Chloro-thalonil
A&J 530 (38-2300)
5.3 EP 50.6 506 NOEC/50 10 100 92
TCMTB NOEC/10 380 3.8 - - - - - - -aHighly unstable compoundbCalculated from KoccAccording to Aldenberg and Jaworska, 2000
Except for Irgarol 1051, no information was encountered in the open literature on theenvironmental occurrence in the Netherlands of the chemicals studied here. Irgarol 1051 iswidely distributed in European estuarine and coastal waters and sediments. Concentrationsfound are up to 0.19 µg/l in water and up to 1.7 µg/l in ports. A clear seasonally bound patternis observed, with a maximal concentration in early summer. Along a salinity gradient in theScheldt, the Netherlands, concentrations between 1 and 10 ng/l are found. Concentrationsencountered in harbours are expected to exceed these values. The measured concentrations areclose to the derived MPC. It is concluded that the species composition and thereby ecosystemfunctioning cannot be considered as protected.To estimate the environmental concentration of the TBT-substitutes other than Irgarol and tocompare the environmental risks between the various TBT-substitutes and TBT, theinformation from the present report should be combined with information on predictedconcentrations. For this purpose the ‘MAM-PEC model’ (Van Hattum et al. 1999) could beused.

pag. 10 of 59 RIVM report 601501008

RIVM report 601501 008 pag. 11 of 59
1 Introduction
1.1 The project ‘Setting Integrated Environmental QualityStandards’
This report is produced in the framework of the project ‘Setting Integrated EnvironmentalQuality Standards’. The aim of the project is to derive environmental risk limits forsubstances in the environment for the compartments air, water, sediment and soil. Theenvironmental risk limits are referred to as Environmental Quality Standards (EQSs) in DutchEnvironmental Policy and are set by the Ministry of VROM. The EQSs are based onmaximum permissible concentrations (MPCs) and negligible concentrations (NCs). MPCs arederived using data on (eco)toxicology and environmental chemistry, and represent thepotential risk of the substances to the ecosystem. Applying a factor of 100 towards the MPCyields the NCs. The process of deriving integrated EQSs is shown schematically in Figure1.1.In this report MPCs are derived for five compounds that are used as antifouling substances.The results obtained until now in the project ‘Setting Integrated Environmental QualityStandards’ are laid down in several reports. The MPCs and NCs derived until 1997 aresummarised by De Bruijn et al. (1999). Reuther et al. (1998) derived MPCs and NCs foraniline derivatives. Risk limits for boron, silver, titanium, tellurium, uranium and anorganosilicon compound are derived in Van de Plassche et al. (1999), and MPCs have beenproposed for PCBs and phthalates (Van Wezel et al., 1999ab).
literature searchand evaluation
dataselection
parameterscriteria
calculation ofMPCs
harmonization ofMPCs
Setting of environmen-tal quality standards
Deriving risk limits (RIVM)
Setting EQSs by VROM in cooperation with other ministries
Figure 1.1. The process of deriving Integrated Environmental Quality Standards

pag. 12 of 59 RIVM report 601501008
1.2 Antifouling substances
1.2.1 BackgroundBiofouling is the settlement and growth of micro- and macro-organisms on surfaces.Biofouling on ships increases the fuel consumption (by 6% for every 100 µm increase in hullroughness, cited in Voulvoulis et al., 1999a). Biofouling can be prevented by the use ofantifouling substances. Other ways of preventing biofouling is by cleaning or nutrientlimitation (Flemming et al., 1996).On ships tributyl-tin (TBT) was used as major antifouling substance in the past. Many adverseecotoxicological effects caused by TBT are reported in laboratory studies (see for exampleCrommentuijn et al. 1997a for an overview) and field studies in marina’s and the open sea(Ten Hallers-Tjabbes et al., 1994). Butyltin contamination is not only found in harbours, butis more widespread (Tanabe et al., 1998). The ecotoxicological problems associated with theuse of TBT have been recognised, and have led to policy action. In 1989 the EuropeanCommunity introduced a directive to restrict the use of TBT-based antifouling paints on boatsunder 25 m. The International Maritime Organisation (IMO) has decided for a completeworld-wide ban on TBT for all boats in 2003.As a replacement for TBT, new antifouling agents are coming up to the paint market (e.g.Voulvoulis et al., 1999ab). Examples of these substances can be found in Table 1. Thesesubstances are partly well known chemicals for which environmental risk limits have beenderived. However, also relatively unknown chemicals that have not been the subject of manyecotoxicological studies are used to replace TBT. The different TBT-substitutes arecommonly used in combination with copper or zinc compounds. Additional to copper andzinc, organic biocides are needed, because of the relative tolerance of (micro-) algae speciesto these metals (Voulvoulis et al., 1999a). Several of the TBT-substitutes have in addition toapplication as an antifouling agent other agricultural uses (Voulvoulis et al., 1999a).
Table 1.1: Substances used to replace TBT in antifouling paintsChemical name MPCs
derivedCommonname
Chemical name MPCsderived
Commonname
2,3,5,6-tetrachloro-4-(methylsulphonyl) pyridine
N TCMSPyridine
zineb Y
2-methylthio-4-tertiary-butylamino-6-cyclopropylamino-s-triazine
N Irgarol 1051 cis 1-(3-chloroallyl)-3,5,7-triaza-1-azonia adamantanechloride
N
Cuprous thiocyanate Y (Cu) dichlofluanid N2,4,5,6-tetrachloro iso phthalonitrile
N Chlorothalonil
2-(thiocyanomethylthio)benzthiazole
N TCMTB
4,5-dichloro-2-n-octyl-4-isothiazolin-3-one
N SeaNine 211Kathon 5287
deltamethrin Y
Dichlorophenyl dimethylurea Y Diuron farnesol NFolpet N thiram YZinc pyrithione N oxy tetracycline hydrochloride N4-chloro-meta-cresol N ziram NArsenic trioxide N bitumen NManeb Y

RIVM report 601501 008 pag. 13 of 59
Research on natural product antifouling is still in its infancy. Clare (1996) reviewed naturalproducts against biofouling produced by cnidaria, porifera (sponges), chordata, thallophyta,angiospermae and micro-organisms. However, very few of these products have really beentested for their antifouling action when applied on boats, and on their toxicity.
1.2.2 Authorisation in the NetherlandsAntifouling substances that are presently authorised in the Netherlands are (information fromthe Board for the Authorisation of Pesticides, CTB):� Irgarol 1051 (0.6-5%) in combination with
� Copper (I) oxide (28-43%)� or Copperthiocyanate (14-17%)� or copperthiocyanate (5-6.6%) and zinc oxide (3.2-4.3%)� or copper (I) oxide (40%) and zinc oxide (9%)
� bitumen (5.9%) in combination with copper (I) oxide (21%)� dichlofluanid (9%)� diuron (3.5-4.3%) in combination with
� copper (I) oxide (40-43%)� or copper thiocyanate (24%)� or copper thiocyanate (20%) and zinc oxide (13%)� or copper (I) oxide (29-46%) and zinc oxide (9.5-12%)
� copper (17-25%)� copper (I) oxide (10-50%)� a combination of zineb (4.4%) and copper oxide (40%)� a combination of zinc oxide (11-18%) and copper (I) oxide (41-45%)� a combination of ziram (4.6%) and copper (I) oxide (39.3%)� antifouling substances with tributyltinoxides and tributyltinmethacrylates (also in
combination with copper (I) oxides(5-40%)
1.2.3 Antifouling substances evaluated in the present reportThe purpose of the present report is to derive MPCs for water, sediment and soil forsubstances that are used as TBT-substitutes.MPCs are derived for Irgarol 1051, dichlofluanid, ziram, chlorothalonil and TCMTB. ForSeaNine 211 and TCMS pyridine, there appeared to be insufficient information to derive anMPC. The compounds are selected as they are authorised in the Netherlands (Irgarol 1051,dichlofluanid, and ziram) as an antifouling substance, or often mentioned in the literature asan alternative to TBT (chlorothalonil, SeaNine). Mixture toxicity of the different TBT-substitutes with among themselves or with copper or zinc, was not taken into account in theMPC-derivation. If compounds are accumulated in the food chain, this poses an extra risk forspecies at the top of the food chain and MPCs are derived that take into account this extra risk(Van de Plassche, 1994; Van Wezel et al., 1999a). The compounds studied in the presentreport do not appear to be very hydrophobic (see Kow or Koc in Table 1.2.). Therefore they are

pag. 14 of 59 RIVM report 601501008
not expected to biomagnify in the food chain, and it is considered not necessary to deriveMPCs that take into account biomagnification.General information on the evaluated antifouling substances can be found in Table 1.2.
Table 1.2: General information and physical-chemical properties of the studied compounds
Irgarol 1051
2-methylthio-4-tertiary-butylamino-6-cyclopropylamino-s-triazine
CASnr. 28159-98-0 N
NN
NH N
H
SCH3
CH3
CH3
CH3
Property Value ReferenceWater solubility (mg/l) 6 Jongbloed & Luttik, 1996
7 Jongbloed & Luttik, 1996log Kow 4.1 SRC, 1997log Koc (l/kg) 2.38 Rogers et al., 1996
3.0 Tolosa et al., 1996Henry’s constant (Pa.m3.mol-1) 2.10-6 Jongbloed & Luttik, 1996
5.4.10-4 Rogers et al., 1996Vapour pressure (Pa) 8.8.10-5 Jongbloed & Luttik, 1996
1.5.10-5 Rogers et al., 1996
Dichlofluanid
N’-dimethyl-N-phenylsulfamide
CASnr. 1085-98-9
N SSN CCl2F
O
O
CH3
CH3
Property Value ReferenceWater solubility (mg/l) 1.3 Tomlin, 1997log Kow 3.7 Tomlin, 1997log Koc Tomlin, 1997Henry’s constant (Pa.m3.mol-1) <1.9 Tomlin, 1997Vapour pressure (Pa) <15.10-6 Tomlin, 1997
Ziram
Zinc dimethyldithiocarbamate
CASnr. 137-30-4
Zn2+
N
S
SCH3
CH32
Property Value ReferenceWater solubility (mg/l) 1.58-18.3 Tomlin, 1997log Kow 1.23 Tomlin, 1997log Koc 0.8-1.3 Ordelman et al., 1993Henry’s constant (Pa.m3.mol-1) <1.9 Tomlin, 1997Vapour pressure (Pa) <1.10-6 Tomlin, 1997

RIVM report 601501 008 pag. 15 of 59
Table 1.2., continuedChlorothalonil
2,4,5,6-tetrachloro-isophtalonitrile
CASnr. 1897-45-6
ClCl
Cl CN
CN
Cl
Property Value ReferenceWater solubility (mg/l) 0.9 Caux et al., 1996log Kow 2.6-4.4 Caux et al., 1996log Koc (l/kg) 2.9-3.8 Caux et al., 1996Henry’s constant (Pa.m3.mol-1) 1.7·10-2 Caux et al., 1996Vapour pressure (Pa, 25ºC) 4.3·10-12 Caux et al., 1996
TCMTB
(2-thiocyanomethylthio)benzothiazole
CASnr. 21564-17-0
S
NS C
H2
S CN
Property Value ReferenceWater solubility (mg/l) 20 Van der Pol and Van der Linde, 1999
45 Van der Pol and Van der Linde, 199940 Brownlee et al., 1992
log Kow 3.1 Brownlee et al., 1992log Koc (l/kg) 2.74 predicted acc. to Karickhof, 1981; in an experimental set-up TCMTB
was hydrolysed and methylated so an Koc could not be measured(Brownlee et al., 1992)
Henry’s constant (Pa.m3.mol-1) 1.2 Van der Pol and Van der Linde, 1999Vapour pressure (Pa) 607 Van der Pol and Van der Linde, 1999
193 Van der Pol and Van der Linde, 1999

pag. 16 of 59 RIVM report 601501008

RIVM report 601501 008 pag. 17 of 59
2 Methods
2.1 General schemeThe maximum permissible concentrations and negligible concentrations are derived asdescribed in Kalf et al. (1999), and according to the methods generally applied within theproject ‘Setting Integrated Environmental Quality Standards’. A modification to the generallyused procedures is made according to Aldenberg and Jaworska (2000).In short, data on chronic and acute toxicity for aquatic and terrestrial species and terrestrialprocesses of a compound are searched for. They are evaluated, and selected or rejected. Forcompounds with a log Kow higher than 5.0, or for compounds for which there is anexpectation for secondary poisoning, also toxicity data for mammals and birds are searchedfor. The maximum permissible concentration (MPC) is derived using either the refinedassessment method as described by Aldenberg and Jaworska (2000), or assessment factors aslaid down in the Technical Guidance Document (ECB, 1996, developed for EU councilregulation 793/93). The MPCs are harmonised according to the equilibrium partition theory.In this way it is prevented that a concentration on an MPC-level in one compartment leads toan exceeding of the MPC in another compartment.
2.2 Data collectionAn on-line literature search was performed for the period 1983-summer 1999. The TOXLINEand BIOSYS databases were used. In addition to the open literature, advisory reports that areprepared for the authorisation of pesticides were a source of information. The NationalInstitute of Public Health and the Environment (RIVM) prepares the advisory reports, for theaccount of the Dutch Board for the Authorisation of Pesticides (CTB). Relevant references areJongbloed and Luttik (1996) which reviewed data for Irgarol 1051, Jansma and Linders(1992) which served as a basis for the information on dichlofluanid. Tibosch et al. (1993)summarised data on ziram. Van der Pol and Van der Linde (1999) served as a basis forinformation on TCMTB, and Montforts (1999) and Posthumus (1999) summarised data forchlorothalonil.
2.3 Data selectionA toxicity study is considered reliable if the design of the experiment is in agreement withinternational accepted guidelines, e.g. OECD guidelines. To judge studies that have not beenperformed according to these guidelines, criteria are developed within the framework of theproject ‘Setting Integrated Environmental Quality Standards’.Effects on growth, reproduction or survival are used in the derivation of MPCs, as they aredirectly related to population dynamics. Toxicity data from sediment studies are normalised to10% organic matter.When the method of derivation of a NOEC, LC50 or EC50 was not clearly stated in theoriginal work, a recalculation was performed. A logistic equation was fitted through effect

pag. 18 of 59 RIVM report 601501008
data versus the logarithms of concentrations (preferably measured values) using nonlinearregression (Graphpad Prism, 1996). Either the EC50 (LC50) or the EC10 was calculated.When data of a chronic experiment were fitted, an EC10 was calculated, which wasinterpreted as NOEC. Recalculation of data is mentioned in the footnotes of the tables inAppendix 2 and 3 by ‘Effect concentration recalculated’.For each species and each compound, the most sensitive toxicity test is selected. If for a singlespecies several toxicity values are found for the same effect parameter, the geometric mean iscalculated.
2.4 Extrapolation towards MPCs and NCs
2.4.1 Preliminary effect assessmentIf chronic or acute toxicity data are available for less than four taxonomic groups, assessmentfactors are used. The assessment factors used are laid down in the Technical GuidanceDocument (ECB, 1996; Kalf et al., 1999), which is developed in the framework of EU councilregulation 793/93.In the case that there is no complete base-set (acute toxicity to algae, daphnia and fish), themodified EPA method is used.
2.4.2 Refined effect assessmentThe aim of environmental quality standards as derived in the project ‘Setting IntegratedEnvironmental Quality Standards’ is to protect all species in the ecosystem. For statisticalconsiderations the MPC is set equal to the concentration at which 95% of the species isprotected, i.e. HC5, assuming thereby to protect the whole ecosystem (VROM, 1989; VanLeeuwen et al., 1992). A detailed description of the statistical background of the refined effectassessment method is given in the literature (Kooijman, 1987; Van Straalen and Denneman,1989; Aldenberg and Slob, 1993; Aldenberg and Jaworska, 2000).It is assumed that sensitivities of species in an ecosystem can be described by a log-normalfrequency distribution. Using the computer package GraphPad Prism it is tested, with theKolmogorov-Smirnov D*sqrt(n) test, if a normal distribution to the log-transformed dataadequately describes the underlying data. The average, the standard deviation, and the numberof the underlying data define this distribution. Extrapolation factors as derived by Aldenbergand Jaworska (2000) are used to estimate the HC5, and its upper (95%) and lower (5%)estimate, constituting a 90% two-sided confidence interval.
2.4.3 Derivation of negligible concentrations (NCs)Multiplying the MPCs with a factor 0.01 derives NCs. This factor is supposed to be needed asprotection against mixture toxicity, since species are always exposed in the environment tomixtures of chemicals and chemicals act often as concentration-additive (Van Leeuwen et al.,1996; Deneer, 1988).
RIVM report 601501 008 pag. 19 of 59
2.5 Equilibrium partitioning and harmonisation between thecompartments
The partition coefficient between organic carbon in the soil/sediment and water (Koc) is usedto derive an MPC for soil/sediment when no data on terrestrial or sediment-dwellingorganisms are available. In addition, it is used to harmonise the MPCs between the differentcompartments.By applying this equilibrium-partitioning concept (DiToro et al., 1991), it is assumed thatthere is equilibrium between the concentration in organic carbon and (pore) water. The Koc
describes this equilibrium. It is furthermore assumed that toxicity is related to the pore waterconcentrations, and that aquatic organisms are comparable in their sensitivity to thecompound to the organisms living in soil or sediment.

pag. 20 of 59 RIVM report 601501008

RIVM report 601501 008 pag. 21 of 59
3 Toxicity data and derivation of MPCs and NCs forwater
The aquatic toxicity data that are found for Irgarol 1051, dichlofluanid, ziram, chlorothaloniland TCMTB are presented in Appendix 2. The toxicity data that are found for terrestrial orbenthic organisms are presented in Appendix 3 for the same compounds.Only toxicity studies with endpoints related to survival, growth or reproduction are taken intoaccount. Several toxicity studies are found with endpoints related to biochemistry or animalbehaviour (MacKinnon and Farrell, 1992; Kruzynski et al., 1994ab; Davies et al., 1994).These endpoints are not taken into account for the derivation of MPCs, as they do not have aclear relationship with population dynamics.For the derivation of MPCs salt and freshwater data are combined if there are no (statistical)reasons to keep the data separated. This means that the MPC is derived using the combineddataset. For an overview of the derived MPCs see Table 3.1.
3.1 Irgarol 1051Aquatic toxicity data on Irgarol 1051 can be found in Tables 1.1. to 1.4. in Appendix 2. Acuteand chronic toxicity data are given for freshwater and saltwater organisms.Acute toxicity was tested for algae, macrophytes, crustaceans, and fish (Tables 1.1. and 1.2.).Especially algae and macrophytes appear to be sensitive taxonomic groups. This is explainedas the mode of action of Irgarol 1051 is inhibition of photosynthetic electron transport (Holt,1993). The sensitivity of freshwater and marine organisms to acute exposure can be comparedfor the crustaceans and fish. The marine crustacean is 100 times more sensitive than thefreshwater crustacean. The sensitivity of the two marine fish falls well within the range ofsensitivities encountered for the freshwater species.Chronic toxicity was tested for algae, macrophytes, crustaceans, and fish (Tables 1.3. and1.4.). Again, algae and macrophytes are more sensitive than crustaceans and fish. For algaeboth saltwater species (n=2) and freshwater species (n=4) are tested; the sensitivities ofsaltwater and freshwater species are not statistically different (Two-tailed T-test with Welchcorrection, GraphPad Prism).
Chronic toxicity tests are available for species of four different taxonomic groups, so therefined assessment (Aldenberg and Jaworska, 2000) can be applied. The log-normal fit to themost sensitive data per species from Tables 1.3. and 1.4. was statistically accepted accordingto the Kolgomorov-Smirnov test. The MPCwater is 9.0 ng/l (0.26-61 ng/l), which is a factor oftwo below the lowest chronic toxicity value of 17 ng/l for the algae Navicula pelliculosa.According to the mechanism of action of Irgarol, i.e. inhibition of photosynthetic electrontransport, plants can be considered the most sensitive species. This is confirmed by theavailable data (Figure 3.1.). A one-tailed T-test (with GraphPad Prism) shows that the data forplants differed significantly (P=0.0007) from the remaining toxicity data. A log-normal fit toonly the plant data (algae and macrophytes) was also statistically accepted. The variability in

pag. 22 of 59 RIVM report 601501008
the plant only dataset is smaller than in the dataset for all species. In spite of the highersensitivity of the plants, the calculated MPCwater based on the plants only dataset is higherthan the MPCwater calculated over all data: 24 ng/l (2.5-73 ng/l). This is due to the lowervariability and lower resulting standard deviation in the plants only dataset (Figure 3.1.).As there is a basis to state that plants are the most sensitive species, it is proposed to base theMPCwater on the plants only dataset.Hall et al. (1999) also fitted species sensitivity distributions to -mainly unpublished- data.They used the statistical methods as described by Solomon et al. (1996). The data used wereslightly different from the ones as used in the current study. The 5th percentile of the mostsensitive group, i.e. aquatic plants, was 80 ng/l, which is a factor 3-4 above the MPC derivedin the current study.
0
0.1
0.2
0.3
0.4
0.5
-4 -3 -2 -1 0 1 2 3 4log NOEC (µg/l)
all speciesplantsplants onlyall species
Figure 3.1. Frequency distributions of the toxicity data for Irgarol 1051 for all species or for plants only
3.2 DichlofluanidAquatic toxicity tests with dichlofluanid can be found in Tables 2.1. to 2.2., and rejected testsin Table 2.3. and 2.4. in Appendix 2. Only freshwater species are tested, acute and chronicdata are available for two taxonomic groups: crustaceans and fish. Since the base set isincomplete (there are no data for three taxonomic groups) and according to Kalf et al. (1999),the modified EPA method is used. The lowest chronic (21 d) test is an LC50 value of 0.016mg/l for Oncorhynchus mykiss, an assessment factor of 10 is applied, which yields anMPCwater of 1.6 µg/l. As chronic data are only available for two taxonomic groups, this iscompared with the extrapolated value based on acute toxicity values. The lowest acutetoxicity value is 0.011 mg/l again for Oncorhynchus mykiss. An assessment factor of 1000yields an MPCwater of 11 ng/l. The lowest of both extrapolation methods is chosen, yieldingan MPCwater of 11 ng/l.However, the substance is highly unstable in the water phase. The parent compound wasbelow detection limit at the end of the toxicity test. Therefore, it is recommended to base the

RIVM report 601501 008 pag. 23 of 59
MPC on the metabolites formed and not on the parent compound (see discussion for furtherdetails).
3.3 ZiramAquatic toxicity data on ziram can be found in Tables 3.1. to 3.3. in Appendix 2.Acute data are found for freshwater and marine species. A comparison of sensitivities cannotbe made, as for salt water the only species tested is a bacterium. In this taxonomic group nofreshwater species is tested. Acute aquatic toxicity data are available for six taxonomic groups(bacteria, algae, crustacea, insects, mollusca and pisces, Tables 3.1. and 3.2.). No cleardifferences in sensitivity between the different taxonomic groups are observed.Chronic toxicity data are found for fresh water species of two taxonomic groups (crustaceaand pisces).The lowest acute L(E)C50 is 9.7 µg/l for the fish Lepomis macrochirus. According to theEU/TGD (ECB, 1996) and Kalf (1999) an assessment factor of 1000 is applied which givesan MPCwater of 9.7 ng/l. The lowest chronic toxicity value encountered is 0.6 µg/l for an earlylife stage test Oncorhynchus mykiss (Table 3.3.). Since the taxonomic group showing thelowest acute effect (i.c. pisces), is represented in the chronic toxicity data set by a NOECvalue, an assessment factor of 50 is applied to the lowest NOEC value. This results in anMPCwater of 0.6/50 = 0.012 µg/l or 12 ng/l. The MPC based on extrapolation of acute data is(only slightly) lower than the MPC based on extrapolation of chronic data, therefore theformer is selected (Kalf, 1999; ECB, 1996). Hence, the MPCwater for ziram is 9.7 ng/l.
3.4 ChlorothalonilChlorothalonil possesses multiple electrophilic centres, and is therefore reactive towards GSHand can be detoxified thereby (Gallagher and Di Giulio, 1992). If channel catfish weredepleted in their GSH, the acute toxicity of chlorothalonil was elevated (Gallagher et al.,1992).Acute aquatic toxicity data of chlorothalonil are presented in Tables 4.1. and 4.2. forfreshwater species and marine species respectively. Acute toxicity tests are performed withcrustaceans, molluscs and fish. For crustaceans and fish both freshwater and marine speciesare tested, for both species the data for fresh- and salt water do not differ statistically(unpaired T-test with Welch’s correction, GraphPad Prism).Chronic aquatic toxicity data are available for freshwater species only, and can be found inTable 4.3. Toxicity data are available for four different taxonomic groups (algae, plants,crustaceans, insects and fish), so a MPCwater can be derived with help of the refinedassessment method. The data were found to be log-normal distributed (Kolgomorov-Smirnovtest). The MPCwater which was derived is 0.53 µg/l (0.038-2.3 µg/l).

pag. 24 of 59 RIVM report 601501008
0
0,05
0,1
0,15
0,2
0,25
-4 -3 -2 -1 0 1 2 3 4log NOEC (µg/l)
freq
uenc
y
Figure 3.2. Frequency distributions of the toxicity data for chlorothalonil
3.5 TCMTBInformation on the aquatic toxicity of TCMTB can be found in Table 5.1. and 5.2. ofAppendix 2. The amount of data is limited, and only data for freshwater organisms areavailable. Acute data are available for a crustacean and a fish, only for daphnia magna achronic toxicity value is available. There is no complete base set, according to Kalf et al.(1999) an assessment factor of 10 is applied to the NOEC, this yields an MPCwater of0.38 µg/l.
Table 3.1. MPCwater (dissolved) for antifouling substancesCompound Method
used
MPCwater(ng/l)
NCwater(ng/l)
Irgarol 1051 A&Jc 24 (2.7-73) 0.24Dichlofluanida - - -Ziram LC50/1000 9.7 0.097Chlorothalonil A&J 530 (38-2300) 5.3TCMTB NOEC/10 380 3.8aHighly unstable compound, no MPC derivedbCalculated from Koc, assuming standard sediment with 10% organic mattercAccording to Aldenberg and Jaworska, 2000

RIVM report 601501 008 pag. 25 of 59
4 Toxicity data and derivation of MPCs and NCs forsoil and sediment
4.1 MPCs for sedimentNo specific data are found for sediment toxicity of the studied compounds, only for ziram atest was found that was rejected (Table 2.3.). As no sediment toxicity data are available, theMPCs are derived with help of the equilibrium partitioning theory as described earlier (2.5.).In conclusion, for Irgarol 1051, ziram and chlorothalonil Kp’s are found, and usingequilibrium partitioning an MPCsediment is derived of respectively 0.5, 0.011 and 27.6 µg/kg(Table 3.1.).
4.1.1 Partition coefficients used for the antifoulingsFor Irgarol 1051 a log Koc of 3.0 was used (Tolosa et al., 1996), so a Kp to standard sedimentwith 10% organic matter (conversion factor from organic carbon to organic matter is assumed1.724) is 58.According to Tomlin (1997) dichlofluanid is unstable in soil. It is first metabolised intodimethylsulfanilide and then further degraded. Therefore, the equilibrium partitioning theorycannot be applied to derive a MPCsediment for dichlofluanid.For ziram a log Koc was used of 1.3 was used, the higher in the range 0.8-1.3 reported byOrdelman et al. (1993), which corresponds with a Kp of 1.16 l/kg.Experimental log Koc values for chlorothalonil vary between 2.5 and 3.8, the mean of 11experimental data is 3.2 (Posthumus, 1999). Normalised to standard sediment with 10%organic matter, the Kp is 92 l/kg.For TCMTB no information in the industrial dossiers is available on sorption to organiccarbon (Van der Pol and Van der Linde, 1999), and a study of Brownlee et al. (1992) showedthat in an experimental set-up the Koc could not be measured due to hydrolysis andmethylation of TCMTB into 2-(methylthio)benzothiazole (MTBT). Therefore, the equilibriumpartitioning theory is not applicable for TCMTB.
Table 4.1. MPCwater (dissolved) and MPCsediment for antifouling substancesCompound MPCwater
(ng/l)Methodused
MPCsediment(µg/kg)
NCsediment(ng/kg)
Kpb
(l/kg)Irgarol 1051 24 (2.7-73) EP 1.4 14 58Dichlofluanida - - - - -Ziram 9.7 EP 0.011 0.11 1.16Chlorothalonil 530 (38-
2300)EP 50.6 506 92
TCMTB 380 - - - -aHighly unstable compound, no MPC derivedbCalculated from Koc, assuming standard sediment with 10% organic matter

pag. 26 of 59 RIVM report 601501008
4.2 MPCs for soil
4.2.1 Irgarol 1051For Irgarol, no specific toxicity tests related to soil are available. As for sediment, equilibriumpartitioning is used to derive an MPCsoil of 1.4 µg/kg standard soil with 10% organic matter.
4.2.2 DichlofluanidFor dichlofluanid, Tables 1.1. and 1.2 from Appendix 3 show that the chronic data onmicrobial processes (only data on nitrification are available) are more critical than the chronictoxicity data on Eisenia fetida. Therefore these data are used to derive an MPCsoil fordichlofluanid. The lowest value of 9.3 mg/kg d.w. is used. This value is considered a NOEC(9% effect). Three NOECs are available, so normally the lowest will be divided by a factor 0f10. However, according to Kalf et al. (1999) here the NOEC is divided by a factor of 50 as noacute data are available for the same parameter and process. This yields an MPCsoil of0.19 mg/kg. For comparison; a risk limit based on the earthworm data would yield >0.913mg/kg, this is based on the LC50/1000 which is more critical than the NOEC/100 (2.88mg/kg).
4.2.3 ZiramFor ziram one use-full chronic test was found, a NOEC on the process sulfur oxidation of 292mg/kg standard soil. This value is divided by 100 to yield an MPCsoil of 2.92 mg/kg. TheMPCsoil based on equilibrium partitioning is 0.011 µg/kg (Table 4.1.) and therefore is morestringent than the MPC based on sulfur oxidation. Therefore, for ziram an MPCsoil is proposedof 0.011 µg/kg.
4.2.4 ChlorothalonilFor terrestrial processes 6 chronic data are available for three processes (nitrification, sulfuroxidation and respiration), and 14 acute data are available for processes. In addition, 5 data onenzyme activity are found (Tables 3.1. and 3.2.). No refined assessment was used for thechronic data as only three different processes are covered. The lowest chronic value is 15mg/kg standard soil for nitrification, the lowest acute value is 0.5 mg/kg standard soil foraerobic nitrogen fixation. As three NOECs are available the risk limit is 0.3 mg/kg(NOEC/50) which is also protective for the acute effects on terrestrial processes and enzymeactivity.For terrestrial species, chronic data for three species (Table 3.3.), i.e. fungi, bacteriophyta andearthworm. The lowest observed toxicity value is a LOEC (52% effect) of 5 mg/kg standardsoil. This value is converted into a NOEC of 0.5 mg/kg, according to methods generallyapplied within the project ‘Setting Integrated Environmental Quality Standards’. Usingpreliminary extrapolation, a risk limit is derived of 0.01 mg/kg standard soil. A factor of 50 isused as no acute data of the same species are available for comparison.So the lowest risk limit derived on direct terrestrial data is 0.01 mg/kg for species, and thisvalue is also lower than the value derived using equilibrium partitioning (Table 4.1.).Therefore, and MPCsoil is proposed for chlorothalonil of 0.01 mg/kg standard soil, which isbased on chronic toxicity data for terrestrial species.
4.2.5 TCMTBFor TCMTB no usable direct terrestrial data are found to base an MPCsoil upon (Table 4.1.).As no partition coefficient is available for TCMTB no MPCsoil can be derived.

RIVM report 601501 008 pag. 27 of 59
Table 4.2. MPCsoil for antifouling substancesCompound Method
usedMPCsoil(µg/kg)
NCsoil(ng/kg)
Kpa
(l/kg)Irgarol 1051 EP 1.4 14 58Dichlofluanid NOEC/50 190 1900 -Ziram EP 0.011 0.11 1.16Chlorothalonil NOEC/50 10 100 -TCMTB - - - -aCalculated from Koc, assuming standard soil

pag. 28 of 59 RIVM report 601501008

RIVM report 601501 008 pag. 29 of 59
5 Discussion
5.1 OccurrenceMany of the TBT-substitutes have other agricultural uses (see Voulvoulis et al., 1999a),therefore the concentrations as encountered in the environment cannot solely be attributed totheir use as antifoulant. Except for Irgarol 1051, no information was encountered in the openliterature on the environmental occurrence in the Netherlands of the chemicals studied here.
Recent studies show that Irgarol 1051 is widely distributed in European estuarine and coastalwaters and sediments. Concentrations found are up to 0.19 µg/l in water and up to 1.7 µg/l inports (Readman et al., 1993; Gough et al., 1994; Dahl and Blanck, 1996; Zhou et al., 1996;Tolosa et al., 1996; Scarlett et al., 1997, 1999; Peñalver et al., 1999). Hall et al. (1999)derived 90th percentiles of the concentrations as measured in several European monitoringstudies and concluded that these were 316 ng/l, 41 ng/l and 19 ng/l in marinas, estuaries andcoastal waters respectively. A clear seasonally bound pattern is observed, with a maximalconcentration in early summer (R. Steen, VU, personal communication; Hall et al., 1999). Inthe Netherlands, along a salinity gradient in the Scheldt, concentrations between 1 and 10 ng/lwere found (Steen et al., 1997). Although the Scheldt is a dense shipping lane, concentrationsencountered in harbors are expected to exceed these values, in conformity with theaforementioned international studies. The measured concentrations are at a same level as thederived MPC. It is concluded that the species composition and thereby ecosystem functioningis not considered protected.
To estimate the environmental concentration of the TBT-substitutes other than Irgarol and tocompare the environmental risks between the various TBT-substitutes and TBT, theinformation from the present report should be combined with information on predictedconcentrations.Van Hattum et al. (1999) developed the ‘MAM-PEC model’, which can be used to predictenvironmental concentrations of antifouling substances in a number of ‘typical’ environments(harbour, estuary, marina, open sea, open sea, shipping lane). The model takes into accountemission factors (e.g. leaching rates, shipping intensities), environmental parameters, andcompound-related physico-chemical properties. A prediction of future environmentalconcentrations of the various antifouling chemicals is hampered by the lack of knowledge ontheir future market-share. Therefore an application factor was introduced, the percentage ofships within a length category to which a product is applied. The model was used to calculateexpected concentrations for TBT, Irgarol and Cu. The predicted concentrations appeared to becomparable to concentrations measured in monitoring studies (Van Hattum et al., 1999).

pag. 30 of 59 RIVM report 601501008
5.2 Effects observed in the fieldField or mesocosm studies were searched for in the open literature for Irgarol 1051,dichlofluanid, ziram and TCMTB. The databases BIOSIS (1985-1996) and CCsearch (1996-2000) were used for literature search.Ernst et al. (1991) published a field study on the use of chlorothalonil in a pond ecosystem.Effects as observed in the field study were lower than expected based upon laboratory data.Water samples were taken on the water surface for analysis directly after spray. Processessuch as sorption to sediment, degradation, dilution, volatilisation and so forth diminished theexposure to chlorothalonil. The diminished exposure explains the differences observed inlaboratory and field data.
5.3 Stability of the antifouling substancesSome of the antifouling substances seem to be relatively unstable. This can haveconsequences for the fate of the substances during the toxicity tests; nominal concentrationscan differ substantially from actual concentrations, which leads to an underestimation of thetoxicity. However, if the test design is geared to the instability of the test compound (e.g. byusing a flow through system) also chronic data can be considered as reliable. Otherwise, acutetest results with a test design that is not designated to the instability of the test compound maynot be reliable.It can be considered to use acute toxicity data as a basis to derive MPCs. The mostly usedend-point in an acute test is lethality, while other endpoints such as growth and reproductionare used in chronic tests. Acute data can also be extrapolated with species sensitivitydistributions. However the results should be extrapolated to other type of endpoints and to achronic situation. For both types of extrapolation, information is needed on extrapolationfactors related to the specific mode of action of the chemical considered. These extrapolationfactors are not generally available in the open literature. Therefore, we prefer to base the MPCon chronic data if available.An extrapolation based on acute data can be used when compounds are instable. Thecompounds studied here, certainly if applied as antifouling agent, have a continuous input inthe environment and thus can be monitored.A literature inventory is made on the stability of the antifouling substances evaluated in thisreport.
5.3.1 Irgarol 1051Klisenko and Vekhstein (1971) found that Irgarol 1051 was hydrolysed relatively fast,especially at low pH (DT50=0.01 d at pH 3.8, DT50=0.38 d at pH 5.7, DT50=5 d at pH 7.0and DT50=18 d at pH 8.0). More recent studies, however, show Irgarol 1051 to be relativelystable. Liu et al. (1999) showed that Irgarol 1051 is stable in distilled water in the pH-range5.0-9.0. At low concentrations of HgCl2 (20 mg/l), Irgarol 1051 concentrations quicklydecreased which points to catalysed chemical hydrolysis. Catalysed hydrolysis of Irgarol 1051

RIVM report 601501 008 pag. 31 of 59
did not occur with other tested heavy metal salts, i.e. AgNO3, CdCl2, CuSO4, PbCl2 and ZnCl2
(Liu et al., 1999).It is concluded that in the pH-range that is relevant for field circumstances and for toxicitytests, hydrolysis does not hamper the interpretation of the literature data.
In sea- and freshwater sediment, degradation of Irgarol 1051 is slow and the compound is notreadily biodegraded (cited in Scarlett et al., 1999 and Voulvoulis et al. 1999a). Irgarol 1051was not transformed by a mixture of natural bacteria from Lake Ontario even after anincubation of 5 months (Liu et al., 1997). Irgarol is stable in the marine environment (Callowand Willingham, 1996; Readman, 1996). However, a fungus (Phanerochaete chrysosporium)was able to transform Irgarol 1051 by n-de-alkylation. The metabolite was stable under thetest conditions (Liu et al., 1997). Ciba-Geigy (1995) reported a half-life of Irgarol 1051 insediments of 100-200d.Taken together, the interpretation of data on ecotoxicology and environmental fate of Irgarol1051 used to derive an MPC is not hampered by a lack of stability.
5.3.2 DichlofluanidDichlofluanid is unstable in an alkaline aqueous environment, it undergoes hydrolysis to theprincipal metabolite dimethylaminosulphanilide (DMSA, MW = 200.26 g/mol, Figure 4.1.)At pH 7.7 –7.9 and 21°C a DT50 was found of approximately 2 h (Jansma and Linders,1992). A second hydrolysis study performed in buffered solutions, yielded DT50 values of15.3 d at pH 4, 19 h at pH 7 and <10 minutes at pH 9 (Jansma and Linders, 1992). No parentcompound could be detected at pH 9 even if analysis was performed immediately. The half-life of the parent compound is clearly depending on the pH.As can be found in Table 2.1. of Appendix 2, in the static toxicity tests concentrationsdropped fast from a nominal concentration 0.05 to 0.12 mg/l at the beginning of the exposureto a concentration below the detection limit (0.02 mg/l) within a time frame of 48 h. As thepH during the toxicity tests is between 7 and 8 (Table 2.1. in appendix 2), DT50 will inbetween 19 h and <10 minutes, according to the aforementioned information. Toxicity wasobserved however, and can presumably be attributed to the products formed (DMSA). Themost critical toxicity study (based on nominal concentrations) to base an MPC upon, was a96h acute toxicity test with fish performed at a pH 7.2-8.0. Although the toxicity wasexpressed as nominal concentration, also analyses were performed. DMSA was not analysedin the toxicity studies.It is recommended to base an MPC for dichlofluanid on the important metabolites. Because ofits instability no MPC is derived for the parent compound. Whenever dichlofluanid ismeasured in the field, this point to a severe situation that probably results in toxicity.
N S NCH3
CH3
O
O
Figure 4.1. Structural formula of DMSA

pag. 32 of 59 RIVM report 601501008
5.3.3 ChlorothalonilLaboratory investigations of the photodegradation by direct photolysis (lambda > 290 nm)show that the photolysis of chlorothalonil in water is low (Millet et al., 1998; Peñuela andBarceló, 1998). Extrapolating the laboratory data to half-lives in the environment yieldedvalues of 30 to 200d (Millet et al., 1998).In soil, chlorothalonil is degraded by microbial action. Motonaga et al. (1998) and othersbefore them, showed that after first application the DT50 in soil is relatively short(approximately 2 weeks), but after repeated application the dissipation rate decreases whichwas explained by the toxicity of the metabolite 4-hydroxy-2,5,6-trichloroisophtalonitrile(TPN-OH) to the microbes. TPN-OH was proved to be stable in soil (Van der Pas et al.,1999). In situ (Dutch flower bulb plants) the amounts of TPN-OH found in soil correspond toup to 16% of the cumulative dose of chlorothalonil that was used (Van der Pas et al., 1999).As the MPC is derived based on aquatic toxicity studies, for sediment multiplied with a field-derived partition coefficient (in which biodegradation is taken into account), it is not believedthat instability of chlorothalonil troubles the interpretation of toxicity data nor the derivationof MPCs.
5.3.4 ZiramZiram is not persistent. A study of Brisou and Denis (1969) reports hydrolysis DT50 values at18-20 °C of 0.2 h (pH 3.8), 9.1 h (pH 5.7), 5 d (pH 7) and 18 d (pH 8). Again, hydrolysis isdependent on pH. A major product after hydrolysis is CS2.In the pH range in which the toxicity studies are performed (pH>7.5), DT50 is higher than thetest duration of at least acute toxicity tests, so the parent compound will mainly be responsiblefor the toxicity and the interpretation of the toxicity tests will not be hampered.
5.3.5 TCMTBTCMTB appears to be metabolised in soil under aerobic conditions (Fathulla, 1994). DT50reported at 20°C is 3.4 d. 2-Mercaptobenzothiazole (MBT) appears the most importantmetabolite, the DT50 of the metabolite under the same circumstances is 1 d. In a water andsediment system, DT50 is 3 d. (Van der Pol and van der Linde, 1999).Hydrolysis rates appear to depend on pH; at pH 5 and 7 DT50s are longer than 35 d, at pH 9DT50 is 2-3 d (Van der Pol and van der Linde, 1999). TCMTB is rapidly photolysed in water,reported DT50s are 1.5 and 3.9 h, and main metabolite is again 2-mercaptobenzothiazole.However, photolysis rate in a laboratory or a field situation may differ significantly. It is veryplausible that especially photolysis plays an important role in the toxicity studies, and that 2-mercaptobenzothiazole is at least partly responsible for the observed toxic effects. The MPCderived is based on a study where the actual concentration is measured.
5.4 Mixture toxicityAs for antifouling various chemicals are used, and their main emittance will be in identicalareas (i.e. shipping lanes, harbors etc.), mixture toxicity will certainly play a role in the field.We did not consider mixture toxicity in this report, however a so-called ‘toxic unit’ approachcan be used (Könemann, 1981) for assessing site-specific situations.

RIVM report 601501 008 pag. 33 of 59
An MPC for the toxicity of copper and zinc was covered by Crommentuijn et al. (1997b). Forziram zinc is used as a counterion, and the complex will partly dissociate in the water phase.The degree of dissociation will depend on environmental conditions such as pH and thepresence of zinc ions and other counterions. For reason of the uncertainty in the speciation,we did not integrate the toxicity of zinc in the MPC for ziram. As zinc is very commonlymonitored, an exceeding of the MPC for zinc will be observed separately.

pag. 34 of 59 RIVM report 601501008
ReferencesAldenberg, T. (1993) A program to calculate confidence limits for hazardous concentrations based on small
samples of toxicity data. RIVM Rreport no. 719102015
Aldenberg, T.; Slob, W. (1993) Confidence limits for hazardous concentrations based on logistically distributedNOEC toxicity data. Ecotox. Environ. Saf. 25:48-63.
Aldenberg, T.; Jaworska, J.S. (2000) Uncertainty of the hazardous concentration and fraction affected for normalspecies sensitivity distributions. Ecotoxicol. Environ. Saf. 46:1-18.
Brisou, J.; Denis, F. (1969) Utilisation des bacteries pour la detection de certains pesticides. Comp. Rend. Soc.Biol. 6:1426-1427.
Brownlee, B.G.; Carey, J.H.; MacInnis, G.A.; Pellizzari, I.T. (1992) Aquatic environmental chemistry of 2-(thiocyanomethylthio)bezothiazole and related benzothiazoles. Environ. Toxicol. Chem. 11:1153-1168
Callow, M.E.; Willingham, G.L. (1996) Degradation of antifouling biocides. Biofouling 10: 239-249
Caux, P-Y.; Kent, R.A.; Fan, G.T.; Stephenson, G.L. (1996) Environmental fate and effects of chlorothalonil: aCanadian perspective. Crit. Rev. Toxicol. 26:45-93.
Ciba-Geigy (1995) Irgarol 1051 in antifouling paints. Technical information bulletin. Ciba-Geigy, Basel,Switzerland
Clare, A.S. (1996) Marine natural product antifoulants: Status and potential. Biofouling 9:211-229
Crommentuijn, T., Kalf, D.F.; Polder, M.D.; Posthumus, R.; Van de Plassche, E.J. (1997a) MaximumPermissible concentrations and negligible concentrations for pesticides. RIVM report no. 601501 002.
Crommentuijn, T., M.D. Polder and E.J. van de Plassche (1997b). Maximum Permissible Concentrations andNegligible Concentrations for metals: taking background concentrations into account. RIVM report no.601501 001.
Dahl, B.; Blanck, H. (1996) Toxic effects of the antifouling agent Irgarol 1051 on periphyton communities incoastal water microcosms. Mar. Pollut. Bull. 32:342-350
Davies, P.E.; Cook, L.S.J.; Goenarso, D. (1994) Sublethal responses to pesticides of several species of australianfreshwater fish and crustaceans and rainbow trout. Environ. Toxicol. Chem. 13:1341-1354
De Bruijn, J.; Crommentuijn, T.; Van Leeuwen, K.; Van der Plassche, E.; Sijm, D.; Van der Weiden, M. (1999)Environmental Risk Limits in the Netherlands. RIVM report no. 601640001.
Deneer, J.W., Sinnige, T.L., Seinen, W. and Hermens, J.L.M. (1988). The joint acute toxicity to Daphnia magnaof industrial organic chemicals at low concentrations. Aquatic Toxicology, 12: 33-38.
DiToro, D.M.; Zarba. C.S.; Hanssen, D.J.; Berry, W.J.; Swartz, R.C.; Cowan, C.E.; Pavlou, S.P.; Allen, H.E.;Thomas, N.A.; Paquin, P.R. (1991) Technical basis for establishing sediment quality criteria for nonionicorganic chemicals using equilibrium partitioning. Environ. Toxicol. Chem. 10:1541-1583
ECB (1996) Technical Guidance Documents in support of the Commission Directive 93/67/EEC on RiskAssessment for New Notified Substances and the Commission Regulation (ec) 1488/94 on RiskAssessment for Existing Substances. Ispra, Italy.
Ernst, W.; Doe, K.; Jonah, P.; Young, J.; Julien, G.; Hennigar, P. (1991) The toxicity of chlorothalonil to aquaticfauna and the impact of its operational use on a pond ecosystem. Arch. Environ. Contam. Toxicol. 21:1-9.
Fathulla, R.N. (1994) Aerobic soil meatbolism of 14C-TCMTB. Hazleton. Report no. HWI 6176-169. 100 pp.USA
Flemming, H-C.; Griebe, T.; Schaule, G. (1996) Antifouling strategies in technical systems - a short review.Wat. Sci. Tech. 34:517-524
Gallagher, E. P.; Di Giulio, R.T. (1992a) Glutathione-mediated chlorothalonil detoxification in channel catfishgills. Mar. Environ. Res. 34: 221-226
Gallagher, E.P.; Canada, A.T.; Di Giulio, R.T. (1992b) The protective role of glutathione in chlorothalonil-induced toxicity to channel catfish.
Gough, M.A.; Fothergill, J.; Hendrie, J.D. (1994) A survey of Southern England coastal waters for the s-triazine

RIVM report 601501 008 pag. 35 of 59
antifouling compound Irgarol 1051. Mar. Pollut. Bull. 28:613-620.
Graphpad Prism® [computer program]. Windows 95 /NT version. Version 2.01. San Diego (US): GraphpadSoftware Inc., 1996.
Hall, L.W.; Giddings, J.M.; Solomon, K.R.; Balcomb, R. (1999) An ecological risk assessment for the use ofIrgarol 1051 as an algaecide for antifoulant paints. Crit. Rev. Toxicol. 29:367-437.
Holt, J.S. (1993) Mechanisms and agronomic aspects of herbicide resistence. Ann. Rev. Plant Physiol. PlantMol. Biol. 44:203-229
Jansma, J.W.; Linders, J. (1992) Dichlofluanide. Advisory report nr. 88/678801/090, RIVM/CSR (In Dutch)
Jongbloed, R.; Luttik, R. (1996) 2-methylthio-4-tertbutylamino-cylcopropylamino-s-triazine (Irgarol 1051).Advisory report nr. 4351, RIVM/CSR (In Dutch)
Kalf, D.F.; Mensink, B.J.W.G.; Montforts, M.H.M.M. (1999) Protocol for the derivation of harmonisedmaximum permissible concentrations (MPCs). RIVM report no. 601506 001
Karickhoff, S.W. (1981) Semi-empirical estimation of sorption of hydrophobic pollutants on natural sedimentsand soils. Chemosphere 10:833-846
Klisenko, M.A.; Vekhstein, M.Sh. (1971) Kinetics of the hydrolysis of metal derivatives ofdialkyldithiocarbamic and ethylenebisdithiocarbamic acids in their dependence on the pH of the medium,and identification of their transformation products. Zh. Obshch. Khimii 5: 1125-1130.
Könemann, H. (1981) Fish toxicity tests with mixtures of more than two chemicals: a proposal for a quantitativeapproach and experimental results. Toxicology 19:229-238.
Kooijman, S.A.L.M. (1987) A safety factor for LC50 allowing differences in sensitivity among species. Wat.Res. 21: 269-276
Kruzynski, G.M.; Birtwell, I.K. (1994a) A predation bioassay to quantify the ecological significance of sublethalresponses of juvenile chinook salmon (Onchorhynchus tshawytscha) to the antisapstain fungicideTCMTB. Can. J. Fish. Aquat. Sci. 51: 1780-1790
Kruzynski, G.M.; Birtwell, I.K.; Chew, G.L. (1994b) Behavioural approaches to demonstrate the ecologicalsignificance of exposure of juvenile Pacific salmon (genus Oncorhynchus) to the antisapstain fungicideTCMTB. J. Aquat. Ecosystem Health 3:113-127
Liu, D.; Maguire, R.J.; Lau, Y.L.; Pacepavicius, G.J.; Okamura, H.; Aoyama, I. (1997) Transformation of thenew antifouling compound Irgarol 1051 by Phanerochaete chrysosporium. Wat. Res. 31:2363-2369.
Liu, D.; Pacepavicius, G.J.; Maguire, R.J.; Lau, Y.L.; Okamura, H.; Aoyama, I. (1999) Mercuric chloride-catalyzed hydrolysis of the new antifouling compound Irgarol 1051. Wat. Res. 33:155-163
MacKinnon, D.L.; Farrell, A.P. (1992) The effect of 2-(thiocyanomethylthio)benzothiazole on juvenile cohosalmon (Oncorhynchus kisutch): sublethal toxicity testing. Environ. Toxicol. Chem. 11:1541-1548
Millet, M.; Palm, W-U.; Zetsch, C. (1998) Abiotic degradation of halobenzonitriles: Investigation of thephotolysis in solution. Ecotox. Environ. Saf. 41:44-50.
Montforts, M.H.M.M. (1999) Chlorothalonil. CSR advisory report 06105A00
Motonaga, K.; Takagi, K.; Matumoto, S. (1998) Suppression of chlorothalonil degradation in soil after repeatedapplication. Environ. Toxicol. Chem. 17:1469-1472.
Ordelman, H.G.K.; Van Noort, P.C.M.; Van Steenwijk, J.M.; Ten Hulscher, T.E.M.; Beek, M.A.; Botterweg, J.;Faasen, R.; Frintrop, P.C.M.; Evers, H.G. (1993) Dithiocarbamaten, een analyse van de problematiek inaquatisch milieu. RIZA nota 93.025
Peñalver, A.; Pocurull, E.; Borrull, F.; Marcé, R.M. (1999) Solid-phase microextraction of the antifouling Irgarol1051 and the fungicides dichlofluanid and 4-chloro-3-methylphenol in water samples. J. Chromatogr. A.839:253-260.
Peñuela, G.A.; Barceló,, D. (1998) Photodegradation and stability of chlorothalonil in water studied by solid-phase disk extraction, followed by gas chromatographic techniques. J. Chromatogr. A 823:81-90.
Posthumus, R. (1999) MTR voor chloorthalonil. CSR advisory report 06532a00
Readman, J.W.; Wee Kwong, L.L.; Grondin, D.; Bartocci, J.; Villeneuve, J.P.; Mee, L.D. (1993) Coastal water

pag. 36 of 59 RIVM report 601501008
contamination from a triazine herbicide used in antifouling paints. Environ. Sci. Technol. 27: 1940-1942
Readman, J. (1996) Antifouling herbicides-a threat to the marine environment? Mar. Poll. Bull. 32:320-321
Reuther, C.; Crommentuijn, T.; Van de Plassche, E.J. (1998) Maximum permissible concentrations andnegligible concentrations for aniline derivatives. RIVM report no. 601501 003
Rogers, H.R.; Watts, C.D.; Johnson, J. (1996) Comparative predictions of Irgarol 1051 and atrazine fate andtoxicity. Environ. Technol. 17: 553-556.
Scarlett A, Donkin ME, Fileman TW, Donkin P. (1997) Occurence of the marine antifouling agent Irgarol 1051within the Plymouth Sound locality; implications for the green macroalga Enteroporpha intestinalis . MarPollut Bull 34: 645-651.
Scarlett, A.; Donkin, P.; Fileman, T.W.; Evans, S.V.; Donkin, M.E. (1999) Risk posed by the antifouling agentIrgarol 1051 to the seagrass Zostera marina. Aquat. Toxicol. 45:159-170
Solomon, K.R.; Baker, D.B.; Richards, R.P.; Dixon, K.R.; Klaine, S.J.; La Point, T.W.; Kendall, R.J.;Weisskopf, C.P.; Giddings, J.M.; Giesy, J.P.; Hall, L.W.; Williams, W.M. (1996) Ecological riskassessment of atrazine in North American surface waters. Environ. Toxicol. Chem. 15:31-76.
SRC (1997) SRC-Log Kow for windows, version 1.53.
Steen, R.J.C.A.; Leonards, P.E.G.; Brinkman, U.A.Th.; Cofino, W.P. (1997) Ultra-trace-level determination ofthe antifouling agent Irgarol 1051 by gas chromatography with tandem mass spectrometric detection. J.Chromat. 766:153-158.
Tanabe, S.; Prudente, M.; Mizuno, T.; Hasegawa, J.; Iwata, H.; Miyazaki, N. (1998) Butyltin contamination inmarine mammals from North Pacific and Asian coastal waters. Environ. Sci. Technol. 32:193-198.
Ten Hallers-Tjabbes, C.C.; Kemp, J.F.; Boon, J.P. (1994) Imposex in Whelks (Buccinum undatum) from theOpen North Sea: Relation to Shipping Traffic Intensities. Mar. Pollut. Bull. 28:311-313.
Tibosch, H.; Luttik, R.; Linders, J. (1993) Ziram. Advisory report no. 93/67101/100, 1st amendment,RIVM/CSR (In Dutch)
Tolosa, I.; Readman, J.W.; Blaevoet, A.; Ghilini, S.; Bartucci, J.; Horvat, M. (1996) Contamination ofMediteranean (Cote d’Azûr) coastal waters by organotins and Irgarol 1051 used in antifouling paints.Mar. Pollut. Bull. 32:335-341.
Tomlin, C.D.S. (ed.) (1997) The Pesticide Manual, Eleventh Edition. British Crop Protection Council, Surrey,UK
Van de Plassche, E.J. (1994) Towards integrated environmental quality objectives for several compounds with apotential for secondary poisening. RIVM report no. 679101 012
Van de Plassche, E.J.; Van der Hoop, M.; Posthumus, R.; Crommentuijn, T. (1999) Risk limits for boron,titanium, tellurium, uranium and organosilicon compounds in the framework of EU Directive76/464/EEC. RIVM report no. 601501 005
Van der Pas, L.J.T.; Matser, A.M.; Boesten, J.J.T.I.; Leistra, M. (1999) Behaviour of matamitron and hydroxy-chlorothalonil in low-humic sandy soils. Pestic. Sci. 55:923-934.
Van der Pol, J.J.C.; Van der Linde, A. (1999) TCMTB. Advisory report no. 06456a00, RIVM/CSR (In Dutch)
Van Hattum, B.; Baart, A.C.; Boon, J.G.; Steen, R.; Ariese, F. (1999) Computer model to generate predictedenvironmental concentrations (PECs) for antifouling products in the marine environment. IVM-E99/15,Institute for Environmental Studies, Amsterdam, 68 p.
Van Leeuwen, C.J.; Van der Zandt, P.T.J.; Aldenberg, T.; Verhaar, H.J.M.; Hermens, J.L.M. (1992) Applicationof QSARs, extrapolation and equilibrium partitioning in aquatic effects assessment. I. Narcotic industrialpollutants. Environ. Toxicol. Chem. 11:267-282
Van Leeuwen, C.J., Verhaar, H.J.M. and Hermens, J.L.M. (1996). Quality criteria and risk assessment formixtures of chemicals in the aquatic environment. Human and Ecological Risk Assessment, 2: 419-425.
Van Straalen, N.M.; Denneman, C.A.J. (1989) Ecotoxicological evalutation of soil quality criteria. Ecotoxicol.Environ. Saf. 18:241-251
Van Wezel, A.P.; Traas, T.; Polder, M.; Posthumus, R.; Van Vlaardingen, P.; Crommentuijn, T.; Van derPlassche, E.J. (1999a) Maximum permissible concentrations for polychlorinated biphenyls. RIVM report

RIVM report 601501 008 pag. 37 of 59
no. 601501 006
Van Wezel, A.P.; Posthumus, R.; Van Vlaardingen, P.; Crommentuijn, T.; Van de Plassche, E.J. (1999b)Maximum Permissible Concentrations and Negligible Concentrations for phthalates (dibutylphthalate anddi(2-ethyl-hexyl) phthalate), with special emphasis on endocrine disruptive properties. RIVM report no.601501 007
Voulvoulis, N.; Scrimshaw, M.D.; Lester, J.N. (1999a) Alternative antifouling biocides. Appl. Organometal.Chem. 13:135-143
Voulvoulis, N.; Scrimshaw, M.D.; Lester, J.N. (1999b) Analytical methods for the determination of 9 antifoulingpaint booster biocides in estuarine water samples. Chemosphere 38; 3505-3516
VROM (1989) Premises for risk management. Risk limits in the context of environmental policy. Secondchamber, session 198801989, 21137, no.5
Zhou, J.L.; Fileman, T.W.; Evans, S.; Donkin, P.; Mantoura, R.F.C.; Rowland, S.J. (1996) Seasonal distributionof dissolved pesticides and polynuclear aromatic-hydrocarbons in the Humber estuary and Humbercoastal zone. Mar. Pollut. Bull. 32:599-608

pag. 38 of 59 RIVM report 601501008
Appendix 1: Mailing list1-10. dr. M. van der Weiden (DGM-SAS)11. plv. DG Milieubeheer12. Hoofd afdeling stoffen, DGM-SAS13. dr. S. Boekhold (DGM/BWL)14. dr. G.H. Crommentuijn (DGM/BWL)15. drs. M. Cerutti (RWS/HW)16. drs. K. van de Guchte (RIZA)17. ir. H.Herremans (DGM/LE)18. T. Hummelink (EZ/DGID)19. dr. D. Jung (DGM/SAS)20. dr. A. Kapteijns (DGM/SAS)21. drs. D. Jonkers (DGM/BWL)22. dr. W. Tas (DGM.BWL)22. G. Westenbrink (LNV/MKG)23. C. Hiddink (EZ/DGES)24. dr. J. van Wensem (TCB)25. drs. M. Beek (RIZA)26. dr. E. Sneller (RIZA)27. dr. T. Brock (Alterra)28. drs. S. Dogger (Gezondheidsraad)29. dr. J. Faber (Alterra)30. dr. K. den Haan (VNO/NCW-BMRO)31. drs. M. Koene (Stichting Natuur en Milieu)32. dr. J. Peijnenburg (RIKZ)33. dr. J. Appelman (CTB)34. dr. W. van Tilborg (VNO/NCW-BMRO)35. dr. J. Deneer (Alterra)36. dr. W. Veerkamp (VNO/NCW-BMRO)37. dr. D. van Wijk (VNO/NCW-BMRO)38. dr. W. ten Berge (VNO/NCW-BMRO)39. dr. J. de Boer (RIVO-WAG-UR)40. dr. P. Leonards (RIVO-WAG-UR)41. dr. K. Legierse (RIKZ)42. dr. G.J. Zwolsman (RIZA)43. dr. B. van Hattum (IVM)44. dr. R. Steen (IVM)45. drs. E. van de Plassche (IWACO)46. ir. F. Balk (BKH)47. prof. dr. N. van Straalen (VU)48. drs. M. Scholten (TNO)49. drs. C. Reuther (RWS, Directie Noordzee)50. drs. F. Noppert (RWS, Directie Oost)51. dr. D. Vethaak (RIKZ)52. prof. dr. R. Laane (RIKZ)53. dr. W. Dulfer (RIKZ)54. drs. H. Klamer (RIKZ)55. dr. G. de Maagd (RIZA)

RIVM report 601501 008 pag. 39 of 59
56. ing. G. Broseliske (RIZA)57. ing. G. B.J. Rijs (RIZA)59. ir. M. Vaal (UU, Wetenschapswinkel)60. dr. J. Jaworska (P&G)61. dr. T. Parkerton (Exxon)66. dr. P.Y. Caux (Environment Canada)67. dr. H. Davies (NWS-EPA, Australia)68. dr. M. Warne (Centre for Ecotoxicology, Australia)69. dr. B. Balkan (EPA, Australia)70. dr. G.W. Suter (US-EPA)71. dr. J.J. Scott-Fordsmand (Neri, Denmark)70. Depot Nederlandse Publicaties en Nederlandse Bibliografie71. Directie RIVM72. Sectordirecteur Stoffen en Risico’s73. Sectordirecteur Milieuonderzoek74. Hoofd Centrum voor Stoffen en Risicobeoordeling75. Hoofd Laboratorium voor Ecotoxicologie76. Hoofd Laboratorium voor Water en Drinkwateronderzoek77. Hoofd Laboratorium voor Bodem en Grondwateronderzoek78. Hoofd Laboratorium voor Afvalstoffen en Emissies79. Hoofd Laboratorium voor Effectenonderzoek80. Hoofd Laboratorium voor Organisch-analytische Chemie81. dr. H. Canton (RIVM/ECO)82. dr. D. Sijm (RIVM/CSR)83. dr. J. Struijs (RIVM/ECO)85. dr. W. Peijnenburg (RIVM/ECO)89. ir. J.Lijzen (RIVM/LBG)91. drs. R. Luttik (RIVM/CSR)92. drs. T. Vermeire (RIVM/CSR)93. prof. dr. C. van Leeuwen (RIVM/CSR)95. drs. M.H.M.M. Montforts (RIVM/CSR)97. drs. A. van der Linde (RIVM/CSR)98. dr. C. E. Smit (RIVM/CSR)99. R. Posthumus (RIVM/CSR)100. drs. T.P. Traas (RIVM/CSR)101. SBD Voorlichting en Public Relations102. Bureau Rapportenregistratie103. Bibliotheek RIVM104. Auteur105. Auteur105-125. Bureau Rapportenbeheer125-150. Reserve-exemplaren

pag. 40 of 59 RIVM report 601501008
Appendix 2. Information on the aquatic toxicity of theantifoulings
LegendL(E)C50aqua min lowest short term test result showing 50% effect or mortalityMPC maximum permissible concentrationMPCchronic MPC derived using assessment factors, based solely on chronic
test resultsMPCshort term MPC derived using assessment factors, based solely on short term
test resultsNOEC no observed effect concentrationNOECaqua min lowest no observed effect concentrationOrganism species used in the test, if available followed by age, size, weight
or life stageA Y = test substance analyzed in test solution
N = test substance not analyzed in test solution or no dataTest type S = static, R = static with renewal, F = flow throughTest water a.m. = artificial medium, a.s.w. = artificial seawater, n.f.s =
natural filtered seawater, r.t.w. = reconsituted tap water(+additional salts)
Test substance purity percentage active ingredientExposure time h = hours, d = days, w = weeks, m = months, min. = minutesResults > and ≥ values = highest concentration used in the test

RIV
M re
port
6015
01 0
08
pag.
41
of 5
9
Tabl
e 1.
1. A
cute
toxi
city
of I
rgar
ol 1
051
to fr
eshw
ater
org
anis
ms
Org
anis
mSi
ze (g
)A
Test
-Ty
pePu
rity
Test
-w
ater
pHH
ardn
ess
Exp.
time
Cri
teri
onEn
d-po
int
Res
ult
µg/l
Not
esR
efer
ence
Alg
aeSe
lena
stru
m c
apric
ornu
tum
NS
a.m
.7.
8-8.
372
hEC
50g
4.2
1Jo
ngbl
oed
& L
uttik
, 199
6C
rust
acea
Dap
hnia
mag
naY
S≥
97%
7.7
24 h
EC50
i49
000
Jong
bloe
d &
Lut
tik, 1
996
Pisc
esB
rach
ydan
io re
rio0.
09-0
.16
N≥
97%
96 h
LC50
s40
00Jo
ngbl
oed
& L
uttik
, 199
6Le
pom
is m
acro
chiru
s0.
18-0
.40
N≥
97%
96 h
LC50
s29
00Jo
ngbl
oed
& L
uttik
, 199
6Le
ucis
cus i
dus
YS
≥ 97
%7.
848
hLC
50s
6200
Jong
bloe
d &
Lut
tik, 1
996
Onc
orhy
nchu
s myk
iss
1.1-
2.1
N≥
97%
96 h
LC50
s94
0Jo
ngbl
oed
& L
uttik
, 199
6O
ncor
hync
hus m
ykis
s0.
5-1.
4N
≥ 97
%96
hLC
50s
860
Jong
bloe
d &
Lut
tik, 1
996
1 Ef
fect
con
cent
ratio
n re
calc
ulat
ed.
Tabl
e 1.
2. A
cute
toxi
city
of I
rgar
ol 1
051
to s
altw
ater
org
anis
ms
Org
anis
mSi
zeA
Test
-ty
pePu
rity
Test
-w
ater
pHSa
linity
o/oo
Exp.
time
Cri
teri
onEn
d-po
int
Res
ult
µg/l
Not
esR
efer
ence
Mac
roph
yta
Ente
rom
orph
a in
test
inal
isZo
o-sp
ores
>97%
a.m
.14
4 h
NO
ECg
0.02
21
Scar
lett
et a
l., 1
997
Ente
rom
orph
a in
test
inal
ism
atur
e>9
7%a.
m.
72 h
EC50
foto
syn- th
esis
2.5
Scar
lett
et a
l., 1
997
Zost
era
mar
ina
NR
>97%
seaw
.35
‰10
dLO
ECg
10Sc
arle
tt et
al.,
199
7C
rust
acea
Mys
idop
sis b
ahia
2-4
dN
S98
.6%
7.5-
7.7
28-3
4‰96
hLC
50s
430
Jong
bloe
d &
Lut
tik, 1
996
Pisc
esC
yprin
odon
var
iega
tus
0.22
gY
F98
%7.
896
hLC
50s
3400
Jong
bloe
d &
Lut
tik, 1
996
Men
idia
ber
yllin
aY
S98
%se
a w
.8
2‰96
hLC
50s
1770
Jong
bloe
d &
Lut
tik, 1
996
1 Ef
fect
con
cent
ratio
n re
calc
ulat
ed

pag.
42
of 5
9
R
IVM
repo
rt 60
1501
008
Tabl
e 1.
3. C
hron
ic to
xici
ty o
f Irg
arol
105
1 to
fres
hwat
er o
rgan
ism
sO
rgan
ism
Size
AT
est-
Type
Puri
tyTe
st-
wat
erpH
Har
d-n
ess
Exp.
Tim
eC
rite
rion
End-
poin
tR
esul
tµg
/lN
otes
Ref
eren
ce
Alg
ae
Ana
baen
a flo
s-aq
uae
YS
98.2
%a.
m.
7.5
120
hN
OEC
G0.
54Jo
ngbl
oed
& L
uttik
, 199
6N
avic
ula
pelli
culo
saY
S98
.2%
a.m
.7.
612
0 h
EC10
G0.
017
1Jo
ngbl
oed
& L
uttik
, 199
6Sc
ened
esm
us su
bspi
catu
sY
S7.
7-9.
672
hN
OEC
G0.
23Jo
ngbl
oed
& L
uttik
, 199
6Se
lena
stru
m c
apric
ornu
tum
YS
98.2
%a.
m.
7.5
120
hN
OEC
G0.
65Jo
ngbl
oed
& L
uttik
, 199
6M
acro
phyt
aLe
mna
Gib
baY
S98
.2%
7.9-
9.4
14 d
NO
ECG
0.4
Jong
bloe
d &
Lut
tik, 1
996
Pisc
esO
ncor
hync
hus m
ykis
se.
l.sY
98%
7.8
98 d
LOEC
G<2
92
Jong
bloe
d &
Lut
tik, 1
996
1 Ef
fect
con
cent
ratio
n re
calc
ulat
ed.
2 N
o ef
fect
s on
hatc
h, fr
y su
rviv
al o
r gro
wth
wer
e ob
serv
ed in
the
stud
y, y
ield
ing
LOEC
>37
µg/
l. In
a p
relim
inar
y st
udy
all c
once
ntra
tions
show
ed si
gnifi
cant
redu
ctio
n an
da
LOEC
<29
µg/
l was
det
erm
ined
. The
se re
sults
are
com
bine
d.
Tabl
e 1.
4. C
hron
ic to
xici
ty o
f Irg
arol
105
1 to
sal
twat
er o
rgan
ism
sO
gani
smA
Test
-Ty
pePu
rity
Test
-W
ater
pHSa
linity o/
oo
Exp.
time
Cri
teri
onEn
d-Po
int
Res
ult
µg/l
Ref
eren
ce
Alg
aeSk
elet
onem
a co
stat
umY
S98
.2%
a.m
.8.
330
‰12
0 h
NO
ECG
0.14
Jong
bloe
d &
Lut
tik, 1
996
Cru
stac
eaM
ysid
opsi
s bah
iaY
F≥
97%
7.5-
8.3
20 ‰
28 d
NO
ECG
110
Jong
bloe
d &
Lut
tik, 1
996
Tabl
e 1.
5. A
cute
toxi
city
of I
rgar
ol 1
051
to fr
eshw
ater
org
anis
ms:
rej
ecte
d te
sts
Org
anis
mA
Test
-ty
pePu
rity
Test
-w
ater
pHH
ardn
ess
Exp.
time
Cri
te-
rion
End-
poin
tR
esul
tµg
/lR
efer
ence
Cru
stac
eaD
aphn
ia m
agna
YS
≥ 97
%7.
848
hEC
50I
8100
Jong
bloe
d &
Lut
tik, 1
996
Rej
ecte
d as
test
com
poun
d di
d no
t dis
solv
e at
t=0
in so
me
test
con
cent
ratio
ns.

RIV
M re
port
6015
01 0
08
pag.
43
of 5
9
Tabl
e 2.
1. A
cute
toxi
city
of d
ichl
oflu
anid
to fr
eshw
ater
org
anis
ms
Org
anis
mSi
ze (g
)A
Test
-ty
pePu
rity
Test
-w
ater
pHH
ardn
ess
(mg
CaC
O3/l
)Ex
p.Ti
me
Cri
te-
rion
End-
poin
tR
esul
tm
g/l
Not
esR
efer
ence
Cru
stac
eaD
aphn
ia m
agna
NS
94.1
%a.
m.
~ 8
48 h
LC50
s>1
.8H
eim
bach
, 198
3D
aphn
ia m
agna
YF
88.2
wel
l wat
er8.
2-8.
322
5-27
548
hLC
500.
373
Fraz
ier e
t al.,
198
6Pi
sces
Lepo
mis
mac
roch
irus
1.5
± 0.
4Y
F88
.5w
ell w
ater
7.9-
8.2
225-
275
96 h
LC50
0.02
54
Swig
ert e
t al.,
198
6a
Leuc
iscu
s idu
s mel
anot
us1.
5-1.
8A
S90
%a.
m.
7.2-
8.0
255
96 h
LC50
s0.
121
Ano
nym
us, 1
980
Leuc
iscu
s idu
s mel
anot
us1.
5A
R90
%a.
m.
7.5-
8.0
255
96 h
LC50
s0.
122
Jans
ma
and
Lind
ers,
1992
Onc
orhy
nchu
s myk
iss
0.6-
1.5
AS
90%
a.m
.7.
2-8.
025
596
hLC
50s
0.05
1A
nony
mus
, 197
9O
ncor
hync
hus m
ykis
s0.
35±0
.071
YF
88.5
wel
l wat
er8.
0-8.
222
5-27
596
hLC
500.
011
Swig
ert e
t al.,
198
6b
1 R
esul
t bas
ed o
n no
min
al v
alue
s: th
e pa
rent
com
poun
d w
as m
easu
red
in te
st w
ater
with
out f
ish:
a n
omin
al c
once
ntra
tion
of 1
mg/
l dec
reas
ed to
0.3
4 m
g/l a
fter 2
h a
nd to
<0.0
2 (d
etec
tion
limit)
afte
r 48
h.2
Res
ult b
ased
on
nom
inal
val
ues:
the
pare
nt c
ompo
und
was
mea
sure
d in
test
wat
er w
ithou
t fis
h: a
nom
inal
con
cent
ratio
n of
1 m
g/l d
ecre
ased
to 0
.49
mg/
l afte
r 5 m
in, t
o 0.
34m
g/l a
fter 2
h, t
o 0.
11 m
g/l a
fter 2
4 h
and
to <
0.02
(det
ectio
n lim
it) a
fter 4
8 h.
3 R
esul
t bas
ed o
n ac
tual
con
cent
ratio
ns:re
cove
ry is
50
± 4%
(ave
rage
) of n
omin
al a
t t=4
8 h,
due
to h
ydro
lysi
s of a
naly
te.
4 A
ll te
st c
once
ntra
tions
show
ed m
orta
lity
thro
ugho
ut th
e te
st.
Tabl
e 2.
2. C
hron
ic to
xici
ty o
f dic
hlof
luan
id to
fres
hwat
er o
rgan
ism
sO
rgan
ism
ATe
st-
type
Puri
tyTe
st-
wat
erpH
Har
dnes
sEx
p.tim
eC
rite
-ri
onEn
d-po
int
Res
ult
mg/
lN
otes
Ref
eren
ce
Cru
stac
eaD
aphn
ia m
agna
YR
91.4
%a.
m.
8.0-
8.2
24 d
NO
ECr
0.04
1Ja
nsm
a an
d Li
nder
s, 19
92Pi
sces
Onc
orhy
nchu
s myk
iss
YF
91.4
a.m
.6.
6-7.
640
-60
21 d
LC50
m0.
016
2G
rau,
198
91
pare
nt c
ompo
und
coul
d no
t be
anal
yzed
bef
ore
rene
wal
due
to h
ydro
lysi
s. 10
rene
wal
s wer
e pe
rfor
med
dur
ing
the
test
perio
d.2
NO
EC c
an n
ot b
e de
term
ined
from
thes
e da
ta.
Tabl
e 2.
3. A
cute
toxi
city
of d
ichl
oflu
anid
to fr
eshw
ater
org
anis
ms:
rej
ecte
dO
rgan
ism
Size
(g)
ATe
st-
Type
Puri
tyTe
st-
wat
erpH
Har
dnes
sm
g C
aCO
3/lEx
p.tim
eC
rite
-ri
onEn
d-po
int
Res
ult
mg/
lN
otes
Ref
eren
ce
Pisc
esO
ncor
hync
hus m
ykis
s0.
84A
R90
%a.
m.
7.5-
8.0
255
96 h
LC50
s0.
02-
1Ja
nsm
a an
d Li
nder
s, 19
92

pag.
44
of 5
9
R
IVM
repo
rt 60
1501
008
0.05
1 no
effe
ct c
once
ntra
tion
esta
blis
hed,
2 c
once
ntra
tions
0.0
2 an
d 0.
05 m
g/l.
Tabl
e 2.
4. C
hron
ic to
xici
ty o
f dic
hlof
luan
id to
fres
hwat
er o
rgan
ism
s: r
ejec
ted
Org
anis
mA
Test
-Ty
pePu
rity
Test
-w
ater
pHH
ardn
ess
Exp.
time
Cri
te-
rion
End-
poin
tR
esul
tm
g/l
Not
esR
efer
ence
Alg
aeSc
ened
esm
us su
bspi
catu
sN
S86
.2%
a.m
.7.
5-8.
596
hN
OEC
g≥1
1H
eim
bach
, 198
51
only
two
conc
entra
tions
test
ed: 0
.1 a
nd 1
.0 m
g/l,
23°C
.
Tabl
e 2.
5 W
hole
bod
y bi
ocon
cent
ratio
n fa
ctor
s of
dic
hlof
luan
id fo
r fis
h, b
ased
on
wet
wei
ght
Org
anis
mTe
st-
type
Puri
tyTe
st-
wat
erpH
Har
dnes
sm
g C
aCO
3/lEx
p.tim
eC
onc.
µg/l
equi
l. af
ter
BC
FN
otes
Ref
eren
ce
Lepo
mis
mac
roch
irus
F99
.0a.
m.
7.2
± 0.
248
28 d
4.4
±0.
272
±14
1G
rau,
199
1
1 co
ncen
tratio
n: a
ll 14
C-r
adio
activ
ity is
ass
igne
d to
dic
hlof
luan
id, t
empe
ratu
re: 2
2°C
Tabl
e 2.
6. A
cute
toxi
city
of D
MSA
to fr
eshw
ater
org
anis
ms
Org
anis
mA
Test
-ty
pePu
rity
Test
-w
ater
pHH
ardn
ess
(mg
CaC
O3/l
)Ex
p.tim
eC
rite
-ri
onEn
d-po
int
Res
ult
mg/
lN
otes
Ref
eren
ce
Cru
stac
eaD
aphn
ia m
agna
YS
98.4
%a.
m.
7.7-
7.9
275
48 h
NO
ECim
m≥9
61
Cas
pers
, 199
7b
1 on
e co
ncen
tratio
n te
sted
.
Tabl
e 2.
7. A
cute
toxi
city
of D
MSA
to fr
eshw
ater
org
anis
ms
Org
anis
mSi
ze (g
)A
Test
-Ty
pePu
rity
Test
-w
ater
pHH
ardn
ess
(mg
CaC
O3/l
)Ex
p.tim
eC
rite
-ri
onEn
d-po
int
Res
ult
mg/
lN
otes
Ref
eren
ce
Alg
aeSc
ened
esm
us su
bspi
catu
sY
S98
.9%
a.m
.8.
0-10
.472
hN
OEC
inhi
b≥9
81
Cas
pers
, 199
7a
Pisc
esO
ncor
hync
hus m
ylis
s1.
26±0
.28
YR
98%
a.m
.6.
9-7.
540
-60
21 d
NO
ECg,
m≥1
02
Gra
u, 1
990
LOEC
g, m
≤100
1 on
e co
ncen
tratio
n te
sted
.2
two
conc
entra
tions
test
ed, n
o ef
fect
s at 1
0 m
g/l,
effe
ct o
n gr
owth
and
mor
talit
y si
gnifi
cant
ly d
iffer
ent f
rom
con
trol a
t 100
mg/
l.

RIV
M re
port
6015
01 0
08
pag.
45
of 5
9

pag.
46
of 5
9
R
IVM
repo
rt 60
1501
008
Tabl
e 3.
1. A
cute
toxi
city
of z
iram
to fr
eshw
ater
org
anis
ms
Org
anis
mSt
age
ATe
st-
type
Puri
tyTe
st-
wat
erpH
Har
d-ne
ssEx
p.tim
eC
rite
-ri
onEn
d-po
int
Res
ult
mg/
lR
efer
ence
Alg
aeC
hlor
ella
pyr
enoi
dosa
S≥9
5%a.
m.
96 h
EC50
g1.
2V
an L
eeuw
en e
t al.,
198
5aSe
lena
stru
mca
pric
ornu
tum
YS
98%
a.m
.7.
5-8.
896
hEC
500.
066
Euro
pean
Com
mis
ion,
conc
ept
Cru
stac
eaD
aphn
ia m
agna
YS
98.9
%a.
m.
8.0
48 h
EC50
0.04
8V
an L
eeuw
en e
t al.,
198
5bIn
sect
a
Cul
ex fa
tigan
s2nd
inst
ar24
hLC
50s
0.18
Stru
fe, 1
968
Cul
ex fa
tigan
s3rd
inst
ar24
hLC
50s
0.55
Stru
fe, 1
968
Cul
ex fa
tigan
s4rd
inst
ar24
hLC
50s
1.31
Stru
fe, 1
968
Cul
ex fa
tigan
spu
pae
24 h
LC50
s8.
1St
rufe
, 196
8M
ollu
sca
Dre
isse
na p
olym
orph
aN
Sa.
m.
8.5
5 d
LC50
s1.
8H
oest
land
t, 19
72Pi
sces
Car
assi
us a
urat
usN
S96
hLC
50s
2.3
Tibo
sch
et a
l., 1
993
Car
assi
us a
urat
us≥9
9%48
hLC
50s
0.09
5N
isch
iuch
i, 19
74C
yprin
us c
arpi
o≥9
9%48
hLC
50s
0.07
5N
isch
iuch
i, 19
74Le
pom
is m
acro
chiru
s1.
01 ±
0.4
gY
F98
,9%
a.m
.7.
5-7.
796
hLC
50s
0.00
97Eu
rope
an C
omm
isio
n,co
ncep
tM
isgu
rnus
angu
illac
auda
tus
≥99%
48 h
LC50
s0.
15N
isch
iuch
i, 19
74
Ory
zias
latip
es≥9
9%48
hLC
50s
0.05
6N
isch
iuch
i, 19
74Po
ecili
a re
ticul
ata
R≥9
5%a.
m.
96 h
LC50
s0.
75V
an L
eeuw
en e
t al.,
198
5aO
ncor
hync
hus m
ykis
sN
S96
hLC
50s
0.3
Tibo
sch
et a
l., 1
993
Onc
orhy
nchu
s myk
iss
3.22
± 1
.2 g
YR
98.9
%a.
m.
7.6-
7.9
96 h
LC50
s1.
78Eu
rope
an C
omm
isio
n,co
ncep
t

RIV
M re
port
6015
01 0
08
pag.
47
of 5
9
Tabl
e 3.
2. A
cute
toxi
city
of z
iram
to s
altw
ater
org
anis
ms
Org
anis
mA
Test
-ty
pePu
rity
Test
-w
ater
pHSa
linity
o/oo
Exp.
time
Cri
te-
rion
End-
poin
tR
esul
tm
g/l
Ref
eren
ce
Bac
teri
aV
ibrio
fish
eri
NS
≥95%
15 min
EC50
0.15
Van
Lee
uwen
et a
l., 1
985a
Tabl
e 3.
3. C
hron
ic to
xici
ty o
f zir
am to
fres
hwat
er o
rgan
ism
sO
rgan
ism
Stag
eA
Test
-ty
pePu
rity
Test
-w
ater
pHH
ardn
ess
mg
CaC
O3/l
Exp.
time
Cri
te-
rion
End-
poin
tR
esul
tm
g/l
Not
esR
efer
ence
Cru
stac
eaD
aphn
ia m
agna
<24
hN
R≥9
5%la
ke w
.8.
122
521
dLC
50s
0.01
1V
an L
eeuw
en e
t al.,
198
5bD
aphn
ia m
agna
<24
hN
R≥9
5%la
ke w
.8.
122
521
dN
OEC
s0.
0033
1V
an L
eeuw
en e
t al.,
198
5bPi
sces
Onc
orhy
nchu
s myk
iss
e.l.s
.R
≥90%
a.m
.7.
5-7.
950
60 d
LC50
s0.
002
Van
Lee
uwen
et a
l., 1
985c
Onc
orhy
nchu
s myk
iss
e.l.s
.R
≥90%
a.m
.7.
5-7.
950
60 d
NO
ECs
0.00
061
Van
Lee
uwen
et a
l., 1
985c
1 th
e N
OEC
is c
alcu
late
d by
LO
EC/3
.

pag.
48
of 5
9
R
IVM
repo
rt 60
1501
008
Tab
le 4
.1. A
cute
toxi
city
of c
hlor
otha
loni
l to
fres
hwat
er o
rgan
ism
sO
rgan
ism
ATe
stty
pePu
rity
Test
wat
erpH
Har
dnes
sm
g C
aCO
3/l
Exp.
Tim
eC
rite
-ri
onTy
peef
fect
Res
ult
mg/
lR
efer
ence
Cru
stac
eaA
stac
opsi
s gou
ldi
0.1
gY
S>=
98%
nw6.
5-7.
0-
96 h
LC50
s0.
012
Dav
ies e
t al.,
199
4D
aphn
ia m
agna
< 24
hY
S99
.2%
-7.
115
0-20
048
hEC
50i
0.05
4M
ontfo
rts, 1
999
Dap
hnia
mag
na<
24 h
NS
96%
-7.
2-7.
460
48 h
EC50
i0.
117
Mon
tforts
, 199
9D
aphn
ia m
agna
< 24
hN
S98
.8%
-7.
8-8.
217
248
hEC
50i
0.11
5M
ontfo
rts, 1
999
Dap
hnia
mag
na<
24 h
YS
98.1
%-
7.6-
7.9
-24
hLC
50s
0.19
5M
ontfo
rts, 1
999
Para
taya
aus
tralie
nsis
0.1
gY
S>=
98%
nw6.
5-7.
0-
96 h
LC50
s0.
016
Dav
ies e
t al.,
199
4Pi
sces
Cyp
rinus
car
pio
1.7
gY
F99
.2%
-7.
415
0-20
096
hLC
50s
0.06
Mon
tforts
, 199
9G
alax
ias a
urat
us7-
11 g
YF
>=99
%-
--
96 h
LC50
s0.
029
Dav
ies &
Whi
te, 1
985
Gal
axia
s mac
ulat
us7-
10 g
YF
>=99
%-
--
96 hLC
50s
0.01
6D
avie
s & W
hite
, 198
5
Gal
axia
s tru
ttace
us8-
20 g
YF
>=99
%-
--
96 h
LC50
s0.
019
Dav
ies &
Whi
te, 1
985
Icta
luru
s pun
ctat
us1.
77 g
NS
96%
-6.
7-7.
647
96 h
LC50
s0.
047
Mon
tforts
, 199
9Ic
talu
rus p
unct
atus
40-8
0g
NF
99%
tap
7.0-
7.2
3096
hLC
50s
0.05
2G
alla
gher
et a
l., 1
992
Lepo
mis
mac
roch
irus
1.0
gN
S96
%-
6.8-
7.7
4496
hLC
50s
0.05
9M
ontfo
rts, 1
999
Onc
orhy
nchu
s myk
iss
1.3
gY
F99
.2%
-7.
115
0-20
096
hLC
50s
0.01
7M
ontfo
rts, 1
999
Onc
orhy
nchu
s myk
iss
3.5-
4gN
S97
.8%
tap
7.8±
0.2
96 h
LC50
s0.
076
Erns
t et a
l., 1
991
Onc
orhy
nchu
s myk
iss
1.0
gN
S96
%-
6.5-
7.7
4496
hLC
50s
0.04
3M
ontfo
rts, 1
999
Tabl
e 4.
2. A
cute
toxi
city
of c
hlor
otha
loni
l to
saltw
ater
org
anis
ms
Org
anis
mA
Test
type
Puri
tyTe
stw
ater
pHsa
linity
o/oo
Exp.
time
Cri
te-
rion
Type
effe
ctR
esul
tm
g/l
Ref
eren
ce
Cru
stac
eaPe
naeu
s duo
raru
m1.
1gN
S96
%-
7.4-
7.7
2296
hLC
50s
0.16
2M
ontfo
rts, 1
999
Pena
eus d
uora
rum
NF
tech
--
2748
hEC
500.
320
May
er, 1
987
Mol
lusc
aC
rass
ostre
a vi
rgin
ica
2.6
gY
F96
%-
8.0-
8.2
2296
hEC
50g
0.00
5M
ontfo
rts, 1
999
Cra
ssos
trea
virg
inic
aN
Fte
ch.
--
2796
hEC
500.
026
May
er, 1
987
Pisc
esC
yprin
odon
var
iega
tus
0.5
gN
S96
%-
7.9-
8.1
2496
hLC
50s
0.03
3M
ontfo
rts, 1
999
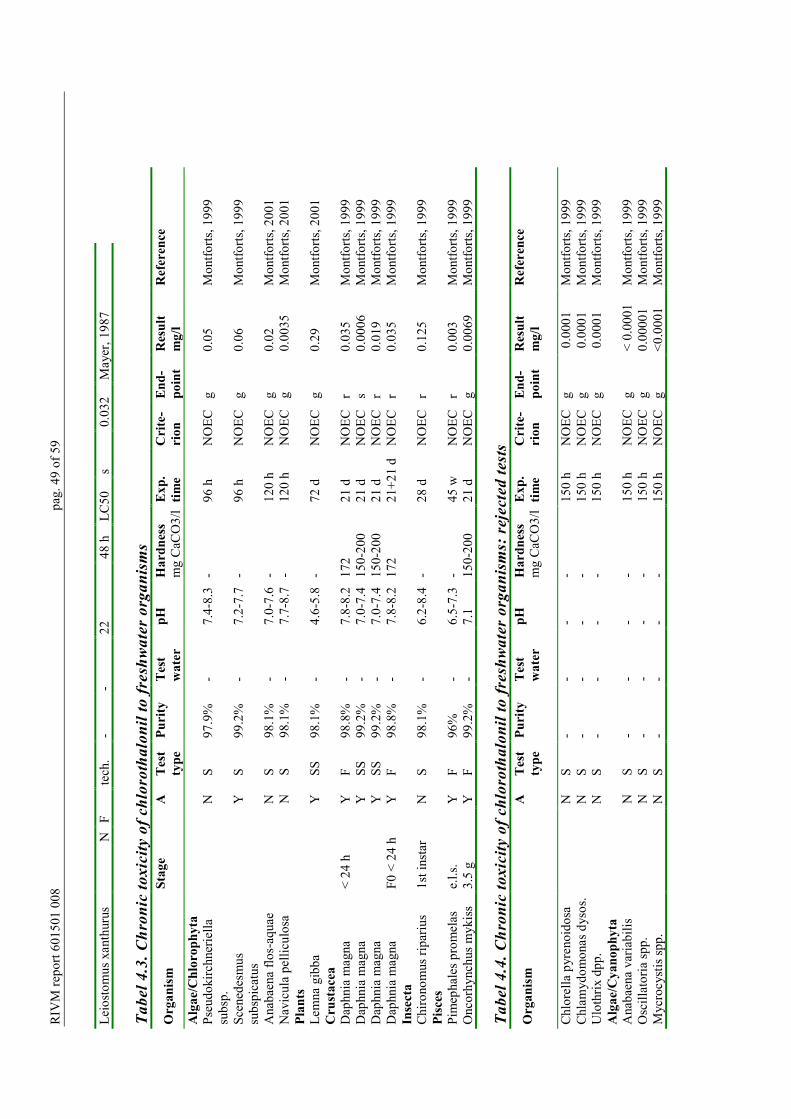
RIV
M re
port
6015
01 0
08
pag.
49
of 5
9
Leio
stom
us x
anth
urus
NF
tech
.-
-22
48 h
LC50
s0.
032
May
er, 1
987
Tabe
l 4.3
. Chr
onic
toxi
city
of c
hlor
otha
loni
l to
fres
hwat
er o
rgan
ism
sO
rgan
ism
Stag
eA
Test
type
Puri
tyTe
stw
ater
pHH
ardn
ess
mg
CaC
O3/
lEx
p.tim
eC
rite
-ri
onEn
d-po
int
Res
ult
mg/
lR
efer
ence
Alg
ae/C
hlor
ophy
taPs
eudo
kirc
hner
iella
subs
p.N
S97
.9%
-7.
4-8.
3-
96 h
NO
ECg
0.05
Mon
tforts
, 199
9
Scen
edes
mus
subs
pica
tus
YS
99.2
%-
7.2-
7.7
-96
hN
OEC
g0.
06M
ontfo
rts, 1
999
Ana
baen
a flo
s-aq
uae
NS
98.1
%-
7.0-
7.6
-12
0 h
NO
ECg
0.02
Mon
tforts
, 200
1N
avic
ula
pelli
culo
saN
S98
.1%
-7.
7-8.
7-
120
hN
OEC
g0.
0035
Mon
tforts
, 200
1Pl
ants
Lem
na g
ibba
YSS
98.1
%-
4.6-
5.8
-72
dN
OEC
g0.
29M
ontfo
rts, 2
001
Cru
stac
eaD
aphn
ia m
agna
< 24
hY
F98
.8%
-7.
8-8.
217
221
dN
OEC
r0.
035
Mon
tforts
, 199
9D
aphn
ia m
agna
YSS
99.2
%-
7.0-
7.4
150-
200
21 d
NO
ECs
0.00
06M
ontfo
rts, 1
999
Dap
hnia
mag
naY
SS99
.2%
-7.
0-7.
415
0-20
021
dN
OEC
r0.
019
Mon
tforts
, 199
9D
aphn
ia m
agna
F0 <
24
hY
F98
.8%
-7.
8-8.
217
221
+21
dN
OEC
r0.
035
Mon
tforts
, 199
9In
sect
aC
hiro
nom
us ri
pariu
s1s
t ins
tar
NS
98.1
%-
6.2-
8.4
-28
dN
OEC
r0.
125
Mon
tforts
, 199
9Pi
sces
Pim
epha
les p
rom
elas
e.l.s
.Y
F96
%-
6.5-
7.3
-45
wN
OEC
r0.
003
Mon
tforts
, 199
9O
ncor
hync
hus m
ykis
s3.
5 g
YF
99.2
%-
7.1
150-
200
21 d
NO
ECg
0.00
69M
ontfo
rts, 1
999
Tabe
l 4.4
. Chr
onic
toxi
city
of c
hlor
otha
loni
l to
fres
hwat
er o
rgan
ism
s: r
ejec
ted
test
sO
rgan
ism
ATe
stty
pePu
rity
Test
wat
erpH
Har
dnes
sm
g C
aCO
3/l
Exp.
time
Cri
te-
rion
End-
poin
tR
esul
tm
g/l
Ref
eren
ce
Chl
orel
la p
yren
oido
saN
S-
--
-15
0 h
NO
ECg
0.0
001
Mon
tforts
, 199
9C
hlam
ydom
onas
dys
os.
NS
--
--
150
hN
OEC
g 0
.000
1M
ontfo
rts, 1
999
Ulo
thrix
dpp
.N
S-
--
-15
0 h
NO
ECg
0.0
001
Mon
tforts
, 199
9A
lgae
/Cya
noph
yta
Ana
baen
a va
riabi
lisN
S-
--
-15
0 h
NO
ECg
< 0.
0001
Mon
tforts
, 199
9O
scill
ator
ia sp
p.N
S-
--
-15
0 h
NO
ECg
0.00
001
Mon
tforts
, 199
9M
ycro
cyst
is sp
p.N
S-
--
-15
0 h
NO
ECg
<0.0
001
Mon
tforts
, 199
9

pag.
50
of 5
9
R
IVM
repo
rt 60
1501
008
Tabl
e 4.
5.C
hron
ic to
xici
ty o
f chl
orot
halo
nil t
o sa
ltwat
er o
rgan
ism
s: r
ejec
ted
test
sO
rgan
ism
Stag
eA
Test
type
Puri
tyTe
stw
ater
pHsa
linity
o/oo
Exp.
time
Cri
te-
rion
End-
poin
tR
esul
tm
g/l
Ref
eren
ce
Cru
stac
eaM
ysid
opsi
s bah
ia<
24 h
YF
98%
-7.
7-8.
031
-33
28 d
NO
ECr
0.00
083
Mon
tforts
, 199
9
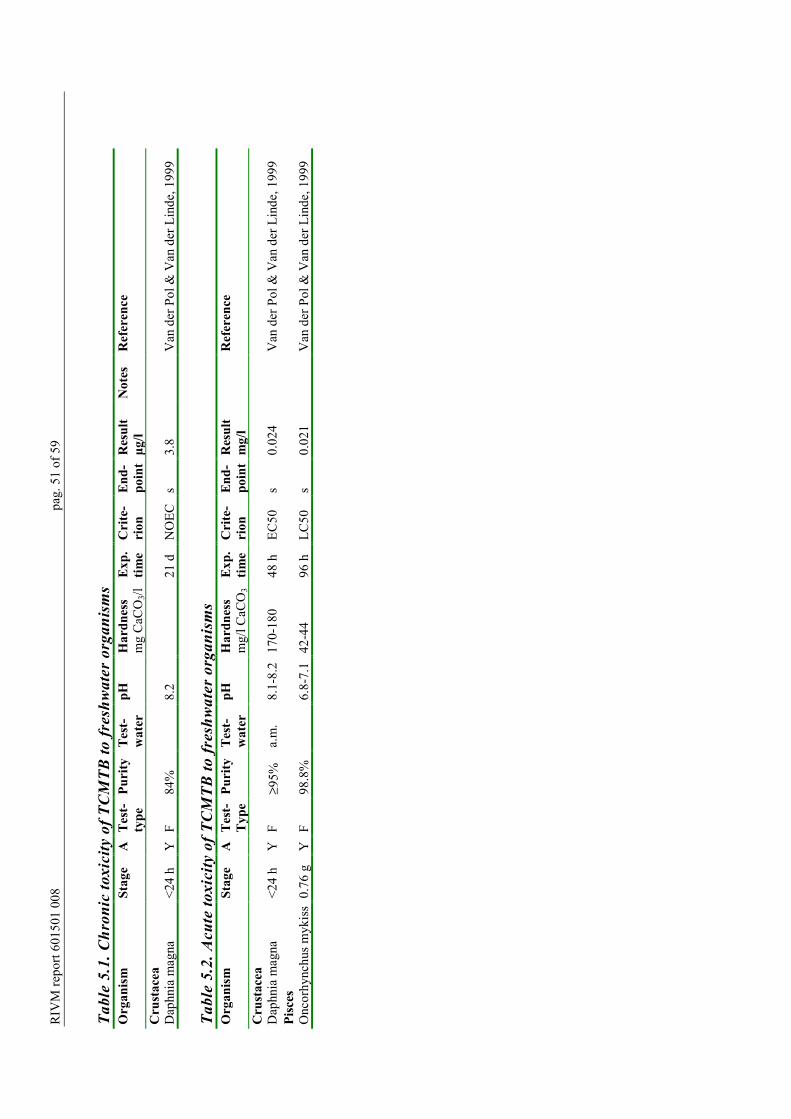
RIV
M re
port
6015
01 0
08
pag.
51
of 5
9
Tabl
e 5.
1. C
hron
ic to
xici
ty o
f TC
MTB
to fr
eshw
ater
org
anis
ms
Org
anis
mSt
age
ATe
st-
type
Puri
tyTe
st-
wat
erpH
Har
dnes
sm
g C
aCO
3/lEx
p.tim
eC
rite
-ri
onEn
d-po
int
Res
ult
µg/l
Not
esR
efer
ence
Cru
stac
eaD
aphn
ia m
agna
<24
hY
F84
%8.
221
dN
OEC
s3.
8V
an d
er P
ol &
Van
der
Lin
de, 1
999
Tabl
e 5.
2. A
cute
toxi
city
of T
CM
TB to
fres
hwat
er o
rgan
ism
sO
rgan
ism
Stag
eA
Test
-Ty
pePu
rity
Test
-w
ater
pHH
ardn
ess
mg/
l CaC
O3
Exp.
time
Cri
te-
rion
End-
poin
tR
esul
tm
g/l
Ref
eren
ce
Cru
stac
eaD
aphn
ia m
agna
<24
hY
F≥9
5%a.
m.
8.1-
8.2
170-
180
48 h
EC50
s0.
024
Van
der
Pol
& V
an d
er L
inde
, 199
9Pi
sces
Onc
orhy
nchu
s myk
iss
0.76
gY
F98
.8%
6.8-
7.1
42-4
496
hLC
50s
0.02
1V
an d
er P
ol &
Van
der
Lin
de, 1
999

pag. 52 of 59 RIVM report 601501008
Appendix 3. Information on the soil or sediment toxicityof the antifoulings
LegendL(E)C50aqua min lowest short term test result showing 50% effect or mortalityMPC maximum permissible concentrationMPCchronic MPC derived using assessment factors, based solely on chronic
test resultsMPCshort term MPC derived using assessment factors, based solely on short term
test resultsNOEC no observed effect concentrationNOECaqua min lowest no observed effect concentrationOrganism species used in the test, if available followed by age, size, weight
or life stageA Y = test substance analyzed in test solution
N = test substance not analyzed in test solution or no dataTest type S = static, R = static with renewal, F = flow throughTest water a.m. = artificial medium, a.s.w. = artificial seawater, n.f.s =
natural filtered seawater, r.t.w. = reconsituted tap water(+additional salts)
Test substance purity percentage active ingredientExposure time h = hours, d = days, w = weeks, m = months, min. = minutesResults > and ≥ values = highest concentration used in the test

RIV
M re
port
6015
01 0
08
pag.
53
of 5
9
Tabl
e 1.
1. C
hron
ic to
xici
ty o
f dic
hlof
luan
id to
soi
l org
anis
ms:
mic
robi
al p
roce
ssse
sO
rgan
ism
Soil
type
pHo.
m.
(%)
Cla
y(%
)Te
mp
(°C
)Ex
ptim
eC
rite
-ri
onR
esul
t tes
t soi
l(m
g/kg
d.w
)R
esul
t sta
nd.
soil
(mg/
kg d
.w)
End
poin
tR
efer
ence
Nitr
ifica
tion
sand
ylo
am5.
31.
420
56 d
EC9
1.3
9.3
inhi
bJa
nsm
a &
Lin
ders
, 199
2
Nitr
ifica
tion
sand
ylo
am5.
31.
420
56 d
EC21
1392
.9in
hib
Jans
ma
& L
inde
rs, 1
992
Nitr
ifica
tion
silt
loam
5.4
4.4
2056
dN
OEC
≥1.3
≥3.0
inhi
bJa
nsm
a &
Lin
ders
, 199
2N
itrifi
catio
nsi
lt lo
am5.
44.
420
56 d
EC13
1329
.5in
hib
Jans
ma
& L
inde
rs, 1
992
Tabl
e 1.
2. C
hron
ic to
xici
ty o
f dic
hlof
luan
id to
soi
l org
anis
ms
Org
anis
mSt
age
Soil
type
pHo.
m.
(%)
Cla
y(%
)Te
mp
(°C
)Ex
ptim
eC
rite
-ri
onR
esul
t tes
t soi
l(m
g/kg
d.w
)R
esul
t sta
nd.
soil
(mg/
kg d
.w)
End-
poin
tN
otes
Ref
eren
ce
Olig
ocha
eta
Eise
nia
fetid
aad
ult
Art.
soil
722
±128
dLC
50>1
000
-s
1Ja
nsm
a &
Lin
ders
, 199
2Ei
seni
a fe
tida
adul
tA
rt. so
il5.
820
±114
dLC
50>9
13-
s2
Jans
ma
& L
inde
rs, 1
992
Eise
nia
fetid
aad
ult
Art.
soil
5.8
20±1
14 d
NO
EC28
8-
s2
Jans
ma
& L
inde
rs, 1
992

pag.
54
of 5
9
R
IVM
repo
rt 60
1501
008
Tabl
e 2.
1. C
hron
ic to
xici
ty o
f zir
am to
soi
l org
anis
ms:
mic
robi
al p
roce
ssse
sO
rgan
ism
Soil
type
pHo.
m.
(%)
Cla
y(%
)Te
mp
(°C
)Ex
ptim
eC
rite
-ri
onR
esul
t tes
t soi
l(m
g/kg
d.w
)R
esul
t sta
nd.
soil
(mg/
kg d
.w)
End
poin
tN
otes
Ref
eren
ce
sulfu
r oxi
datio
nA
lluvi
al6.
30.
65-
28±2
50 d
EC10
1929
2in
hib
Ray
, 199
1
Tabl
e 2.
2. C
hron
ic to
xici
ty o
f zir
am to
soi
l org
anis
ms:
mic
robi
al p
roce
sses
; rej
ecte
d te
stPr
oces
sSo
il ty
pePH
o.m
.(%
)C
lay
(%)
Tem
p(°
C)
Exp
time
Cri
te-
rion
Res
ult t
est s
oil
(mg/
kg d
.w).
Res
ult s
tand
.so
il (m
g/kg
d.w
).Ty
pe o
fef
fect
Not
eR
efer
ence
Nitr
ifica
tion
sand
y lo
am15
0 d
EC50
<620
inhi
b1
Jacq
ues,
1959
Nitr
ifica
tion
sand
y lo
am15
0 d
NO
EC<6
2in
hib
1Ja
cque
s, 19
591 tw
o co
ncen
tratio
ns te
sted
, at 6
2 m
g/kg
a sl
ight
lag
in n
itrifi
catio
n w
as o
bser
ved,
at 6
20 m
g/kg
NO
3-N w
as n
ot d
etec
ted
until
day
150
. Tes
t rej
ecte
d as
onl
y tw
oco
ncen
tratio
ns a
re te
sted
.
Tabl
e 2.
3. A
cute
toxi
city
of z
iram
to s
edim
ent o
rgan
ism
s; r
ejec
ted
test
Org
anis
mA
geA
Test
-Ty
pePu
rity
Test
-W
ater
pHH
ard-
ness
Exp.
time
Cri
te-
rion
Res
ult
mg/
lE
ndpo
int
Ref
eren
ce
Am
phib
iaB
ufo
bufo
30 d
48 h
LC50
0.36
sN
isch
iuch
i, 19
74To
o lit
tle in
form
atio
n on
type
of t
est

RIV
M re
port
6015
01 0
08
pag.
55
of 5
9
Tabl
e 3.
1. A
cute
toxi
city
of c
hlor
otha
loni
l to
soil:
mic
robi
al p
roce
sses
and
enz
yme
activ
ityPr
oces
sSo
ilTy
pepH
o.m
.(%
)C
lay
(%)
T (°C
)Ex
p.tim
eC
rite
-ri
onR
esul
tte
st so
il(m
g/kg
dw
)
NO
ECst
anda
rdso
il(m
g/kg
dw
)
End
poin
tN
otes
Ref
eren
ce
Mic
robi
al p
roce
sses
Nitr
ifica
tion
--6.
45.
339
246
hEC
2550
32In
hib
1H
anss
on e
t al.,
199
1Lo
amy
sand
7.0
1.3
-22
3 d
EC22
1.6
2.7
Max
. inh
ibiti
on2
Mon
tforts
, 199
9Lo
amy
sand
7.0
1.3
-22
3 d
EC88
20M
ax. i
nhib
ition
2M
ontfo
rts, 1
999
Silty
loam
6.8
3.6
-22
3 d
EC30
1.8
1.7
Max
. inh
ibiti
on2
Mon
tforts
, 199
9Si
lty lo
am6.
83.
6-
223
dEC
3119
17.5
Max
. inh
ibiti
on2
Mon
tforts
, 199
9R
espi
ratio
nSa
ndy
loam
7.6
1.5
105
18 h
EC47
100
165
2R
ashi
d &
May
audo
n, 1
974
aer.
Nitr
ogen
fixa
tion
Loam
y sa
nd7.
01.
3-
226
hEC
431.
62.
7M
ax. i
nhib
ition
2M
ontfo
rts, 1
999
Loam
y sa
nd7.
01.
3-
226
hEC
100
20M
ax in
hibi
tion
2M
ontfo
rts, 1
999
Silty
loam
6.8
3.6
-22
6 h
EC55
1.8
0.5
Max
. inh
ibiti
on2
Mon
tforts
, 199
9Si
lty lo
am6.
83.
6-
226
hEC
200
+19
Stim
ulat
ion
2M
ontfo
rts, 1
999
aner
. Nitr
ogen
fixa
tion
Loam
y sa
nd7.
01.
3-
226
hEC
90 +
1.6
Stim
ulst
ion
2M
ontfo
rts, 1
999
Loam
y sa
nd7.
01.
3-
226
hEC
9920
Max
inhi
bitio
n2
Mon
tforts
, 199
9Si
lty lo
am6.
83.
6-
226
hN
OEC
1.8
52
Mon
tforts
, 199
9Si
lty lo
am6.
83.
6-
226
hEC
400
+19
Stim
ulat
ion
2M
ontfo
rts, 1
999
Enzy
me
activ
ityA
myl
ase
Sand
y lo
am5.
51.
8-
281
dEC
3010
172
Tu, 1
993
Deh
ydro
gena
seSa
ndy
loam
5.5
1.8
-28
4 d
NO
EC>1
0>
502
Tu, 1
993
Inve
rtase
Sand
y lo
am5.
51.
8-
281
dEC
2510
172
Tu, 1
993
Phos
phat
ase
Sand
y lo
am5.
51.
8-
282
hN
OEC
> 10
> 50
2Tu
, 199
3U
reas
eSa
ndy
loam
5.5
1.8
-28
2 d
NO
EC>
10>
502
Tu, 1
993
1: a
dded
as a
form
ulat
ion,
two
conc
entra
tions
test
ed (t
riplic
ate)
, 25
mg/
kg w
as n
ot si
gnifi
cant
ly d
iffer
ent f
rom
the
cont
rol.
2: o
nly
one
conc
entra
tion
is te
sted
.3:
9%
stim
ulat
ion
was
seen
afte
r 2 h
(con
side
red
to b
e eq
ual t
o th
e N
OEC
).

pag.
56
of 5
9
R
IVM
repo
rt 60
1501
008
Tabl
e 3.
2. C
hron
ic to
xici
ty o
f chl
orot
halo
nil t
o so
il: m
icro
bial
pro
cess
es a
nd e
nzym
e ac
tivity
Proc
ess
Soil
Type
pHo.
m.
(%)
Cla
y(%
)T (°
C)
Exp.
time
Cri
te-
rion
Res
ult
test
soil
(mg/
kg d
w)
NO
ECSt
and.
soil
(mg/
kg d
w)
End
poin
tN
otes
Ref
eren
ce
Mic
robi
al p
roce
sses
Nitr
ifica
tion
Sand
y lo
am7.
61.
8-
281
wN
OEC
> 10
> 50
1Tu
, 199
3Sa
ndy
loam
7.6
1.8
-28
2 w
EC44
1017
1Tu
, 199
3Sa
ndy
loam
6.6
2.9
-20
28 d
NO
EC4.
415
Max
. inh
ibiti
on1
Mon
tforts
, 199
9su
lfur o
xida
tion
Sand
y lo
am7.
61.
8-
284
wEC
2610
171
Tu, 1
993
Sand
y lo
am7.
61.
8-
288
wN
OEC
>10
> 50
1Tu
, 199
3R
espi
ratio
nSa
ndy
loam
6.6
2.9
-20
28 d
NO
EC4.
415
CO
2 ev
olut
ion
1, 2
Mon
tforts
, 199
91:
onl
y on
e co
ncen
tratio
n is
test
ed.
2: 9
% st
imul
atio
n w
as se
en a
fter 2
h (c
onsi
dere
d to
be
equa
l to
the
NO
EC).
Tabl
e 3.
3. C
hron
ic to
xici
ty o
f chl
orot
halo
nil t
o so
il sp
ecie
sPr
oces
sSo
ilTy
pepH
o.m
.(%
)C
lay
(%)
T (°C
)Ex
p.tim
eC
rite
-ri
onR
esul
tte
st so
il(m
g/kg
dw
)
Res
ult
stan
d. so
il(m
g/kg
dw
)
End-
poin
tR
efer
ence
Fung
iPo
pula
tion
grow
thsa
ndy
loam
7.6
1.8
-28
7 d
EC52
105
gTu
, 199
3B
acte
riop
hyta
Popu
latio
n gr
owth
sand
y lo
am7.
61.
8-
287
dEC
2910
17g
Tu, 1
993
Ann
elid
aEi
seni
a fo
etid
a5.
910
-25
14 d
LC50
537
537
sM
ontfo
rts, 1
999
Tabl
e 3.
4. T
oxic
ity o
f chl
orot
halo
nil t
o so
il: r
ejec
ted
test
sPr
oces
sSo
ilTy
pepH
o.m
.(%
)C
lay
(%)
T (°C
)Ex
p.Ti
me
Cri
te-
rion
Res
ult
test
soil
(mg/
kg d
w)
NO
ECSt
and.
soil
(mg/
kg d
w)
End
poin
tN
otes
Ref
eren
ce
Fung
ice
llulo
se d
ecom
post
ion
clay
loam
7.1
----
13/2
55
wk
----
--in
hib
1Su
yam
a et
al.,
199
3Sp
orid
esm
ium
scle
rotiv
orum
Loam
ysa
nd--
----
21-2
48
wk
EC10
010
--in
hib
2A
dam
s and
Won
g, 1
991
1: fo
mul
atio
n te
sted
, eff
ects
are
not
qua
ntifi
ed.
2: c
ompl
ete
inhi
bitio
n at
10
mg/
kg w
as n
amed
‘tox
icity
’.

RIV
M re
port
6015
01 0
08
pag.
57
of 5
9
Tabl
e 4.
1. C
hron
ic to
xici
ty o
f TC
MTB
to s
oil o
rgan
ism
s: m
icro
bial
pro
cess
es; r
ejec
ted
test
sPr
oces
sSo
il ty
pePH
o.m
.(%
)C
lay
(%)
Tem
p(°
C)
Exp
time
Cri
te-
rion
Res
ult t
est s
oil
(mg/
kg d
.w).
Res
ult s
tand
.so
il (m
g/kg
d.w
).
Type
of e
ffec
tN
ote
Ref
eren
ce
Bio
mas
s6.
71.
71--
--6
m--
--C
ompo
sitio
n1
Van
der
Pol
and
Van
der
Lin
de, 1
999
Am
mon
ifica
tion
6.7
1.71
----
6 m
----
Inhi
b1
Van
der
Pol
and
Van
der
Lin
de, 1
999
Enzy
mes
6.7
1.71
----
6 m
----
Inhi
b1
Van
der
Pol
and
Van
der
Lin
de, 1
999
1: te
chni
cal T
CM
TB (7
9% p
ure)
show
s eff
ects
on
com
post
ion,
am
mon
ifica
tion
and
enzy
me
activ
ity a
t the
low
est t
est c
once
ntra
tion
(50
mg/
kg so
il) b
ut d
ata
are
pres
ente
dgr
aphi
cally
. Qua
ntita
tive
resu
lts c
an n
ot b
e be
der
ived
from
thes
e da
ta.
page 58 of 59 RIVM report 601501 008
References to appendix 2 and 3Adams PB, Wong JA-L. (1991) The effect of chemical pesticides on the infection of Sclerotia of Sclerotia minor
by the biocontrol agent Sporidesmium sclerotivorum. Phytopathol. 81:1340-1343.
Anonymus (1979) Fischtoxizität. Dichlofluanid. Kü 13 032 c, Regenbogenforelle. Bayer AG PflanzenschutzAnwendungstechnik, Inistitute of Environmental Biology. Report no. FF-74. 4 pp. Provided by BayerAG.
Anonymus (1980) Fischtoxizität. Dichlofluanid. Kü 13 032 c, Goldorfe. Bayer AG PflanzenschutzAnwendungstechnik, Inistitute of Environmental Biology. Report no. FO-288. 3 pp. Provided by BayerAG.
Caspers (1997a) Dimethylaminosulfanilid (DMSA). Alga, growth inhibition test. Bayer AG, WD-UWS. Instituteof environmental analysis. Study no. 689 A/97 Al. 44 pp. Provided by Bayer AG.
Caspers (1997b) Dimethylaminosulfanilid (DMSA). Acute Daphnia toxicity. Bayer AG, WD-UWS. Institute ofenvironmental analysis. Study no. 689 A/97 Al. 14 pp. Provided by Bayer AG.
Dahl B, Blanck H. (1996) Toxic effects of the antifouling agent Irgarol 1051 on periphyton communitites incoastal water microcosms. Mar Pollut Bull 32:342-350.
Davies PE, Cook LSJ, Goenarso, D. (1994) Sublethal responses to pesticides of several species of Australianfreshwater fish and crustaceans and rainbow trout. Environ Toxicol Chem 13:1341-1354.
Davies PE, White, RWG. (1985) The toxicology and metabolism of chlorothalonil in fish. I. Lethal levels forSalmo gairdneri, Galaxias maculatus, G. truttaceus, and G. auratus and the fate of 14C-TCIN in S.gairdneri. Aquat Toxicol 7:93-105.
Ernst W; Doe K; Young J, Julien G; Hennigar P. (1991) The toxicity of chlorothalonil to aquatic fauna and theimpact of its operational use on a pond ecosystem. Arch Environ Contam Toxicol 21:1-9.
European Commision. Concept. Monograph prepared in the context of the inclusion of the following activesubstance in Annex I of the Council Directive 91/414/EEC. ZIRAM.
Frazier S, Schoen LT, Franklin BB. (1986) Acute flow-through toxicity of Preventol A4-S to Daphnia magna.Analytical Biochemistry Laboratories Inc. Report no. 34804. 136 pp.Report provided by Bayer AG.
Gallagher EP, Cattley RC, Di Giulio RT. (1992) The acute toxicity and sublethal effects of chlorothalonil inchannel catfish (Ictalurus punctatus) Chemosphere 24:3-10.
Grau, R. (1989) Toxizität von dichlofluanid techn. (VM 90) für Regenbogenforellen (Salmo gairdneri) beiverlängerter exposition (21 Tage). Bayer AG Pflanzenschutz Anwendungstechnik, Institute ofEnvironmental Biology. Report no. FF-246. 15 pp. Provided by Bayer AG.
Grau, R. (1990) Toxizität von DMSA für Regenbogenforellen (Salmo gairdneri) bei verlängerter exposition (21Tage). Bayer AG Pflanzenschutz Anwendungstechnik, Institute of Environmental Biology. Report no.FF-290. 14 pp. Provided by Bayer AG.
Grau, R. (1991) Dichlofluanid. Bioconcentration in fish. Bayer AG, Crop protection-research, Environmentalresearch. Institute of Environmental Biology. Report no. BF-006. 47 pp. Provided by Bayer AG.
Hansson G-B, Klemedtsson L, Stemström J, Torstensson L. (1991). Testing the influence of chemicals on soilautotrophic ammonium oxidation. Environ Toxicol Water Qual 6: 351-360.
Heimbach, F. (1983). Acute toxicity of DICHLOFLUANID (90% premix) to water fleas. Bayer AGPflanzenschutz Anwendungstechnik, Inistitute of Environmental Biology. Report no. Hb/Dm 21. 7 pp.Provided by Bayer AG.
Heimbach, F. (1985). Growth inhibition of green algae (Scenedesmus subspicatus) by dichlofluanid (90%premix). Bayer AG Pflanzenschutz Anwendungstechnik, Inistitute of Environmental Biology. Report no.HBF/A113. 12 pp. Provided by Bayer AG.
Hoestlandt H. (1972) Lutte contre l’invasion de la moule d’eau douce, Dreissena polymoprha Pallas, parinsecticides et molluscicides. Verh Internat Verein Limnol 18:961-967.
Jacques RP. (1959) Effects of thiourea, ethylurethane and some dithiocarbamate fungicides on nitrification infox sandy loam. Can J Soil Sci 39:235-243.

RIVM report 601501 008 page 59 of 59
Jansma JW, Linders J. (1992) Dichlofluanide (Definitieve versie; M-102). Advisoryreport. RIVM/CSR. Reportnr. 88/678801/090.
Jongbloed, R.; Luttik, R. (1996) 2-methylthio-4-tertbutylamino-cylcopropylamino-s-triazine (Irgarol 1051).Advisery report nr. 4351, RIVM/CSR
Mayer FL ed.(1987) Acute toxicity handbook of chemicals to estuarine organisms, Gulf Breeze, Florida.Washington. DC. US Environmental Protection Agency (EPA-600/8-017; NTIS PB 87-188686).
Montforts MHMM. et al. (1999) Chlorothalonil CSR report 06105A00.
Nischiuchi Y. (1974) Testing methods for the toxicity of agricultural chemicals to aquatic organisms. Jap PestInf 19: 15-19.
Rashid M. Mayaudon J. (1974) Effect of carbamates and anilines on Pseudomonas putida and soil microbialactivity. Ann Microbiol 125:193-200.
Ray RC. (1991) Inhibition of sulphur oxidation in soil by some fungicides. J Environ Biol 12(3):279-286.
Scarlett A, Donkin ME, Fileman TW, Donkin P. (1997) Occurence of the marine antifouling agent Irgarol 1051within the Plymouth Sound locality; implications for the green macroalga Enteroporpha intestinalis . MarPollut Bull 34:645-651.
Swigert J, Bunch B, Schuster L. (1986a) Acute flow-through toxicity of Preventol A4-S to Bluegill sunfish(Lepomis macrochirus). Analytical Biochemistry Laboratories Inc. Report no. 34802. 161 pp. Reportprovided by Bayer AG.
Swigert J, Bunch B, Schuster L. (1986b) Acute flow-through toxicity of Preventol A4-S to Rainbow trout (Salmogairdneri). Analytical Biochemistry Laboratories Inc. Report no. 34803. 119 pp. Report provided byBayer AG.
Strufe R. (1968) Molluscicides and residues. Residue Rev 99-103.
Suyama KH, Yamamoto J, Kurokawa, Komada H. (1993) Effect of a fungicide, chlorothalonil, on cellulosedecomposing process in soil. J Pesticide Sci 18:285-292.
Tibosch H, Luttik R, Linders J. (1993) Ziram. Adviesrapport. RIVM/CSR. Report nr. 93/679101/100. 1e
aanvulling.
Tu CM (1993) effects of fungicides, captafol and chlorothalonil, on microbial and anzymatic activitities inmineral soil. J Environ. Sci Health B28, (1), 67-80.
Van der Pol JJC; Van der Linde A. (1999) TCMTB. Advisory report no. 06456a00, RIVM/CSR (In Dutch).
Van Leeuwen CJ, Maas-Diepeveen JL, Niebeek G, Vergouw WHA, Griffioen PS, Luyken MW. (1985a) Aquatictoxicological aspects of dithiocarbamates and related compounds. Short-term toxicity tests. Aquat Toxicol7: 145-164.
Van Leeuwen CJ, Mobers F, Niebeek G. (1985b) Aquatic toxicological aspects of dithiocarbamates and relatedcompounds. Effects on survival, reproduction and growth of Daphnia magna. Aquat Toxicol 7: 165-175.
Van Leeuwen CJ, Espeldoorn A, Mol F. (1985c) Aquatic toxicological aspects of dithiocarbamates and relatedcompounds. Embryolarval studies with rainbow trout (Salmo gairdneri). Aquat Toxicol 7: 121-135.