maximizing your state of the line experience€™s annual state of the line presentation provides...
TRANSCRIPT

Maximizing Your State of the Line Experience

2016 STATE OF THE LINE GUIDE
2016 STATE OF THE LINE GUIDE—INTRODUCTION NCCI’s annual State of the Line presentation provides an exclusive review of trends, cost drivers, and significant developments shaping the workers compensation industry. This Guide provides a slide-by-slide examination of the key takeaways, data sources, and formulas underlying the State of the Line presentation.
As you review the information contained in this Guide, it may be useful to keep in mind the following market indicators and trends that were highlighted in NCCI’s 2016 State of the Line presentation: • The workers compensation 2015 calendar year combined ratio for private carriers was 94%—a 6-point
decline when compared with the 2014 combined ratio.
• Total market net written premium increased by almost 3% to $45.5 billion for workers compensation, driven primarily by an increase in payroll.
• The overall reserve position for private carriers further improved in 2015. NCCI estimates the year-end 2015 reserve position to be a $7 billion deficiency—down from $10 billion in 2014. Estimated reserve redundancy in accident year 2015 accounts for much of the reduction.
• In 2015, lost-time claim frequency declined by 3%, on average, in NCCI states.
• In NCCI states, the 2015 accident year average indemnity cost per lost-time claim increased by 1% relative to the corresponding 2014 value. For medical, the average cost per lost-time claim decreased by 1% relative to that observed in 2014.
• The workers compensation Residual Market Pool premium volume remained flat between 2014 and 2015, and the average residual market share remained steady at 8%.
We hope you find the 2016 State of the Line Guide both a beneficial and informative resource.
Page 1 of 62
© Copyright 2016 NCCI Holdings, Inc. All Rights Reserved.
2016 STATE OF THE LINE GUIDE
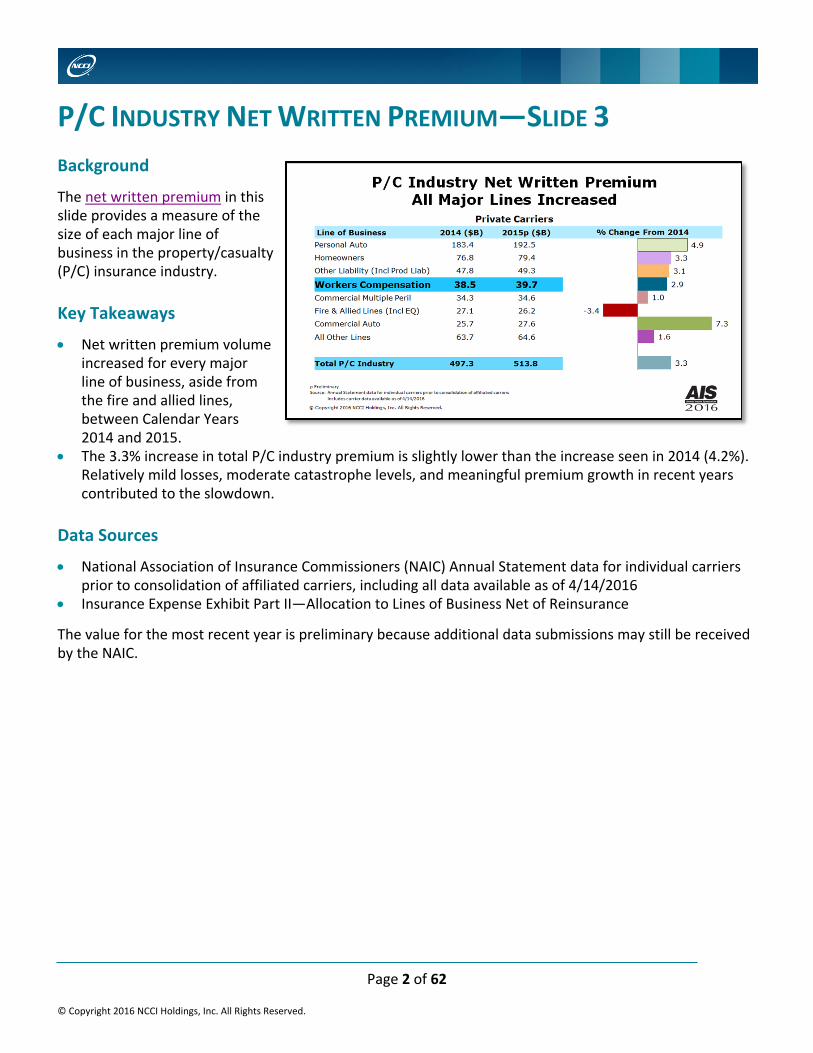
P/C INDUSTRY NET WRITTEN PREMIUM—SLIDE 3 Background
The net written premium in this slide provides a measure of the size of each major line of business in the property/casualty (P/C) insurance industry.
Key Takeaways
• Net written premium volume increased for every major line of business, aside from the fire and allied lines, between Calendar Years 2014 and 2015.
• The 3.3% increase in total P/C industry premium is slightly lower than the increase seen in 2014 (4.2%). Relatively mild losses, moderate catastrophe levels, and meaningful premium growth in recent years contributed to the slowdown.
Data Sources
• National Association of Insurance Commissioners (NAIC) Annual Statement data for individual carriers prior to consolidation of affiliated carriers, including all data available as of 4/14/2016
• Insurance Expense Exhibit Part II—Allocation to Lines of Business Net of Reinsurance
The value for the most recent year is preliminary because additional data submissions may still be received by the NAIC.
Page 2 of 62
© Copyright 2016 NCCI Holdings, Inc. All Rights Reserved.

2016 STATE OF THE LINE GUIDE
P/C INDUSTRY NET COMBINED RATIOS—SLIDE 4 Background
The calendar year combined ratios in this slide measure the overall performance of each line of business and the P/C industry as a whole, prior to the consideration of investment and other income. A combined ratio is the sum of the loss ratio, the loss adjustment expense (LAE) ratio, the dividend ratio, and the underwriting expense ratio. The loss, LAE, and dividend ratios are calculated as ratios to earned premium. The underwriting expense ratio is calculated as a ratio to written premium to provide a better match of the timing of the numerator and denominator.
Key Takeaways
• The total P/C industry’s 2015 combined ratio (98%) represents a 1-point increase versus that for 2014 • Combined ratio increases in personal and commercial auto, along with other liability, were the major
drivers of the overall increase • The lines of business with the largest combined ratio improvements between 2014 and 2015 were
workers compensation and commercial multiple peril
Data Sources
• NAIC Annual Statement data for individual carriers prior to consolidation of affiliated carriers, including all data available as of 4/14/2016
• Insurance Expense Exhibit Part II—Allocation to Lines of Business Net of Reinsurance
The value for the most recent year is preliminary because additional data submissions may still be received by the NAIC.
Page 3 of 62
© Copyright 2016 NCCI Holdings, Inc. All Rights Reserved.

2016 STATE OF THE LINE GUIDE
P/C INDUSTRY NET COMBINED RATIOS—SLIDE 5 Background
This slide displays a longer history of the combined ratios for the total P/C industry. See Slide 4 for more background.
Key Takeaways
• The most recent underwriting cycle was comparatively milder and shorter than those in the past. The prior two cycles each lasted nine years, while the most recent cycle was only seven years in duration.
• The average combined ratio has declined across the most recent three underwriting cycles. • Several factors contributed to this pattern of decline, including the slow economic recovery following
the Great Recession, excess capacity in the reinsurance market, and a lack of significant catastrophe events.
Data Sources
• NAIC Annual Statement data for individual carriers prior to consolidation of affiliated carriers, including all data available as of 4/14/2016
• Insurance Expense Exhibit Part II—Allocation to Lines of Business Net of Reinsurance
The value for the most recent year is preliminary because additional data submissions may still be received by the NAIC.
Data
1986 1987 1988 1989 1990 1991 1992 1993 1994 1995 1996 1997 1998 1999 2000
108 105 105 109 110 109 116 107 109 107 106 102 106 108 110
2001 2002 2003 2004 2005 2006 2007 2008 2009 2010 2011 2012 2013 2014 2015p
116 107 100 98 101 92 95 104 101 102 108 103 96 97 98
Page 4 of 62
© Copyright 2016 NCCI Holdings, Inc. All Rights Reserved.

2016 STATE OF THE LINE GUIDE
P/C INDUSTRY INVESTMENT GAIN RATIOS—SLIDE 6 Background
The investment gain ratio includes both realized capital gains and net investment income.
The investment gain ratio measures the investment performance of the P/C industry by comparing investment income to earned premium, the primary source of investment funds for insurance carriers.
Key Takeaways
• Both net investment income and net realized capital gain ratios have decreased in 2015 • Similar to the combined ratios, the average investment gain ratio has declined over the most recent
three underwriting cycles
Data Sources
• NAIC Annual Statement data, Statement of Income: 1986–2007 and 2013–2015p • ISO: 2008–2012
The value for the most recent year is preliminary because additional data submissions may still be received by the NAIC.
Page 5 of 62
© Copyright 2016 NCCI Holdings, Inc. All Rights Reserved.

2016 STATE OF THE LINE GUIDE
SLIDE 6 (CONT’D) Data
Year
Net Realized Capital Gains to Net Earned Premium
Net Investment Income to Net Earned Premium
Investment Gain Ratio
1986 1987 1988 1989 1990 1991 1992 1993 1994 1995 1996 1997 1998 1999 2000
4.1 1.8 1.4 2.2 1.3 2.2 4.4 4.2 0.7 2.4 3.5 4.0 6.5 4.6 5.5
13.2 12.7 13.9 15.1 15.2 15.4 14.9 13.8 13.8 14.5 14.4 15.3 14.4 13.7 13.8
17.3 14.5 15.3 17.3 16.5 17.6 19.3 18.0 14.5 16.9 17.9 19.3 20.9 18.3 19.3
2001 2002 2003 2004 2005 2006 2007 2008 2009 2010 2011 2012 2013 2014 2015p
2.1 0.8 1.5 2.2 2.9 0.8 2.0 –4.6 –1.9 1.4 1.6 1.4 2.3 2.3 2
12.1 11.2 10.2 9.6 11.9 12.0 12.5 11.7 11.1 11.3 11.3 10.7 10.1 9.4 9
14.2 12.0 11.7 11.8 14.8 12.8 14.5 7.1 9.3 12.7 12.9 12.1 12.5 11.7 11
Page 6 of 62
© Copyright 2016 NCCI Holdings, Inc. All Rights Reserved.

2016 STATE OF THE LINE GUIDE
P/C INDUSTRY EMBEDDED YIELD AND NEW MONEY YIELD—SLIDE 7 Background
Embedded Yield is the reported pretax investment income, excluding capital gains, for bond instruments held by P/C insurers divided by the asset value of those instruments. Embedded Yield is derived from accounting data as reported. It includes investment income both from (old) bonds owned at the beginning of each year and (new) bonds acquired during the year.
New Money Yield is the pretax yield for a bond portfolio containing similar securities and maturities, but whose yields reflect current bond prices.
The gray bars in the graph indicate periods of recession in the United States.
Key Takeaways
• Both Embedded and New Money Yields have generally declined over the last 30 years • The New Money Yield has improved slightly in the most recent few years but still remains below the
Embedded Yield
Data Sources
• Embedded Yield is based on data from A.M. Best’s Aggregates & Averages • New Money Yield is based on data from A.M. Best’s Aggregates & Averages, the Federal Reserve Bank,
Value Line, TreasuryDirect, Barron’s, and Bloomberg
Page 7 of 62
© Copyright 2016 NCCI Holdings, Inc. All Rights Reserved.

2016 STATE OF THE LINE GUIDE
SLIDE 7 (CONT’D) Data
Pretax Embedded Yield
1985 1986 1987 1988 1989 1990 1991 1992 1993 1994 1995 1996 1997 1998 1999
9.2 8.8 8.4 8.3 8.3 8.4 8.3 7.9 7.1 6.8 6.8 6.7 6.6 6.5 6.3
2000 2001 2002 2003 2004 2005 2006 2007 2008 2009 2010 2011 2012 2013 2014
6.4 6.3 6.0 5.1 4.8 4.8 4.8 4.9 4.9 4.8 4.5 4.3 4.0 3.7 3.5
Pretax New Money Yield
1985 1986 1987 1988 1989 1990 1991 1992 1993 1994 1995 1996 1997 1998 1999
9.6 7.2 7.8 8.2 8.0 8.0 6.9 5.9 5.0 6.3 6.1 5.8 5.8 5.0 5.3
2000 2001 2002 2003 2004 2005 2006 2007 2008 2009 2010 2011 2012 2013 2014
5.8 4.4 3.8 3.1 3.3 3.8 4.5 4.3 3.3 2.4 2.2 1.9 1.4 1.6 1.7
2015p
1.7
Page 8 of 62
© Copyright 2016 NCCI Holdings, Inc. All Rights Reserved.

Page 9 of 62
© Copyright 2016 NCCI Holdings, Inc. All Rights Reserved.
2016 STATE OF THE LINE GUIDE
P/C INDUSTRY AFTER‐TAX RETURN ON SURPLUS—SLIDE 8
Background
The after‐tax return on surplus compares net income generated from all sources to policyholder surplus. Since surplus varies throughout the year as income is earned, the return is calculated as the ratio of net income to the average of the surplus at the beginning of the year and end of the year. The return on surplus tends to follow the ebb and flow of the underwriting cycle.
Key Takeaways
The 2015 after‐tax return on surplus of 8% is very close to the 8.5% in 2014 and is also consistent with the long‐term average shown
The industry has posted a positive return in every year except 2001, which was partly a result of 9/11 Under the assumption that the average return on surplus is sufficient to cover the industry’s cost of
capital, the industry was successful in meeting that target in 2015
Data Sources
NAIC Annual Statement data, Statement of Income: 1985–2007 and 2013–2015p ISO: 2008–2012
The value for the most recent year is preliminary because additional data submissions may still be received by the NAIC.
Data
1985 1986 1987 1988 1989 1990 1991 1992 1993 1994 1995 1996 1997 1998 1999
2.8 15.1 13.9 13.4 9.7 8.0 9.5 3.6 11.2 5.8 9.7 10.1 13.1 9.6 6.6
2000 2001 2002 2003 2004 2005 2006 2007 2008 2009 2010 2011 2012 2013 2014
6.3 –2.3 3.2 9.5 10.6 11.4 14.4 12.7 0.6 5.9 6.6 3.5 6.1 10.2 8.5
2015p
8

2016 STATE OF THE LINE GUIDE
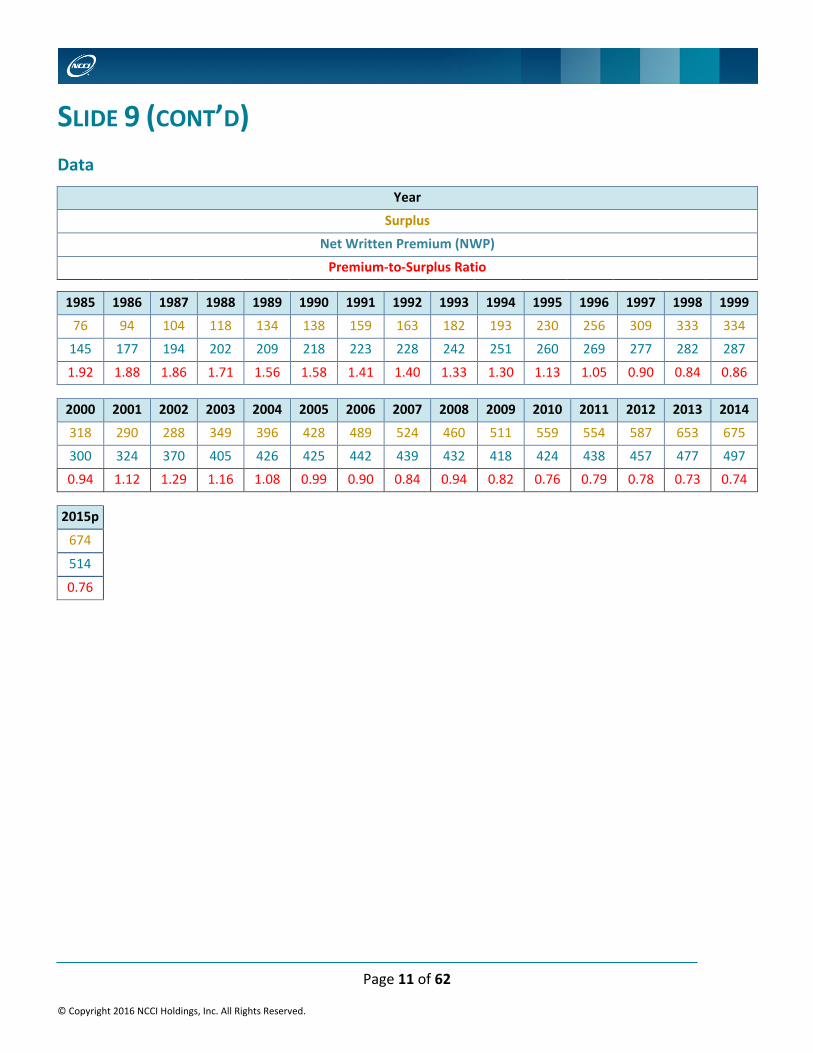
P/C INDUSTRY PREMIUM-TO-SURPLUS RATIOS—SLIDE 9 Background
The premium-to-surplus ratio is one measure that can be used to help determine whether there is sufficient policyholder surplus to support the P/C insurance industry’s writings.
Key Takeaways
• The premium-to-surplus ratio increased slightly from 0.74:1 in 2014 to 0.76:1 in 2015
• Despite an increase in net written premium, surplus fell by about $1.5 billion in 2015 from a record high the prior year
Data Sources
• NAIC Annual Statement data, Statement of Income: 1985–2007 and 2013-2015p • ISO: 2008–2012
The value for the most recent year is preliminary because additional data submissions may still be received by the NAIC.
Page 10 of 62
© Copyright 2016 NCCI Holdings, Inc. All Rights Reserved.
2016 STATE OF THE LINE GUIDE
SLIDE 9 (CONT’D) Data
Year
Surplus
Net Written Premium (NWP)
Premium-to-Surplus Ratio
1985 1986 1987 1988 1989 1990 1991 1992 1993 1994 1995 1996 1997 1998 1999
76 94 104 118 134 138 159 163 182 193 230 256 309 333 334
145 177 194 202 209 218 223 228 242 251 260 269 277 282 287
1.92 1.88 1.86 1.71 1.56 1.58 1.41 1.40 1.33 1.30 1.13 1.05 0.90 0.84 0.86
2000 2001 2002 2003 2004 2005 2006 2007 2008 2009 2010 2011 2012 2013 2014
318 290 288 349 396 428 489 524 460 511 559 554 587 653 675
300 324 370 405 426 425 442 439 432 418 424 438 457 477 497
0.94 1.12 1.29 1.16 1.08 0.99 0.90 0.84 0.94 0.82 0.76 0.79 0.78 0.73 0.74
2015p
674
514
0.76
Page 11 of 62
© Copyright 2016 NCCI Holdings, Inc. All Rights Reserved.

2016 STATE OF THE LINE GUIDE
WC NET WRITTEN PREMIUM GROWTH—SLIDE 11 Background
This slide exhibits workers compensation (WC) net written premium by year, separately for private carriers and state funds.
In the context of the State of the Line presentation, NCCI’s definition of state funds includes only those carriers that are exempt from paying federal income taxes. All other carriers are included in the private carrier values.
Key Takeaways
• The net written premium for private carriers increased 2.9% to $39.7 billion in 2015. The increase is lower than that estimated by NCCI based on mid-2015 data—primarily due to a large reinsurance transaction that ceded almost three-quarters of a billion dollars offshore.
• After including state funds in the premium figures, total net written premium increased 2.9% between 2014 and 2015.
• The 2015 total market net written premium volume is approaching the prerecession peak of $47.8 billion in 2005.
Data Sources
• NAIC Annual Statement data, including all data available as of 4/14/2016 • Insurance Expense Exhibit Part II—Allocation to Lines of Business Net of Reinsurance
The value for the most recent year is preliminary because additional data submissions may still be received by the NAIC.
Page 12 of 62
© Copyright 2016 NCCI Holdings, Inc. All Rights Reserved.

2016 STATE OF THE LINE GUIDE
SLIDE 11 (CONT’D) Data
Year 1990 1991 1992 1993 1994 1995 1996 1997 1998 1999
State Funds 4.3 4.4 4.5 4.9 4.5 3.8 3.3 2.8 2.6 2.7
Private Carriers 31.0 31.3 29.8 30.5 29.1 26.3 25.2 24.2 23.3 22.3
Total 35.3 35.7 34.3 35.4 33.6 30.1 28.5 27.0 25.9 25.0
2000 2001 2002 2003 2004 2005 2006 2007 2008 2009 2010 2011 2012
3.7 6.0 8.4 11.2 11.8 10.1 7.8 6.7 5.5 4.3 3.9 4.1 4.4
25.0 26.1 29.2 31.1 34.7 37.8 38.6 37.6 33.8 30.3 29.9 32.3 35.1
28.6 32.1 37.7 42.3 46.5 47.8 46.5 44.3 39.3 34.6 33.8 36.4 39.5
2013 2014 2015p
4.9 5.7 5.8
36.9 38.5 39.7
41.8 44.2 45.5
Page 13 of 62
© Copyright 2016 NCCI Holdings, Inc. All Rights Reserved.

Page 14 of 62
© Copyright 2016 NCCI Holdings, Inc. All Rights Reserved.
2016 STATE OF THE LINE GUIDE
WC DIRECT WRITTEN PREMIUM 2015 GROWTH—SLIDE 12
Background
Underlying the change in countrywide direct written premium volume is the change in each state’s direct written premium. These percentage changes are based on private carrier data only and exclude monopolistic fund states. Green represents premium volume increases, while orange represents premium volume decreases. The deeper colors represent larger magnitudes of change.
Key Takeaways
Between 2014 and 2015, countrywide private carrier direct written premium grew 4.3%. Direct written premium volume decreased in nine states in 2015, with Oklahoma showing the largest
decline. The observed decline in Oklahoma is primarily due to the state’s major reform in 2013 that led to rate reductions.
Premium growth varies significantly across individual jurisdictions, but most states’ direct written premium growth remained close to the countrywide average.
Data Source
Statutory Page 14 from the NAIC Annual Statement for calendar year written premium by state
Data
AK AL AR AZ CA CO CT DC DE FL GA HI IA
–0.6 +5.5 +2.5 +2.9 +8.1 +10.3 +2.8 +25.1 +5.2 +3.5 +7.3 +6.7 +2.9
ID IL IN KS KY LA MA MD ME MI MN MO MS
+7.4 +2.7 +4.9 –3.8 +4.4 –3.3 +6.4 +3.9 +6.1 +0.2 +8.0 +1.9 –4.8

2016 STATE OF THE LINE GUIDE
SLIDE 12 (CONT’D)
MT NC NE NH NJ NM NV NY OK OR PA RI SC +0.2 +4.0 +1.7 –2.4 +2.1 +2.0 +5.8 +6.9 –9.6 –1.3 +3.7 +11.0 +3.9
SD TN TX UT VA VT WI WV +2.6 –0.3 –2.8 +1.3 +6.0 +6.2 +7.6 +1.4
Page 15 of 62
© Copyright 2016 NCCI Holdings, Inc. All Rights Reserved.

2016 STATE OF THE LINE GUIDE
WC COMPONENTS OF WRITTEN PREMIUM CHANGE—SLIDE 13 Background
This slide provides the major components that impact the change in direct written premium in NCCI states for private carriers.
Key Takeaways
• Net written premium and direct written premium changed by +2.9% and +4.3%, respectively, on a countrywide basis
• The direct written premium for NCCI states changed by only +2.5%
• The increase in carrier estimated payroll was the largest driver impacting premium growth • Changes in bureau loss cost level, mix of business, and carrier discounting served to offset the premium
level increases due to changes in payroll and other factors • Some items in other factors include:
o Change in audit impacts o Change in the average experience mod o Change in mix of policy types o Change in deductible credit amounts o Change in mix between private carrier and state fund markets
Data Sources
• Countrywide: NAIC Annual Statement data • NCCI states: Statutory Page 14 from the NAIC Annual Statement for all states where NCCI provides
ratemaking services • Components: NCCI Policy data
Page 16 of 62
© Copyright 2016 NCCI Holdings, Inc. All Rights Reserved.

2016 STATE OF THE LINE GUIDE
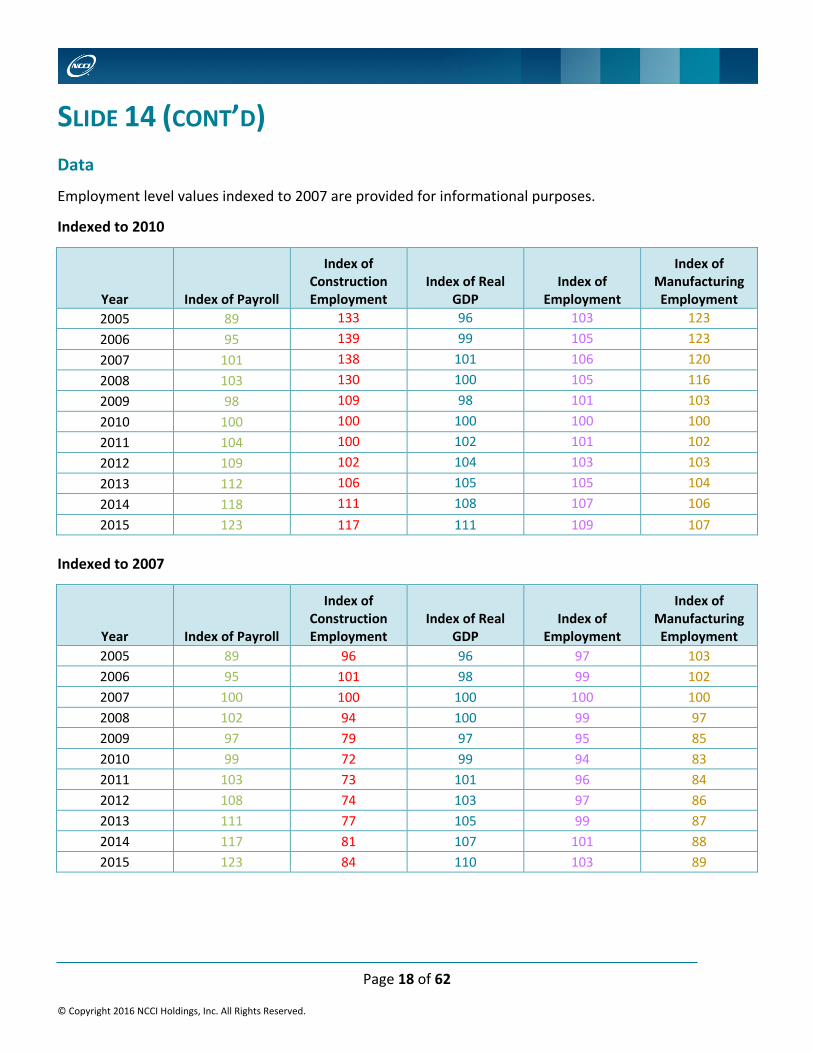
US EMPLOYMENT LEVELS—SLIDE 14 Background
Several economic indicators are indexed to 2010 in order to focus on employment changes during the recovery from the Great Recession.
Key Takeaways
• From 2010 to 2015, payroll has grown 23%, which is more than the similar growth rates observed in GDP and employment over the same period
• Construction sector employment has increased 17% during the recovery, but also had the most room for improvement after notably falling prior to 2010
• The growth in manufacturing employment has lagged behind
Data Sources
• US Bureau of Labor Statistics (BLS) • US Bureau of Economic Analysis (BEA)
Page 17 of 62
© Copyright 2016 NCCI Holdings, Inc. All Rights Reserved.
2016 STATE OF THE LINE GUIDE
SLIDE 14 (CONT’D) Data
Employment level values indexed to 2007 are provided for informational purposes.
Indexed to 2010
Year Index of Payroll
Index of Construction Employment
Index of Real GDP
Index of Employment
Index of Manufacturing Employment
2005 89 133 96 103 123 2006 95 139 99 105 123 2007 101 138 101 106 120 2008 103 130 100 105 116 2009 98 109 98 101 103 2010 100 100 100 100 100 2011 104 100 102 101 102 2012 109 102 104 103 103 2013 112 106 105 105 104 2014 118 111 108 107 106 2015 123 117 111 109 107
Indexed to 2007
Year Index of Payroll
Index of Construction Employment
Index of Real GDP
Index of Employment
Index of Manufacturing Employment
2005 89 96 96 97 103 2006 95 101 98 99 102 2007 100 100 100 100 100 2008 102 94 100 99 97 2009 97 79 97 95 85 2010 99 72 99 94 83 2011 103 73 101 96 84 2012 108 74 103 97 86 2013 111 77 105 99 87 2014 117 81 107 101 88 2015 123 84 110 103 89
Page 18 of 62
© Copyright 2016 NCCI Holdings, Inc. All Rights Reserved.

2016 STATE OF THE LINE GUIDE
WC APPROVED CHANGES IN BUREAU PREMIUM LEVEL—SLIDE 15 Background
The Bureau premium level changes shown here reflect the approved changes in advisory rates, loss costs, assigned risk rates, and rating values as filed in NCCI states.
The percentage changes by state are weighted using calendar year direct written premium as reported to the NAIC. Texas is included beginning with Calendar Year 2011 and West Virginia beginning with Calendar Year 2008.
Key Takeaways
• The changes shown reflect a number of factors impacting system costs, such as changes in the economy, cost containment initiatives and reforms.
• Overall, the NCCI premium level changes have been moderate over the last 15 years, all falling within a +/-5% range.
Data Sources
• Statutory Page 14 from the NAIC Annual Statement for calendar year direct written premium by state • Approved loss cost and rate filings for the premium level changes by state
The value for the most recent year is preliminary because there may be additional filing approvals with effective dates in 2016.
Data
2000 2001 2002 2003 2004 2005 2006 2007 2008 2009 2010 2011
+0.6 –1.2 –0.5 +2.5 +0.4 –0.2 –0.3 –3.0 –3.8 –5.1 –2.6 –1.3
2012 2013 2014 2015 2016p
+2.1 –0.2 –1.4 –4.5 –3.4
Page 19 of 62
© Copyright 2016 NCCI Holdings, Inc. All Rights Reserved.

Page 20 of 62
© Copyright 2016 NCCI Holdings, Inc. All Rights Reserved.
2016 STATE OF THE LINE GUIDE
LATEST CHANGES IN BUREAU PREMIUM LEVEL—SLIDE 16
Background
Each state’s value reflects the most recent voluntary market approved or filed and pending bureau premium level change in advisory rates, loss costs, and rating values as filed in jurisdictions where NCCI provides ratemaking services as of April 15, 2016.
The percentage changes in bureau premium level by state are weighted using calendar year direct written premium as reported to the NAIC. In the slide, green represents premium level increases, while orange represents premium level decreases. The deeper colors represent larger magnitudes of change. Law‐only filings are not included in this analysis.
Key Takeaways
Premium level changes vary significantly by state Premium level decreases were approved in the majority of states
Data Sources
Statutory Page 14 from the NAIC Annual Statement for calendar year direct written premium by state Approved or filed and pending loss cost and rate filings for the premium level changes by state
Data
AK AL AR AZ CO CT DC FL GA HI IA ID IL
–2.6 –8.2 –4.3 –2.2 –1.9 –3.8 +0.4 –4.7 +2.8 +1.4 +2.2 +0.2 –5.5
IN KS KY LA MD ME MO MS MT NC NE NH NM
+1.3 –11.6 –3.4 –2.7 –5.3 +0.1 –2.4 –7.9 –3.4 –10.2 –1.2 –5.9 –6.2
NV OK OR RI SC SD TN TX UT VA VT WV
–5.5 –14.8 –5.3 –4.9 +4.1 –1.3 –0.9 –9.9 –2.5 +3.4 +2.6 –12.1

2016 STATE OF THE LINE GUIDE
WC IMPACT OF DISCOUNTING ON PREMIUM—SLIDE 17 Background
This slide shows the impact of rate/loss cost departures, schedule rating, and dividends on policy year premium based on private carrier data through December 31, 2015, for all states where NCCI provides ratemaking services, excluding Texas. Dividend ratios are based on calendar year statistics. The NCCI benchmark level does not include an underwriting contingency provision.
Key Takeaway
Carrier discounting has typically had a net negative effect on workers compensation premium, but in each of the last two years, total discounting has increased premium by almost 1%.
Data Sources
• Statutory Page 14 from the NAIC Annual Statement • NCCI Financial Call data
The value for the most recent year is preliminary because additional data submissions may still be received by the NAIC.
Data
1991 1992 1993 1994 1995 1996 1997 1998 1999 2000 2001 2002 2003 2004 2005
–7.1 –7.4 –7.1 –8.5 –10.5 –14.6 –17.7 –22.6 –23.2 –19.2 –14.3 –4.0 –1.7 +2.1 +0.7
2006 2007 2008 2009 2010 2011 2012 2013 2014 2015p
–2.2 –4.7 –7.4 –8.4 –8.8 –7.7 –3.8 –0.2 +1.0 +0.7
Page 21 of 62
© Copyright 2016 NCCI Holdings, Inc. All Rights Reserved.

2016 STATE OF THE LINE GUIDE
WC IMPACT OF DISCOUNTING ON PREMIUM—SLIDE 18 Background
This slide shows the component impacts of rate/loss cost departures, schedule rating, and dividends on policy year premium based on private carrier data through December 31, 2015, for all states where NCCI provides ratemaking services, excluding Texas. Dividend ratios are based on calendar year statistics. The NCCI benchmark level does not include an underwriting contingency provision.
Key Takeaways
• The decrease in premium due to the impact of schedule rating has persisted. • Rate and loss cost departures have been positive since 2002. Beginning in 2013, upward rate/loss cost
departures have more than offset the impact of schedule rating. • The net effect of carrier discounting on premium was approximately +1% in 2015.
Data Sources
• Statutory Page 14 from the NAIC Annual Statement • NCCI Financial Call data
The value for the most recent year is preliminary because additional data submissions may still be received by the NAIC.
Page 22 of 62
© Copyright 2016 NCCI Holdings, Inc. All Rights Reserved.

2016 STATE OF THE LINE GUIDE
WC PRICE —MARKET INDEX SURVEY—SLIDE 19 Background
Survey respondents were asked to review recent renewals and determine how premium rates have changed over a specific period of time.
The green shading represents the percentage of agents that observed an increase, while orange represents the percentage of agents that observed a decrease.
These observations can be used to determine trends in pricing from year to year.
Key Takeaway
In the fourth quarter of 2014, about 43% of agent respondents observed increases in workers compensation premiums at renewal. By the fourth quarter of 2015, only 12% reported observing increases and over half observed decreases.
Data Source
The pricing survey was provided by The Council of Insurance Agents & Brokers
Data
Increase No Change Decrease 4Q 2013 74% 16% 10% 4Q 2014 43% 26% 31% 4Q 2015 12% 31% 57%
Page 23 of 62
© Copyright 2016 NCCI Holdings, Inc. All Rights Reserved.

2016 STATE OF THE LINE GUIDE
WC COMBINED RATIOS—SLIDE 21 Background
This slide shows workers compensation combined ratios. See Slide 4 for more background.
Key Takeaways
• The 2015 combined ratio of 94% compares favorably to those achieved within the last 25 years—with 2006 being the only year in which the industry achieved a better underwriting result.
• The 2014 combined ratio of 100% is a revision from NCCI’s preliminary estimate of 98% provided last year. The revision recognizes one carrier’s restatement of certain reinsurance transactions.
• Similar to the P/C industry as a whole, the most recent workers compensation underwriting cycle has been relatively milder and shorter than those preceding it. However, the peaks and troughs of the most recent workers compensation underwriting cycle continue to be more severe than those for the overall P/C industry.
Data Sources
• NAIC Annual Statement data for individual carriers prior to consolidation of affiliated carriers, including all data available as of 4/14/2016
• Insurance Expense Exhibit Part II—Allocation to Lines of Business Net of Reinsurance
The value for the most recent year is preliminary because additional data submissions may still be received by the NAIC.
Data Information for state funds is included for informational purposes.
Year 2000 2001 2002 2003 2004 2005 2006 2007 2008 2009 2010
Private Carriers 118 122 111 110 107 103 93 101 101 110 115
State Funds 137 117 116 103 102 102 106 115 121 129 138
2011 2012 2013 2014 2015p
115 109 102 100 94
133 124 115 116 107
Page 24 of 62
© Copyright 2016 NCCI Holdings, Inc. All Rights Reserved.

2016 STATE OF THE LINE GUIDE
WC COMBINED RATIO COMPONENTS—SLIDE 22 Background
This slide shows the components of the workers compensation combined ratios. The loss ratios in this slide compare net incurred losses to net earned premium. The loss ratio is the largest component of the combined ratio.
The loss adjustment expense (LAE) ratio compares net incurred LAE to net earned premium. LAE includes both defense and cost containment expenses and adjusting and other expenses.
Policyholder dividends are the smallest component of the combined ratio.
The underwriting expense ratio compares the costs associated with writing insurance to net written premium. The underwriting expenses included in the ratio are: • Commission and brokerage expenses • Taxes, licenses, and fees • Other acquisition expenses • General expenses
Key Takeaways
• The 2015 loss ratio represents a 6-point decline compared with that for 2014—serving as the primary component driving the decrease in the 2015 combined ratio. The 2015 loss ratio is the lowest observed in at least 25 years.
• The LAE ratio decreased slightly, but this was offset by an increase in the underwriting expense ratio.
Data Sources
• NAIC Annual Statement data for individual carriers prior to consolidation of affiliated carriers, including all data available as of 4/14/2016
• Insurance Expense Exhibit Part II—Allocation to Lines of Business Net of Reinsurance
The value for the most recent year is preliminary because additional data submissions may still be received by the NAIC.
Page 25 of 62
© Copyright 2016 NCCI Holdings, Inc. All Rights Reserved.

2016 STATE OF THE LINE GUIDE
SLIDE 22 (CONT’D) Data
Year 1990 1991 1992 1993 1994 1995 1996 1997 1998 1999 2000
Dividend Ratio 5.1 4.8 4.4 4.7 6.4 6.0 4.8 5.4 5.3 5.6 4.7
Underwriting Expense Ratio 17.6 18.5 19.8 20.4 21.7 23.3 25.4 25.9 26.7 28.0 26.4
LAE Ratio 10.7 11.5 13.2 12.4 13.1 12.5 13.7 13.8 15.3 15.8 15.9
Loss Ratio 83.8 87.8 83.9 71.7 60.5 55.3 55.8 55.5 60.1 65.9 71.2
Combined Ratio 117 123 121 109 102 97 100 101 107 115 118
2001 2002 2003 2004 2005 2006 2007 2008 2009 2010 2011 2012 2013 2014 2015p
3.7 2.8 1.6 1.3 1.3 1.3 1.5 1.7 1.6 1.6 1.6 1.4 1.3 1.2 1
26.1 23.5 22.2 22.1 22.3 19.6 24.6 24.5 26.2 26.7 25.9 26.2 25.0 24.3 25
13.8 13.7 15.0 14.5 14.4 13.6 14.5 14.1 14.9 16.0 17.0 15.2 14.4 14.5 14
78.0 70.8 70.7 68.9 64.5 58.7 60.1 60.3 67.6 70.7 70.3 65.8 60.9 59.8 54
122 111 110 107 103 93 101 101 110 115 115 109 102 100 94
Page 26 of 62
© Copyright 2016 NCCI Holdings, Inc. All Rights Reserved.

2016 STATE OF THE LINE GUIDE
WC LAE TO LOSS RATIOS—SLIDE 23 Background
While taking the ratio of net incurred LAE to net earned premium provides the contribution of LAE to the overall combined ratio, LAE as a ratio to loss may be a more meaningful measure of the effort it takes to manage and settle claims.
Key Takeaways
• Although the ratio of LAE to earned premium fell in 2015, the ratio of LAE to incurred losses continued to increase
• The increase in the ratio of LAE to losses is due to the combined impact of an increase in defense and cost containment expense in the numerator and a reduced loss volume in the denominator
Data Sources
• NAIC Annual Statement data for individual carriers prior to consolidation of affiliated carriers, including all data available as of 4/14/2016
• Insurance Expense Exhibit Part II—Allocation to Lines of Business Net of Reinsurance
The value for the most recent year is preliminary because additional data submissions may still be received by the NAIC.
Data
1990 1991 1992 1993 1994 1995 1996 1997 1998 1999 2000 2001 2002 2003 2004
12.8 13.1 15.7 17.3 21.7 22.6 24.6 24.9 25.5 24.0 22.3 17.7 19.4 21.2 21.0
2005 2006 2007 2008 2009 2010 2011 2012 2013 2014 2015p
22.3 23.2 24.1 23.4 22.0 22.6 24.1 23.0 23.7 24.2 26
Page 27 of 62
© Copyright 2016 NCCI Holdings, Inc. All Rights Reserved.

2016 STATE OF THE LINE GUIDE
WC IGIT RATIOS—SLIDE 24 Background
The overall investment gain is allocated by line of business according to the NAIC-prescribed allocation procedure.
The WC Investment Gain on Insurance Transactions (IGIT) ratio measures investment performance by comparing investment income allocated to the WC line to WC earned premium.
Key Takeaway
The 2015 investment gain on insurance transactions (12%) is consistent with that for 2014 (11.6%).
Data Sources
• NAIC Annual Statement data for individual carriers prior to consolidation of affiliated carriers, including all data available as of 4/14/2016
• Insurance Expense Exhibit Part II—Allocation to Lines of Business Net of Reinsurance
The value for the most recent year is preliminary because additional data submissions may still be received by the NAIC.
Data
1990 1991 1992 1993 1994 1995 1996 1997 1998 1999 2000 2001 2002 2003 2004
13.0 14.0 18.1 16.7 14.4 17.0 17.2 19.1 14.9 18.5 18.3 11.6 14.9 10.2 10.0
2005 2006 2007 2008 2009 2010 2011 2012 2013 2014 2015p
12.8 9.9 12.0 8.7 10.8 14.8 14.7 13.7 15.2 11.6 12
Page 28 of 62
© Copyright 2016 NCCI Holdings, Inc. All Rights Reserved.

2016 STATE OF THE LINE GUIDE
WC IGIT RATIOS: MOVING AVERAGE—SLIDE 25 Background
Since investment gains can be volatile and lead to conclusions based on single-year observations that may not be pertinent to long-tailed lines of business, this slide shows five-year moving averages of the IGIT ratios shown on Slide 24. See Slide 24 for more background.
Key Takeaway
The five-year moving average in 2015 remains below the long-term average of 14.1%.
Data Sources
• NAIC Annual Statement data for individual carriers prior to consolidation of affiliated carriers, including all data available as of 4/14/2016
• Insurance Expense Exhibit Part II—Allocation to Lines of Business Net of Reinsurance
The value for the most recent year is preliminary because additional data submissions may still be received by the NAIC.
Data
1994 1995 1996 1997 1998 1999 2000 2001 2002 2003 2004 2005 2006 2007 2008
15.2 16.0 16.7 16.9 16.5 17.3 17.6 16.5 15.6 14.7 13.0 11.9 11.6 11.0 10.7
2009 2010 2011 2012 2013 2014 2015p
10.9 11.2 12.2 12.5 13.8 14.1 13
Page 29 of 62
© Copyright 2016 NCCI Holdings, Inc. All Rights Reserved.

2016 STATE OF THE LINE GUIDE
WC PRETAX OPERATING GAIN—SLIDE 26 Background
The pretax operating gain in this slide measures the overall financial performance of the workers compensation business, taking into account both underwriting income and investment income. Pretax operating gain excludes direct changes to surplus, including, but not limited to, changes in: • Unrealized capital gains • Unrealized foreign exchange
gain • Net deferred income tax • Nonadmitted assets • The provision for reinsurance • Surplus notes
Key Takeaways
• The 6-point underwriting gain and 12-point investment gain on insurance transactions resulted in an 18-point pretax operating gain in 2015. While this is an encouraging result, the industry’s operating results can ebb and flow very quickly.
• Some notable years include 2001, where the workers compensation industry posted a very high soft market combined ratio along with low investment gains during the recession.
• More recently, from 2009 to 2011, the height of the most recent underwriting cycle coincided with struggling returns caused by the Great Recession.
Data Sources
• NAIC Annual Statement data for individual carriers prior to consolidation of affiliated carriers, including all data available as of 4/14/2016
• Insurance Expense Exhibit Part II—Allocation to Lines of Business Net of Reinsurance
The value for the most recent year is preliminary because additional data submissions may still be received by the NAIC.
Page 30 of 62
© Copyright 2016 NCCI Holdings, Inc. All Rights Reserved.

2016 STATE OF THE LINE GUIDE
SLIDE 26 (CONT’D) Data
Information for state funds is included for informational purposes.
Year 1990 1991 1992 1993 1994 1995 1996 1997 1998 1999 2000
Private Carriers –4.2 –8.6 –3.2 7.5 12.7 19.9 17.5 18.5 7.5 3.2 0.1
2001 2002 2003 2004 2005 2006 2007 2008 2009 2010 2011 2012 2013 2014 2015p
–10.0 4.1 0.7 3.2 10.3 16.7 11.3 8.1 0.5 –0.2 –0.1 5.1 13.5 11.8 18
Year 2000 2001 2002 2003 2004 2005 2006 2007 2008 2009 2010
State Funds –7.9 –1.0 –1.4 6.4 7.6 13.2 10.9 7.5 –1.7 3.5 2.4
2011 2012 2013 2014 2015p
–3.3 8.1 6.5 5.3 9
Page 31 of 62
© Copyright 2016 NCCI Holdings, Inc. All Rights Reserved.
2016 STATE OF THE LINE GUIDE
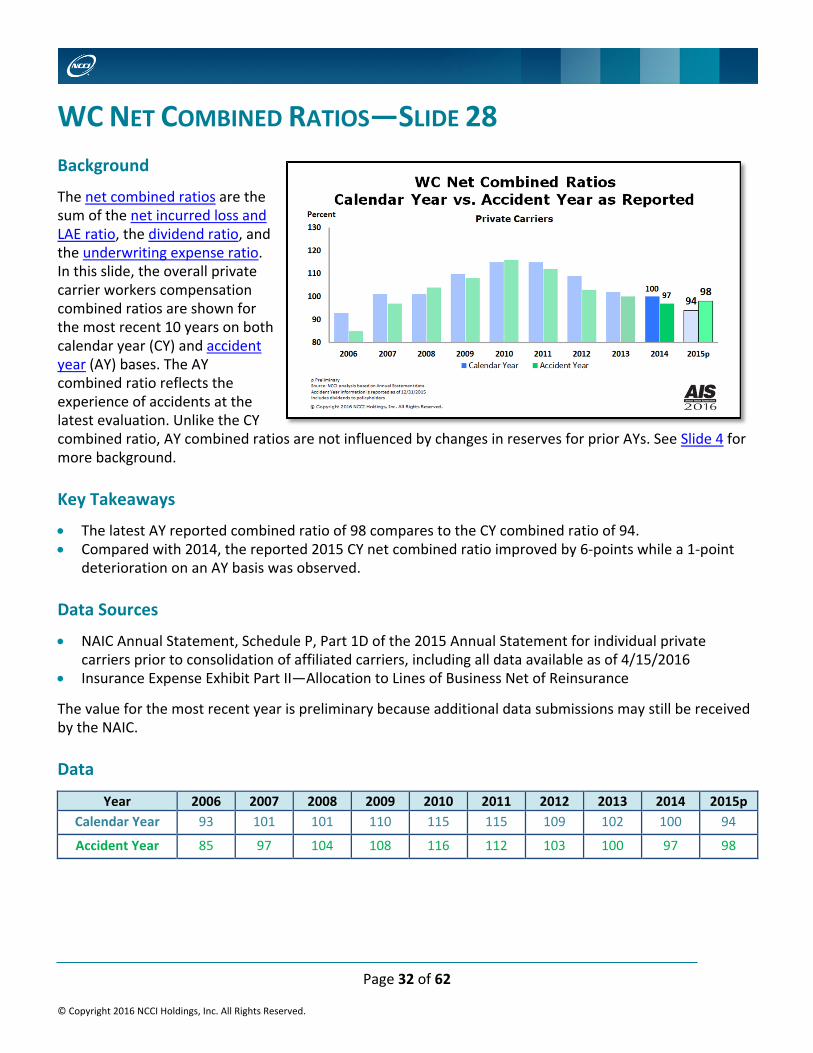
WC NET COMBINED RATIOS—SLIDE 28 Background
The net combined ratios are the sum of the net incurred loss and LAE ratio, the dividend ratio, and the underwriting expense ratio. In this slide, the overall private carrier workers compensation combined ratios are shown for the most recent 10 years on both calendar year (CY) and accident year (AY) bases. The AY combined ratio reflects the experience of accidents at the latest evaluation. Unlike the CY combined ratio, AY combined ratios are not influenced by changes in reserves for prior AYs. See Slide 4 for more background.
Key Takeaways
• The latest AY reported combined ratio of 98 compares to the CY combined ratio of 94. • Compared with 2014, the reported 2015 CY net combined ratio improved by 6-points while a 1-point
deterioration on an AY basis was observed.
Data Sources
• NAIC Annual Statement, Schedule P, Part 1D of the 2015 Annual Statement for individual private carriers prior to consolidation of affiliated carriers, including all data available as of 4/15/2016
• Insurance Expense Exhibit Part II—Allocation to Lines of Business Net of Reinsurance
The value for the most recent year is preliminary because additional data submissions may still be received by the NAIC.
Data
Year 2006 2007 2008 2009 2010 2011 2012 2013 2014 2015p Calendar Year 93 101 101 110 115 115 109 102 100 94
Accident Year 85 97 104 108 116 112 103 100 97 98
Page 32 of 62
© Copyright 2016 NCCI Holdings, Inc. All Rights Reserved.

2016 STATE OF THE LINE GUIDE
WC LOSS AND LAE NET RESERVE DEFICIENCIES—SLIDE 29 Background
The net reserve deficiency is the dollar difference (in billions) between NCCI’s estimate of net loss and LAE reserves and net reserves as reported by private carriers in the NAIC Annual Statement, Schedule P, Part 1D.
The overall workers compensation net reserve deficiency is calculated for all accident years combined at each year-end valuation.
Key Takeaways
• NCCI’s estimate of the 2015 reserve deficiency is $7 billion, which is $3 billion less than last year • NCCI’s estimate of the reserve deficiency always includes the tabular discount—the statutorily allowed
reduction in carried reserves for lifetime pension cases—which was $4.6 billion of the $7 billion deficiency
• The 2015 reserve deficiency is about 5% of carried reserves, down from last year’s 8%
Data Source
NAIC Annual Statement, Schedule P, Part 1D of the 2015 Annual Statement for individual private carriers prior to consolidation of affiliated carriers, including all data available as of 4/15/2016
Data
1995 1996 1997 1998 1999 2000 2001 2002 2003 2004 2005 2 5 10 15 18 20 21 18 15 12 9
2006 2007 2008 2009 2010 2011 2012 2013 2014 2015 4 2 6 9 10 11 13 11 10 7
Page 33 of 62
© Copyright 2016 NCCI Holdings, Inc. All Rights Reserved.

2016 STATE OF THE LINE GUIDE
WC NET LOSS AND LAE RATIOS—NCCI ULTIMATE ACCIDENT YEAR SELECTIONS VS. AS REPORTED—SLIDE 30 Background
The accident year (AY) net incurred loss and LAE ratio is calculated as a ratio of AY net losses and LAE to CY earned premium. The values in this slide reflect ultimate loss and LAE ratios estimated by NCCI compared with loss and LAE ratios reported at the latest evaluation by private carriers in the NAIC Annual Statement, Schedule P, Part 1D.
Key Takeaways
• The NCCI selections for all years prior to 2013 are higher than the industry booked, indicating that those years will likely develop upward; 2013 and later years are indicating redundancies.
• NCCI’s estimate for AY 2015 is 65%, whereas that reported by the industry is 72%—indicating an estimated 7-point redundancy. The decline in estimated industry redundancy is primarily due to the addition of the favorable lead year.
• NCCI’s selections for AYs 2012 through 2014 as of year-end 2015 are lower than the estimates for those AYs as of year-end 2014.
Data Source
NAIC Annual Statement, Schedule P, Part 1D of the 2015 Annual Statement for individual private carriers prior to consolidation of affiliated carriers, including all data available as of 4/15/2016
Data
Accident Year 2006 2007 2008 2009 2010 2011 2012 2013 2014 2015
As Reported 64 71 78 80 87 84 75 73 71 72
NCCI Selections 65 73 80 82 90 86 76 72 68 65
Page 34 of 62
© Copyright 2016 NCCI Holdings, Inc. All Rights Reserved.

Page 35 of 62
© Copyright 2016 NCCI Holdings, Inc. All Rights Reserved.
2016 STATE OF THE LINE GUIDE
WC NET LOSS AND LAE RATIOS—ACCIDENT YEAR EMERGENCE—SLIDE 31
Background
The net incurred loss and LAE ratio is calculated as the ratio of incurred losses and LAE to earned premium. The accident year net incurred loss and LAE ratios change over time as the reserves on claims are reevaluated from one report to the next (i.e., AY emergence).
Key Takeaways
A 73% net incurred loss and LAE ratio was originally reported for AY 2006, and subsequent reserve reductions have contributed to its year‐end 2015 value of 64%.
As AYs 2006 and 2007 have developed favorably over time, they have revealed redundancies in the initially reported net loss and LAE reserves for these years.
Data Source
NAIC Annual Statement, Schedule P, Part 1D of the 2015 Annual Statement for individual private carriers prior to consolidation of affiliated carriers, including all data available as of 4/15/2016

2016 STATE OF THE LINE GUIDE
SLIDE 31 (CONT’D) Data
Accident
Year
Data Valued as of Year-End
2006 2007 2008 2009 2010 2011 2012 2013 2014 2015
2006 73 69 67 66 65 65 64 64 64 64
2007
75 73 73 73 72 72 72 71 71
2008 76 77 78 78 78 78 78 78
2009 80 80 80 80 80 80 80
2010 83 86 87 87 87 87
2011 83 83 84 84 84
2012 80 78 78 75
2013 76 74 73
2014 73 71
2015 72
Page 36 of 62
© Copyright 2016 NCCI Holdings, Inc. All Rights Reserved.

Page 37 of 62
© Copyright 2016 NCCI Holdings, Inc. All Rights Reserved.
2016 STATE OF THE LINE GUIDE
WC LOST‐TIME CLAIM FREQUENCY—SLIDE 33
Background
The change in lost‐time claims per million dollars of pure premium includes data for all states where NCCI provides ratemaking services. Accident Years 1994–2014 exclude West Virginia.
Premium is developed to an ultimate basis and adjusted to current wage and voluntary pure premium level. Accident Years 2014 and prior are valued as of 12/31/2014. Accident Year 2015 is based on preliminary data valued as of 12/31/2015. Accident Years 2010 and 2011 show adjusted values, primarily due to significant changes in audit activity.
Key Takeaways
NCCI estimates a –3% claim frequency change between Accident Years 2014 and 2015. The cumulative decrease in lost‐time claim frequency over the last twenty years is more than 50%.
Data Source
NCCI Financial Call data
Data
Accident Year 1995 1996 1997 1998 1999 2000 2001 2002 2003 2004 2005
Frequency Change –6.5 –4.5 +0.5 –3.9 –2.3 –4.5 –6.9 –4.5 –4.1 –3.7 –6.6
Adjusted Frequency Change
2006 2007 2008 2009 2010 2011 2012 2013 2014 2015p
–4.5 –2.2 –4.3 –4.9 +10.6 –3.9 –5.4 –3.2 –1.7 –3
+3.6 –0.9

Page 38 of 62
© Copyright 2016 NCCI Holdings, Inc. All Rights Reserved.
2016 STATE OF THE LINE GUIDE
WC AVERAGE INDEMNITY COST PER LOST‐TIME CLAIM— SLIDE 34
Background
The average indemnity cost per lost‐time claim uses losses developed to an ultimate basis and includes data for all states where NCCI provides ratemaking services. Accident Years 1995–2013 exclude West Virginia. High‐deductible policies are excluded from all years. Accident Years 2013 and prior are based on data through 12/31/2014. Accident Years 2014 and 2015 are based on preliminary data valued as of 12/31/2015.
Key Takeaways
NCCI estimates that the average indemnity cost per claim increased slightly in AY 2015 by about 1% compared to the corresponding AY 2014 value
Wages grew faster than the average indemnity cost per claim in both 2014 and 2015
Data Source
NCCI Financial Call data
Data
AY 1995 1996 1997 1998 1999 2000 2001 2002
Ind Severity (000) $9.8 $10.4 $11.2 $12.2 $13.5 $14.8 $16.2 $16.7
Change (%) +1.7 +5.9 +7.7 +9.0 +10.1 +10.1 +9.2 +3.1
2003 2004 2005 2006 2007 2008 2009 2010 2011 2012
$17.5 $17.6 $18.2 $19.3 $20.5 $22.4 $22.6 $22.1 $22.2 $22.2
+4.6 +1.0 +3.1 +5.9 +6.6 +9.3 +0.6 –2.2 +0.9 –0.1
2013 2014p 2015p
$22.9 $23.2 $23.5
+2.9 +1.5 +1

2016 STATE OF THE LINE GUIDE
WC AVERAGE INDEMNITY COST PER LOST-TIME CLAIM— SLIDE 35 Background
Here we build on the bars from Slide 34, connecting them with a blue trend line—indicating the growth in actual WC average indemnity severity.
The orange line at the top of the chart represents the corresponding growth in WC average indemnity severity over and above the growth in workers’ wages.
Average weekly wages between 2008 and 2011 were adjusted to compensate for exceptional volatility in bonuses for the financial sector during these years. See Slide 34 for more details.
Key Takeaways
• Actual indemnity severity has increased 138% since 1995 • The corresponding increase in indemnity severity over and above the increase in wages is 23%—
indicating that WC indemnity benefits have risen faster than wages over this time period
Data Sources
• Indemnity severity is from NCCI Financial Call data, developed to an ultimate basis; excludes high-deductible policies
• US Average Weekly Wage is based on (a) Quarterly Census of Employment and Wages (QCEW) data from the US Bureau of Labor Statistics (BLS) for 1994–2007 and 2012–2014 and (b) QCEW and average weekly earnings data from the BLS for 2008–2011; it is estimated by NCCI using forecasts from Moody’s Economy.com for 2015
Page 39 of 62
© Copyright 2016 NCCI Holdings, Inc. All Rights Reserved.

Page 40 of 62
© Copyright 2016 NCCI Holdings, Inc. All Rights Reserved.
2016 STATE OF THE LINE GUIDE
SLIDE 35 (CONT’D)
Data
Year 1995 1996 1997 1998 1999 2000
Indemnity Severity (000) $9.8 $10.4 $11.2 $12.2 $13.5 $14.8
Indemnity Severity in Excess of Wage Growth (000) $19.1 $19.4 $19.9 $20.5 $21.6 $22.4
US Average Weekly Wage Percentage Change (%) 3.6 4.2 5.2 5.6 4.7 6.3
2001 2002 2003 2004 2005 2006 2007 2008 2009 2010 2011 2012 2013 2014p 2015p
$16.2 $16.7 $17.5 $17.6 $18.2 $19.3 $20.5 $22.4 $22.6 $22.1 $22.2 $22.2 $22.9 $23.2 $23.5
$23.9 $24.3 $24.8 $24.0 $23.9 $24.2 $24.7 $26.2 $26.1 $25.0 $24.5 $23.8 $24.2 $23.8 $23.5
2.3 1.1 2.7 4.3 3.5 4.7 4.6 2.7 1.1 2.3 2.9 2.8 1.1 3.1 2.6
2016 STATE OF THE LINE GUIDE
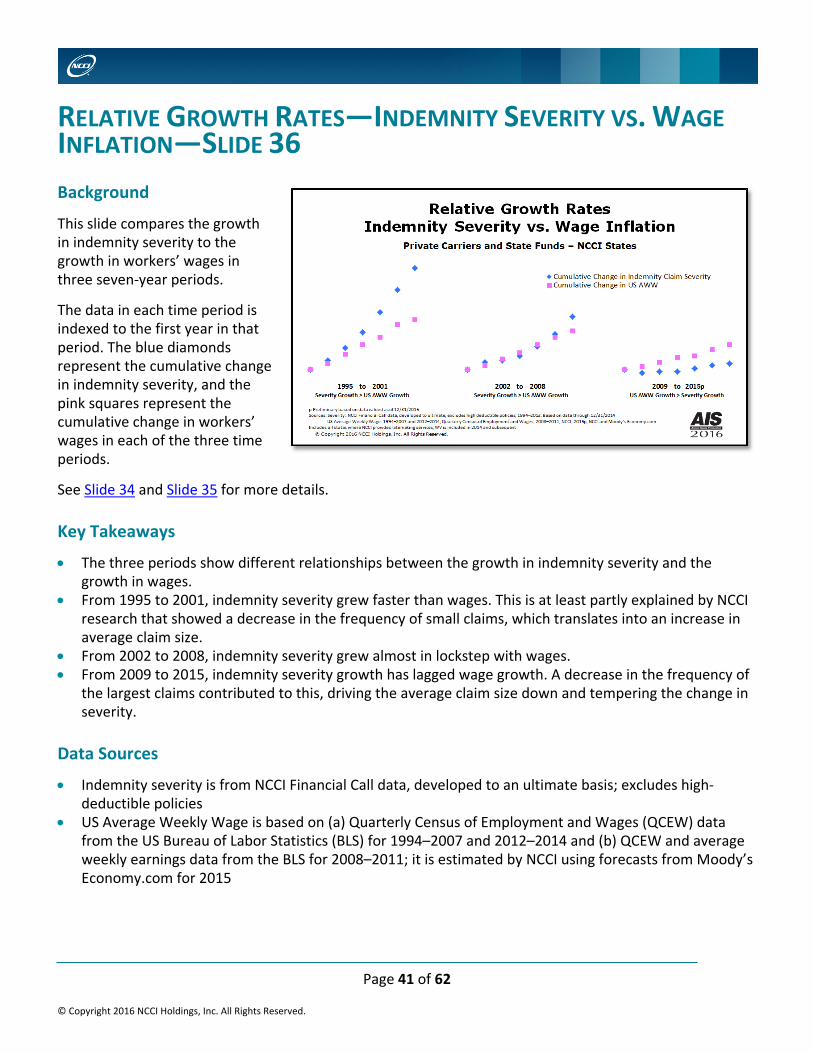
RELATIVE GROWTH RATES—INDEMNITY SEVERITY VS. WAGE INFLATION—SLIDE 36 Background
This slide compares the growth in indemnity severity to the growth in workers’ wages in three seven-year periods.
The data in each time period is indexed to the first year in that period. The blue diamonds represent the cumulative change in indemnity severity, and the pink squares represent the cumulative change in workers’ wages in each of the three time periods.
See Slide 34 and Slide 35 for more details.
Key Takeaways
• The three periods show different relationships between the growth in indemnity severity and the growth in wages.
• From 1995 to 2001, indemnity severity grew faster than wages. This is at least partly explained by NCCI research that showed a decrease in the frequency of small claims, which translates into an increase in average claim size.
• From 2002 to 2008, indemnity severity grew almost in lockstep with wages. • From 2009 to 2015, indemnity severity growth has lagged wage growth. A decrease in the frequency of
the largest claims contributed to this, driving the average claim size down and tempering the change in severity.
Data Sources
• Indemnity severity is from NCCI Financial Call data, developed to an ultimate basis; excludes high-deductible policies
• US Average Weekly Wage is based on (a) Quarterly Census of Employment and Wages (QCEW) data from the US Bureau of Labor Statistics (BLS) for 1994–2007 and 2012–2014 and (b) QCEW and average weekly earnings data from the BLS for 2008–2011; it is estimated by NCCI using forecasts from Moody’s Economy.com for 2015
Page 41 of 62
© Copyright 2016 NCCI Holdings, Inc. All Rights Reserved.

2016 STATE OF THE LINE GUIDE
SLIDE 36 (CONT’D) Data
See Slide 35 for the data underlying the severity changes.
Page 42 of 62
© Copyright 2016 NCCI Holdings, Inc. All Rights Reserved.

Page 43 of 62
© Copyright 2016 NCCI Holdings, Inc. All Rights Reserved.
2016 STATE OF THE LINE GUIDE
WC INDEMNITY CLAIM SEVERITY—SLIDE 37
Background
The average annual change in indemnity claim severity between AYs 2010 and 2014 is displayed in this U.S. map. Green represents increases in average indemnity severity, while orange represents decreases. The deeper colors represent larger magnitudes of change.
Data is included for all states where NCCI provides ratemaking services, except West Virginia. The displayed changes in severity are different from those used in ratemaking, with the most significant differences being that these values are not on‐leveled or wage‐adjusted.
Key Takeaways
Changes in indemnity claim severity vary across states The majority of the changes are increases, indicating that the average indemnity benefit level across
most states was higher in 2014 than it was in 2010 Oklahoma shows the largest decrease in indemnity claim severity, which is attributable to reforms that
were implemented in 2013.
Data Source
“NCCI Countrywide Frequency and Severity Analysis Using Data Valued as of 12/31/2014” on ncci.com

2016 STATE OF THE LINE GUIDE
INDEMNITY/MEDICAL SPLIT OVER TIME—SLIDE 38 Background
In order to appreciate the impact of various drivers on overall WC system costs, it is helpful to consider how the total benefit dollar is split between its indemnity and medical components.
Losses in this slide have been developed to an ultimate report and aggregated across states where NCCI provides ratemaking services. High-deductible policies are excluded.
Key Takeaways
• Thirty-five years ago, indemnity benefits represented the majority (57%) of the workers compensation benefit dollar
• The medical portion of the benefit dollar has grown over time, and it now represents almost 60% of total benefit costs
Data Source
NCCI Financial Call data
Data
AY 1981 1983 1985 1987 1989 1991 1993 1995 1997
Indemnity 0.57 0.55 0.55 0.55 0.53 0.52 0.50 0.48 0.48
Medical 0.43 0.45 0.45 0.45 0.47 0.48 0.50 0.52 0.52
AY 1999 2001 2003 2005 2007 2009 2011 2013 2015p
Indemnity 0.48 0.47 0.45 0.43 0.44 0.43 0.42 0.42 0.42
Medical 0.52 0.53 0.55 0.57 0.56 0.57 0.58 0.58 0.58
Page 44 of 62
© Copyright 2016 NCCI Holdings, Inc. All Rights Reserved.

2016 STATE OF THE LINE GUIDE
WC AVERAGE MEDICAL COST PER LOST-TIME CLAIM— SLIDE 39 Background
The average medical cost per lost-time claim is based on losses developed to an ultimate basis and includes data for all states where NCCI provides ratemaking services. Accident Years 1995–2013 exclude West Virginia. High-deductible policies are excluded from all years. Accident Years 2013 and prior are based on data through 12/31/2014. Accident Years 2014 and 2015 are based on preliminary data valued as of 12/31/2015.
Key Takeaways
• The change in medical severity has moderated in recent years. • NCCI estimates that the AY 2015 average medical cost per lost-time claim is 1% lower than the
corresponding AY 2014 value.
Data Source
NCCI Financial Call data
Data
AY 1995 1996 1997 1998 1999 2000 2001 2002 2003
Medical Severity (000) 9.1 9.8 10.8 11.6 12.9 13.8 15.7 17.1 18.4
Change (%) +5.1 +7.4 +10.1 +8.3 +10.6 +7.3 +13.5 +8.8 +7.7
2004 2005 2006 2007 2008 2009 2010 2011 2012 2013 2014p 2015p
19.4 20.9 22.1 23.4 25.0 26.2 26.3 26.8 27.3 28.0 28.8 28.5
+5.4 +7.8 +5.8 +5.9 +7.0 +4.5 +0.4 +2.2 +2.0 +2.3 +3.0 –1
Page 45 of 62
© Copyright 2016 NCCI Holdings, Inc. All Rights Reserved.

2016 STATE OF THE LINE GUIDE
WC AVERAGE MEDICAL COST PER LOST-TIME CLAIM— SLIDE 40 Background
Here we build on the bars from the prior slide, connecting them with a blue trend line—indicating the growth in actual WC average medical lost-time claim severity.
The orange line at the top of the chart represents the corresponding growth in WC average medical severity over and above the growth in the medical Consumer Price Index (CPI)—a measurement of medical price inflation.
See Slide 39 for more details.
Key Takeaways
• WC medical costs per claim have risen at a much faster pace than indemnity over the last thirty years. Similarly, medical inflation, as measured by the medical CPI, has outpaced wage growth.
• Medical lost-time claim severity has increased 214% since 1995. • The corresponding increase in medical lost-time claim severity over and above the increase in the
medical price inflation is 55%.
Data Sources
• Medical severity per lost-time claim is from NCCI Financial Call data, developed to an ultimate basis; excludes high-deductible policies
• US medical CPI is from the US Bureau of Labor Statistics (BLS)
Page 46 of 62
© Copyright 2016 NCCI Holdings, Inc. All Rights Reserved.

Page 47 of 62
© Copyright 2016 NCCI Holdings, Inc. All Rights Reserved.
2016 STATE OF THE LINE GUIDE
SLIDE 40 (CONT’D)
Data
Year 1995 1996 1997 1998 1999 2000
Medical Severity (000) $9.1 $9.8 $10.8 $11.6 $12.9 $13.8
Medical Severity in Excess of Medical Care Price Inflation (000) $18.4 $19.1 $20.5 $21.5 $23.0 $23.7
US Medical CPI Percentage Change (%) 4.5 3.5 2.8 3.2 3.5 4.1
2001 2002 2003 2004 2005 2006 2007 2008 2009 2010 2011 2012 2013 2014p 2015p
$15.7 $17.1 $18.4 $19.4 $20.9 $22.1 $23.4 $25.0 $26.2 $26.3 $26.8 $27.3 $28.0 $28.8 $28.5
$25.7 $26.7 $27.6 $27.9 $28.9 $29.4 $29.8 $30.7 $31.1 $30.2 $29.9 $29.4 $29.4 $29.6 $28.5
4.6 4.7 4.0 4.4 4.2 4.0 4.4 3.7 3.2 3.4 3.0 3.7 2.5 2.4 2.6

2016 STATE OF THE LINE GUIDE
RELATIVE GROWTH RATES—MEDICAL SEVERITY VS. MEDICAL CARE INFLATION—SLIDE 41 Background
Growth in medical severity compared to growth in the medical CPI is displayed here for three seven-year periods.
The data in each time period is indexed to the first year in that period. The blue diamonds represent the cumulative change in medical severity, and the pink squares represent the cumulative change in the medical CPI in each of the three time periods.
See Slide 39 for more details.
Key Takeaways
• Medical severity notably outpaced the medical CPI during the time periods 1995–2001 and 2002–2008 • For the most recent period, 2009–2015, medical severity increased at about the same rate as the
medical CPI • The change in the mix of claims by size over time impacts medical severity and partially contributes to
the differences seen in these periods
Data Sources
• Medical severity is from NCCI Financial Call data, developed to an ultimate basis; excludes high- deductible policies
• US medical CPI is from the US Bureau of Labor Statistics (BLS)
Data
See Slide 40 for the data underlying the severity changes.
Page 48 of 62
© Copyright 2016 NCCI Holdings, Inc. All Rights Reserved.

2016 STATE OF THE LINE GUIDE
WC LOST-TIME MEDICAL CLAIM SEVERITY—SLIDE 42 Background
The average annual change in medical severity for lost-time claims between 2010 and 2014 is displayed here. Green represents increases in average medical severity, while orange represents decreases. The deeper colors represent larger magnitudes of change.
Data is included for all states where NCCI provides ratemaking services, except West Virginia. The displayed changes in severity are different from those used in ratemaking, the most significant differences being that these values are not on-leveled or wage-adjusted.
Key Takeaways
• Changes in medical claim severity vary across states • The majority of the changes are increases, indicating that the average medical benefit level across most
states was higher in 2014 than it was in 2010 • The largest decrease in medical severity was in Montana, the result of a major reform implemented in
2011.
Data Source
“NCCI Countrywide Frequency and Severity Analysis Using Data Valued as of 12/31/2014” on ncci.com
Page 49 of 62
© Copyright 2016 NCCI Holdings, Inc. All Rights Reserved.

2016 STATE OF THE LINE GUIDE
RX COSTS PER ACTIVE CLAIM CONTINUE TO GROW—SLIDE 43 Background
The prescription drug cost per active claim is the ratio of prescription drug payments during a service year to the number of claims with at least one medical service during that same service year. Only those payments for drugs with a National Drug Code are used in this chart.
Key Takeaways
• Prescription drugs represent a significant portion of workers compensation costs
• Prescription drug costs per active claim have continued to increase in recent years
Data Source
NCCI Medical Call data
Page 50 of 62
© Copyright 2016 NCCI Holdings, Inc. All Rights Reserved.

2016 STATE OF THE LINE GUIDE
TOP CLASS CODES BASED ON RESIDUAL MARKET PLAN TOTAL WRITTEN PREMIUM—SLIDE 45 Background
Some of the more hazardous classes are in the top 5 largest residual market classification codes.
The results are based on manual premium for both intrastate policies and the state-specific portion of interstate policies, excluding Standard Exception classifications.
Key Takeaway
The top five residual market classification codes based on the largest written premium volume typically remain consistent from year to year.
Data Source
NCCI Policy data
Page 51 of 62
© Copyright 2016 NCCI Holdings, Inc. All Rights Reserved.

2016 STATE OF THE LINE GUIDE
WC RESIDUAL MARKET POOL PREMIUM—SLIDE 46 Background
Insureds unable to obtain coverage in the voluntary market can secure coverage through the Residual Market Pool in participating states. The estimated ultimate premium for all Residual Market Pools serviced by NCCI is displayed by policy year.
Key Takeaways
• Premium for the NCCI-serviced Residual Market Pools has been increasing since 2010, but is expected to remain relatively flat in 2015 with estimated ultimate premium at $1.2 billion
• Tennessee joined the National Pool effective July 1, 2015
Data Sources
• Pool data for all NCCI-serviced WC Residual Market Pool states valued as of 12/31/2015 • Tennessee Reinsurance Mechanism premium is not included • NCCI’s Residual Market Quarterly Results
Data
1986 1987 1988 1989 1990 1991 1992 1993 1994 1995 1996 1997 1998 1999 2000
2.1 2.6 2.8 3.5 4.0 4.4 4.8 4.1 3.1 2.0 1.0 0.6 0.3 0.3 0.4
2001 2002 2003 2004 2005 2006 2007 2008 2009 2010 2011 2012 2013 2014 2015p
0.6 1.1 1.4 1.5 1.4 1.2 0.9 0.7 0.5 0.5 0.5 0.8 1.1 1.2 1.2
Page 52 of 62
© Copyright 2016 NCCI Holdings, Inc. All Rights Reserved.

2016 STATE OF THE LINE GUIDE
WC RESIDUAL MARKET SHARE—SLIDE 47 Background
Pool and direct assignment premium as a portion of the total WC market for all NCCI-serviced Residual Market Pool states is displayed by calendar year.
Key Takeaway
The residual market share remained steady at 8% for the most recent year. This is a relatively manageable size compared to the peak of 29% in 1992.
Data Sources
• Pool and direct assignment data for all NCCI-serviced WC Residual Market Pool states valued as of 12/31/2015
• NAIC Annual Statement data for individual carriers prior to consolidation of affiliated carriers, including all data available as of 4/14/2016
• NCCI’s Residual Market Management Summary
Data
1986 1987 1988 1989 1990 1991 1992 1993 1994 1995 1996 1997 1998 1999 2000
16 18 17 22 24 26 29 28 24 17 11 8 4 3 3
2001 2002 2003 2004 2005 2006 2007 2008 2009 2010 2011 2012 2013 2014 2015p
5 11 13 13 12 10 8 7 5 5 5 7 8 8 8
Page 53 of 62
© Copyright 2016 NCCI Holdings, Inc. All Rights Reserved.

2016 STATE OF THE LINE GUIDE
WC RESIDUAL MARKET PREMIUM VS. AVERAGE POLICY SIZE—SLIDE 48 Background
The residual market total estimated annual premium and average policy size are displayed by policy year.
Key Takeaways
• The average policy size began to fall between 2003 and 2004 and then again between 2013 and 2014
• Total residual market premium began falling between 2004 and 2005, and we are seeing the same pattern between 2014 and 2015
• The average policy size within the residual market tracks closely with the change in the size of the residual market
Data Source
Pool and direct assignment data for all NCCI-administered WC Residual Market Plan states, including prorated premium of cancelled policies
Data
Year 2001 2002 2003 2004 2005 2006 2007 2008 2009 2010
Average Policy Size 4,407 5,405 5,419 4,948 4,426 3,822 3,436 3,024 2,790 2,675
Premium (in Millions of Dollars) 465 791 997 1015 924 781 660 501 396 344
2011 2012 2013 2014 2015
3,008 4,194 4,875 4,775 4,394
389 580 758 808 799
Page 54 of 62
© Copyright 2016 NCCI Holdings, Inc. All Rights Reserved.

2016 STATE OF THE LINE GUIDE
WC RESIDUAL MARKET GROWTH AT FIRST QUARTER— SLIDE 49 Background
This slide compares estimated residual market premium by size of risk between the first quarters of 2015 and 2016.
Key Takeaway
Written premium volume for risks greater than $50,000 decreased in the first quarter of 2016. This was somewhat offset by growth in the smaller size of risk categories.
Data Source
Pool and direct assignment premium for all NCCI-administered WC Residual Market Plan states, including the prorated premium of cancelled policies
Page 55 of 62
© Copyright 2016 NCCI Holdings, Inc. All Rights Reserved.

Page 56 of 62
© Copyright 2016 NCCI Holdings, Inc. All Rights Reserved.
2016 STATE OF THE LINE GUIDE
WC RESIDUAL MARKET POOL COMBINED RATIO—SLIDE 50
Background
Historical residual market combined ratios are displayed on this slide for all NCCI‐serviced residual market pool states. These ratios reflect projected ultimate losses, servicing carrier allowance, producer fees, and other pool and plan administration expenses as a ratio to ultimate premium plus pool interest income on cash flow.
The results are calculated by policy year (PY), which allows a direct match between premium earned and claims incurred for a given block of policies. PY combined ratios can change over time as new claims are reported and the reserves on existing claims are reevaluated.
Key Takeaway
The estimated residual market pool combined ratio for PY 2015 is 106%.
Data Sources
Pool data and Plan expenses for pool members for all NCCI‐serviced WC Residual Market Pool states data valued as of 12/31/2015
Tennessee Reinsurance Mechanism experience is not included in the combined ratios NCCI’s Residual Market Quarterly Results
Data
1986 1987 1988 1989 1990 1991 1992 1993 1994 1995 1996 1997 1998 1999 2000
165 169 167 158 143 127 112 103 97 96 100 104 117 117 117
2001 2002 2003 2004 2005 2006 2007 2008 2009 2010 2011 2012 2013 2014 2015p
112 114 109 106 104 106 111 113 109 113 113 106 103 104 106
2016 STATE OF THE LINE GUIDE
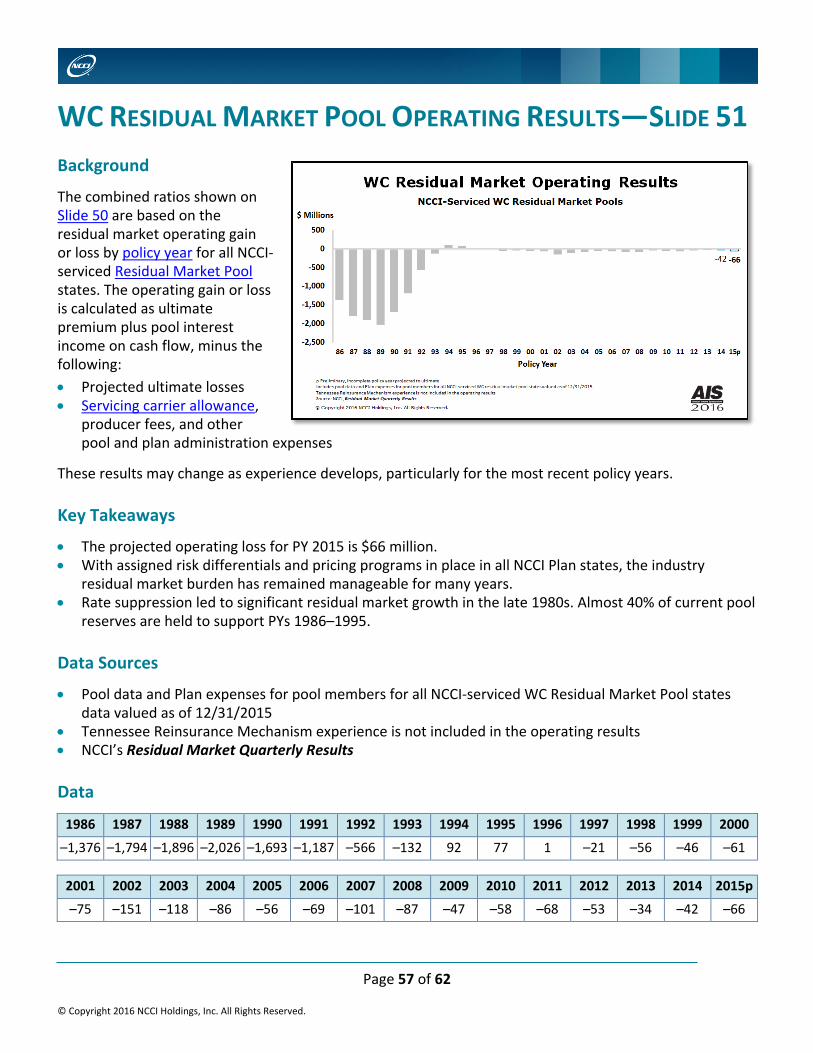
WC RESIDUAL MARKET POOL OPERATING RESULTS—SLIDE 51 Background
The combined ratios shown on Slide 50 are based on the residual market operating gain or loss by policy year for all NCCI-serviced Residual Market Pool states. The operating gain or loss is calculated as ultimate premium plus pool interest income on cash flow, minus the following: • Projected ultimate losses • Servicing carrier allowance,
producer fees, and other pool and plan administration expenses
These results may change as experience develops, particularly for the most recent policy years.
Key Takeaways
• The projected operating loss for PY 2015 is $66 million. • With assigned risk differentials and pricing programs in place in all NCCI Plan states, the industry
residual market burden has remained manageable for many years. • Rate suppression led to significant residual market growth in the late 1980s. Almost 40% of current pool
reserves are held to support PYs 1986–1995.
Data Sources
• Pool data and Plan expenses for pool members for all NCCI-serviced WC Residual Market Pool states data valued as of 12/31/2015
• Tennessee Reinsurance Mechanism experience is not included in the operating results • NCCI’s Residual Market Quarterly Results
Data
1986 1987 1988 1989 1990 1991 1992 1993 1994 1995 1996 1997 1998 1999 2000
–1,376 –1,794 –1,896 –2,026 –1,693 –1,187 –566 –132 92 77 1 –21 –56 –46 –61
2001 2002 2003 2004 2005 2006 2007 2008 2009 2010 2011 2012 2013 2014 2015p
–75 –151 –118 –86 –56 –69 –101 –87 –47 –58 –68 –53 –34 –42 –66
Page 57 of 62
© Copyright 2016 NCCI Holdings, Inc. All Rights Reserved.
2016 STATE OF THE LINE GUIDE
APPENDIX A—DEFINITIONS Accident Year (AY)—A loss accounting definition in which experience is summarized by the calendar year in which an accident occurred.
Adjusting and Other Expenses (AOE) Incurred—Loss adjustment expenses, other than those categorized as Defense and Cost Containment Expense. Examples: • Fees of adjusters and settling agents (but not if engaged in a contentious defense) • Attorney fees incurred in the determination of coverage, including litigation between the insurer and
the policyholder
Assigned Carrier—The insurer assigned to provide coverage to an eligible employer that has applied for workers compensation insurance under NCCI’s Workers Compensation Insurance Plan. An assigned carrier can be either a servicing carrier or direct assignment carrier.
Calendar Year (CY)—A method of accounting that includes all financial transactions occurring during a 12-month period, beginning January 1.
Carrier Discounting—Combined impact on premium due to rate/loss cost departures, schedule rating, and dividends.
Commissions and Brokerage Expenses Incurred—Fees paid to producers.
Defense and Cost Containment Expense (DCCE) Incurred—Expenses for defense by the insurer in contentious situations (whether a first-party or third-party claim) for litigation involving a claim and for cost containment expense. Examples: • Surveillance expenses • Fixed amounts for cost containment expenses • Case management expenses for the purpose of managing the overall cost of a claim • Litigation management expenses • Fees or salaries for appraisers, private investigators, hearing representatives, reinspectors, and fraud
investigators, if working in defense of a claim • Attorney fees incurred owing to a duty to defend • Cost of engaging experts
Direct Assignment—Assigned risk business written and serviced directly by an insurance company that has been authorized by the Insurance Department to write such business. These insureds are written without reinsurance through the National Workers Compensation Reinsurance Pooling Mechanism or other reinsurance pool.
Dividends to Policyholders—When actual costs and expenses are less than anticipated costs and expenses, carriers may opt to return the difference to policyholders in the form of a dividend.
Earned Premium—Proportional share of each policy’s written premium applicable to the expired part of the policy. Derived by subtracting the change in the unearned premium reserve from the written premium.
Page 58 of 62
© Copyright 2016 NCCI Holdings, Inc. All Rights Reserved.

2016 STATE OF THE LINE GUIDE
Estimated Annual Premium—Premium charged by an insurance company, at the time the policy is issued, for coverage provided by an insurance contract for a period of time. Estimated premium is reported before endorsements or audits.
Experience Mod—A factor calculated from actual case loss experience used to adjust an insured’s manual premiums (up or down) based on the insured’s loss experience relative to the average underlying the manual premiums. It compares the insured’s experience to the average class experience.
Exposure Accident Year (EAY): • Claims/Losses—Are on an accident year basis • Earned Premium—Final audited premium for each policy is allocated to the appropriate calendar year
based on the period of exposure
General Expenses Incurred—Overhead expenses incurred in the insurer’s operations, other than those included in the other expense categories. Examples: • Salaries • Rent and rent items • Equipment
Net Written Premium—The gross premium income adjusted for additional or return premiums, including any additions for reinsurance assumed and deductions for reinsurance ceded.
Other Acquisitions, Field Supervision, and Collection Expenses Incurred—Expenses incurred in obtaining insurance business. Examples: • Salaries • Equipment • Advertising • Employee relations and welfare • Allowance to managers and agents • Postage, telephone, and express • Rent and rent items
Policy Year (PY)—The year of the effective date of the policy. Policy year financial results summarize experience for all policies with effective dates in a given calendar year period.
Pure Premium—Portion of bureau level premium that provides for indemnity and medical loss payments.
Residual Market Pool—A financial agreement among participating insurers to share in the experience of certain assigned risks. This reduces both administrative costs and annual fluctuations in the liability of participating insurers resulting from the operation of state insurance plans.
Servicing Carrier—An insurer, other than a direct assignment carrier, authorized to receive Plan assignments and provide coverage to eligible employers on behalf of insurance company members of the National Workers Compensation Reinsurance Association NFP (NWCRA)—or participants in other reinsurance pooling mechanisms—incorporated as a part of the Plan in a state.
Servicing Carrier Allowance—The ceding commission retained by a servicing carrier as compensation for the expenses of servicing an employer under a Workers Compensation Insurance Plan or similar program.
Page 59 of 62
© Copyright 2016 NCCI Holdings, Inc. All Rights Reserved.

2016 STATE OF THE LINE GUIDE
Taxes, Licenses, and Fees Incurred—State taxes, assessments, and miscellaneous fees. Examples: • Premium taxes • Second Injury Fund assessments • General administration funds • Guaranty funds
Unearned Premium Reserve—Proportional share of each policy’s written premium applicable to the unexpired part of the policy.
Workers Compensation Insurance Plan (WCIP or Plan)—A program established and maintained by NCCI and approved by state insurance regulatory authorities whereby workers compensation insurance may be secured by eligible employers unable to secure such coverage in the voluntary market.
Page 60 of 62
© Copyright 2016 NCCI Holdings, Inc. All Rights Reserved.

2016 STATE OF THE LINE GUIDE
APPENDIX B—FORMULAS After-tax return on surplus = Net Income
Average Surplus
Average Surplus =
1 2 (Surplus as regards policyholders, December 31 current year
+ Surplus as regards policyholders, December 31 prior year)
Combined Ratio = Loss Ratio + LAE Ratio + Dividend Ratio + Underwriting Expense Ratio
Combined Ratio (Residual Market Slides) = LossesEarned Premium
+ Expenses and AllowancesWritten Premium
Dividend Ratio = Dividends to PolicyholdersPremiums Earned
Indicated Net Loss & LAE Reserves = Ultimate Net Loss & LAE – Net Loss & LAE Payments
Investment Gain on Insurance Transactions Ratio =
Investment Gain on Funds Attributable to Insurance Transactions + Other Income Less Other Expenses Premiums Earned
Investment Gain Ratio = Net Investment Gain (Loss)Premiums Earned
Loss Adjustment Expense (LAE) Ratio = DCCE Incurred + AOE IncurredPremiums Earned
Loss & LAE Ratio = Incurred Loss + DCCE Incurred + AOE IncurredPremiums Earned
Loss Ratio = Incurred LossPremiums Earned
Net Premium Earned = Net Premiums Written + Change in Unearned Premium Reserve
Net Reserve Deficiency = NCCI Indicated Net Loss & LAE Reserves – Private Carrier Net Loss & LAE Reserves As Reported
Premium-to-Surplus Ratio = Net Premiums Written Surplus as regards policyholders
Pretax Operating Gain = 1 – (Combined Ratio – Investment Gain on Insurance Transactions Ratio)
Page 61 of 62
© Copyright 2016 NCCI Holdings, Inc. All Rights Reserved.

2016 STATE OF THE LINE GUIDE
Underwriting Expense Ratio =
Commissions and Brokerage Expenses Incurred + Taxes, Licenses, and Fees Incurred + Other Acquisitions, Field Supervision and Collection Expenses Incurred + General Expenses Incurred Premiums Written
Page 62 of 62
© Copyright 2016 NCCI Holdings, Inc. All Rights Reserved.