maximizing capacity utilization - wordpress.com · plant was designed to service a certain ......
TRANSCRIPT

Maximizing Capacity Utilization
Pathways to Growth for Indian SMEs
CII – Valcon Session, Ludhiana
27th July, 2012
Anirban Mazumdar
Associate Director, Valcon India
2
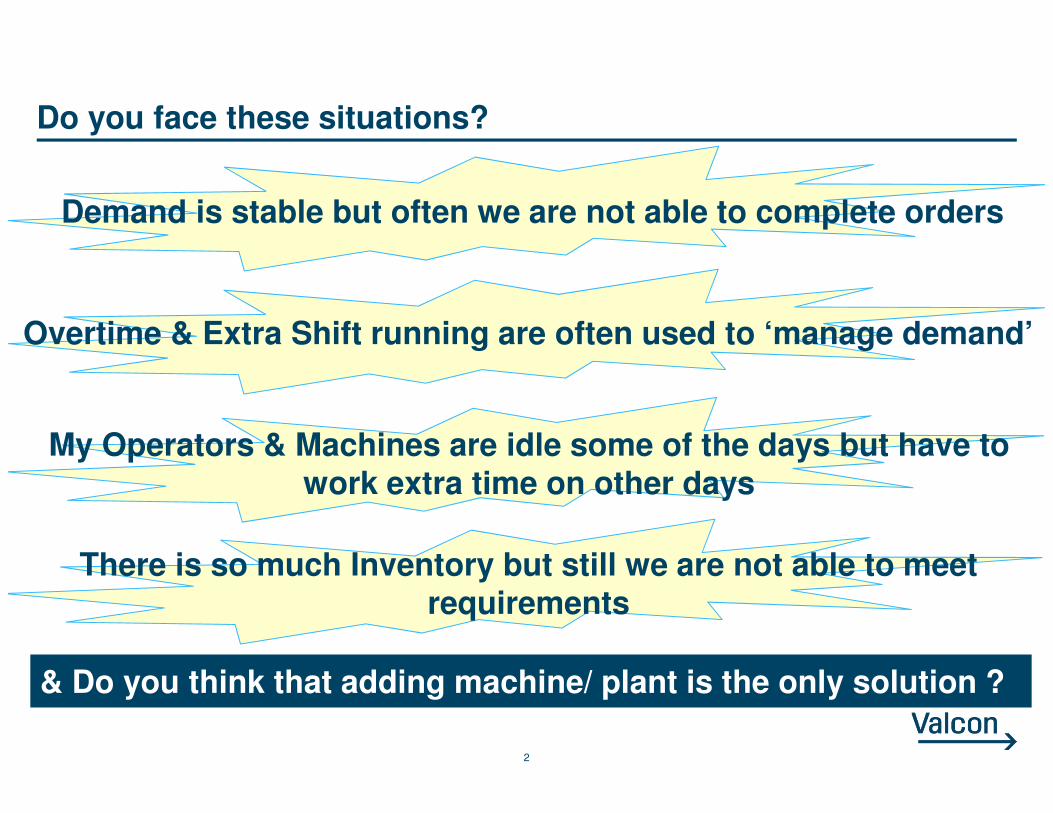
Do you face these situations?
& Do you think that adding machine/ plant is the only solution ?
Demand is stable but often we are not able to complete orders
Overtime & Extra Shift running are often used to ‘manage demand’
My Operators & Machines are idle some of the days but have to work extra time on other days
There is so much Inventory but still we are not able to meet requirements
3
Contents
Are You Utilizing Your Capacity Well?
How Can You Improve Capacity Utilization?
Case : Unearthing Hidden Capacity at Ancillary Unit

4
Focusing only on ‘servicing orders’ gradually leads to inappropriate capacity utilization
Manufacturer
Supplier
Supplier
Supplier
Plant was designed to service a certain demand at optimum utilization
• maximize output when demand is high
• finish plan early when demand dips

5
Focusing only on ‘servicing orders’ gradually leads to inappropriate capacity utilization
Manufacturer
Supplier
Supplier
Supplier
Plant was designed to service a certain demand at optimum utilization
• maximize output when demand is high
• finish plan early when demand dips
CustomerDistribution
DEMAND
DELIVERY
Even with change in demand pattern & fluctuations, working pattern doesn’t change.
Focus shifts to ‘meeting daily & month plans’ & We stop asking –
“Could we have produced more” or “Did we take too much time to complete the plan”
6
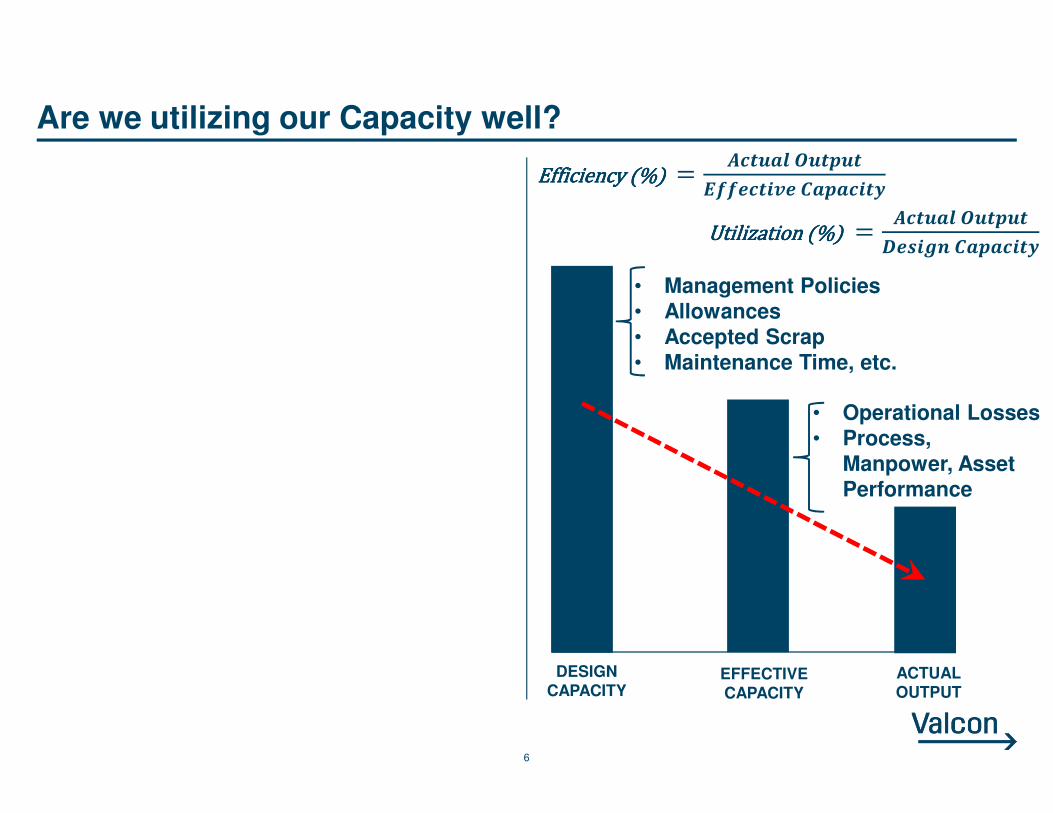
Are we utilizing our Capacity well?
DESIGN CAPACITY
EFFECTIVE CAPACITY
• Management Policies• Allowances• Accepted Scrap• Maintenance Time, etc.
ACTUAL OUTPUT
• Operational Losses• Process,
Manpower, Asset Performance
Efficiency (%) Efficiency (%) Efficiency (%) Efficiency (%) � ����� ������
��������� ��������
Utilization (%)Utilization (%)Utilization (%)Utilization (%) � ����� ������
"�#�$% ��������

7
Are we utilizing our Capacity well?
DESIGN CAPACITY
EFFECTIVE CAPACITY
• Management Policies• Allowances• Accepted Scrap• Maintenance Time, etc.
ACTUAL OUTPUT
• Operational Losses• Process,
Manpower, Asset Performance
Efficiency (%) Efficiency (%) Efficiency (%) Efficiency (%) � ����� ������
��������� ��������
Utilization (%)Utilization (%)Utilization (%)Utilization (%) � ����� ������
"�#�$% ��������
Medium & Small firms appear to be lagging in capacity utilization and need to take
measures to improve
Source : 77th Business Outlook Survey, CII
Mostly Large Sized Firms
Mostly Medium & Small Firms

8
So, How do we ‘lose Capacity’?
Policies & Standards
Bottleneck under-Utilization
Process under-Utilization
Capacity Imbalance
Capacity in-flexibility (Process, Operators & Plant)
1
2
3
4
5
9
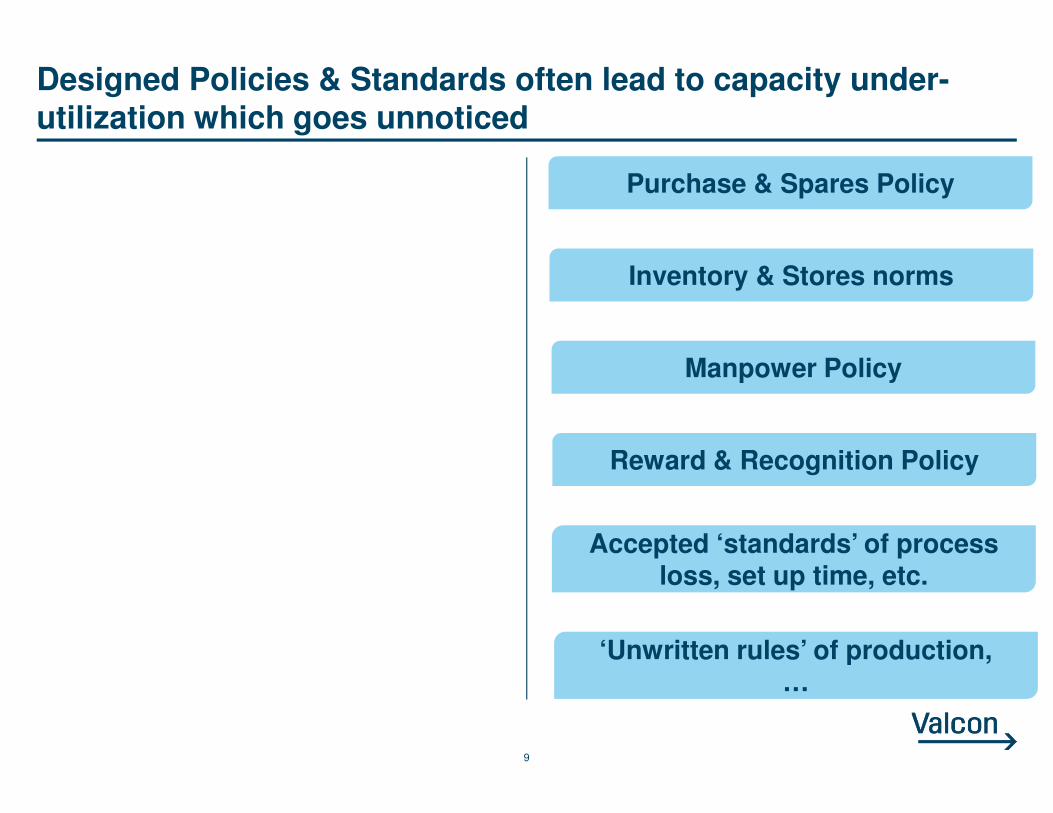
Designed Policies & Standards often lead to capacity under-utilization which goes unnoticed
Purchase & Spares Policy
Inventory & Stores norms
Manpower Policy
Reward & Recognition Policy
Accepted ‘standards’ of process loss, set up time, etc.
‘Unwritten rules’ of production,…
10
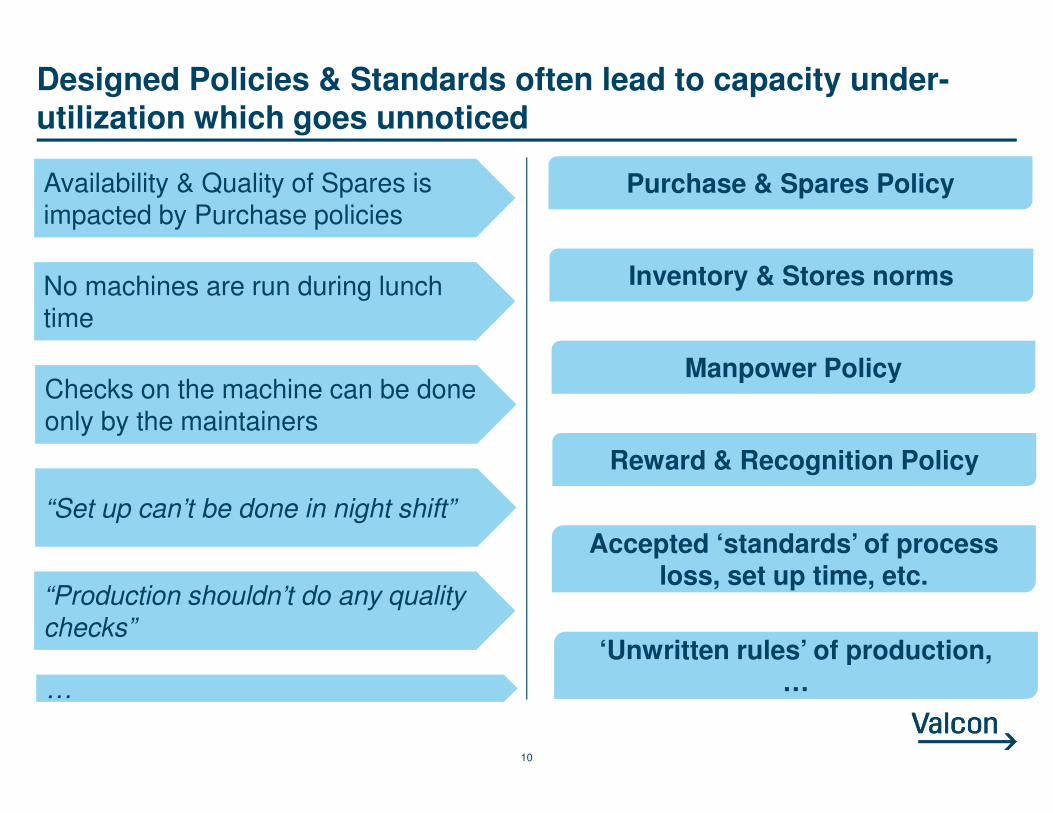
Designed Policies & Standards often lead to capacity under-utilization which goes unnoticed
Purchase & Spares Policy
Inventory & Stores norms
Manpower Policy
Reward & Recognition Policy
Accepted ‘standards’ of process loss, set up time, etc.
‘Unwritten rules’ of production,…
Availability & Quality of Spares is impacted by Purchase policies
No machines are run during lunch time
Checks on the machine can be done only by the maintainers
“Set up can’t be done in night shift”
“Production shouldn’t do any quality checks”
…

11
Identification & utilization of bottleneck resource is one of the biggest challenges to capacity release
3592838880
22162
77624
30580
20736
CNC
Machining
Tempering Sand
Blasting
Pre-setting Inspection Painting
Estimated Capacity (pcs)
Plant capacity can’t be more than the bottleneck’s capacity
12
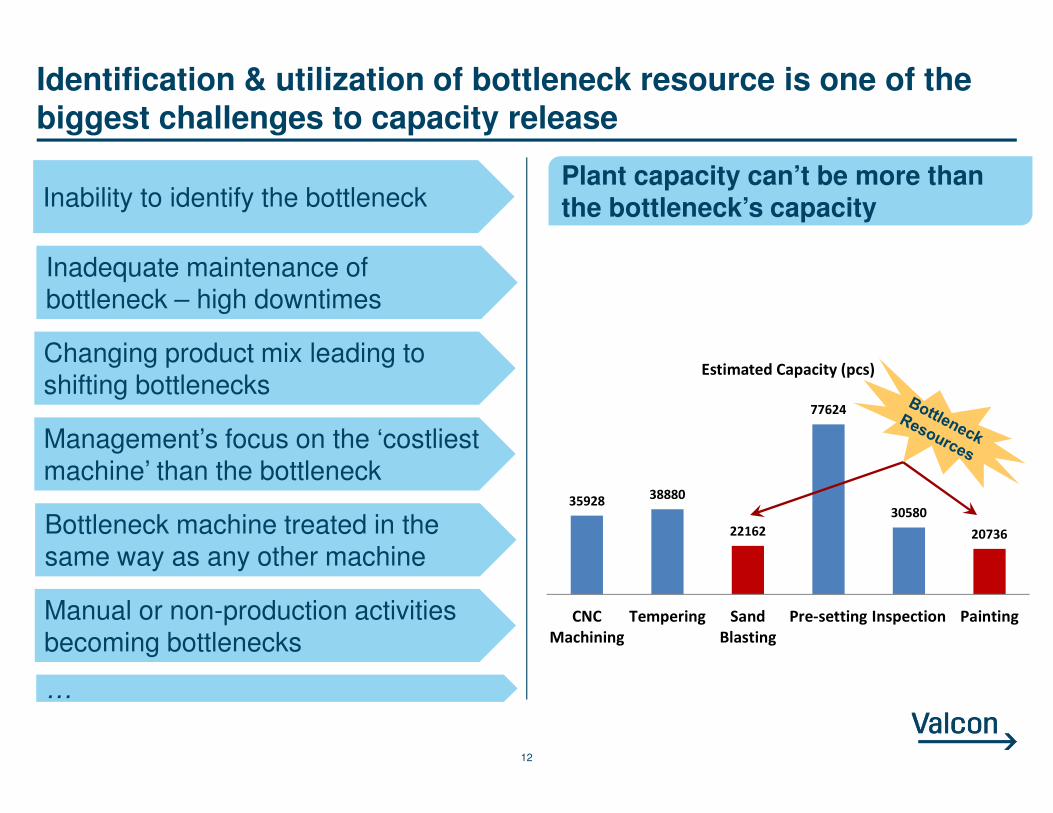
Identification & utilization of bottleneck resource is one of the biggest challenges to capacity release
3592838880
22162
77624
30580
20736
CNC
Machining
Tempering Sand
Blasting
Pre-setting Inspection Painting
Estimated Capacity (pcs)
Plant capacity can’t be more than the bottleneck’s capacityInability to identify the bottleneck
Changing product mix leading to shifting bottlenecks
Management’s focus on the ‘costliest machine’ than the bottleneck
Bottleneck machine treated in the same way as any other machine
Manual or non-production activities becoming bottlenecks
Inadequate maintenance of bottleneck – high downtimes
…
13
Contents
Are You Utilizing Your Capacity Well?
How Can You Improve Capacity Utilization?
Case : Unearthing Hidden Capacity at Ancillary Unit
14
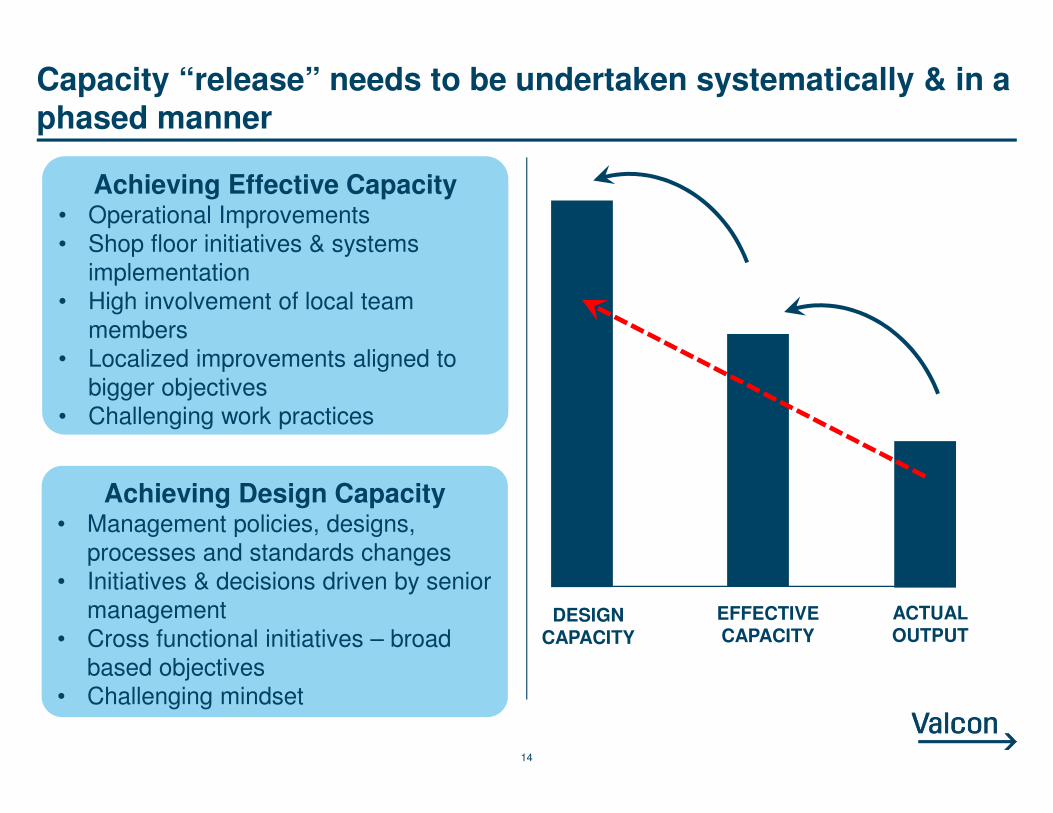
Capacity “release” needs to be undertaken systematically & in a phased manner
DESIGN CAPACITY
EFFECTIVE CAPACITY
ACTUAL OUTPUT
Achieving Effective Capacity• Operational Improvements
• Shop floor initiatives & systems
implementation
• High involvement of local team
members
• Localized improvements aligned to
bigger objectives
• Challenging work practices
Achieving Design Capacity• Management policies, designs,
processes and standards changes
• Initiatives & decisions driven by senior
management
• Cross functional initiatives – broad
based objectives
• Challenging mindset

15
Causes for losing Effective Capacity could lie across many areas in operations
Not Not Not Not ProducedProducedProducedProduced
Produced but Produced but Produced but Produced but lower outputlower outputlower outputlower output
Produced but Produced but Produced but Produced but couldn’t move outcouldn’t move outcouldn’t move outcouldn’t move out
Output Loss
No Plan Situation
No Material
No Manpower
Asset Downtime
Produced at Lower Rate
Rejected/ Reworked
Wrong Production
Flow Interruption

16
Multiple initiatives may be required to improve Capacity Utilization – the right ones need to be identified & prioritized
Output Loss
No Plan Situation
No Material
No Manpower
Asset Downtime
Produced at Lower Rate
Rejected/ Reworked
Wrong Production
Flow Interruption
Cycle Time Variations
Poor Skill Levels
Inadequate Maintenance
Poor Planning
Low Manpower Utilization
Productivity Variations
Line Imbalance
Flow Imbalance
Material Quality/ Delivery Failures
Low Equipment Capability
Inadequate Layout

17
Multiple initiatives may be required to improve Capacity Utilization – the right ones need to be identified & prioritized
Output Loss
No Plan Situation
No Material
No Manpower
Asset Downtime
Produced at Lower Rate
Rejected/ Reworked
Wrong Production
Flow Interruption
Cycle Time Variations
Poor Skill Levels
Inadequate Maintenance
Poor Planning
Low Manpower Utilization
Productivity Variations
Line Imbalance
Flow Imbalance
Material Quality/ Delivery Failures
Low Equipment Capability
Inadequate Layout
SUPPLIER DEVELOPMENT
PLANNING IMPROVEMENT
PLANNED MAINTENANCE
SKILL DEVELOPMENT
FLOW IMPROVEMENT
PRODUCTIVITY IMPROVEMENT
QUALITY IMPROVEMENT

18
SUPPLIER DEVELOPMENT
PLANNING IMPROVEMENT
PLANNED MAINTENANCE
SKILL DEVELOPMENT
FLOW IMPROVEMENT
PRODUCTIVITY IMPROVEMENT
QUALITY IMPROVEMENT
Supplier Performance improvement focuses on working closely with them to improve reliability
Supplier Quality
Supplier Delivery
Procure to Pay
Processes
Supplier Performance
• Equipment Capability• Process Stability• Quality Systems• Quality Audits
• Capacity Assessment• Planning & Scheduling
Systems• Flexibility
• Supporting Processes Adequacy
• Skill of People• Simplicity of Processes
19
SUPPLIER DEVELOPMENT
PLANNING IMPROVEMENT
PLANNED MAINTENANCE
SKILL DEVELOPMENT
FLOW IMPROVEMENT
PRODUCTIVITY IMPROVEMENT
QUALITY IMPROVEMENT
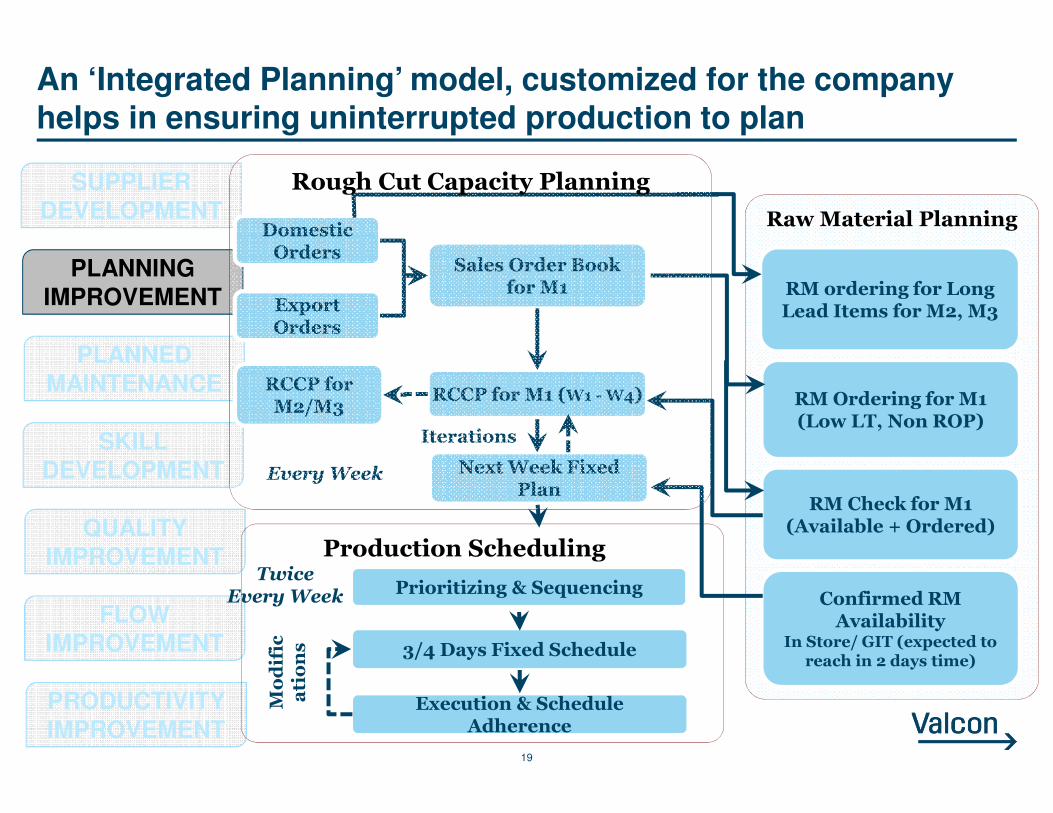
An ‘Integrated Planning’ model, customized for the companyhelps in ensuring uninterrupted production to plan
Raw Material Planning
Production Scheduling
Sales Order Book for M1
RCCP for M1 (W1 - W4)
RM ordering for Long Lead Items for M2, M3
RM Ordering for M1 (Low LT, Non ROP)
RM Check for M1 (Available + Ordered)
Next Week Fixed Plan
RCCP for M2/M3
Iterations
3/4 Days Fixed Schedule
Execution & Schedule Adherence
Execution & Schedule Adherence
Modific
ations
Confirmed RM Availability
In Store/ GIT (expected to reach in 2 days time)
Domestic Orders
Export Orders
Every Week
Twice Every Week Prioritizing & Sequencing
Rough Cut Capacity Planning

20
SUPPLIER DEVELOPMENT
PLANNING IMPROVEMENT
PLANNED MAINTENANCE
SKILL DEVELOPMENT
FLOW IMPROVEMENT
PRODUCTIVITY IMPROVEMENT
QUALITY IMPROVEMENT
A Planned Maintenance program implements maintenancesystems after equipment classification
Breakdown or Corrective maintenance
Routine maintenance
Preventive maintenance
Predictive maintenance
Improvement maintenance (proactive)
Most Critical Equipment
Critical Equipment
Non-criticalEquipment
Run to FailProactive
Maintenance
Reliability Centric
Maintenance

21
Flow Improvement would look at extended value stream and eliminate interruptions
Industrial Segment
Job Worker
OVERPRODUCTION
• Over planning to address poor yields
WAITINGINVENTORY
CORRECTION
• Many iterations in resorting• High rework on resorting• High inventory
WAITINGINVENTORY
CORRECTION
CONVEYANCE
• Multiple handling losses
• Deco Rework• High Inventory between
intermediate processes• Waiting for material
from plant
CORRECTIONCONVEYANCE
INVENTORY
CORRECTIONWAITING
• Many iterations in customer requirement
• Waiting periods for complete customer reqmt.
CORRECTIONWAITING • Mold Rework
• High Inventory• Waiting for complete mold information
• QA/ PDI rework• High material
movement within w/h• High Inventory
SUPPLIER DEVELOPMENT
PLANNING IMPROVEMENT
PLANNED MAINTENANCE
SKILL DEVELOPMENT
FLOW IMPROVEMENT
PRODUCTIVITY IMPROVEMENT
QUALITY IMPROVEMENT
22
Contents
Are You Utilizing Your Capacity Well?
How Can You Improve Capacity Utilization?
Case : Unearthing Hidden Capacity at Ancillary Unit
23
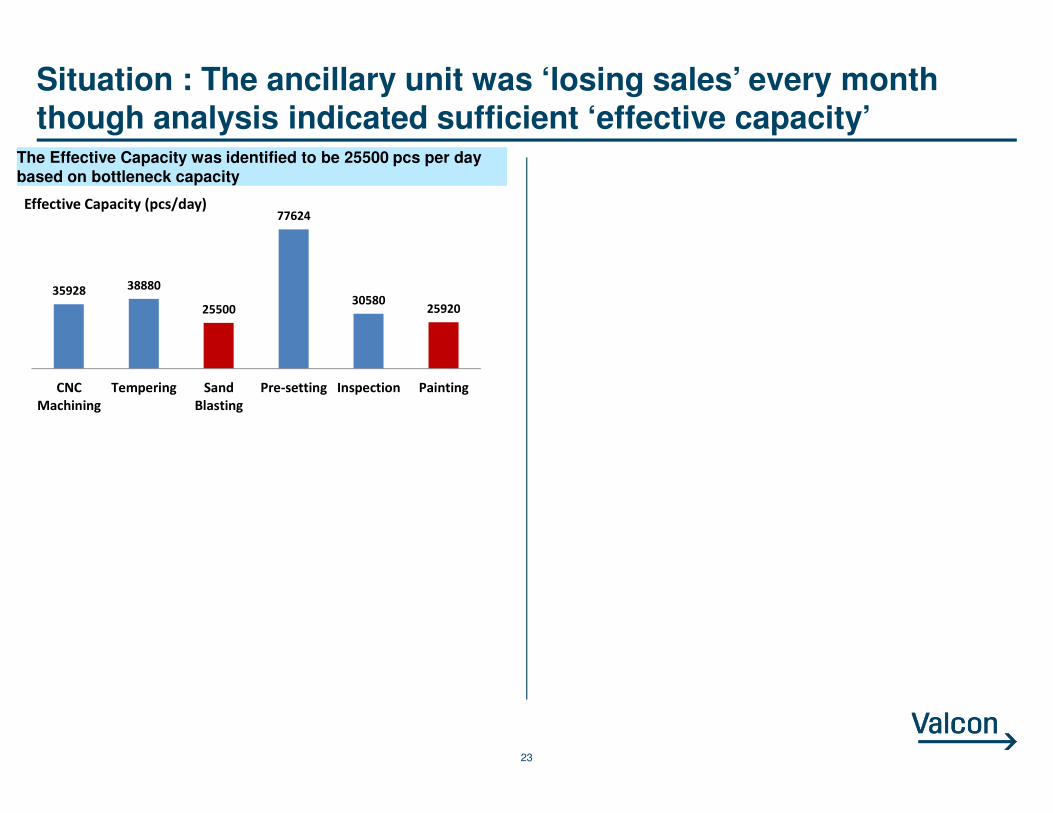
Situation : The ancillary unit was ‘losing sales’ every month though analysis indicated sufficient ‘effective capacity’
35928 38880
25500
77624
3058025920
CNC
Machining
Tempering Sand
Blasting
Pre-setting Inspection Painting
Effective Capacity (pcs/day)
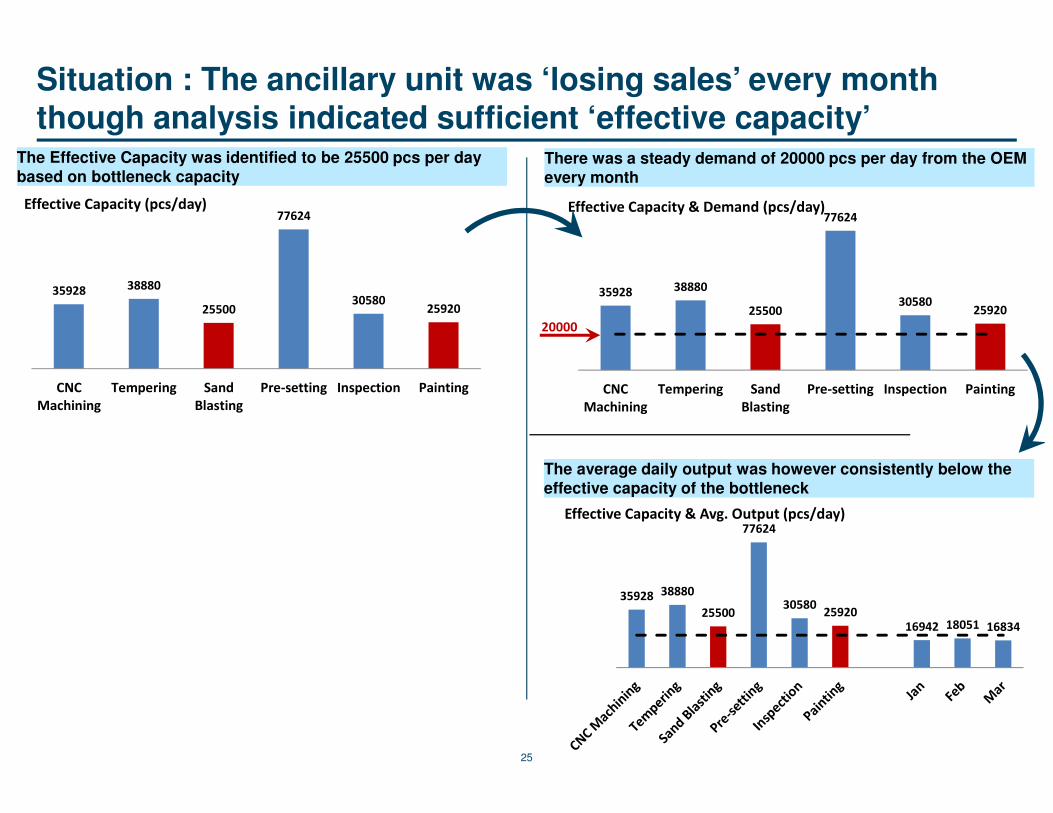
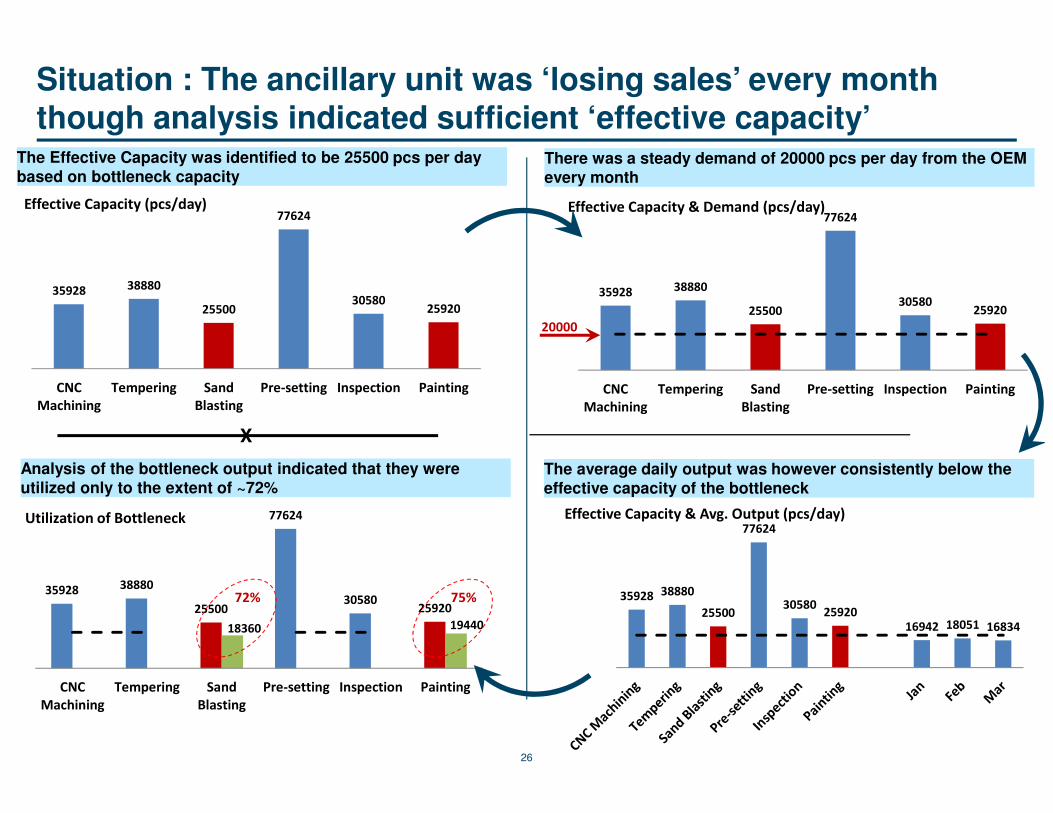
The Effective Capacity was identified to be 25500 pcs per day based on bottleneck capacity
24
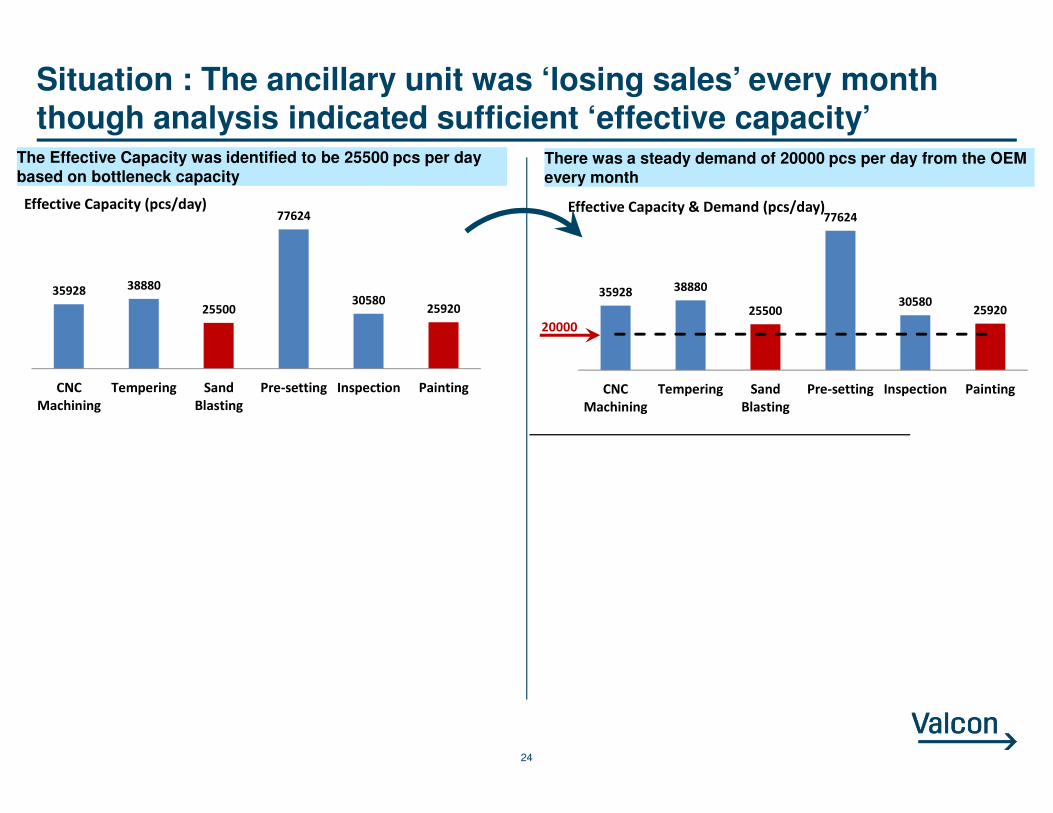
Situation : The ancillary unit was ‘losing sales’ every month though analysis indicated sufficient ‘effective capacity’
35928 38880
25500
77624
3058025920
CNC
Machining
Tempering Sand
Blasting
Pre-setting Inspection Painting
Effective Capacity (pcs/day)
The Effective Capacity was identified to be 25500 pcs per day based on bottleneck capacity
35928 38880
25500
77624
3058025920
CNC
Machining
Tempering Sand
Blasting
Pre-setting Inspection Painting
Effective Capacity & Demand (pcs/day)
20000
There was a steady demand of 20000 pcs per day from the OEM every month
25
Situation : The ancillary unit was ‘losing sales’ every month though analysis indicated sufficient ‘effective capacity’
35928 38880
25500
77624
3058025920
CNC
Machining
Tempering Sand
Blasting
Pre-setting Inspection Painting
Effective Capacity (pcs/day)
The Effective Capacity was identified to be 25500 pcs per day based on bottleneck capacity
35928 38880
25500
77624
3058025920
CNC
Machining
Tempering Sand
Blasting
Pre-setting Inspection Painting
Effective Capacity & Demand (pcs/day)
20000
There was a steady demand of 20000 pcs per day from the OEM every month
35928 38880
25500
77624
3058025920
16942 18051 16834
Effective Capacity & Avg. Output (pcs/day)
The average daily output was however consistently below the effective capacity of the bottleneck
26
Situation : The ancillary unit was ‘losing sales’ every month though analysis indicated sufficient ‘effective capacity’
35928 38880
25500
77624
3058025920
CNC
Machining
Tempering Sand
Blasting
Pre-setting Inspection Painting
Effective Capacity (pcs/day)
The Effective Capacity was identified to be 25500 pcs per day based on bottleneck capacity
35928 38880
25500
77624
3058025920
CNC
Machining
Tempering Sand
Blasting
Pre-setting Inspection Painting
Effective Capacity & Demand (pcs/day)
20000
There was a steady demand of 20000 pcs per day from the OEM every month
35928 38880
25500
77624
3058025920
16942 18051 16834
Effective Capacity & Avg. Output (pcs/day)
The average daily output was however consistently below the effective capacity of the bottleneck
35928 38880
25500
77624
3058025920
18360 19440
CNC
Machining
Tempering Sand
Blasting
Pre-setting Inspection Painting
Utilization of Bottleneck
Analysis of the bottleneck output indicated that they were utilized only to the extent of ~72%
72% 75%
X
27
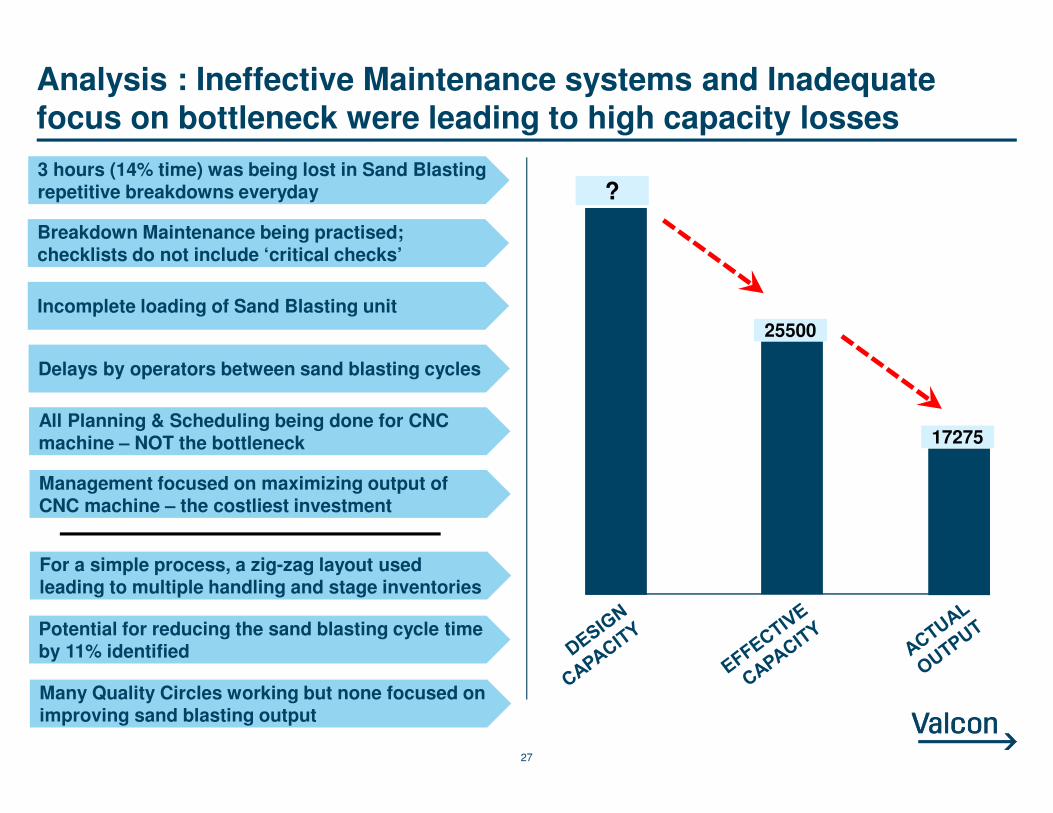
Analysis : Ineffective Maintenance systems and Inadequate focus on bottleneck were leading to high capacity losses
25500
17275
?3 hours (14% time) was being lost in Sand Blasting repetitive breakdowns everyday
Incomplete loading of Sand Blasting unit
Delays by operators between sand blasting cycles
Management focused on maximizing output of CNC machine – the costliest investment
Breakdown Maintenance being practised; checklists do not include ‘critical checks’
All Planning & Scheduling being done for CNC machine – NOT the bottleneck
Potential for reducing the sand blasting cycle time by 11% identified
For a simple process, a zig-zag layout used leading to multiple handling and stage inventories
Many Quality Circles working but none focused on improving sand blasting output
28
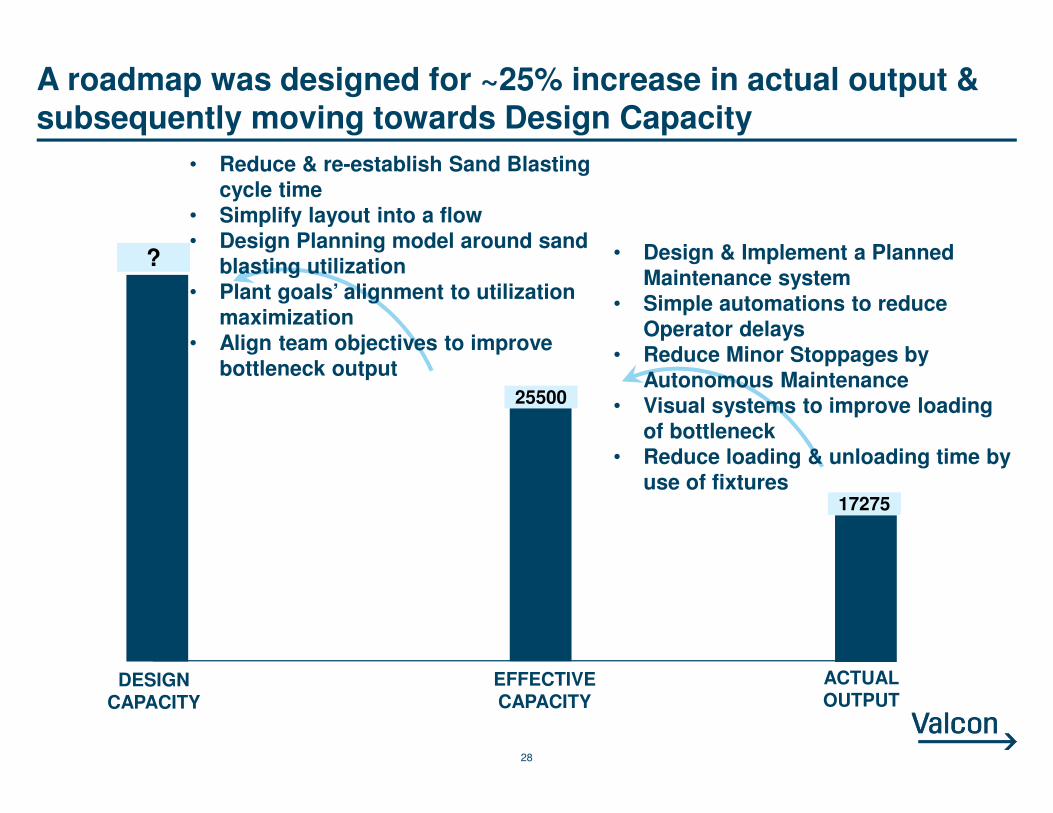
A roadmap was designed for ~25% increase in actual output & subsequently moving towards Design Capacity
EFFECTIVE CAPACITY
ACTUAL OUTPUT
25500
17275
• Design & Implement a Planned Maintenance system
• Simple automations to reduce Operator delays
• Reduce Minor Stoppages by Autonomous Maintenance
• Visual systems to improve loading of bottleneck
• Reduce loading & unloading time by use of fixtures
DESIGN CAPACITY
?
• Reduce & re-establish Sand Blasting cycle time
• Simplify layout into a flow• Design Planning model around sand
blasting utilization• Plant goals’ alignment to utilization
maximization• Align team objectives to improve
bottleneck output

Thank You