maximising returns from water in the australian vegetable industry: tasmania€¦ · ·...
TRANSCRIPT
Maximising returns from water in the Australian vegetable industry: Tasmania
David O’Donnell, Department of Primary Industries, Water and Environment, Tasmania
June 2006

This project is facilitated by Horticulture Australia Limited (HAL) in partnership with AUSVEG and is funded by the National Vegetable levy. The Australian Government provides matched funding for all HAL’s research and development activities.
Maximising returns from water in the Australian vegetable industry: Tasmania Author: David O’Donnell, Department of Primary Industries,Water and Environment
© State of New South Wales through NSW Department of Primary Industries 2006 First published June 2006 For updates to this publication, check http://www.dpi.nsw.gov.au
ISBN 0 7347 1722 9
This work is copyright. You may download, display, print and reproduce this material in an unaltered form only (retaining this notice) for your personal use or for non-commercial use within your organisation. To copy, adapt, publish, distribute or commercialise any of this publication you will need to seek permission from the Manager Publishing, NSW Department of Primary Industries, Orange, NSW. Disclaimer The information contained in this publication is based on knowledge and understanding at the time of writing (May 2006). However, because of advances in knowledge, users are reminded of the need to ensure that information upon which they rely is up to date and to check currency of the information with the appropriate officer of New South Wales Department of Primary Industries or the user‘s independent adviser.
jn6428

Co n t e n ts
ExEcutivE summary 1
Vegetable water use in Tasmania..............................................................................2
sEc tion 1 – vEgEtablE produc tion in tasmania 3
sEc tion 2 – irrigatEd vEgEtablE rEgions in tasmania 5
North and north-west vegetable-growing regions .................................................5 Central and Northern Midlands vegetable-growing regions ................................6 Crop areas and tonnage.............................................................................................7 Value of processed vegetables and exports .............................................................8
sEc tion 3 – WatEr usE in thE tasmanian vEgEtablE industry 9
Total water use and horticultural water use ...........................................................9 Water costs to farm boundary ............................................................................... 10 Gross returns $/ML ................................................................................................ 10 Gross margin $/ML ............................................................................................... 11 Irrigation and product quality............................................................................... 11 Employment in the vegetable industry................................................................. 14 Management of water resources............................................................................ 14 Benchmarks............................................................................................................. 16 Benchmark irrigation requirement ...................................................................... 17 Scheduling ............................................................................................................... 17
rEfErEncEs 19

figurEs
Figure 1 Statistical divisions of Tasmania ..................................................................5 Figure 2 Rainfall, Tasmania, Nov 2004 to October 2005..........................................7
tablEs
Table 1 Average monthly rainfall for the north coast and Midlands vegetable production regions............................................................................6
Table 2 Vegetable crops, area and tonnage, Tasmania, 2004/05
Table 8 Average daily evapotranspiration at north coast
...............................7 Table 3 Vegatable crops, farm gate, processed and export values, 2004/05 ............8 Table 4 Crop water requirement, yields and total water use ....................................9 Table 5 Crop yields and gross returns per megalitre, 2004/05 ...............................10 Table 6 Vegetable crops, gross margins per hectare and megalitre .......................11 Table 7 Irrigation licence type, reliability and costs................................................15
and Midland weather stations ........................................................................16 Table 9 Irrigation volumes for vegetable crops........................................................17

e x e C u t i v e s u m m a ry
e x e C u t i v e s um ma ry This report is one in a series on vegetable industry water use at state and national levels, and has been funded by Horticulture Australia Ltd (HAL) and AUSVEG. This series outlines how water is used in the major vegetable production regions in Australia, and details the current irrigation practices, water use efficiencies and economics of the vegetable-growing industries in each state. The vegetable sector is the largest segment of the horticultural industry in Australia. The most recent ABS survey (2000/01) revealed the vegetable industry had a gross value of around $ 2.1 billion, derived from some 2.9 million tonnes of produce. Export value of Australian fresh and processed vegetable products in 2004/05 was in excess of $192 million. The major crop types were potatoes (1.2 million tonnes from 36 800 ha), tomatoes (414 000 tonnes from 8300 ha), carrots (283 000 tonnes from 7000 ha) and onions (247 000 tonnes from 5300 ha). The 2000/01 ABS survey reported 5300 vegetable establishments (with estimated value of agricultural operations worth $5000 or more) Australia-wide, directly employing 15621 people. These farms were typically run by single unit farming families who specialise in vegetable production. Average farm size is about 25 hectares, from which produce worth $230 000 per annum at first point of sale is generated. Water is an essential input to sustainable vegetable production. The ABS report Water use on Australian farms 2003–04 (ABS 2005b) stated that, in 2003/04, the vegetable industry accounted for 477 136 megalitres (ML) or just 4.6% of the total water used for irrigation. The report also estimated that average water use per hectare was 4.1 ML/ha, compared with the estimated overall application rate for water across all crops of 4.3 ML/ha. The value return from vegetable production per megalitre increased from $1762/ML in 1996/97 to $3207/ML in 2000/01 (ABS 2002b). The rate of irrigation technology improvements in the vegetable industry since the mid1990s has been significant, and has come at a time of increased publicly funded incentive programs (such as WaterWise on the Farm, in NSW and the Rural Water Use Efficiency program in Queensland) for improving irrigation efficiency on-farm. This series of reports details the investment made in technology to ensure maximum output and product quality from every megalitre used in vegetable production and processing. The productivity increases achieved by the vegetable industry can be largely attributed to the increased use of water-efficient delivery systems such as drip irrigation, increased use of recycling on-farm, wide scale adoption of irrigation scheduling and soil moisture monitoring and increased use of whole farm planning and soil mapping. Although more difficult to measure, some part of that increase in product value and quality is most likely to be the direct result of improved irrigation practices.
Maximising returns from water in the Australian vegetable industr y: Tasmania p �

e x e C u t i v e s u m ma ry
v e g e ta b l e wat e r u s e i n ta s ma n i a Vegetables, and the associated crops pyrethrum and poppies, account for approximately 40,000 hectares of high value irrigated production in Tasmania. The vast majority of vegetable production is irrigation-dependent, as typical rainfall during the summer production season is in the vicinity of 350 mm, whilst evaporative losses are around 900 mm. Total farm gate value of vegetable and associated crops was just over $200 million in season 2004/05. This production is based upon an estimated water use of 90,000 megalitres. The water volume required to irrigate summer vegetable crops ranges from 2.5 to 5.5 ML per hectare and the net economic return from each megalitre of water used typically ranges from $700 to $1200 per megalitre. Direct employment associated with irrigated vegetable farming and product processing in Tasmania in season 2004/05 was 3900 full-time equivalent positions. Water management and irrigation efficiency is central to the Tasmanian vegetable industry’s sustainable development. The most significant recent changes in water use and irrigation include:
• investment in farm storage dams and large regional dam development • irrigation systems change and upgrade, particularly increased intensity of irrigation,
increased scale of irrigation systems and expansion into traditional dryland areas • industry adjustment to compulsory metered water use and compliance with licence
volumes legislated under the Tasmanian Water Management Act 1999.
p � Maximising returns from water in the Australian vegetable industr y: Tasmania

s e C t i o n � – v e g e ta b l e p r o d u C t i o n i n ta s m a n i as e C t i o n � – v e g e ta b l e p r o d u C t i o n i n ta s ma n i a
s e C t i o n � – v e g e ta b l e p r o d u C t i o n i n ta s ma n i a Vegetable production in Tasmania occurs predominantly on the red clay loam soils of volcanic origin on the coastal fringe of the north coast. The irrigation industry expanded enormously in the 1970s with the uptake of travelling gun irrigators. Since the late 1990s, rapid industry conversion to centre pivot and linear move irrigation has occurred: these systems now irrigate an area of over 19 000 hectares. The total volume of water licensed for use in agriculture has increased by over 50% in the past five years from 250 000 ML in 1999 to 378 000 ML in 2004. Increased water availability has been enabled primarily through the approval and development of on-farm storage dams. Uptake of irrigation management technology is higher in Tasmania than in most Australian states, according to Australian Bureau of Statistics Water use on Australian farms survey 2002/03. Investment in efficient irrigation systems and scheduling tools is likely to be driven by high land value and high crop value. Prime irrigated agricultural land is typically valued at between $8000 and $12 000 per hectare and gross margins of crops such as potatoes, poppies, carrots and onions range from $3500 to $7000 per hectare. A network of agronomic advisers and industry field officers is well established in the vegetable industry and is a mechanism that encourages and supports grower uptake of newer irrigation technologies. Processing potatoes are the crop of highest farm gate value, $89 million in the season 2004/05. Processing potatoes are contracted to the companies Simplot and McCain who, until the current season, have supplied the vast majority of the national french fry market and 100% of supply to McDonalds Australia. Contracts for 20 000 tonnes have been lost to New Zealand in this current season. This market loss has heightened the industry’s focus upon productive, cost-efficient irrigated production. The farm gate value of poppies is a similar magnitude to that of processing potatoes. It has varied from $100 million to $50 million in recent seasons. All poppies are grown under irrigation and contracted to the companies GlaxoSmithKline and Tasmanian Alkaloids. Poppy production is intensive and irrigation-dependent. The Tasmanian industry is the largest producer and exporter of licit opiates in the world. Peas, beans and brassicas grown for processing account for about 30% of the vegetable production area, return about 15% of farm gate value and account for about 20% of the consumptive water use of the vegetable industries.
Tasmania’s carrot crops are typically grown on high value irrigated agricultural land.
Maximising returns from water in the Australian vegetable industr y: Tasmania Maximising returns from water in the Australian vegetable industr y: Tasmania p �p �

s e C t i o n � – v e g e ta b l e p r o d u C t i o n i n ta s ma n i a
Onions and carrots, grown and packed for Australian mainland and international export markets, account for about 15% of water used for vegetable irrigation. Six hundred vegetable farms are estimated to use just under 40% of water allocated to agriculture in Tasmania. The dairy industry utilises a similar volume on 500 farms and the remainder is used primarily in perennial horticultural crops such as fruit, nuts, berries and viticulture. The vegetable sector directly employs over 1800 full-time equivalent positions on farms and over 2100 full-time equivalent positions in processing, packing and services to the agriculture sector. Research, development and extension priorities in Tasmania are reviewed annually by the Agricultural Research and Advisory Committee (ARAC). With recent losses of market share to imported products it has become increasingly clear that the industry needs to achieve high levels of productivity and minimise input costs to be cost-competitive in a world market. Two areas of underpinning research and extension identified are:
• irrigation efficiency training and demonstration, particularly skill training to manage ‘new’ types of irrigation systems, scheduling tools and crop–soil management on a wider range of soil types than traditionally irrigated in Tasmania
• clear economic drivers to support improved irrigation management: published benchmarks of economic return per megalitre relevant to the main vegetable crops and clear demonstration of potential to improve return per megalitre applied.
p � Maximising returns from water in the Australian vegetable industr y: Tasmania

s e C t i o n � – i r r i g at e d v e g e ta b l e r e g i o n s i n ta s ma n i a
s e C t i o n � – i r r i g at e d v e g e ta b l e r e g i o n s i n ta s ma n i a
Three Australian Bureau of Statistics (ABS) statistical divisions (Mersey–Lyell; Northern; and Southern) accurately reflect the key irrigated vegetable production areas in Tasmania. TASMANIA, Stat i s t i ca l Div is ions
Figure 1 – Statistical divisions of Tasmania A B S • A U S T R A L I A N ST A N D A R D GE O G R A P H I C A L C L A S S I F I C A T I O N ( A S G C ) • 1 2 1 6 . 0 • 2 0 0 5 18 5
n o rt h a n d n o rt h - w e s t v e g e ta b l e - g r ow i n g r e g i o n s The traditional main centre of vegetable production falls within the ‘Mersey–Lyell’ and ‘Northern’ regions. In this report, and in local industry data collected by the Department of Primary Industries, Water and Environment (DPIWE) and vegetable processors and packers, these two regions are commonly combined and referred to as the ‘North and north-west coast’. Crop production, processing and packing moves across these two regions without any obvious geographical or production differences at the regional boundary.
Maximising returns from water in the Australian vegetable industr y: Tasmania p �

s e C t i o n � – i r r i g at e d v e g e ta b l e r e g i o n s i n ta s ma n i a
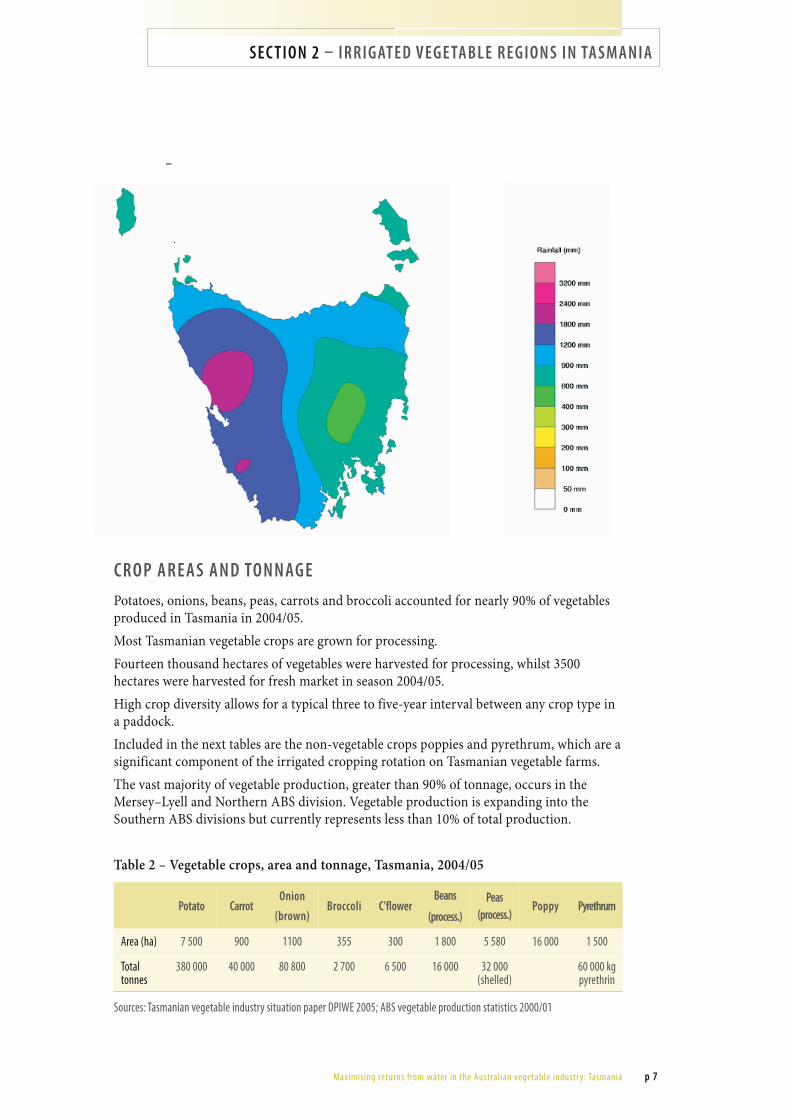
The Mersey–Lyell and Northern districts are highly fertile coastal cropping land with significant areas of deep, well-drained red volcanic clay/loam soils and typical annual rainfall of 900 to 1200 mm. The vast majority of vegetable production occurs between October and March, when average rainfall in the northern region is 345 mm and evapotranspiration is 910 mm. Clearly vegetable cropping throughout this period is irrigation-dependent. In crops such as poppies, potatoes, carrots and brassicas, 40 mm to 50 mm of irrigation replacement per week is the figure used for planning the expected irrigation supply requirement.
C e n t r a l a n d n o rt h e r n m i d l a n d s v e g e ta b l e - g r ow i n g r e g i o n s The Southern district is commonly referred to as the ‘Central and Northern Midlands’ area. Crop rootzone depth in this area is typically limited because of duplex soil types: light sandy loams overlying heavy subsoil clays. Traditionally a dryland sheep and grain production area, this area has had a rapid uptake of irrigation, particularly centre pivots, within the last decade. Centre pivot irrigation systems, which better meet the requirement of frequent low volume irrigation, are better suited to the Midlands region than the weekly high volume irrigation typical of the more traditional travelling gun irrigation systems. Reliable irrigation is even more critical to Midlands vegetable production as evapotranspiration is higher and rainfall significantly lower than on the north coast.
Table 1 – Average monthly rainfall for the north coast and Midlands vegetable production regions
rainfall (mm)
MONTH north coast (mersey–lyell & northern abs regions)
midlands (southern abs region)
January 46 28
February 18 16
March 31 23
April 63 52
May 58 36
June 130 96
July 113 85
August 110 66
September 90 83
October 46 39
November 46 41
December 49 21
Annual total 800 590
* 3 year average rainfall recorded at DPIWE Forthside (Northern) and Cressy (midlands) weather stations 2002–04
p � Maximising returns from water in the Australian vegetable industr y: Tasmania
s e C t i o n � – i r r i g at e d v e g e ta b l e r e g i o n s i n ta s m a n i a
–
C r o p a r e a s a n d to n n ag e Potatoes, onions, beans, peas, carrots and broccoli accounted for nearly 90% of vegetables produced in Tasmania in 2004/05. Most Tasmanian vegetable crops are grown for processing. Fourteen thousand hectares of vegetables were harvested for processing, whilst 3500 hectares were harvested for fresh market in season 2004/05. High crop diversity allows for a typical three to five-year interval between any crop type in a paddock. Included in the next tables are the non-vegetable crops poppies and pyrethrum, which are a significant component of the irrigated cropping rotation on Tasmanian vegetable farms. The vast majority of vegetable production, greater than 90% of tonnage, occurs in the Mersey–Lyell and Northern ABS division. Vegetable production is expanding into the Southern ABS divisions but currently represents less than 10% of total production.
Table 2 – Vegetable crops, area and tonnage, Tasmania, 2004/05
potato Carrot onion
(brown) broccoli C’flower
beans
(process.) peas
(process.) poppy pyrethrum
Area (ha) 7 500 900 1100 355 300 1 800 5 580 16 000 1 500
Total tonnes
380 000 40 000 80 800 2 700 6 500 16 000 32 000 (shelled)
60 000 kg pyrethrin
Sources: Tasmanian vegetable industry situation paper DPIWE 2005; ABS vegetable production statistics 2000/01
Maximising returns from water in the Australian vegetable industr y: Tasmania p �
s e C t i o n � – i r r i g at e d v e g e ta b l e r e g i o n s i n ta s ma n i a
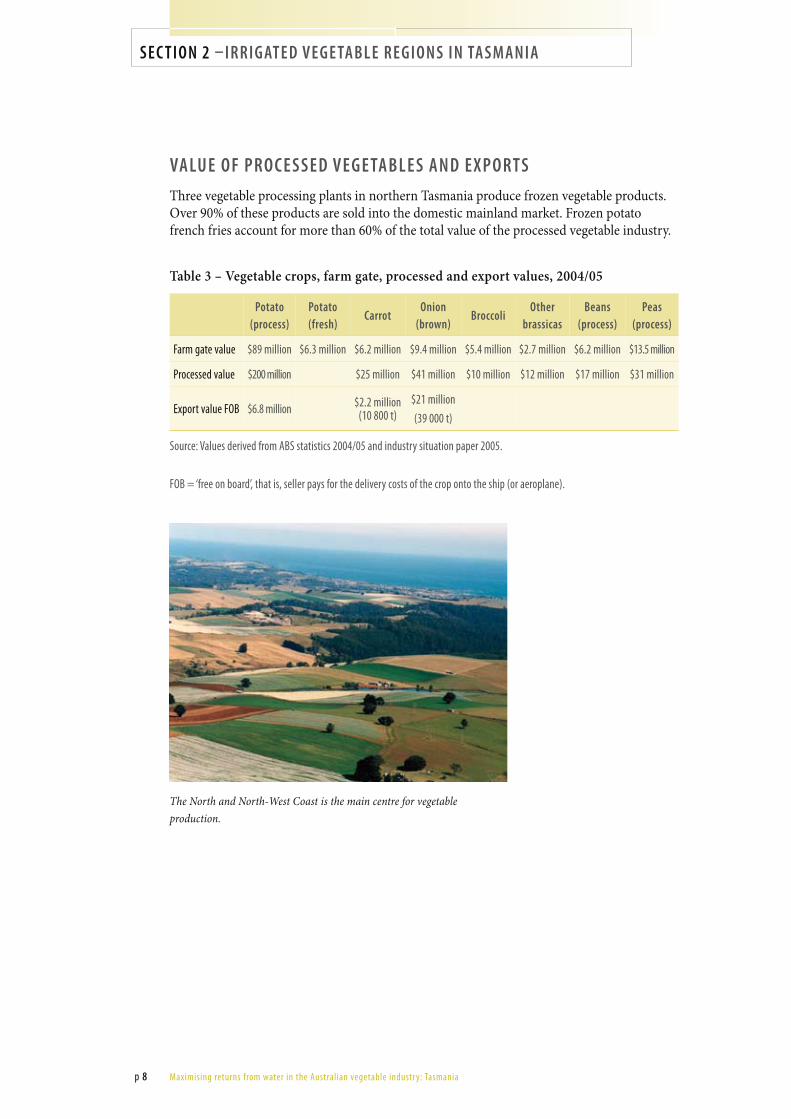
va lu e o f p r o C e s s e d v e g e ta b l e s a n d e x p o rts Three vegetable processing plants in northern Tasmania produce frozen vegetable products. Over 90% of these products are sold into the domestic mainland market. Frozen potato french fries account for more than 60% of the total value of the processed vegetable industry.
Table 3 – Vegetable crops, farm gate, processed and export values, 2004/05
potato (process)
potato (fresh)
Carrot onion
(brown) broccoli
other brassicas
beans (process)
peas (process)
Farm gate value $89 million $6.3 million $6.2 million $9.4 million $5.4 million $2.7 million $6.2 million $13.5 million
Processed value $200 million $25 million $41 million $10 million $12 million $17 million $31 million
Export value FOB $6.8 million $2.2 million (10 800 t)
$21 million (39 000 t)
Source: Values derived from ABS statistics 2004/05 and industry situation paper 2005.
FOB = ‘free on board’, that is, seller pays for the delivery costs of the crop onto the ship (or aeroplane).
The North and North-West Coast is the main centre for vegetable production.
p � Maximising returns from water in the Australian vegetable industr y: Tasmania
s e C t i o n � – wat e r u s e i n t h e ta s m a n i a n v e g e ta b l e i n d u s t ry
s e C t i o n � – wat e r u s e i n t h e ta s ma n i a n v e g e ta b l e i n d u s t ry
tota l wat e r u s e a n d h o rt i C u lt u r a l wat e r u s e Water allocations are licensed to over 1300 farms in Tasmania; approximately 600 of these farms produce predominantly vegetables. The volume of total allocated water entitlements in the state sums to 378 000 ML. It is estimated that total licensed volume in 1999 was 250 000 ML, and this has increased significantly due to dam permit approval and greatly increased farm storage capacity. Water allocations are primarily for winter river extraction into storage and direct summer river extraction during the months of December to April. It is estimated that state agricultural water use is fairly evenly split between irrigated dairy production and intensive horticulture (including vegetables, perennial fruit and viticulture). Metered river extraction has only commenced since the implementation of the Water Management Act 1999. Until a significant proportion of licences are metered, crop water use can only be extrapolated from contracted crop areas and expected crop irrigation requirement. This calculation results in an estimation of 90 000 ML of irrigation applied to vegetable, poppy and pyrethrum crops in the 2004/05 season. Absolute values are now being collected by the DPIWE Water Use Sustainability project on a catchment-bycatchment basis.
Table 4 – Crop water requirement, yields and total water use
typical irrigation requirement (ml/ha)
average yield per ha (tonnes)
av. yield per ml (tonnes)
estimated total water use/crop (ml)
Potato (process.) 4–5 60 12 30 000
Carrot 3–5 90 22 4 000
Onion 3.5–4 50 12 6 000
Broccoli 2–3 12 4 2 000
Cauliflower 2–3 20 7 1 500
Beans (process.) 1.5–2.5 9 4.5 5 000
Peas (process.) 1–2 6 4 9 000
Poppy 1.5–2.5 - - 25 000
Pyrethrum 1–2 - - 3 000
Sources: Wise Watering: irrigation management course 2001 (Davey & Maynard 2001); Cash crop enterprise budgets 2002/03 (DPIWE 2002); Vegetable industry situation paper (DPIWE 2005).
Maximising returns from water in the Australian vegetable industr y: Tasmania p �
s e C t i o n � – wat e r u s e i n t h e ta s m a n i a n v e g e ta b l e i n d u s t ry
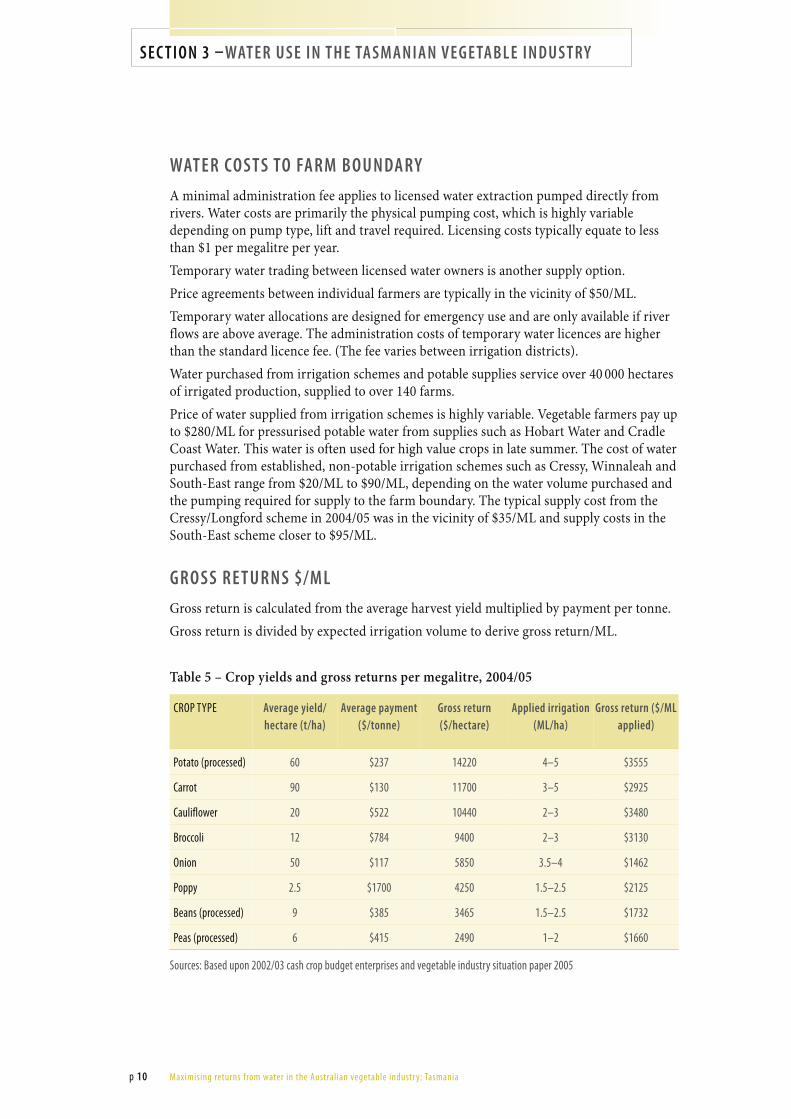
wat e r Co s ts to fa r m b o u n da ry A minimal administration fee applies to licensed water extraction pumped directly from rivers. Water costs are primarily the physical pumping cost, which is highly variable depending on pump type, lift and travel required. Licensing costs typically equate to less than $1 per megalitre per year. Temporary water trading between licensed water owners is another supply option. Price agreements between individual farmers are typically in the vicinity of $50/ML. Temporary water allocations are designed for emergency use and are only available if river flows are above average. The administration costs of temporary water licences are higher than the standard licence fee. (The fee varies between irrigation districts). Water purchased from irrigation schemes and potable supplies service over 40 000 hectares of irrigated production, supplied to over 140 farms. Price of water supplied from irrigation schemes is highly variable. Vegetable farmers pay up to $280/ML for pressurised potable water from supplies such as Hobart Water and Cradle Coast Water. This water is often used for high value crops in late summer. The cost of water purchased from established, non-potable irrigation schemes such as Cressy, Winnaleah and South-East range from $20/ML to $90/ML, depending on the water volume purchased and the pumping required for supply to the farm boundary. The typical supply cost from the Cressy/Longford scheme in 2004/05 was in the vicinity of $35/ML and supply costs in the South-East scheme closer to $95/ML.
g r o s s r e t u r n s $/m l Gross return is calculated from the average harvest yield multiplied by payment per tonne. Gross return is divided by expected irrigation volume to derive gross return/ML.
Table 5 – Crop yields and gross returns per megalitre, 2004/05
CrOP TyPE average yield/ hectare (t/ha)
average payment ($/tonne)
gross return ($/hectare)
applied irrigation (ml/ha)
gross return ($/ml applied)
Potato (processed) 60 $237 14220 4–5 $3555
Carrot 90 $130 11700 3–5 $2925
Cauliflower 20 $522 10440 2–3 $3480
Broccoli 12 $784 9400 2–3 $3130
Onion 50 $117 5850 3.5–4 $1462
Poppy 2.5 $1700 4250 1.5–2.5 $2125
Beans (processed) 9 $385 3465 1.5–2.5 $1732
Peas (processed) 6 $415 2490 1–2 $1660
Sources: Based upon 2002/03 cash crop budget enterprises and vegetable industry situation paper 2005
p �0 Maximising returns from water in the Australian vegetable industr y: Tasmania
s e C t i o n � – wat e r u s e i n t h e ta s m a n i a n v e g e ta b l e i n d u s t ry
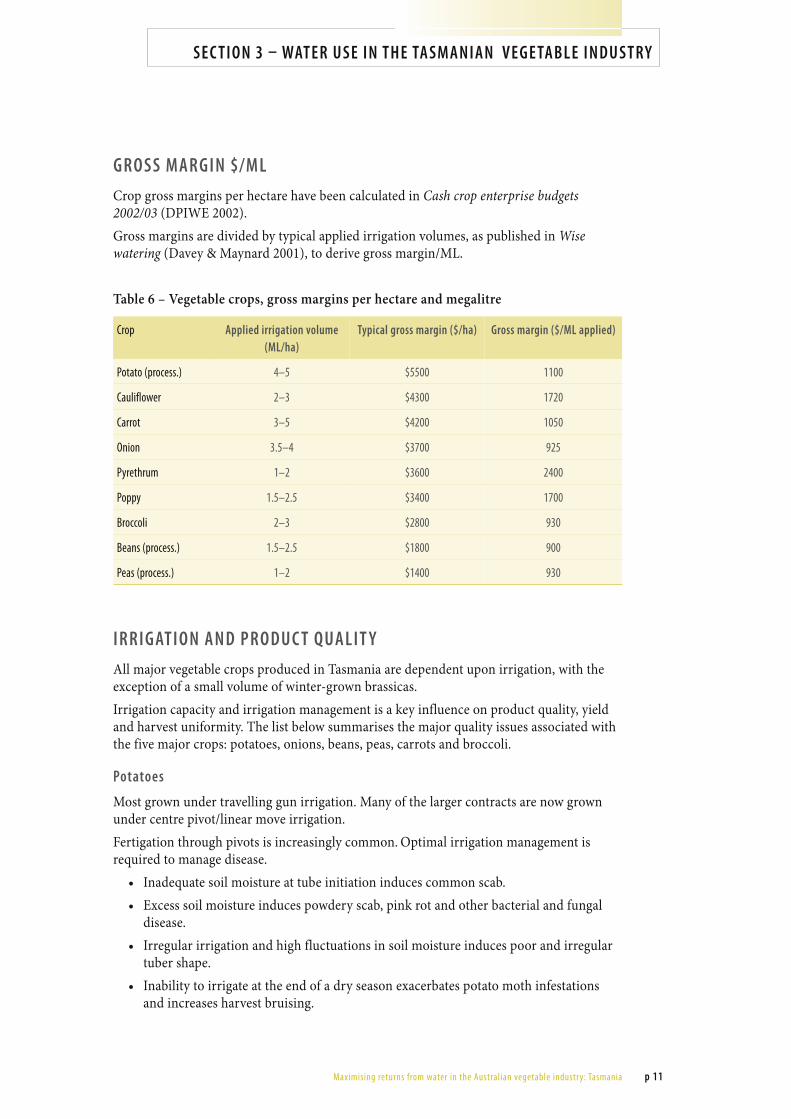
g r o s s ma r g i n $/m l Crop gross margins per hectare have been calculated in Cash crop enterprise budgets 2002/03 (DPIWE 2002). Gross margins are divided by typical applied irrigation volumes, as published in Wise watering (Davey & Maynard 2001), to derive gross margin/ML.
Table 6 – Vegetable crops, gross margins per hectare and megalitre
Crop applied irrigation volume (ml/ha)
typical gross margin ($/ha) gross margin ($/ml applied)
Potato (process.) 4–5 $5500 1100
Cauliflower 2–3 $4300 1720
Carrot 3–5 $4200 1050
Onion 3.5–4 $3700 925
Pyrethrum 1–2 $3600 2400
Poppy 1.5–2.5 $3400 1700
Broccoli 2–3 $2800 930
Beans (process.) 1.5–2.5 $1800 900
Peas (process.) 1–2 $1400 930
i r r i g at i o n a n d p r o d u C t q ua l i t y All major vegetable crops produced in Tasmania are dependent upon irrigation, with the exception of a small volume of winter-grown brassicas. Irrigation capacity and irrigation management is a key influence on product quality, yield and harvest uniformity. The list below summarises the major quality issues associated with the five major crops: potatoes, onions, beans, peas, carrots and broccoli.
potatoes
Most grown under travelling gun irrigation. Many of the larger contracts are now grown under centre pivot/linear move irrigation. Fertigation through pivots is increasingly common. Optimal irrigation management is required to manage disease.
• Inadequate soil moisture at tube initiation induces common scab. • Excess soil moisture induces powdery scab, pink rot and other bacterial and fungal
disease. • Irregular irrigation and high fluctuations in soil moisture induces poor and irregular
tuber shape. • Inability to irrigate at the end of a dry season exacerbates potato moth infestations
and increases harvest bruising.
Maximising returns from water in the Australian vegetable industr y: Tasmania p ��

s e C t i o n � – wat e r u s e i n t h e ta s m a n i a n v e g e ta b l e i n d u s t ry
onions
Predominantly irrigated by travelling gun. Solid set sprinklers relatively common. • Excessive late season irrigation reduces storage quality and skin hardening. • Excess irrigation increases susceptibility to white rot and botrytis in field and storage.
beans
Predominantly travelling gun irrigators • Excessive irrigation increases fungal losses and pod blemishes.
peas
Predominantly travelling gun irrigators • Adequate irrigation at flowering and pod fill is critical to yield. • Excessive early irrigation increases risk of seedling rot and damping off.
Carrots
Travelling gun and solid set sprinkler irrigation is relatively common. • Irregular irrigation results in poor shape and quality. • Excessive irrigation exacerbates bacterial and fungal disease.
broccoli
Large contracts are produced under centre pivot. Most production still under travelling gun irrigation.
• High uniformity irrigation increases evenness of crop maturity and greatly reduces hand harvest costs.
• Excessive irrigation induces crop disease such as heat rot and club root.
Over 70% of agricultural irrigated area is under Onion crops are not usually drip irrigated. travelling gun irrigation.
p �� Maximising returns from water in the Australian vegetable industr y: Tasmania

s e C t i o n � – wat e r u s e i n t h e ta s m a n i a n v e g e ta b l e i n d u s t ry
Irrigation in the vegetable industry is shifting to large Uniform water supply is important for carrot root travelling broom. development.
s alinity impac ts
The impacts of salinity are increasing in the northern and central midlands (the Southern ABS regions). These areas are typically duplex soils with high soil salt concentration. Saline seeps are becoming more common in newly developed intensive irrigation areas on these soil types and surface salt scalds are increasingly evident. It is not uncommon to detect surface drainage water reaching EC levels limiting vegetable production. Several salinity management research and extension programs are operating through DPIWE. Groundwater monitoring and subsoil salt content mapping is progressing. A DPIWE salinity land audit conducted in 2000 estimates that Tasmanian land systems totalling an area of 55 000 hectares are of significant salinity risk. 80% of salt-affected land in Tasmania is in the Midlands and north-east. A national land and water audit has reported that about 3% of agricultural land in Tasmania is salt-affected. The bulk of vegetable production occurring on deep, well-drained, north coast ferrosol soils is considered to be a low salinity risk.
water quality impacts
Turbidity of stored irrigation water is the major water quality issue on the north coast. Turbidity is primarily the result of surface run-off on steep cultivated land. Several projects within Tasmania are promoting soil conservation and water quality improvement though farming practices such as reduced tillage, grassed irrigation lanes and contour rip-mulching to minimise paddock surface run-off. Stream gauging and river health indicators, including turbidity, are monitored on a monthly basis at 54 sites across the state, with an objective to identify water quality degradation issues. Nutrient loading, primarily from nitrates associated with dairy shed effluent and vegetable fertilisers, is a significant issue in several north-west coast catchments. Several research and extension programs targeting dairy effluent management are in progress. Water salinity is the most significant water quality issue affecting production in the central and southern regions of Tasmania. Yield losses and surface scalds are observed in localised, low-lying, poorly drained soils.
Maximising returns from water in the Australian vegetable industr y: Tasmania p ��

s e C t i o n � – wat e r u s e i n t h e ta s m a n i a n v e g e ta b l e i n d u s t ry
Salinity problems occur predominantly in areas where irrigated production with moderately saline water has commenced within the last decade. Water salinity in surface run-off and small catchment dams is commonly recorded at levels on the threshold of limiting vegetable production (0.8–1.2 dS/m).
access to water impacts
A moratorium exists on any increased access to high surety river water until catchment management plans for each catchment are completed. The implementation of meters on river extractions has highlighted the difference between licensed allocations and current usage. In two recently surveyed catchments, current water use exceeds licensed supply by at least 60%. The Department of Primary Industries Water and Environment is in the process of updating water licences that recognise current grower water use and formalise this as a lower surety allocation; this process is managed through the Water Use Sustainability project.
e m p loym e n t i n t h e v e g e ta b l e i n d u s t ry In Tasmanian ABS statistics 2001 there were in excess of 640 vegetable farms, with over 1800 full time equivalent (FTE) jobs on vegetable farms. In the ‘services to agriculture’ sector there were 750 FTE jobs, and in ‘fruit and vegetable processing/packing’ there were 1368 FTE; the vast majority of the packing/ processing jobs being in the vegetable industry. There were also 34 FTE providing agronomic services advice
ma n ag e m e n t o f wat e r r e s o u r C e s water trading flexibility The 1999 Tasmanian Water Management Act legislation enables temporary water trading between licensed waterholders. Temporary water trading between growers occurs at a relatively low level, with only 8000 ML traded in 2002/03. There is no mechanism for permanent water licence trading in Tasmania.
The price of water from irrigation schemes is highly variable.
on-farm metering and water licensing
All river, groundwater and dam supply had been extracted without metering until implementation of the 1999 Water Management Act. To date, water users have installed approximately 500 meters, and all new water storage or river extraction requires meter installation. Groundwater use is currently unregulated. In Tasmania there are approximately 3000 high reliability water licences, with an allocation of 375 000 ML, and an average licence volume of approximately 100 ML/season.
p �� Maximising returns from water in the Australian vegetable industr y: Tasmania

s e C t i o n � – wat e r u s e i n t h e ta s m a n i a n v e g e ta b l e i n d u s t ry
Table 7 – Irrigation licence type, reliability and costs
Allocation supply & storage options approval processes Costs
Water licence surety 5, direct river extraction (typically November to April)
Surety 5 means a high level of supply reliability.
Currently a moratorium on new surety 5 licences.
As specified in the Water Management regulations 1999. Currently there is an annual administrative fee of $44.80 plus a field management fee which varies depending on the regional water management area and licence volume. (Currently this varies for an average irrigator from less than $1/ML to $8/ML.)
Water licence surety 6, summer river extraction
Surety 6 means lesser reliability, more seasonally dependent.
As specified in the Water Management regulations 1999. Currently there is an annual administrative fee of $44.80 plus a field management fee which varies depending on the regional water management area and licence volume.
Water licence, surety 5
Storage into dams
(typically May–Nov)
High reliability As specified in the Water Management regulations 1999. Currently there is an annual administrative fee of $44.80 plus a field management fee which varies depending on the regional water management area and licence volume. (Currently this varies from $6 to $90 per year.)
Temporary water allocation Intended for emergency use The fees for a temporary water allocation are specified in the Water Management regulations 1999 and are slightly higher than the fees for direct diversion licences. Higher administration fee.
Purchase from irrigation schemes, that is, Cressy, Winnaleah, South-east, Forth.
Potable supplies: Cradle Coast, Hobart Water.
Irrigation schemes service in excess of 40,000 ha of irrigated production.
Potable water supplied to approximately 140 farms*.
Costs highly variable: pressurised potable water up to $280/ML.
Non-pressurised irrigation supply from less than $30/ML.
Water trading – between licensed water users
Temporary water trading minor issue in Tasmania; 1000 ML traded 2002/03.*
Price agreement between individuals; average at $50/ML.*
Groundwater pumping Unregulated.
Utilised by approximately 10% of irrigated farms*.
No regulatory costs.
Dam storage and construction Approval process is required for all in-stream catchment or storage dams greater than 1 ML.
20,000 ML of storage approved in 2004/05.
Dam assessment and construction approval costs vary depending on dam hazard rating and impact studies required.
Maximising returns from water in the Australian vegetable industr y: Tasmania p ��

s e C t i o n � – wat e r u s e i n t h e ta s m a n i a n v e g e ta b l e i n d u s t ry
The most significant component of irrigation cost, under normal licensing arrangements, is the cost of pressurising and pumping water. Pumping costs are highly variable and dependent upon the pumping system, pipe length and ‘lift’, and irrigation system operating pressure. Water pumping costs typically vary from $17 ML when applied by electric pump through low-pressure centre pivot irrigation to over $100 ML when diesel pumped through travelling gun irrigators. Currently 80% of Tasmanian irrigation is managed under high pressure travelling gun irrigators.
b e n C h ma r k s Water use efficiency benchmarks on Tasmanian vegetable farms are not established. Actual water volumes applied on-farm are only approximated from pump and irrigation systems specifications. Metering water use and correlating with production tonnage has commenced through a preliminary Water Use Efficiency benchmarking project within the DPIWE vegetable and dairy branches. To date actual water use per hectare has been recorded for two seasons on 10 vegetable farms (out of 600 total) and 10 dairy properties (out of 500 total). Irrigation system type and water application method is documented in Water use on Australian farms (ABS 2005). Tasmanian irrigation system efficiency is high by national standards, as almost all vegetable irrigation is applied through pressurised systems. The industry is undergoing a rapid technology change from travelling gun irrigators to large, low pressure, travelling boom irrigation. Over 70% of irrigation area is managed under travelling gun irrigation and 20% under low pressure, travelling boom systems. Industry shift towards low pressure travelling boom irrigation and irrigation scheduling technology is expected to improve water use efficiency benchmarks.
benchmark et requirement
Table 8 – Average daily evapotranspiration at north coast and Midland weather stations
north coast – forthside (representative of mersey-lyell & northern abs regions)
midlands – Cressy (representative of southern abs region)
January 5.6 mm 6.2 mm
February 4.3 mm 5.1 mm
March 3.5 mm 3.7 mm
April 2.3 mm 2.2 mm
May 1.5 mm 1.2 mm
June 1.3 mm 1.2 mm
July 1.3 mm 1.0 mm
August 1.8 mm 1.8 mm
September 2.6 mm 2.8 mm
October 4.5 mm 3.9 mm
November 5.3 mm 4.9 mm
December 5.9 mm 6.1 mm
*Mean daily ET averaged over the years 2002, 2003, 2004 at DPIWE Forthside and Cressy weather stations.
p �� Maximising returns from water in the Australian vegetable industr y: Tasmania

s e C t i o n � – wat e r u s e i n t h e ta s m a n i a n v e g e ta b l e i n d u s t ry
b e n C h ma r k i r r i g at i o n r e q u i r e m e n t Expected irrigation volumes applied to crops produced on Tasmanian vegetable farms have been published in Wise watering (Davey & Maynard 2001) and are included below.
Table 9 – Irrigation volumes for vegetable crops
irrigation depth applied (mm ) irrigation quantity (ml/ha)
Potatoes 300–400 3–4
Poppies 150–250 1.5–2.5
Peas 100–200 1–2
Green beans 200 2
Carrots 350 3.5
Onions 3.5–400 3.5–4
Broccoli 200–300 2–3
Pasture 350–550 3.5–5.5
In practical farming terms, intensively irrigated vegetables such as potatoes, carrots, onions and brassicas receive an irrigation volume approximately equal to weekly evaporative losses (summer ET on the north coast is 40–42 mm/week). Total crop irrigation requirement often equates to this, which is 0.4 to 0.5 ML/ha/week multiplied by the number of weeks the crop is at full leaf cover and grown in summer months. For example, the total irrigation requirement for potatoes (10 weeks full canopy) is 45 mm irrigation per week = 4.5 ML/ha. Travelling gun irrigators typically meet this requirement through one high volume 35–45 mm irrigation on a 5-to-7 day interval.
s C h e d u l i n g
soil moisture monitoring
Soil moisture monitoring tools are widely used in intensive irrigated vegetable production in Tasmania. A recent CSIRO draft report indicates 21% of farmers use some form of soil moisture monitoring. Water use on Australian farms (ABS 2005) gives estimates that 640 of the 2000 irrigated farms have adopted more efficient scheduling methods. The three major agricultural suppliers on the north coast estimate to have sold or leased 350 logging gypsum block soil moisture monitoring systems in the season 2004/05. A key driver to the uptake of irrigation scheduling tools appears to be a high level of agronomist field officer support. Company field officers recognise soil moisture monitoring as an essential component of yield and quality management. Company field agronomists encourage, support and assist growers with interpretation of soil moisture monitoring data. The requirements of metered water extraction and industry change towards more manageable travelling boom irrigation systems establish more incentive and opportunity to better manage irrigation scheduling based upon direct soil moisture monitoring.
Maximising returns from water in the Australian vegetable industr y: Tasmania p ��
s e C t i o n � – wat e r u s e i n t h e ta s m a n i a n v e g e ta b l e i n d u s t ry
The main soil moisture monitoring system is a data logger linked to Watermark™ granular matrix blocks. Data loggers commonly used in conjunction with the Watermark sensors are those manufactured by Hanson, MEA (Gbug) and Irrometer data loggers. The EnvironSCAN™ and AdCon™ capacitance probes are used in relatively low numbers in annual vegetable cropping: these more sophisticated technologies have been more strongly adopted in perennial cropping situations. The three major horticultural supply distributors, Serve-Ag, Roberts and Websters, all offer sales, service and assistance with installation and interpretation of soil moisture monitoring technologies. Simplot Australia is now progressing into the third season of a program referred to as the ‘Crop Management Service’. The program establishes regular crop monitoring and agronomic data collection. Data-logged soil moisture monitoring is a key component of the program. Accurate soil moisture management records are then aligned with yield and quality at processing. Soil moisture management histories are analysed and discussed within grower discussion groups. This program is being conducted in at least 130 sites each season and is potentially an extremely valuable tool to assist with definition of irrigation best practice and changes in water use efficiency. The crops currently included in this program are processing potatoes, peas, beans and brassicas.
weather-based scheduling
Slightly less than 20% of Tasmanian farmers surveyed in ABS Water use on Australian farms reported using weather-based information to make irrigation decisions. Daily evaporation data is reported in all regional newspapers. It is estimated that well over 50% of the Tasmanian population has household internet access and growers regularly refer to web-based weather forecasts and rainband maps as part of the irrigation decision process. This usage is significant but not quantified.
p �� Maximising returns from water in the Australian vegetable industr y: Tasmania
r e f e r e n C e s
r e f e r e n C e s Australian Bureau of Statistics 2005, Water use on Australian farms 2003/04, ABS catalogue 4618.0,
compiled Susan Linacre, ABS, Canberra, released 27 October 2005. Available at http://www. ausstats.abs.gov.au/Ausstats/subscriber.nsf/0/9C90643E5B78B440CA2570A600763F80/ $File/46180_2003-04.pdf
Davey & Maynard 2001, Wise watering: irrigation management course, [training manual], presented by Davey & Maynard, in association with Armstrong Agricultural Services, Hinton Agricultural Consulting, Serve-Ag, Rural Development Services Tasmania, Department of Primary Industries, Water & Environment, and Natural Heritage Trust (Tas.), published by Primary Industries, Water and Environment, Hobart, available at www.dpiwe.tas.gov.au
DPIWE 2005, Cash crop enterprise budgets: high rainfall 2005/06, available at www.dpiwe.tas.gov.au
DPIWE 2005, Mersey water management plan, Water Assessment and Planning Branch, Department of Primary Industries, Water and Environment, July, available at www.dpiwe.tas.gov.au
DPIWE 2005, Tasmanian vegetable industry situation paper, prepared by Department of Primary Industries, Water and Environment, and Department of Economic Development, published by DPIWE, Hobart, 3 August, available at www.dpiwe.tas.gov.au
DPIWE, Water licence fees, ‘Water facts’ factsheet series, available at www.dpiwe.tas.gov.au
DPIWE, Water Management Act 1999, ‘Water facts’ factsheet series, available at www.dpiwe.tas.gov.au
Primary Industries, Water & Environment, see DPIWE
Maximising returns from water in the Australian vegetable industr y: Tasmania p ��