mauro rappa - maurorappa@libero · kernel debug info ... print ("collecting data... type...
TRANSCRIPT

Mauro Rappa - [email protected]

A Brief Introduction to System Tap
● Open source community project with active contributions from IBM,Intel, Hitachi, Red Hat and various community members.
● Tool for real time performance analysis

Have you ever wondered...
● Who killed my process?● Why is there so much I/O going on?● Is this program an exploit or backdoor?● Why did OOM killer start killing process?● What performance statistics can i collect?● Why does my battery drain so quickly?

Systemtap
Systemtap
Functional Problem analysis
(debugging)
ContinuousPerformancemonitoring
RealtimePerformance
analysis
Easy to useby system
administrators
Low overhead andsafe for production
systems

What Do I need to use Systemtap?
● Yum install stap (fedora)
● Kernel debug info (-g compiler switch)

How does it work?
● Write your code
● Stap will automatically create a C source file
● Stap will compile it as a kernel module
● It will be loaded immediately!

All steps
#stap -vvv test.stp
Pass 1: parsed user script and 38 library script(s) in 150usr/20sys/183real ms.
Pass 2: analyzed script: 1 probe(s), 5 function(s), 14 embed(s), 0 global(s) in
110usr/110sys/242real ms.
Pass 3: translated to C into
"/tmp/stapEjEd0T/stap_6455011c477a19ec8c7bbd5ac12a9cd0_13608.c" in 0usr/0sys/
0real ms.
Pass 4: compiled C into "stap_6455011c477a19ec8c7bbd5ac12a9cd0_13608.ko" in
1250usr/240sys/1685real ms.
Pass 5: starting run.
Pass 5: run completed in 20usr/30sys/4204real ms.

What kind of events can I probe?
●syscall.read = probe a syscall
● syscall.close.return = return from the close system call.
● module("floppy").function("*") = every function in module
floppy
● kernel.function("sys_open") = entry to the function named
sys_open in the kernel.
● kernel.function("*@net/socket.c") = every function
terminating with 'net' in file socket.

Using internal structures
●If/Else statement
●Arrays
●Aggregates, they are used to collect statistics on
numerical values, where it is important to
accumulate new data quickly. You can get mean
value and logarithmic histogram....

Using internal variables
● pid() The process (task group) id of the current thread.
● uid() The id of the current user.
● execname() The name of the current process.
● tid() The id of the current thread.
● gettimeofday_s() Number of seconds since epoch.
● probefunc() If known, the name of the function in which
this probe was placed.

Example#1: Trace when process executes
probe syscall.exec* {printf("exec %s %s\n", execname(), argstr)}
# stap test.stp exec sh /bin/ps xexec sh /bin/grep netscapeexec crontab /bin/sh -c "/bin/vi /tmp/crontab.XXXXXjEYFJ"exec sh /bin/vi /tmp/crontab.XXXXXjEYFJexec bash /usr/sbin/xm exec xm /usr/kerberos/sbin/python /usr/sbin/xmexec bash /usr/bin/crontab -eexec crontab /bin/sh -c "/bin/vi /tmp/crontab.XXXXGICmsM"exec sh /bin/vi /tmp/crontab.XXXXGICmsM

Example#2: Trap every sig Kill
probe signal.send { if (sig_name == "SIGKILL") printf("%s was sent to %s (pid:%d) by %s uid:%d\n", sig_name, pid_name, sig_pid, execname(), uid())}
# stap test.stp SIGKILL was sent to httpd (pid:12672) by bash uid:0

Example#3: get syscall stats
global syscalls
probe begin { print ("Collecting data... Type Ctrl-C to exit and display results\n")}
probe syscall.* { syscalls[execname()]++}
probe end { printf ("%-10s %-s\n", "#SysCalls", "Program") foreach (execname in syscalls-) printf("%-10d %-s\n", syscalls[execname], execname)}

Example#3: Output
# ./syscall_by_name.stp
Collecting data... #SysCalls Program155433 firefox65007 qemu-dm39025 soffice.bin34674 java_vm23835 yadarh21950 Xorg7004 setroubleshootd4510 mixer_applet23107 gnome-terminal2995 xchat2207 gnome-power-man
Only in 2 min idle!

Example#4: Monitoring a file
probe kernel.function("vfs_write"), kernel.function("vfs_read") {
dev_nr = $file->f_dentry->d_inode->i_sb->s_dev inode_nr = $file->f_dentry->d_inode->i_ino
if (dev_nr ==($1 << 20|$2) && inode_nr==$3) printf ("%s(%d) %s 0x%x/%u \n", execname(),pid(), probefunc(), dev_nr, inode_nr)
}

Example#4: Output
# stat /etc/passwd File: `/etc/passwd' Size: 1669 Blocks: 16 IO Block: 4096 regular fileDevice: fd00h/64768d Inode: 22120430 Links: 1
# stap filewatch.stp 253 0 22120430crond(15986) vfs_read 0xfd00000/22120430 crond(15986) vfs_read 0xfd00000/22120430 sendmail(15988) vfs_read 0xfd00000/22120430 sendmail(15988) vfs_read 0xfd00000/22120430 sendmail(15988) vfs_read 0xfd00000/22120430
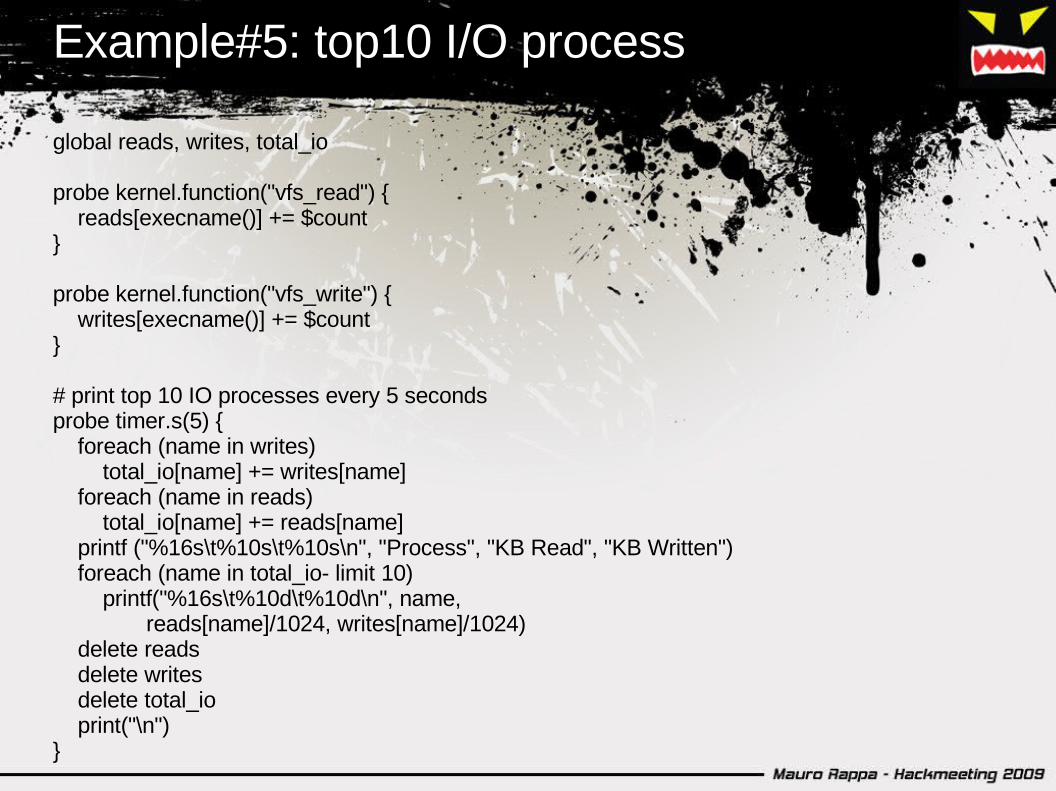
Example#5: top10 I/O process
global reads, writes, total_io
probe kernel.function("vfs_read") { reads[execname()] += $count}
probe kernel.function("vfs_write") { writes[execname()] += $count}
# print top 10 IO processes every 5 secondsprobe timer.s(5) { foreach (name in writes) total_io[name] += writes[name] foreach (name in reads) total_io[name] += reads[name] printf ("%16s\t%10s\t%10s\n", "Process", "KB Read", "KB Written") foreach (name in total_io- limit 10) printf("%16s\t%10d\t%10d\n", name, reads[name]/1024, writes[name]/1024) delete reads delete writes delete total_io print("\n")}

Example#5: Output
# ./top10-io-process.stp
ProcessXorg
stapiofirefox
wnck-appletmultiload-apple
metacitythunderbird-bin
gnome-panelirqbalance
notification-da
KB Read17305
3088291
24791711
51612
KB Written00
698175
4625218
01

Example#6: Monitor network activity per thread
probe kernel.function("*@net/socket.c"){
if (pid() == $1) printf ("%s -> %s\n", thread_indent(1), probefunc())}
probe kernel.function("*@net/socket.c").return{ if (pid() == $1) printf ("%s <- %s\n", thread_indent(-1), probefunc())}
# stap test.stp 5488 0 thunderbird-bin(5488): -> sock_poll 11 thunderbird-bin(5488): <- sock_poll 0 thunderbird-bin(5488): -> sock_poll 3 thunderbird-bin(5488): <- sock_poll 0 thunderbird-bin(5488): -> sock_ioctl 4 thunderbird-bin(5488): <- sock_ioctl

Example#7: Using Aggredates
global reads
probe begin {println("probe beginning")}
probe syscall.read {reads[execname()] <<< count}
probe end {foreach (prog_name in reads) { printf("Name: %s, # Reads: %d, Total Bytes: %d, Avg: %d\n", prog_name, @count(reads[prog_name]), @sum(reads[prog_name]), @avg(reads[prog_name])) }}

Example#7: Output
# ./reads.stp probe beginningName: thunderbird-bin, # Reads: 2, Total Bytes: 1025, Avg: 512Name: Xorg, # Reads: 313, Total Bytes: 1299596, Avg: 4152Name: xchat, # Reads: 2, Total Bytes: 64, Avg: 32Name: firefox, # Reads: 11, Total Bytes: 1158, Avg: 105Name: gnome-settings-, # Reads: 2, Total Bytes: 96, Avg: 48Name: gnome-power-man, # Reads: 110, Total Bytes: 47872, Avg: 435Name: gnome-terminal, # Reads: 5, Total Bytes: 4224, Avg: 844Name: notification-da, # Reads: 2, Total Bytes: 64, Avg: 32Name: pam-panel-icon, # Reads: 2, Total Bytes: 2048, Avg: 1024Name: dbus-daemon, # Reads: 34, Total Bytes: 69632, Avg: 2048

How can I load stap module?
The -k option will leave the temporary directory and it contents used to create the systemtap instrumentation[root@localhost stap]# modinfo /tmp/staptabmoW/stap_2d57a498ab5486b628937154c2a9aea2_4060944.ko filename: /tmp/staptabmoW/stap_2d57a498ab5486b628937154c2a9aea2_4060944.kolicense: GPLdescription: systemtap probelicense: GPLsrcversion: 4AE0093CB6EE089775AFA42depends: vermagic: 2.6.18-122.el5xen SMP mod_unload 686 REGPARM 4KSTACKS gcc-4.1parm: _stp_bufsize:buffer size (int)

How do I run prebuilt systemtap modules?
Prebuilt systemtap modules can be run using 'staprun'
$ staprun /path/to/<name>.ko

Cross-instrumentation?
It means generating SystemTap instrumentation module from a SystemTap script on one computer to be used on another computer.
After installing right kernel, run stap -r 2.6.18-92.1.10.el5 -m simple
On target system:staprun simple.ko

● DTrace interpreted in kernel versus precompiled module
● DTrace language more limited, no control Structures
● Number of available symbolic probe points in the kernel
Comparison to Dtrace

Language Safety features: - No dynamic memory allocation - Types and type conversions limited - Limited pointer operations
Builtin safety checks: - Infinite loops and recursion - Invalid variable access - Division by zero - Restricted access to kernel memory - Array bound checks
Safety features: - No dynamic memory allocation - Types and type conversions limited - Limited pointer operations
SystemTap Safety features

Comparing other tools:
●Audit can log every process sends 'kill -1'
-a entry,always -S kill -F a1=1
●Strace can log every syscall in userspace
●Gdb can probe function inside programs and
examine internal status

● Use of DTrace markers
● Unprivileged user support
● Java probing
● Remote probing
Future

Links
/usr/share/doc/systemtap-0.*/examples/
http://sourceware.org/systemtap/
Red Hat SystemTap Beginners Guide