mauritius: the drivers of growth—can the past be extended? · mauritius scored positively was...
TRANSCRIPT

WP/14/134
Mauritius: The Drivers of Growth—Can the Past be Extended?
Katsiaryna Svirydzenka
Martin Petri
© 2014 International Monetary Fund WP/14/134
IMF Working Paper
African Department
Mauritius: The Drivers of Growth—Can the Past be Extended?1
Prepared by Katsiaryna Svirydzenka and Martin Petri
Authorized for distribution by Doris C. Ross
July 2014
Abstract
Abstract: Mauritius’s economic performance has been called “the Mauritian miracle” and the “success of Africa” (Romer, 1992; Frankel, 2010; Stiglitz, 2011), despite difficult initial conditions that led a Nobel Prize Winner in economics to predict stagnation (Meade, 1961). We use growth accounting to analyze the sources of past growth and project potential ranges of growth through 2033. Growth averaged 4½ percent over the past 20 years. Our baseline suggests future growth rates around 3¼ percent, but growth could reach 4-5 percent with strong pro-active policies including (i) improving investment and savings rates; (ii) improving the efficiency of social spending and public enterprise reforms; (iii) investment in education and education reforms; (iv) labor market reforms; and (v) further measures to reduce bottlenecks and increase productivity. With policies capable of generating 5 percent growth, Mauritius could reach high-income status in 2021, 4 years earlier than under the baseline.
JEL Classification Numbers:F4; O1; O2; O4; O5
Keywords: Growth; Mauritius; growth accounting
Author’s E-Mail Address: [email protected] ; [email protected]
1 We would like to thank the participants of a seminar organized by the AFR Growth Network, and one jointly organized by the Ministry of Finance and Economic Development and the Bank of Mauritius, Vimal Thakoor, and Ali Mansoor for useful comments and suggestions. Graham Campbell provided invaluable research support. Adja Thiam provided excellent editorial assistance.
This Working Paper should not be reported as representing the views of the IMF. The views expressed in this Working Paper are those of the author(s) and do not necessarily represent those of the IMF or IMF policy. Working Papers describe research in progress by the author(s) and are published to elicit comments and to further debate.

Contents
Abstract ......................................................................................................................................2
I. Introduction ............................................................................................................................4
II. Mauritius Growth Miracle .....................................................................................................5
III. The Growth Accounting Framework ...................................................................................8A. Capital stock ..............................................................................................................9B. Labor force .............................................................................................................11C. Shares of capital and labor in output .......................................................................11D. Human capital .........................................................................................................13
IV. Historical Decomposition of Growth .................................................................................14
V. Baseline Projection Scenario and Sensitivity Analysis .......................................................19A. Factor inputs ............................................................................................................19B. Baseline growth projection: ....................................................................................24
VI. Policy Options to Raise the Long-run Growth Rate ..........................................................29A. Investment and capital formation ............................................................................30B. Labor market ...........................................................................................................31C. Human capital .........................................................................................................33D. Productivity .............................................................................................................35
VII. Conclusion ........................................................................................................................36
References ................................................................................................................................37
Tables
1. Decomposing Historical Growth, 1951–2013 .............................................................15
2. Growth Sensitivity Analysis, 1961–2013 ....................................................................18
3. Baseline Growth Scenario, 2012–33............................................................................25
4. Optimistic Growth Scenario, 2012–33 ........................................................................27
5. Pessimistic Growth Scenario, 2012–33 .......................................................................28
6. Summary Business Environment Statistics, 2013 .......................................................32
3
Figures
1. GDP Developments, 1950–2013 ...................................................................................5
2. Implied Depreciation Rate, 1979–2013 .......................................................................10
3. Capital Growth, 1950–2013 .........................................................................................10
4. Compensation of Employees, 1975-2011 ....................................................................12
5. Education of Labor Force, 1990–2010 ........................................................................13
6. Average Years of Education, 1960–2010 ....................................................................13
7. Average Growth in Education, 1975-2011 ..................................................................14
8. Growth Decomposition, 1951–2013 ............................................................................16
9. Labor Market Developments, 1960–2013 ...................................................................16
10. Growth Decomposition by Expenditure, 1975–2013 ..................................................18
11. Capital Growth Projections, 1975–2033 ......................................................................19
12. Comparison with Asian Tigers and Sub-Saharan Africa, 1975–2011 .........................20
13. Labor Market Comparison, 1975–2013 .......................................................................21
14. Educational Attainment Projections, 2000–2050 ........................................................22
15. Labor Growth Projections, 1975–2033 ........................................................................23
16. Productivity Projections, 1975–2033 ...........................................................................23
17. International Comparison of Educational Attainment .................................................24
18. Growth Decomposition (Baseline Scenario), 2012–33 ...............................................26
19. Sensitivity of Growth Projections, 2000–33 ................................................................26
20. Frequency Distribution of Average Growth Rates ......................................................27
21. Migration and Investment Needed to Raise Growth to 6 Percent ...............................29
22. Long-Term Working Age Population Projections, 1950–2100 ...................................33
23. International Comparison of Educational Attainment .................................................34
4
I. INTRODUCTION
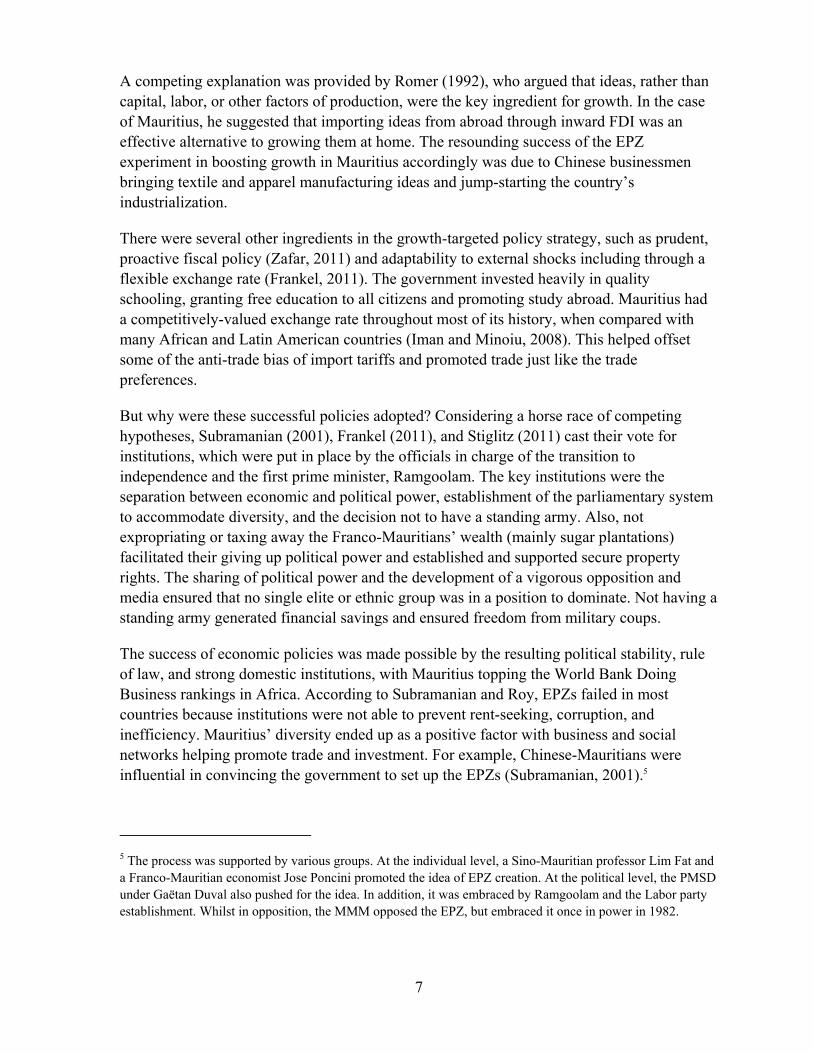
Mauritius’ economic performance since independence in 1968 has been invariably labeled “the Mauritian miracle” and the “success of Africa” (Romer, 1992; Frankel, 2010; Stiglitz, 2011). Indeed, the island started out with the disadvantages of a typical African economy: a low-income monocrop exporter with a fully tropical climate, subject to significant terms-of-trade and output shocks, high population growth, and ethnic tensions. Observing the country’s adverse inheritance, James Mead, a Nobel Prize laureate in economics, who led the economic survey mission to Mauritius in 1960, famously predicted:
“In the author’s opinion, Mauritius faces ultimate catastrophe” (Meade, 1961).
“Heavy population pressure must inevitably reduce real income per head below what it might otherwise be. That surely is bad enough in a community that is full of political conflict. But if in addition, in the absence of other remedies, it must lead either to unemployment (exacerbating the scramble for jobs between Indians and Creoles) or to even greater inequalities (stocking up still more the envy felt by Indian and Creole underdog for the Franco-Mauritian top dog), the outlook for peaceful development is poor” (Meade et al., 1961).
Despite these initial disadvantages, Mauritius managed to develop into an upper middle-income diversified economy, generating an average real GDP growth of 5.3 percent between 1969 and 2013 compared to 3.8 percent for Sub-Saharan Africa (Figure 1). This is even more impressive in per-capita terms with Mauritius growing at 4.4 percent versus only 1.3 percent for Sub-Saharan Africa. Per-capita income in 2013 was $9,136 dollars at current exchange rates or $16,082 at purchasing power parity, which is about 6 times larger than the average of Sub-Saharan Africa and at a comparable level with Mexico and Turkey.
However, the future growth potential is more uncertain. The long-term trend could be declining (Figure 1), partly as a result of zero population growth and the expiry of trade preferences.2 A general growth slowdown in Mauritius’s main trading partners (United States and Europe) following the financial crisis may limit the potential pickup in growth from traditional sources, at least in the short run while Mauritius diversifies its export markets.
In 2012, the authorities announced an ambitious vision of GDP of one trillion rupees and an income per capita of US$20,000 by the 2020s, which would require real growth of over 6 percent per year. We examine under which circumstances such growth could be achieved, and what policies might increase growth.
2 The Multi-Fiber Agreement for textiles expired in 2004 and the EU Sugar Protocol ended in 2009. The price of sugar fell by 36 percent between 2006 and 2010.

5
Figure 1. Mauritius: GDP Developments, 1950–2013
Sources: CSO; and authors’ calculations.
This paper uses the standard growth accounting framework to assess the drivers of growth in Mauritius over the past sixty years; to identify the sources of future growth; and to determine potential ranges of growth through 2030 under various policies. It finds that the contribution of labor has systematically declined, although its role picks up if one accounts for improvements in education. Since the 1990s, capital and total factor productivity (TFP) play the dominant role, with TFP permanently higher than before. The results of the growth accounting exercise suggest that a growth rate of 6 percent, as targeted by the authorities, might be somewhat ambitious. The paper estimates that Mauritius’ long-run growth rate might be around 4 percent, but that pro-active policies could raise growth to perhaps 5 percent, which given that population growth is essentially zero, translates into a very respectable 5 percent per-capita growth rate. The policies suggested include (i) improving investment and savings rates; (ii) labor market reforms; (iii) investment in education and education reform; and (iv) further reforms to reduce bottlenecks and increase productivity.
The paper is structured as follows. Section II discusses the previous work on the determinants of Mauritius’s success. Section III presents the growth accounting framework and data. Section IV looks at the historical evidence and what we can learn from it. Section V develops the baseline projection scenario and discusses upside and downside risks for the potential growth rate. Section VI concludes with policy implications.
II. MAURITIUS GROWTH MIRACLE
A country’s economic performance is mainly determined by three factors: initial conditions, remedial policies, and framing institutions.
There is broad agreement that Mauritius’s original inheritance was unfavorable. Meade’s prophecy of doom was based on what he saw as the country’s impending population
‐15
-10
-5
0
5
10
15
20
25
1950 1960 1970 1980 1990 2000 2010
Real growth
Real growth per capita
10-year MA
0
1,000
2,000
3,000
4,000
5,000
6,000
7,000
8,000
9,000
10,000
1975 1980 1985 1990 1995 2000 2005 2010
GDP/capita (USD): Mauritius
GDP/capita (USD): SSA
Growth averaged 5% over the last 4 decades and averaged 4 percent lately
Per-capita income rose rapidly, putting Mauritius firmly in high middle income status

6
explosion, little experience and technical knowledge outside the sugar factories, scarcity of capital and raw materials, a limited domestic market, and the country’s remoteness. Furthermore, any reforms would need to be implemented in a society highly fragmented on ethnic, economic, and political lines. As a development strategy, he therefore proposed (i) population control with an effective family planning system and emigration of workers to other British colonies; (ii) diversification in agriculture and rapid change in industry structure; and (iii) a system of subsidies with wage restraint, welfare benefits for the unemployed, and overseas welfare assistance.
Meade’s reading of adverse inheritance was later confirmed by the factors identified as important in the growth literature. Geographically, the country was as far from the economic activity centers as the South Pacific islands. On ethnic, linguistic, and religious fragmentation, it was more divided that all the other small African states, and had one of the higher population densities in the world. It started out with distortionary trade barriers and was highly dependent on a single crop, sugar, which suffers from high price volatility. Conditional convergence suggested that Mauritius would have lower growth rates than the rest of the SSA, given its relatively higher per-capita income. The only variable where Mauritius scored positively was life expectancy (Subramanian and Roy, 2001), which at the time further fueled Meade’s concerns with overpopulation, but turned out to be a blessing as the country industrialized.
The subsequent success of Mauritius has been attributed to various policies.3 Part of the growth strategy relied on heterodox trade opening,4 where the restrictive import policies of the 1970s, 1980s, and 1990s were supplemented by the creation of the export-processing zones (EPZ) with duty free access for imported inputs, tax incentives, and a segmented labor market (Subramanian and Roy, 2001; Frankel, 2010). Domestic trade policies were complemented by successful trade diplomacy. Preferential access in textiles and sugar resulted in rents of, respectively, 7 and 4.5 percent of GDP per annum in the 1980s and 1990s, which helped sustain high investment levels. In addition, during those years, it was mostly domestic rather than foreign savings that financed domestic investment (Subramanian and Roy, 2001). Successful recycling of export rents also made possible the heavy investment in human capital, both publically and privately funded. The signing of the Double Taxation Avoidance Treaty with India in 1983 spearheaded the development of the offshore financial sector, and was instrumental in making Mauritius the largest source of FDI inflows into India.
3 For previous analysis of Mauritius’s performance, see Romer (1992), Subramanian (2001 and 2009), Subramanian and Roy (2007), Frankel (2010), Stiglitz (2011), Zafar (2011).
4 Subramanian and Roy reject the openness to trade argument offered by Sachs and Warner (1995, 1997).
7
A competing explanation was provided by Romer (1992), who argued that ideas, rather than capital, labor, or other factors of production, were the key ingredient for growth. In the case of Mauritius, he suggested that importing ideas from abroad through inward FDI was an effective alternative to growing them at home. The resounding success of the EPZ experiment in boosting growth in Mauritius accordingly was due to Chinese businessmen bringing textile and apparel manufacturing ideas and jump-starting the country’s industrialization.
There were several other ingredients in the growth-targeted policy strategy, such as prudent, proactive fiscal policy (Zafar, 2011) and adaptability to external shocks including through a flexible exchange rate (Frankel, 2011). The government invested heavily in quality schooling, granting free education to all citizens and promoting study abroad. Mauritius had a competitively-valued exchange rate throughout most of its history, when compared with many African and Latin American countries (Iman and Minoiu, 2008). This helped offset some of the anti-trade bias of import tariffs and promoted trade just like the trade preferences.
But why were these successful policies adopted? Considering a horse race of competing hypotheses, Subramanian (2001), Frankel (2011), and Stiglitz (2011) cast their vote for institutions, which were put in place by the officials in charge of the transition to independence and the first prime minister, Ramgoolam. The key institutions were the separation between economic and political power, establishment of the parliamentary system to accommodate diversity, and the decision not to have a standing army. Also, not expropriating or taxing away the Franco-Mauritians’ wealth (mainly sugar plantations) facilitated their giving up political power and established and supported secure property rights. The sharing of political power and the development of a vigorous opposition and media ensured that no single elite or ethnic group was in a position to dominate. Not having a standing army generated financial savings and ensured freedom from military coups.
The success of economic policies was made possible by the resulting political stability, rule of law, and strong domestic institutions, with Mauritius topping the World Bank Doing Business rankings in Africa. According to Subramanian and Roy, EPZs failed in most countries because institutions were not able to prevent rent-seeking, corruption, and inefficiency. Mauritius’ diversity ended up as a positive factor with business and social networks helping promote trade and investment. For example, Chinese-Mauritians were influential in convincing the government to set up the EPZs (Subramanian, 2001).5
5 The process was supported by various groups. At the individual level, a Sino-Mauritian professor Lim Fat and a Franco-Mauritian economist Jose Poncini promoted the idea of EPZ creation. At the political level, the PMSD under Gaëtan Duval also pushed for the idea. In addition, it was embraced by Ramgoolam and the Labor party establishment. Whilst in opposition, the MMM opposed the EPZ, but embraced it once in power in 1982.
8
Good institutions were established by forward-looking Mauritian leadership but perhaps also because of what Frankel calls “deepest determinants”. Few British settlers moved to Mauritius to replace the French, when Great Britain succeeded France as the colonial power. As a result, at independence European settlers were not protected to the same extent as in other countries, and a power-sharing structure was established. In addition, more time was taken to prepare the country for independence, which was not true for most African countries. Mauritius also benefited from being an “immigrant isle” – everyone who was there came from somewhere else and there were no natives to resent the newcomers. Therefore, everyone had a common stake in working together and immigrant initiative could fully develop.
In terms of the analysis of this paper, initial conditions, policies, and institutions affect economic growth to the extent that they determine the rate of factor accumulation and efficiency with which the factors of production are put together. In this respect, our approach adds rigor to the more qualitative assessment of Frankel and Stiglitz. While other papers use growth accounting to look at determinants of growth in the past and policy implications for other countries from Mauritian success, we look at the past to the extent that it gives insight into what can reasonably drive future growth and what policies Mauritius can take to encourage higher growth.
III. THE GROWTH ACCOUNTING FRAMEWORK
The growth accounting framework is based on the Cobb-Douglas production function, which is commonly used to analyze the sources of historical growth because its constant returns to scale properties make the decomposition relatively easy:
Here, represents domestic output in period t, is the physical capital stock, is the employed labor, is the total factor productivity (TFP), and α is the partial elasticity of output with respect to capital.
Total differentiation of the production function allows us to decompose the growth rate of output into the contributions of growth rates of factor inputs and total factor productivity:
1
Total factor productivity (TFP), which captures other aspects of production, such as technology, infrastructure, and institutions, is computed as a residual, given that we have data for output, capital, and labor.
In an alternative specification, we augment the labor input with human capital (H) to calculate effective labor (L*), akin to Bosworth and Collins (2003), which accounts for the role of educational attainment in improving the quality of the labor force:
9
Here, s is the average years of schooling of the labor force and r is the return to each year of schooling, estimated to be 10.7 percent for middle-income countries (Psacharopoulos and Patrinos, 2004).
While we present the results for both specifications, we believe that the augmented model is more relevant, because it allows for the fact that labor has different levels of productivity. This is especially relevant in an economy like Mauritius, where per-capita income is increasing and better education and training make people more productive.
A. Capital stock
We estimate the capital stock using the standard perpetual inventory model with geometric depreciation, which gives the accumulation equation:
1
Here, δ is the depreciation rate in percent and It is real gross fixed capital formation. Our historical decomposition is based on annual data from 1950 to 2011. Investment data come from the Central Statistical Organization (CSO) for the years 1972 to 2011 and from Nehru and Dhareshwar (1993) for 1950 to 1971.
Since Mauritius never undertook a national wealth survey, the initial capital stock needs to be estimated. We follow the Harberger approach, which allows estimating the mid-point capital stock for a period where the capital-output ratio can be assumed to be constant. In that case, the growth rates of capital and output are equal, and from the accumulation equation it follows:
where y is the growth rate of output. Since the capital-output ratio is unlikely to vary significantly over short periods of time, we use three-year averages of output growth and investment level and apply the accumulation equation backwards to arrive at the capital stock level in 1950.6
The choice of the depreciation rate is arguably more important than the initial capital stock, since little initial capital would have survived over 60 years. While errors in estimating the initial capital stock will be dampened over time, errors in the depreciation rate will tend to accumulate. A higher depreciation rate gives a lower estimate of the initial capital stock and therefore more pronounced rates of capital growth. The annual depreciation rate estimated
6 See Nehru and Dhareshwar (1993) for an overview of other methods of estimating the initial capital stock.
10
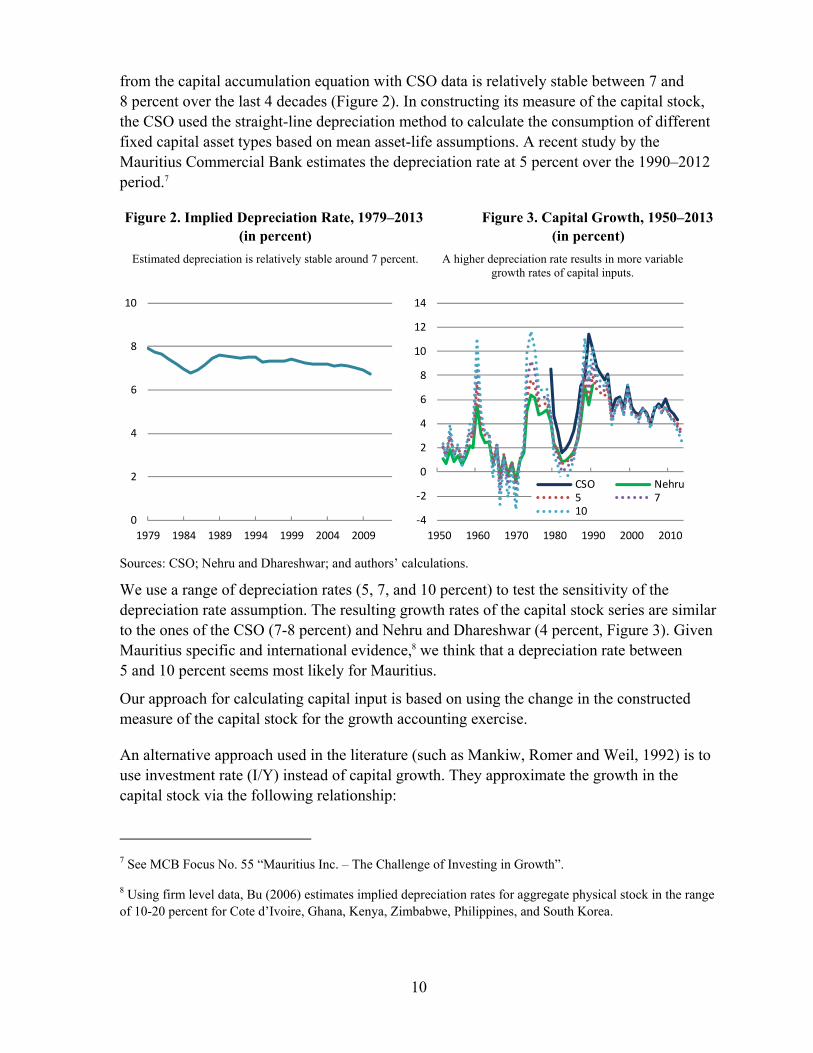
from the capital accumulation equation with CSO data is relatively stable between 7 and 8 percent over the last 4 decades (Figure 2). In constructing its measure of the capital stock, the CSO used the straight-line depreciation method to calculate the consumption of different fixed capital asset types based on mean asset-life assumptions. A recent study by the Mauritius Commercial Bank estimates the depreciation rate at 5 percent over the 1990–2012 period.7
Figure 2. Implied Depreciation Rate, 1979–2013 Figure 3. Capital Growth, 1950–2013 (in percent) (in percent)
Estimated depreciation is relatively stable around 7 percent. A higher depreciation rate results in more variable growth rates of capital inputs.
Sources: CSO; Nehru and Dhareshwar; and authors’ calculations.
We use a range of depreciation rates (5, 7, and 10 percent) to test the sensitivity of the depreciation rate assumption. The resulting growth rates of the capital stock series are similar to the ones of the CSO (7-8 percent) and Nehru and Dhareshwar (4 percent, Figure 3). Given Mauritius specific and international evidence,8 we think that a depreciation rate between 5 and 10 percent seems most likely for Mauritius.
Our approach for calculating capital input is based on using the change in the constructed measure of the capital stock for the growth accounting exercise.
An alternative approach used in the literature (such as Mankiw, Romer and Weil, 1992) is to use investment rate (I/Y) instead of capital growth. They approximate the growth in the capital stock via the following relationship:
7 See MCB Focus No. 55 “Mauritius Inc. – The Challenge of Investing in Growth”.
8 Using firm level data, Bu (2006) estimates implied depreciation rates for aggregate physical stock in the range of 10-20 percent for Cote d’Ivoire, Ghana, Kenya, Zimbabwe, Philippines, and South Korea.
0
2
4
6
8
10
1979 1984 1989 1994 1999 2004 2009
-4
-2
0
2
4
6
8
10
12
14
1950 1960 1970 1980 1990 2000 2010
CSO Nehru5 710
11
/
Assuming a steady-state constant level of the capital-output ratio allows the change in capital stock to be measured by the investment rate.
However, given the transformations experienced by the Mauritian economy in this period, the assumption of constant capital-output ratio over the entire period seems not supported by the evident (see discussion below). More importantly, investment rates in Mauritius have been between 20–30 percent, much higher than the -5 to 15 percent growth range estimated for the constructed capital stock (Figure 3). Using investment rates would thus likely lead to an over-estimation of the role of capital for explaining growth.
B. Labor force
We use employment data from 1972 onwards from the CSO. The use of employment instead of population implies that our measure reflects, besides population growth, also variations in the participation and employment rates. We reconstruct the data for 1960–1971 using the growth rates of the population aged 15-59 and the total population for 1950–1959 since the other measure is not available for the earlier period. Both series come from the World Development Indicators (WDI) database. This reconstruction assumes that participation and employment rates stay unchanged at the 1972 level during 1950–1971.
C. Shares of capital and labor in output
If one assumes constant returns to scale and competitive markets, where each input is paid the amount of its marginal product, then the exponent on each factor input in the production function represents the relative share of total product accruing to that factor:
/
: /
1
1
One can use the information on the compensation of employees and operating surplus from the national accounts statistics to estimate the factor shares. However, the CSO data exhibit a persistent decline in the share of the employee compensation in the value added over time, from a peak of 55 percent in 1977 to 38 percent in 2011 (Figure 4). This would imply that the capital share has been increasing from 45 percent to 62 percent over time, which goes against the typical assumption of α = 0.35 used in cross-country growth studies (see Bosworth and Collins, 2003, and others).
There are several potential explanations for this phenomenon. Some erosion of the labor share over time is consistent with the structural changes in the Mauritian economy, as the diversification from agriculture into textiles (a relatively more capital-intensive sector) was accompanied by the expansion of the capital stock, reducing the labor share in the

12
distribution of income. Attempts to limit real wage increases to less than productivity increases in order to preserve competitiveness may also have reduced labor’s share over time. The experience of Mauritius also matches a broader tendency of developing countries to have lower labor shares compared to industrial countries and to have those shares decline over time, as documented by Diwan (2001) and Harrison (2002). Harrison finds that higher trade and capital account openness tends to reduce the labor share.
However, according to Gollin (2002), the phenomenon could also be a statistical artifact, because the labor income of the self-employed is often treated incorrectly as capital income in national accounts. Indeed, according to Mauritian labor force surveys,9 the share of the self-employed workers in Mauritius increased from 13 percent in 1990 to 16 percent in 2000 and to 20 percent in 2010. By comparison, the self-employment rate in the United States in 2009 stood at 11 percent. According to Gollin’s adjustments, the labor share estimates in 1990 for Mauritius rise from 39 percent to (i) 49 percent if one imputes self-employed compensation from the overall labor compensation; (ii) 66.8 percent if one reallocates self-employed income into the labor and capital income according to the distribution in the rest of the economy; or (iii) 76.7 percent if one treats all self-employed income as labor income.
The self-employment adjustment argument suggests that the use of constant elasticities could be justifiable. In line with the literature, we chose that standard 35 percent capital share as our baseline. However, in our sensitivity tests we also use a range of the capital share α from 0.25 to 0.35 to 0.5. The results are not very sensitive to the level of the capital share, but if we use a higher capital share, it reduces the historical TFP estimates. For the projection horizon, using a higher capital share increases the contribution of capital, but when combined with lower TFP, it does not materially change the baseline growth projections.
9 The 2000 Housing and Population Census and the 2010 the Continuous Multi-Purpose Household Survey.
Figure 4. Compensation of Employees, 1975-2013
Labor’s share declined, possibly due to structural changes or measurement problems.
Sources: CSO; and authors’ calculations.
30
35
40
45
50
55
60
1975 1982 1989 1996 2003 2010
% of GDP, basic prices
% of expense
% of GDP, market prices

13
D. Human capital
We augment the standard production function with human capital to take into account Mauritius’ focus on creating a knowledge-based service economy. We chose this particular functional form–as opposed to, for example, using human capital as an additional factor of production–because we think of human capital as a measure of educational attainment that improves the quality of the workforce. As a result, the overall share of output going to labor input is still (1-α), but workers with more education receive a larger sub-share of this (1-α).
While there are different approaches to measuring the human capital (see Le et al., 2005 for a comprehensive survey), we chose one of the simpler and more transparent ones, with human capital evolving according to:
This measure quantifies the accumulated educational investment in the current labor force and assumes that the human capital embodied in the workers is proportional to the average
years of schooling ( they have attained, taking account of the return (r) to each year of schooling.10 Years of schooling are measured according to:
∑ ,
where Lt,i is the proportion of labor force participants with the ith level of schooling at time t and di is the duration in years of the ith level of schooling, which includes six years of primary, seven years of secondary, and three years of tertiary education.
10 An alternative specification could be 1 if we don’t assume continuous compounding.
2
4
6
8
10
12
14
0
10
20
30
40
50
60
1990 1993 1996 1999 2002 2005 2008
Primary Secondary TertiaryAverage years of schooling (right)
4
5
6
7
8
9
10
11
12
1960 1967 1974 1981 1988 1995 2002 2009
CSO ILOCohen & Soto Barro and LeeLutz et al. Aggregated
Figure 5. Education of Labor Force 1990-2010
Figure 6. Average years of Education 1960-2010
Sources: CSO; and authors’ calculations. Sources: CSO; Cohen and Soto; Barro and Lee; Lutz et al; and authors’ calculations.
14
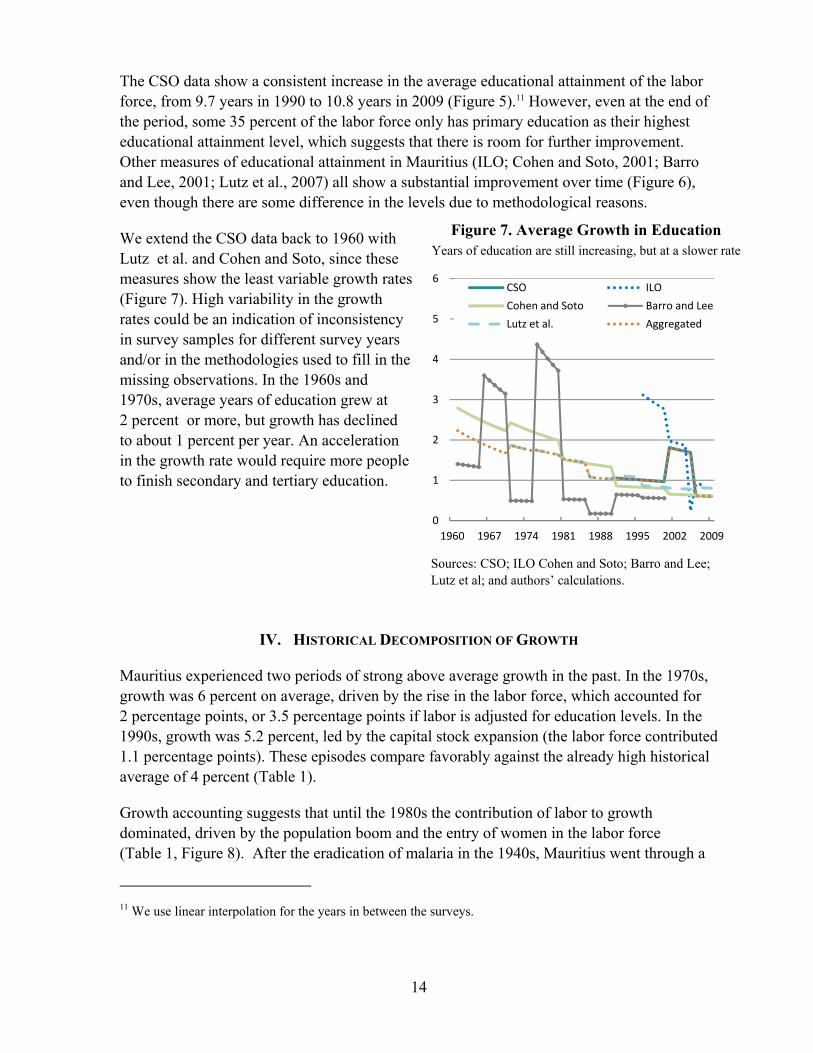
The CSO data show a consistent increase in the average educational attainment of the labor force, from 9.7 years in 1990 to 10.8 years in 2009 (Figure 5).11 However, even at the end of the period, some 35 percent of the labor force only has primary education as their highest educational attainment level, which suggests that there is room for further improvement. Other measures of educational attainment in Mauritius (ILO; Cohen and Soto, 2001; Barro and Lee, 2001; Lutz et al., 2007) all show a substantial improvement over time (Figure 6), even though there are some difference in the levels due to methodological reasons.
We extend the CSO data back to 1960 with Lutz et al. and Cohen and Soto, since these measures show the least variable growth rates (Figure 7). High variability in the growth rates could be an indication of inconsistency in survey samples for different survey years and/or in the methodologies used to fill in the missing observations. In the 1960s and 1970s, average years of education grew at 2 percent or more, but growth has declined to about 1 percent per year. An acceleration in the growth rate would require more people to finish secondary and tertiary education.
Sources: CSO; ILO Cohen and Soto; Barro and Lee; Lutz et al; and authors’ calculations.
IV. HISTORICAL DECOMPOSITION OF GROWTH
Mauritius experienced two periods of strong above average growth in the past. In the 1970s, growth was 6 percent on average, driven by the rise in the labor force, which accounted for 2 percentage points, or 3.5 percentage points if labor is adjusted for education levels. In the 1990s, growth was 5.2 percent, led by the capital stock expansion (the labor force contributed 1.1 percentage points). These episodes compare favorably against the already high historical average of 4 percent (Table 1).
Growth accounting suggests that until the 1980s the contribution of labor to growth dominated, driven by the population boom and the entry of women in the labor force (Table 1, Figure 8). After the eradication of malaria in the 1940s, Mauritius went through a
11 We use linear interpolation for the years in between the surveys.
0
1
2
3
4
5
6
1960 1967 1974 1981 1988 1995 2002 2009
CSO ILO
Cohen and Soto Barro and Lee
Lutz et al. Aggregated
Figure 7. Average Growth in Education Years of education are still increasing, but at a slower rate

15
dramatic demographic transition. In one year in the 1940s, the mortality rate declined by 30 percent. Population growth reached a peak of 4 percent in mid 1950s, making it one the highest in the world (Greenaway and Dabee, 2001). The population boom led to James Meade’s famous doomsayer prediction of Mauritius becoming a “case study in Malthusian economics.” However, fertility rates adjusted eventually and fell by 60 percent between 1962 and 1973, following extensive government programs to encourage family planning. Today, population growth is virtually zero.
A parallel demographic development was the entry of women into the labor force, with female participation rates rising by almost 60 percent between 1983 and 1999. The labor force successfully absorbed both the “baby boom” cohort and the additional female workers. This was made possible by the development of export-oriented, labor-intensive manufacturing with lower wages and more flexible labor markets, which was also part of the 3-pronged strategy proposed by Meade. As a result, employment gained so strongly that by the early 1990s unemployment was virtually eliminated (Figure 9) and Mauritius began importing labor. However, since the low in the early nineties, unemployment has increased from about 3 to over 8 percent in 2013, mostly driven by female and youth unemployment, which might reflect a problem of skill mix.12
12 See annex on labor markets in the 2013 Article IV consultation report.
1950s 1960s1/
1970s 1980s 1990s 2000s2/
Ave Hist Ave Hist
(1950-2013) (1960-2013)
Real growth, Y 1.1 2.4 6.3 5.6 5.6 4.2 4.2 5.0
Contribution of:
K 0.8 0.8 1.7 1.0 2.3 1.6 1.4 1.5
L* 2.6 3.5 2.8 1.8 1.6 … 2.4
A* 0.5 1.1 1.7 1.6 0.9 … 1.1
L 1.8 1.7 2.6 2.1 1.1 0.9 1.6 1.6
A -1.5 -0.1 2.0 2.5 2.3 1.7 1.2 1.9
Contribution of L = (1-α)dL/L
Contribution of K = α dK/K
Contribution of A = dY/Y - αdK/K - (1-α)dL/L
1/ The average contribution for 1960s does not add to average growth for the augmented model
because the human capital data start in 1961.
2/ Includes 2000-2013. Data on human capital for 2011-13 is based on baseline projections.
Table 1. Mauritius: Decomposing Historical Growth, 1951–2013
(Elasticity α = 0.35, depreciation δ = 7%)

16
Figure 8. Mauritius: Growth Decomposition, 1951–2013 (10-year rolling average of growth rates; elasticity α = 0.35, depreciation δ = 10%)
Figure 9. Labor Market Developments, 1960–2013
Sources: CSO; and authors’ calculations.
-2
0
2
4
6
8
1960 1970 1980 1990 2000 2010
Standard
K LA Y
-2
0
2
4
6
8
1960 1970 1980 1990 2000 2010
With Human Capital Augmented Labor
K L*A Y
-2
0
2
4
6
8
1960 1970 1980 1990 2000 2010
Growth Rate of InputsKLA
-2
0
2
4
6
8
1960 1970 1980 1990 2000 2010
Growth Rate of InputsKL*A
0
10
20
30
40
50
60
-5
0
5
10
15
20
25
1960 1970 1980 1990 2000 2010
Employment growth Population growthUnemployment rate Particip. rate (right)
0
5
10
15
20
25
1970 1975 1980 1985 1990 1995 2000 2005 2010
unemployment rate malefemale Real growth, 5yMA

17
Starting in the 1990s, capital-driven growth took over. Partly, this was driven by the decline in the role of labor, with the slowing population growth and rising unemployment (Figure 9). But mostly this was due to the dramatic boost to capital growth as Mauritius expanded its capital base by diversifying into textiles and later into the higher-end and more capital-intensive brackets of the sugar and textiles market. After an initial textile-driven expansion in the 1970s, capital accumulation slowed in the following decade as unutilized capacity was brought back into production following the 1980-81 crisis. But by the end of 1980s both public and private investment had picked up (Figure 8), with private investment almost doubling from 11.3 percent of GDP in 1982 to 20 percent in 1991. According to Subramanian and Roy (2001), the reinvestment sugar and textile profits played a crucial role in sustaining high levels of investment in Mauritius, with domestic rather than foreign savings financing investment during the growth boom.13 With the disappearance of the profits in sugar and textile in the 2000s, Mauritius relied increasingly on FDI inflows to finance investment. After having peaked at almost 8 percent in the late 1990s, the growth in the capital stock decline to about 4½ percent on average at present, which is still above the historical average.
Total factor productivity gained importance over time. Economic growth was primarily led by factor accumulation until the 1990s, which is consistent with Mauritius converging to a higher GDP per capita equilibrium in the standard Solow model. After the 1990s, however, productivity played a role similar to that of capital accumulation. As Figure 8 shows, TFP has become permanently higher than before, and has recently averaged 1 percent in the model with human capital, compared to an average of about a ¼ percent during the 1960s to
13 The 1980s were somewhat of a lost decade for Mauritius as the boom in sugar prices in 1973 and 1976 set of a fiscal expansion which was not reversed when the sugar boom turned around. As a result, by the 1980s, the fiscal deficit stood at 10 percent and current account deficit at 20 percent of the GDP respectively, the debt service ratio rose to 10 percent and inflation was 24 percent. A series of three IMF Stand-By Agreements and two World Bank Structural Adjustment Programs contributed to implementing macroeconomic and structural reforms that laid ground for the following strong performance.
0.25 0.35 0.50
Real growth, Y 5.0 5.0 5.0
Contribution of:
L* 2.8 2.4 1.8
L 1.9 1.6 1.2
K 1.0 1.4 2.0
A* 1.2 1.2 1.1
A 2.1 2.0 1.7
K 1.0 1.5 2.1
A* 1.2 1.1 1.1
A 2.1 1.9 1.7
K 1.1 1.5 2.1
A* 1.2 1.1 1.0
A 2.1 1.9 1.6
1/ Data on human capital for 2011-13 is based on
baseline projections.
10% depreciation
Table 2. Sensitivity, 1961-20131
Capital Share
5% depreciation
7% depreciation
18
1980s.14 Accounting for human capital (L*) results in lower productivity estimates since some of the growth is explained a more educated labor force, instead of ending up in the residual TFP calculation, but probably reflects the structure of the Mauritian economy better than the standard Solow model.
Larger capital shares (α) decrease the productivity estimates for the whole period, but not by much (Table 2). This is driven by the fact that overall, capital has been the fastest growing input. Giving capital a larger share in explaining GDP growth reduces the residual. However, the difference is only marginal. The largest difference is only 0.2 percentage points between a capital share of 50 percent versus 25 percent for the case of a 15 percent depreciation rate.15 Similarly, assuming a lower depreciation rate tends to have the same effect because it increases capital growth and hence reduces the residual.
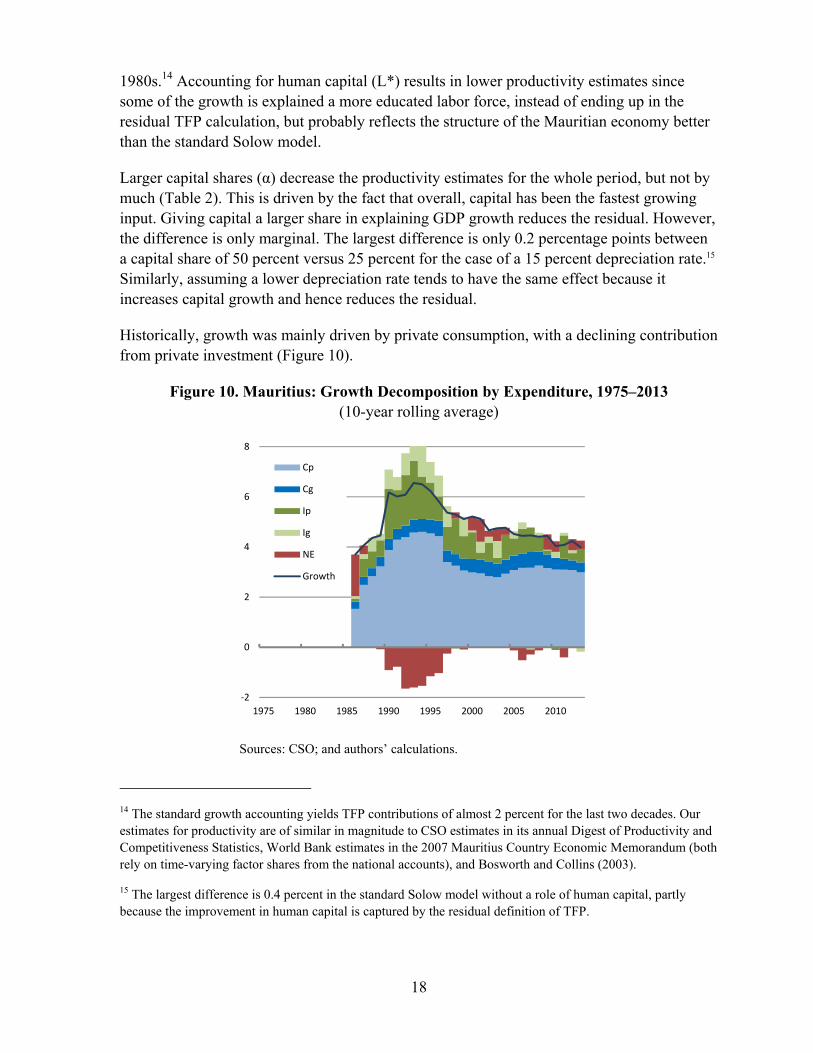
Historically, growth was mainly driven by private consumption, with a declining contribution from private investment (Figure 10).
Figure 10. Mauritius: Growth Decomposition by Expenditure, 1975–2013 (10-year rolling average)
Sources: CSO; and authors’ calculations.
14 The standard growth accounting yields TFP contributions of almost 2 percent for the last two decades. Our estimates for productivity are of similar in magnitude to CSO estimates in its annual Digest of Productivity and Competitiveness Statistics, World Bank estimates in the 2007 Mauritius Country Economic Memorandum (both rely on time-varying factor shares from the national accounts), and Bosworth and Collins (2003).
15 The largest difference is 0.4 percent in the standard Solow model without a role of human capital, partly because the improvement in human capital is captured by the residual definition of TFP.
-2
0
2
4
6
8
1975 1980 1985 1990 1995 2000 2005 2010
Cp
Cg
Ip
Ig
NE
Growth

19
V. BASELINE PROJECTION SCENARIO AND SENSITIVITY ANALYSIS
In our baseline projection, we look at the most likely ranges of growth for Mauritius over the next twenty years given various plausible assumptions regarding the growth of factor inputs and productivity. We explore optimistic and pessimistic scenarios in order to assess the sensitivity of the growth projections to input assumptions. Given the extent of transformation undergone and expected for the Mauritian economy, it is difficult to forecast growth with great confidence. Instead, the intent of this section is to explore the implications of a range of capital, labor, and productivity assumptions on the long-term growth trajectories, and to explore policy options to improve future outcomes.
In discussing our projections, we compare Mauritius with the experience of the four Asian Tigers: Hong Kong, Singapore, South Korea, and Taiwan. These were the first newly industrialized countries, noted for maintaining high growth rates between the 1960s and 1990s and graduating into high-income economies by the end of the century. All four countries have a highly educated and skilled workforce and have developed into leading international financial (Hong Kong and Singapore) and/or information technology (South Korea and Taiwan) centers.
A. Factor inputs Capital stock
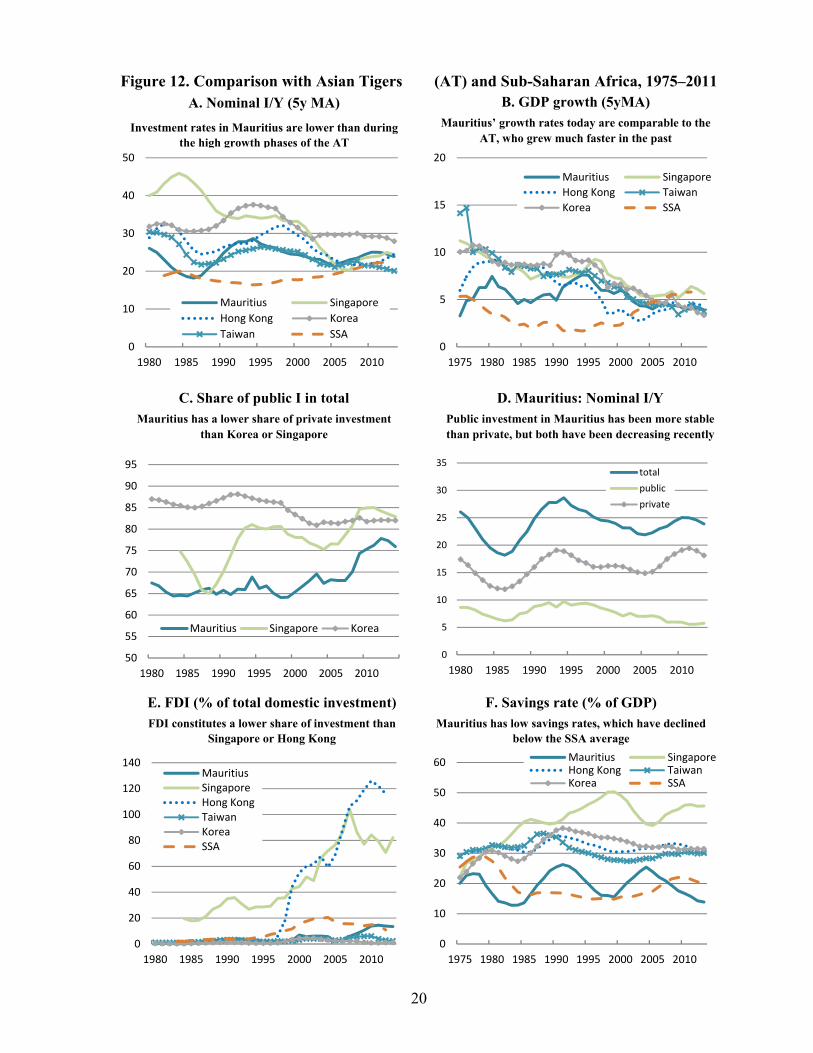
In our baseline, we assume a gradual increase in the investment ratio from 21 percent in 2013 to 25 percent by the end of 2033, which results in an average capital growth of 3.7 percent (Figure 11). The highest historical investment rate achieved by Mauritius was 30 percent in the 1990s, which is still at the lower bound of the investment rates achieved by the Asian Tigers (Figure 12.A).
Figure 11. Capital Growth Projections, 1975–2033
(Depreciation δ = 7%)
Sources: CSO; and authors’ calculations.
15
18
21
24
27
30
33
1976 1986 1996 2006 2016 2026
Nominal I/Y
-3
0
3
6
9
12
1976 1986 1996 2006 2016 2026
Real K growth
20
Figure 12. Comparison with Asian Tigers (AT) and Sub-Saharan Africa, 1975–2011
B. GDP growth (5yMA) Mauritius’ growth rates today are comparable to the
AT, who grew much faster in the past
A. Nominal I/Y (5y MA)
Investment rates in Mauritius are lower than during the high growth phases of the AT
0
10
20
30
40
50
1980 1985 1990 1995 2000 2005 2010
Mauritius Singapore
Hong Kong Korea
Taiwan SSA0
5
10
15
20
1975 1980 1985 1990 1995 2000 2005 2010
Mauritius Singapore
Hong Kong Taiwan
Korea SSA
50
55
60
65
70
75
80
85
90
95
1980 1985 1990 1995 2000 2005 2010
Mauritius Singapore Korea
0
5
10
15
20
25
30
35
1980 1985 1990 1995 2000 2005 2010
total
public
private
0
20
40
60
80
100
120
140
1980 1985 1990 1995 2000 2005 2010
MauritiusSingaporeHong KongTaiwanKoreaSSA
0
10
20
30
40
50
60
1975 1980 1985 1990 1995 2000 2005 2010
Mauritius SingaporeHong Kong TaiwanKorea SSA
C. Share of public I in total Mauritius has a lower share of private investment
than Korea or Singapore
D. Mauritius: Nominal I/Y Public investment in Mauritius has been more stable than private, but both have been decreasing recently
E. FDI (% of total domestic investment) FDI constitutes a lower share of investment than
Singapore or Hong Kong
F. Savings rate (% of GDP) Mauritius has low savings rates, which have declined
below the SSA average
21
In sensitivity tests, which are given by the upper and lower bounds of the projection cone in the charts, we look at the impact of increasing the investment rate to its historical maximum of 30 percent of GDP for the optimistic scenario and staying at the current level for the pessimistic scenario, which happens to be the most recent historical low of the 1990–2000s. Using the historical highs and lows for Mauritius seems a reasonable assumption. However, the international comparison shows that investment rates in some developing countries peaked around 35-40 percent (Dadush and Stancil, 2010), whereas developed countries invest approximately 20 percent of GDP each year.
Labor force
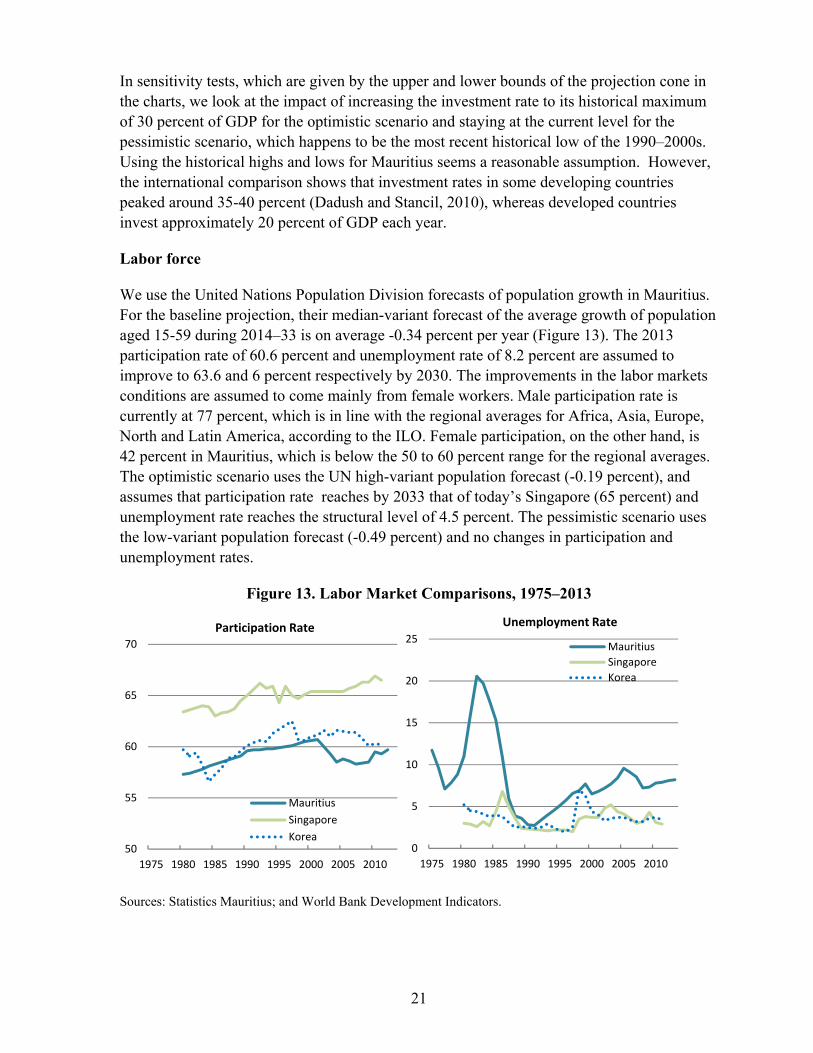
We use the United Nations Population Division forecasts of population growth in Mauritius. For the baseline projection, their median-variant forecast of the average growth of population aged 15-59 during 2014–33 is on average -0.34 percent per year (Figure 13). The 2013 participation rate of 60.6 percent and unemployment rate of 8.2 percent are assumed to improve to 63.6 and 6 percent respectively by 2030. The improvements in the labor markets conditions are assumed to come mainly from female workers. Male participation rate is currently at 77 percent, which is in line with the regional averages for Africa, Asia, Europe, North and Latin America, according to the ILO. Female participation, on the other hand, is 42 percent in Mauritius, which is below the 50 to 60 percent range for the regional averages. The optimistic scenario uses the UN high-variant population forecast (-0.19 percent), and assumes that participation rate reaches by 2033 that of today’s Singapore (65 percent) and unemployment rate reaches the structural level of 4.5 percent. The pessimistic scenario uses the low-variant population forecast (-0.49 percent) and no changes in participation and unemployment rates.
Figure 13. Labor Market Comparisons, 1975–2013
Sources: Statistics Mauritius; and World Bank Development Indicators.
50
55
60
65
70
1975 1980 1985 1990 1995 2000 2005 2010
Participation Rate
Mauritius
Singapore
Korea0
5
10
15
20
25
1975 1980 1985 1990 1995 2000 2005 2010
Unemployment Rate
Mauritius
Singapore
Korea
22
Human capital
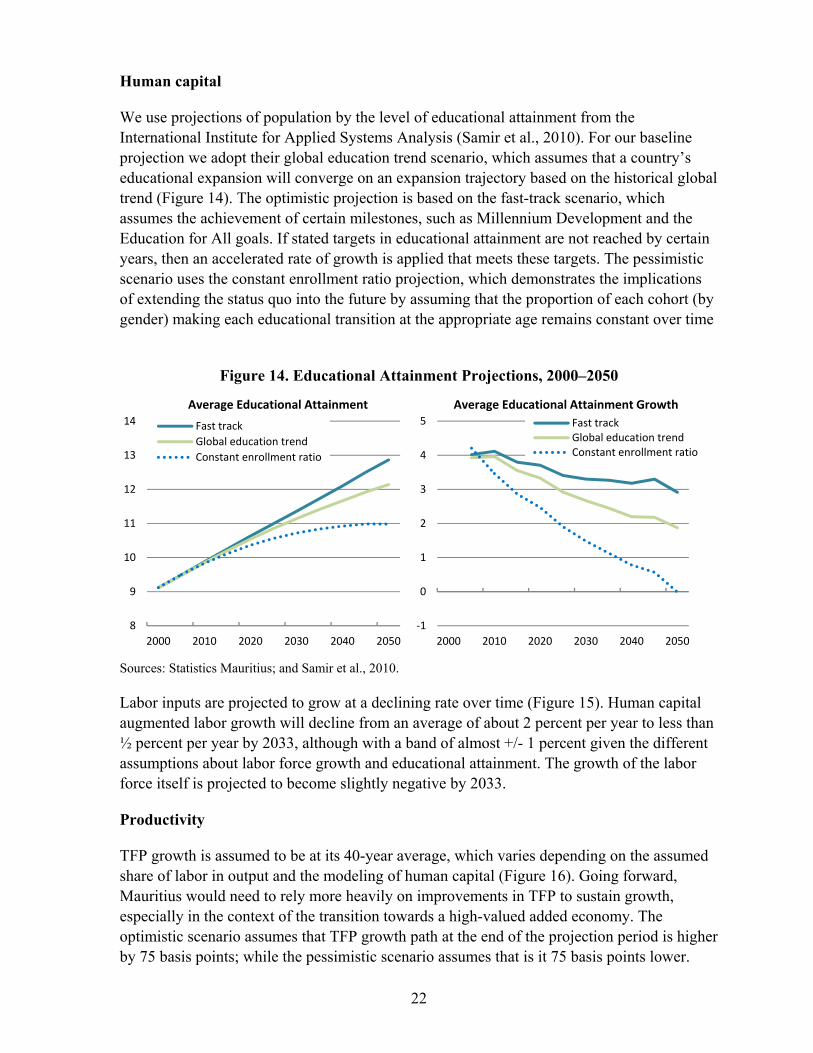
We use projections of population by the level of educational attainment from the International Institute for Applied Systems Analysis (Samir et al., 2010). For our baseline projection we adopt their global education trend scenario, which assumes that a country’s educational expansion will converge on an expansion trajectory based on the historical global trend (Figure 14). The optimistic projection is based on the fast-track scenario, which assumes the achievement of certain milestones, such as Millennium Development and the Education for All goals. If stated targets in educational attainment are not reached by certain years, then an accelerated rate of growth is applied that meets these targets. The pessimistic scenario uses the constant enrollment ratio projection, which demonstrates the implications of extending the status quo into the future by assuming that the proportion of each cohort (by gender) making each educational transition at the appropriate age remains constant over time
Figure 14. Educational Attainment Projections, 2000–2050
Sources: Statistics Mauritius; and Samir et al., 2010.
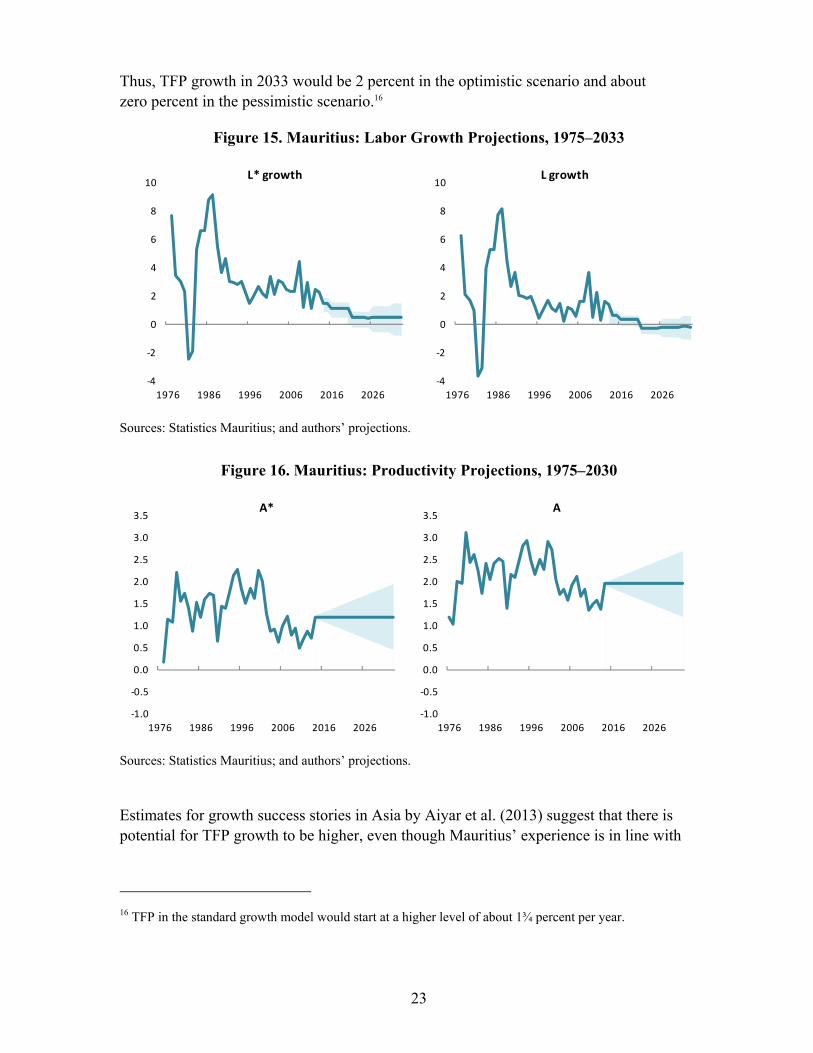
Labor inputs are projected to grow at a declining rate over time (Figure 15). Human capital augmented labor growth will decline from an average of about 2 percent per year to less than ½ percent per year by 2033, although with a band of almost +/- 1 percent given the different assumptions about labor force growth and educational attainment. The growth of the labor force itself is projected to become slightly negative by 2033.
Productivity
TFP growth is assumed to be at its 40-year average, which varies depending on the assumed share of labor in output and the modeling of human capital (Figure 16). Going forward, Mauritius would need to rely more heavily on improvements in TFP to sustain growth, especially in the context of the transition towards a high-valued added economy. The optimistic scenario assumes that TFP growth path at the end of the projection period is higher by 75 basis points; while the pessimistic scenario assumes that is it 75 basis points lower.
8
9
10
11
12
13
14
2000 2010 2020 2030 2040 2050
Average Educational Attainment
Fast track
Global education trend
Constant enrollment ratio
-1
0
1
2
3
4
5
2000 2010 2020 2030 2040 2050
Average Educational Attainment Growth
Fast trackGlobal education trendConstant enrollment ratio
23
Thus, TFP growth in 2033 would be 2 percent in the optimistic scenario and about zero percent in the pessimistic scenario.16
Figure 15. Mauritius: Labor Growth Projections, 1975–2033
Sources: Statistics Mauritius; and authors’ projections.
Figure 16. Mauritius: Productivity Projections, 1975–2030
Sources: Statistics Mauritius; and authors’ projections.
Estimates for growth success stories in Asia by Aiyar et al. (2013) suggest that there is potential for TFP growth to be higher, even though Mauritius’ experience is in line with
16 TFP in the standard growth model would start at a higher level of about 1¾ percent per year.
-4
-2
0
2
4
6
8
10
1976 1986 1996 2006 2016 2026
L growth
-4
-2
0
2
4
6
8
10
1976 1986 1996 2006 2016 2026
L* growth
-1.0
-0.5
0.0
0.5
1.0
1.5
2.0
2.5
3.0
3.5
1976 1986 1996 2006 2016 2026
A
-1.0
-0.5
0.0
0.5
1.0
1.5
2.0
2.5
3.0
3.5
1976 1986 1996 2006 2016 2026
A*

24
Singapore and Hong Kong (Figure 17). However, Taiwan and Korea achieved long-run TFP growth of almost 3 percentage points in per capita terms on average over 1970-2009.
Figure 17. Mauritius: International Comparison of TFP as the Driver of Growth
(Growth contribution in per capita terms)
B. Baseline growth projection
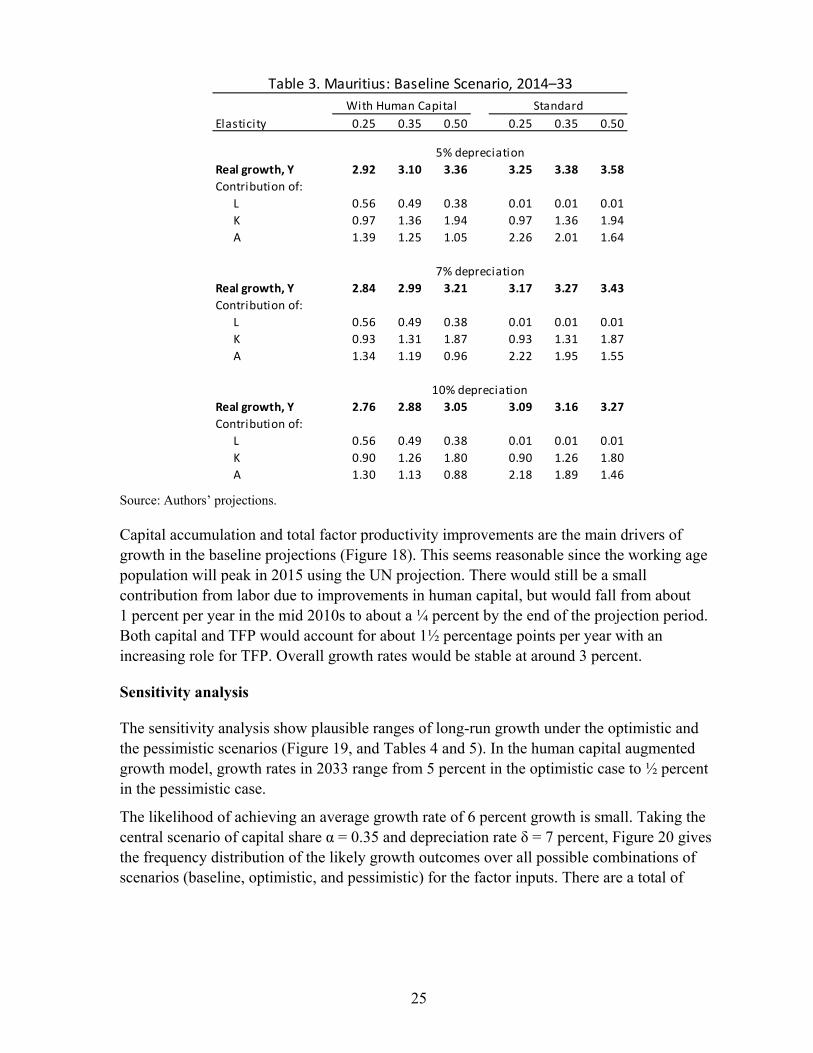
In the baseline, Mauritius’ long-run average growth rate is estimated at around 3 percent in the human capital augmented growth model (Table 3). The baseline assumptions result in a high estimate of 3.4 percent (5 percent depreciation and 50 percent capital share) and a low estimate of 2.7 percent (15 percent depreciation and 25 percent capital share).17 Increasing the share of capital in output, α, tends to increase the growth rate projections because while lowering the historical average estimate of TFP growth, it assigns a larger role to capital accumulation in explaining past growth rates. In general, higher depreciation rates tend to reduce growth projections by lowering capital stock growth.
17 In the standard Solow model, the baseline growth rate is 4 percent with a variation from 3.6 to 4.1 percent depending on capital share and depreciation assumptions. However, the human capital augmented growth model seems more appropriate for a knowledge intensive economy like Mauritius.
0
2
4
6
8
China Taiwan Korea Singapore Hong Kong India Mauritius
Contribution from labor Contribution from human capitalContribution from physical capital Contribution from TFPGDP/capita growth (in percent)
Source: Aiyar at al. (2013); authors' calculations.
Note: 1970 - 2013 averages for Mauritius. 1970 - 2009 averages for Asian countries,
where GDP growth is expressed in PPP terms.
25
Source: Authors’ projections.
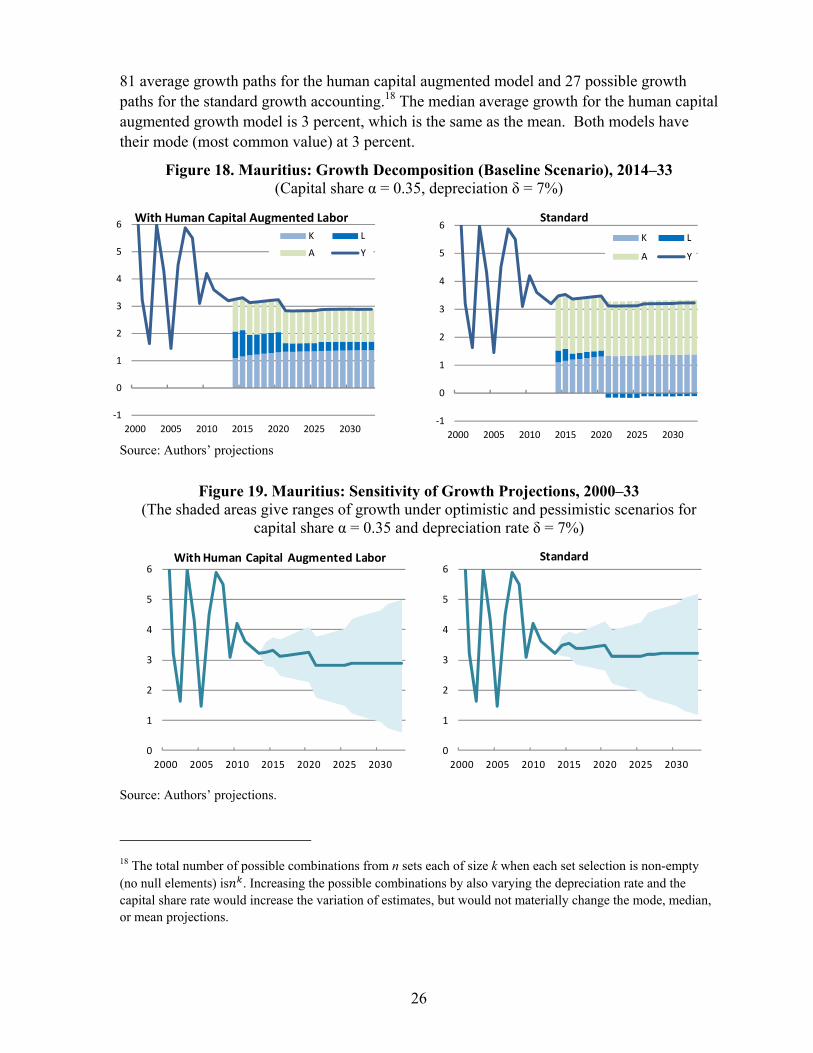
Capital accumulation and total factor productivity improvements are the main drivers of growth in the baseline projections (Figure 18). This seems reasonable since the working age population will peak in 2015 using the UN projection. There would still be a small contribution from labor due to improvements in human capital, but would fall from about 1 percent per year in the mid 2010s to about a ¼ percent by the end of the projection period. Both capital and TFP would account for about 1½ percentage points per year with an increasing role for TFP. Overall growth rates would be stable at around 3 percent.
Sensitivity analysis
The sensitivity analysis show plausible ranges of long-run growth under the optimistic and the pessimistic scenarios (Figure 19, and Tables 4 and 5). In the human capital augmented growth model, growth rates in 2033 range from 5 percent in the optimistic case to ½ percent in the pessimistic case.
The likelihood of achieving an average growth rate of 6 percent growth is small. Taking the central scenario of capital share α = 0.35 and depreciation rate δ = 7 percent, Figure 20 gives the frequency distribution of the likely growth outcomes over all possible combinations of scenarios (baseline, optimistic, and pessimistic) for the factor inputs. There are a total of
Elasticity 0.25 0.35 0.50 0.25 0.35 0.50
Real growth, Y 2.92 3.10 3.36 3.25 3.38 3.58
Contribution of:
L 0.56 0.49 0.38 0.01 0.01 0.01
K 0.97 1.36 1.94 0.97 1.36 1.94
A 1.39 1.25 1.05 2.26 2.01 1.64
Real growth, Y 2.84 2.99 3.21 3.17 3.27 3.43
Contribution of:
L 0.56 0.49 0.38 0.01 0.01 0.01
K 0.93 1.31 1.87 0.93 1.31 1.87
A 1.34 1.19 0.96 2.22 1.95 1.55
Real growth, Y 2.76 2.88 3.05 3.09 3.16 3.27
Contribution of:
L 0.56 0.49 0.38 0.01 0.01 0.01
K 0.90 1.26 1.80 0.90 1.26 1.80
A 1.30 1.13 0.88 2.18 1.89 1.46
Table 3. Mauritius: Baseline Scenario, 2014–33
With Human Capital Standard
7% depreciation
10% depreciation
5% depreciation
26
81 average growth paths for the human capital augmented model and 27 possible growth paths for the standard growth accounting.18 The median average growth for the human capital augmented growth model is 3 percent, which is the same as the mean. Both models have their mode (most common value) at 3 percent.
Figure 18. Mauritius: Growth Decomposition (Baseline Scenario), 2014–33 (Capital share α = 0.35, depreciation δ = 7%)
Source: Authors’ projections
Figure 19. Mauritius: Sensitivity of Growth Projections, 2000–33 (The shaded areas give ranges of growth under optimistic and pessimistic scenarios for
capital share α = 0.35 and depreciation rate δ = 7%)
Source: Authors’ projections.
18 The total number of possible combinations from n sets each of size k when each set selection is non-empty (no null elements) is . Increasing the possible combinations by also varying the depreciation rate and the capital share rate would increase the variation of estimates, but would not materially change the mode, median, or mean projections.
0
1
2
3
4
5
6
2000 2005 2010 2015 2020 2025 2030
With Human Capital Augmented Labor
0
1
2
3
4
5
6
2000 2005 2010 2015 2020 2025 2030
Standard
-1
0
1
2
3
4
5
6
2000 2005 2010 2015 2020 2025 2030
With Human Capital Augmented Labor
K L
A Y
-1
0
1
2
3
4
5
6
2000 2005 2010 2015 2020 2025 2030
Standard
K L
A Y

27
Figure 20. Frequency Distribution of Average Growth Rates (Capital share α = 0.35, depreciation δ = 7%)
Source: Authors’ projections.
Growth could approach 5 percent if the optimistic scenario materializes (Table 4). Interestingly, the estimate is not particularly sensitive to the choice of the depreciation rate and capital ratio with the highest average growth rate at 4.6 percent and the lowest at 3.9 percent in the AHCM. Roughly speaking (in the case of α = 0.35, δ = 7%), the largest contribution to growth would come from capital at about 1.7 percentage points, which underlines the importance of increasing savings and investment rates. Total factor productivity is similarly important at 1.5 percentage points, which would require significant improvements in the efficiency of resource allocation in the economy. Labor accounts for slightly less than 1 percentage points, of which half is expected to come from human capital accumulation as opposed to labor force increases.
In the pessimistic scenario growth might only be about 2 percent on average (Table 5). Most of the growth would still come from capital accumulation and TFP growth and little from labor. The pessimistic scenario is a reminder that good policies matter. In the optimistic scenario per-capita income in 2033 would be some 64 percent higher than in the pessimistic scenario (capital share α = 0.35 and depreciation rate δ = 7%). Alternatively, Mauritius would reach high-income status (US$12,616 or more in World Bank definition) in the year 2028 under the optimistic scenario, but only in the year 2036 in the pessimistic scenario.
0.00
0.05
0.10
0.15
0.20
0.25
0.30
0.35
2.0 2.5 3.0 3.5 4.0 4.5 5.0 5.5 6.0
With Human Capital Augmented Labor(81 combinations)
Mean = 3
0.00
0.05
0.10
0.15
0.20
0.25
0.30
0.35
0.40
2.0 2.5 3.0 3.5 4.0 4.5 5.0 5.5 6.0
Standard(27 combinations)
Mean = 2.9

28
Source: Authors’ projections.
Source: Authors’ projections.
Elasticity 0.25 0.35 0.50 0.25 0.35 0.50
Real growth, Y 4.01 4.23 4.56 4.23 4.42 4.70
Contribution of:
L 1.01 0.88 0.68 0.36 0.31 0.24
K 1.22 1.70 2.43 1.22 1.70 2.43
A 1.78 1.65 1.45 2.66 2.41 2.03
Real growth, Y 3.97 4.17 4.47 4.19 4.36 4.62
Contribution of:
L 1.01 0.88 0.68 0.36 0.31 0.24
K 1.12 1.71 2.44 1.22 1.71 2.44
A 1.60 1.58 1.35 2.61 2.34 1.94
Real growth, Y 3.94 4.13 4.41 4.16 4.32 4.56
Contribution of:
L 1.01 0.88 0.68 0.36 0.31 0.24
K 1.23 1.73 2.46 1.23 1.73 2.46
A 1.69 1.52 1.27 2.57 2.28 1.86
Table 4. Mauritius: Optimistic Scenario, 2014-33
With Human Capital Standard
7% depreciation
10% depreciation
5% depreciation
Elasticity 0.25 0.35 0.50 0.25 0.35 0.50
Real growth, Y 1.62 1.78 2.03 2.17 2.26 2.39
Contribution of:
L -0.09 -0.08 -0.06 -0.42 -0.36 -0.17
K 0.72 1.00 1.43 0.72 1.00 1.43
A 0.99 0.86 0.66 1.87 1.62 1.24
Real growth, Y 1.53 1.64 1.82 2.06 2.10 2.17
Contribution of:
L -0.07 -0.06 -0.05 -0.42 -0.36 -0.28
K 0.65 0.91 1.30 0.65 0.91 1.30
A 0.95 0.79 0.57 1.83 1.56 1.15
Real growth, Y 1.39 1.46 1.57 1.94 1.94 1.94
Contribution of:
L -0.09 -0.08 -0.06 -0.42 -0.36 -0.28
K 0.57 0.80 1.15 0.57 0.80 1.15
A 0.90 0.74 0.48 1.78 1.50 1.07
Table 5. Mauritius: Pessimistic Scenario, 2014-33
With Human Capital Standard
5% depreciation
7% depreciation
10% depreciation
29
VI. POLICY OPTIONS TO RAISE THE LONG-RUN GROWTH RATE
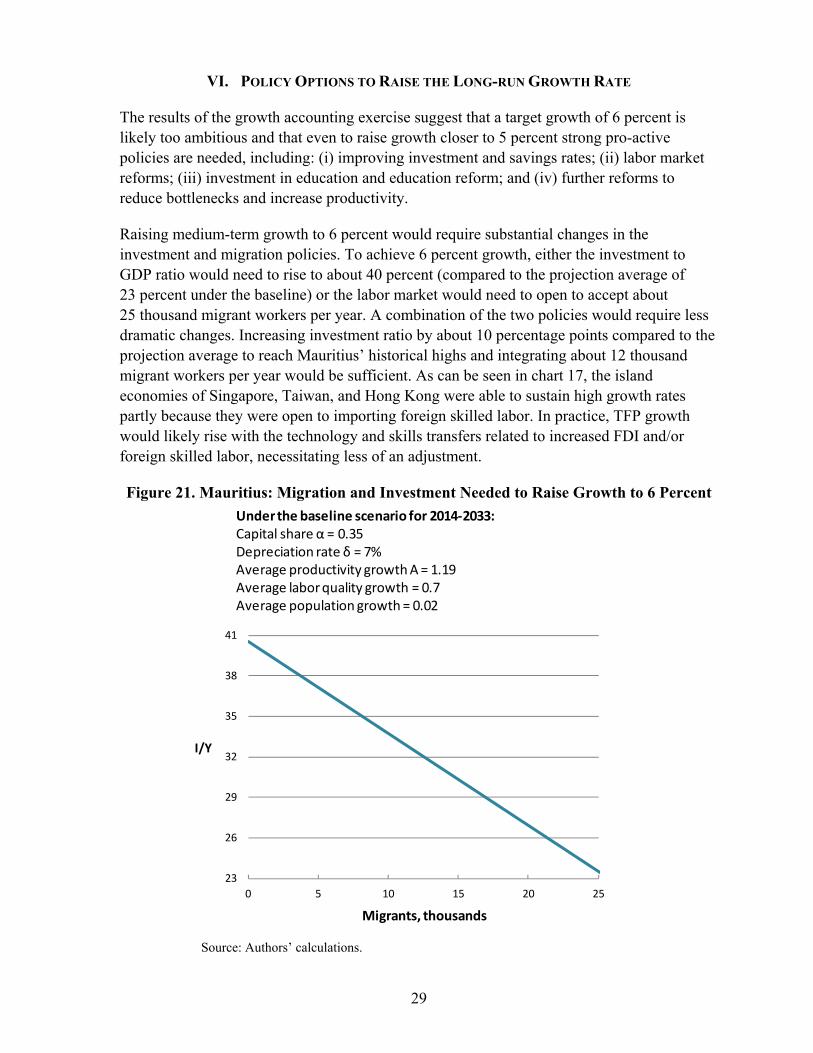
The results of the growth accounting exercise suggest that a target growth of 6 percent is likely too ambitious and that even to raise growth closer to 5 percent strong pro-active policies are needed, including: (i) improving investment and savings rates; (ii) labor market reforms; (iii) investment in education and education reform; and (iv) further reforms to reduce bottlenecks and increase productivity.
Raising medium-term growth to 6 percent would require substantial changes in the investment and migration policies. To achieve 6 percent growth, either the investment to GDP ratio would need to rise to about 40 percent (compared to the projection average of 23 percent under the baseline) or the labor market would need to open to accept about 25 thousand migrant workers per year. A combination of the two policies would require less dramatic changes. Increasing investment ratio by about 10 percentage points compared to the projection average to reach Mauritius’ historical highs and integrating about 12 thousand migrant workers per year would be sufficient. As can be seen in chart 17, the island economies of Singapore, Taiwan, and Hong Kong were able to sustain high growth rates partly because they were open to importing foreign skilled labor. In practice, TFP growth would likely rise with the technology and skills transfers related to increased FDI and/or foreign skilled labor, necessitating less of an adjustment.
Figure 21. Mauritius: Migration and Investment Needed to Raise Growth to 6 Percent
23
26
29
32
35
38
41
0 5 10 15 20 25
I/Y
Migrants, thousands
Underthe baseline scenario for 2014-2033:Capital share α = 0.35 Depreciation rate δ = 7%Average productivity growth A = 1.19Average labor quality growth = 0.7Average population growth = 0.02
Source: Authors’ calculations.
30
A. Investment and capital formation
There is a need to upgrade and expand the country’s capital stock, especially infrastructure, in order to improve competitiveness and facilitate transformation into a knowledge-based economy. Improving the investment rates would need to be accomplished through (i) acceleration in the implementation of current investment projects; and (ii) further measures to encourage FDI and domestic savings. On the side of the public sector, while the government has planned a large infrastructure investment program to alleviate road congestion and increase other infrastructure capacity (port, airport, power sector), actual expenditure from the capital budget has been low, highlighting design and implementation capacity constraints. Looking forward, investments would need to be financed through other channels, given low fiscal space due to the need to reduce the public debt levels, in accordance with the Debt Law.
A comparison of Mauritius and the Asian Tigers suggests that investment rates and FDI seem to have played a significant role in explaining growth. Both investment rates and FDI’s share in investment were relatively low in Mauritius compared to Singapore and Hong Kong (Figures 12.A and 12.E).
Tapping into these other channels of investment funds – private domestic savings and FDI – would require some policy actions. Even though Mauritius boasts a well developed financial sector relative to the rest of Sub-Saharan Africa, the domestic savings rate has been low and falling, compared to the Asian Tigers (Figure 12.F). Over longer periods, there is a close empirical relationship between investment and savings, and it would be desirable for savings rates to return from the current low levels of about 15 percent of GDP to historical levels of around 25 percent. In this respect, medium-term fiscal adjustment and pension reform could help increase the savings rate.19
Historically, FDI played a role not so much through facilitating the investment rates, but through technology transfers. For example, while the FDI from Hong Kong based textile producers in the 1980s helped establish the EPZ, its share in domestic investment never exceeded 6 percent. Improvements in the business environment in the 2000s, combined with economic and political stability and spillovers from the double taxation treaties, increased the share of FDI in domestic investment to 20 percent by 2010. Yet, it is only a fifth of similar ratios for Singapore and Hong Kong (Figure 12.E) and further increases would benefit both investment rates and technology transfers.
The World Bank Ease of Doing Business survey gives relatively good ratings to Mauritius in general, but it also indicates that Mauritius still has some room for improvement in the access
19 See appendix on pension reform in IMF (2013) – Mauritius 2013 Article IV Consultation, IMF Country Report No. 13/97.
31
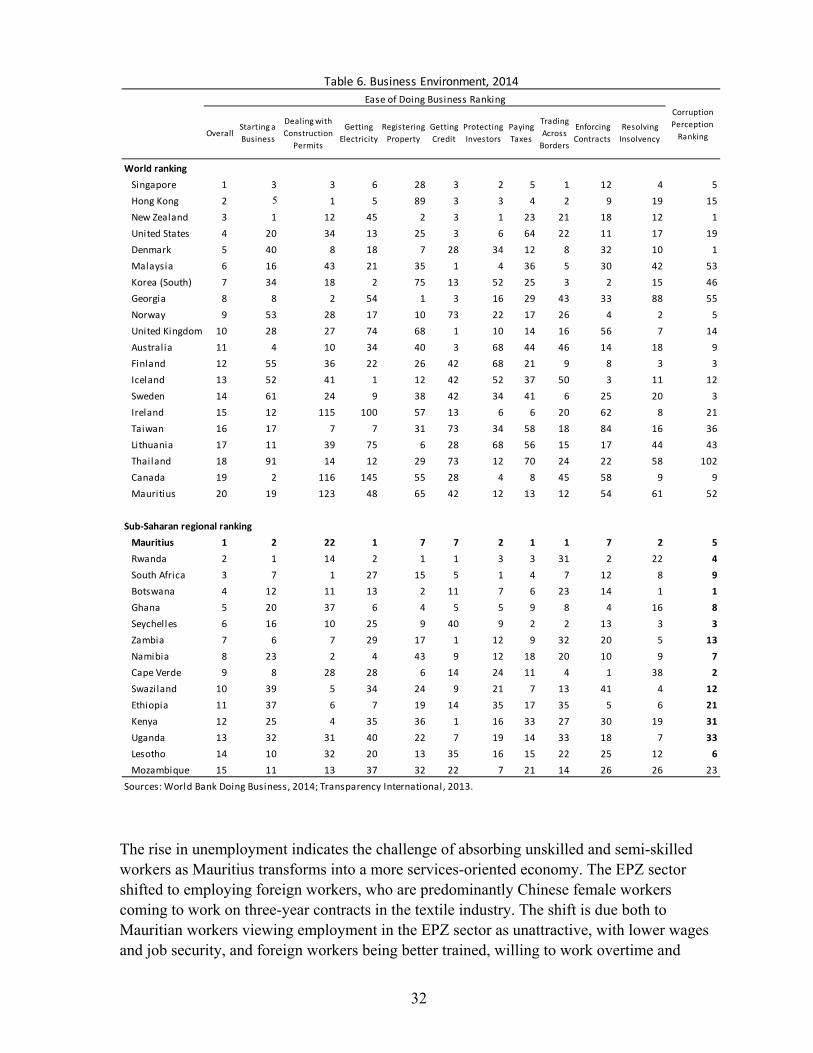
to credit subcategory of the business environment, ranking only 9th in Africa and 53rd in the world on this subcategory in 2013 (Table 6). Access to credit category describes the legal rights of borrowers and lenders with respect to secured transactions and the sharing of credit information. It measures how well collateral and bankruptcy laws facilitate lending, as well as the coverage, scope and accessibility of credit information available through public credit registries and private credit bureaus. According to Djankov et al. (2007), both creditor protection through the legal system and information sharing institutions are associated with higher ratios of private credit to GDP. They also show that credit rises after improvements in creditor rights and in information sharing. Improving the business and investment climate would benefit both capital accumulation and TFP growth, particularly because there is learning through investment.
B. Labor market
The labor market in Mauritius since the 1990s has been characterized by a rising share of foreign workers in the labor force (from 0.2 percent in 1990 to 4 percent in 2009) and a rise in female unemployment over the same horizon from 2 to over 10 percent, driving up the total unemployment rate to over 8 percent in 2013. At the same time, increased demand for skilled workers in the financial services, ITC, and tourism sectors relative to the low-skilled textile and sugar sectors.
On paper, the labor market appears highly regulated and complex. The government establishes a separate set of labor market regulations, called Remuneration Orders, for each industry, which specify the exact duties and compensation scheme for every type of worker. However, World Bank (2007) shows that there is but a tenuous relation between the orders and actual salary outcomes, while the skill premium in different industry pay schemes is actually substantial. Furthermore, the introduction of the National Pay Council in 2006 has helped to better link wage growth to productivity advancements, with wage adjustments differentiated across sectors, thereby reducing wage rigidity and containing the wage-price spiral. However, the reversal to the older system of the national tripartite negotiations in 2010 may make it more difficult to maintain competitiveness. Under the old system, wage increases were linked to the CPI, and real wages grew much faster than labor productivity in 2000–2006.
A rigid system of determining pay increases and complex labor regulations tend to limit the ability of the economy to undergo structural changes by reducing the ability and incentives to create new jobs and explore new opportunities. The absence of collective bargaining at the firm level prevents firm- and sector-specific factors to be taken into account, for example relative productivity increases. While an appropriate balance between worker protection and labor market flexibility has to be found, in the longer term, the labor market needs to support flexibility, reward higher productivity and support expansion into more innovative activities to enable the transition to the knowledge-based economy. In that process, the concept of protecting the worker, but not the specific job could be the guiding principle in judging labor market reforms.
32
The rise in unemployment indicates the challenge of absorbing unskilled and semi-skilled workers as Mauritius transforms into a more services-oriented economy. The EPZ sector shifted to employing foreign workers, who are predominantly Chinese female workers coming to work on three-year contracts in the textile industry. The shift is due both to Mauritian workers viewing employment in the EPZ sector as unattractive, with lower wages and job security, and foreign workers being better trained, willing to work overtime and
OverallStarting a
Business
Dealing with
Construction
Permits
Getting
Electricity
Registering
Property
Getting
Credit
Protecting
Investors
Paying
Taxes
Trading
Across
Borders
Enforcing
Contracts
Resolving
Insolvency
World ranking
Singapore 1 3 3 6 28 3 2 5 1 12 4 5
Hong Kong 2 5 1 5 89 3 3 4 2 9 19 15
New Zealand 3 1 12 45 2 3 1 23 21 18 12 1
United States 4 20 34 13 25 3 6 64 22 11 17 19
Denmark 5 40 8 18 7 28 34 12 8 32 10 1
Malaysia 6 16 43 21 35 1 4 36 5 30 42 53
Korea (South) 7 34 18 2 75 13 52 25 3 2 15 46
Georgia 8 8 2 54 1 3 16 29 43 33 88 55
Norway 9 53 28 17 10 73 22 17 26 4 2 5
United Kingdom 10 28 27 74 68 1 10 14 16 56 7 14
Australia 11 4 10 34 40 3 68 44 46 14 18 9
Finland 12 55 36 22 26 42 68 21 9 8 3 3
Iceland 13 52 41 1 12 42 52 37 50 3 11 12
Sweden 14 61 24 9 38 42 34 41 6 25 20 3
Ireland 15 12 115 100 57 13 6 6 20 62 8 21
Taiwan 16 17 7 7 31 73 34 58 18 84 16 36
Lithuania 17 11 39 75 6 28 68 56 15 17 44 43
Thailand 18 91 14 12 29 73 12 70 24 22 58 102
Canada 19 2 116 145 55 28 4 8 45 58 9 9
Mauritius 20 19 123 48 65 42 12 13 12 54 61 52
Sub-Saharan regional ranking
Mauritius 1 2 22 1 7 7 2 1 1 7 2 5
Rwanda 2 1 14 2 1 1 3 3 31 2 22 4
South Africa 3 7 1 27 15 5 1 4 7 12 8 9
Botswana 4 12 11 13 2 11 7 6 23 14 1 1
Ghana 5 20 37 6 4 5 5 9 8 4 16 8
Seychelles 6 16 10 25 9 40 9 2 2 13 3 3
Zambia 7 6 7 29 17 1 12 9 32 20 5 13
Namibia 8 23 2 4 43 9 12 18 20 10 9 7
Cape Verde 9 8 28 28 6 14 24 11 4 1 38 2
Swaziland 10 39 5 34 24 9 21 7 13 41 4 12
Ethiopia 11 37 6 7 19 14 35 17 35 5 6 21
Kenya 12 25 4 35 36 1 16 33 27 30 19 31
Uganda 13 32 31 40 22 7 19 14 33 18 7 33
Lesotho 14 10 32 20 13 35 16 15 22 25 12 6
Mozambique 15 11 13 37 32 22 7 21 14 26 26 23
Sources: World Bank Doing Business, 2014; Transparency International, 2013.
Table 6. Business Environment, 2014
Ease of Doing Business RankingCorruption
Perception
Ranking
33
providing a more flexible labor input due to the short-term nature of their contracts. Structural unemployment can be addressed through retraining programs and improving alternative venues of employment, such as improving the business environment for the SMEs with the Business Facilitation Act of 2006. SMEs and self-employment are considered to be substantial channel of job creation for this skill group.
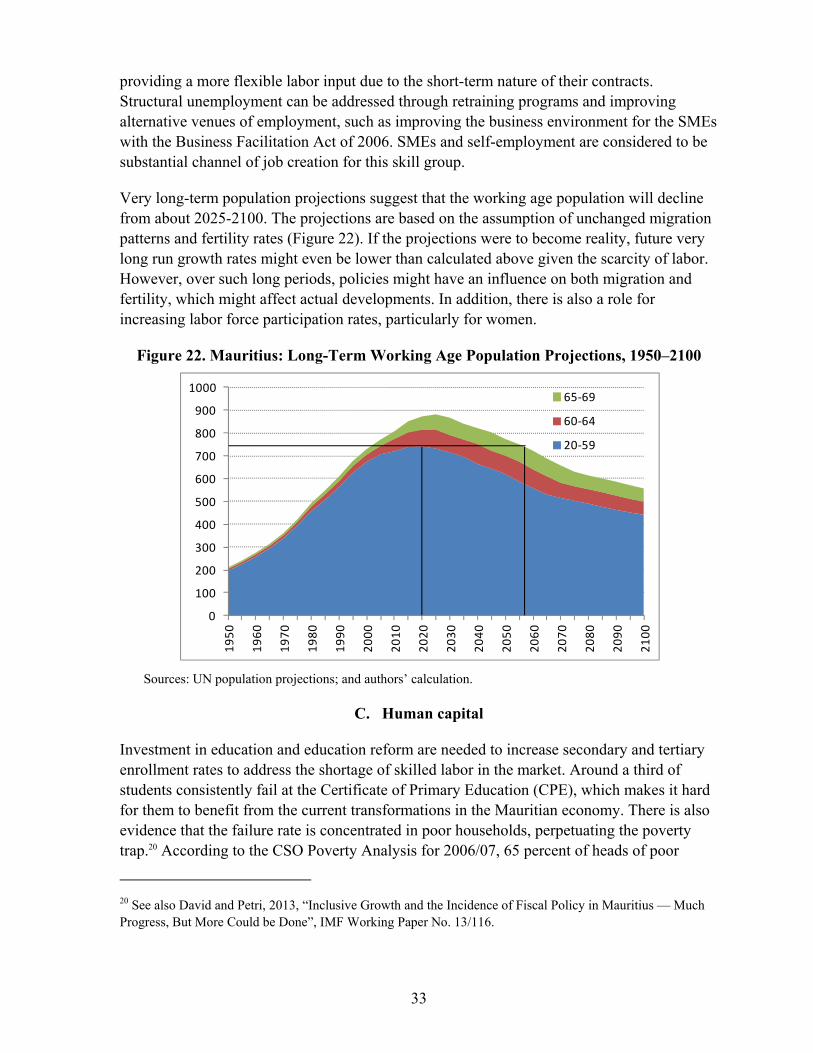
Very long-term population projections suggest that the working age population will decline from about 2025-2100. The projections are based on the assumption of unchanged migration patterns and fertility rates (Figure 22). If the projections were to become reality, future very long run growth rates might even be lower than calculated above given the scarcity of labor. However, over such long periods, policies might have an influence on both migration and fertility, which might affect actual developments. In addition, there is also a role for increasing labor force participation rates, particularly for women.
Figure 22. Mauritius: Long-Term Working Age Population Projections, 1950–2100
Sources: UN population projections; and authors’ calculation.
C. Human capital
Investment in education and education reform are needed to increase secondary and tertiary enrollment rates to address the shortage of skilled labor in the market. Around a third of students consistently fail at the Certificate of Primary Education (CPE), which makes it hard for them to benefit from the current transformations in the Mauritian economy. There is also evidence that the failure rate is concentrated in poor households, perpetuating the poverty trap.20 According to the CSO Poverty Analysis for 2006/07, 65 percent of heads of poor
20 See also David and Petri, 2013, “Inclusive Growth and the Incidence of Fiscal Policy in Mauritius — Much Progress, But More Could be Done”, IMF Working Paper No. 13/116.
0
100
200
300
400
500
600
700
800
900
1000
19
50
19
60
19
70
19
80
19
90
20
00
20
10
20
20
20
30
20
40
20
50
20
60
20
70
20
80
20
90
21
00
65-69
60-64
20-59

34
households and 60 percent of poor households’ members (aged 20 and over) haven’t passed the CPE, compared to the 39 and 34 percent of the national average. There were more visible improvements in tertiary enrollment, with the rate rising from 3 to 43 percent between 1990 and 2009. Still, enrollment rate translate very slowly into the educational attainment of the labor force. While the share of the labor force with only primary education decreased by 20 percent between 1990 and 2010, it is still 3.5 times higher than in the Asian Tigers, where only about 10 percent of the working population has only primary education (Figure 23). In contrast, tertiary attainment is only 10 percent in Mauritius but 30 percent for the Asian Tigers (AT). There is therefore considerable scope to improve educational attainment in Mauritius. Moreover, educational reforms are needed to provide the work force with appropriate and relevant skills.
Figure 23. Mauritius: International Comparison of Educational Attainment
(Share in total population aged 15-64)
Mauritius still needs to increase secondary and tertiary enrollment rates compared to the AT.
Sources: Statistics Mauritius; and Samir et al., 2010.
-0.1
0.0
0.1
0.2
0.3
0.4
0.5
0.6
0.7
1970 1980 1990 2000 2010
Mauritus
primary
secondary
tertiary
-0.1
0.0
0.1
0.2
0.3
0.4
0.5
0.6
0.7
1970 1980 1990 2000 2010
Singapore
primary
secondary
tertiary
0.0
0.1
0.2
0.3
0.4
0.5
0.6
0.7
1970 1980 1990 2000 2010
Hong Kong
primarysecondarytertiary
0.0
0.1
0.2
0.3
0.4
0.5
0.6
0.7
1970 1980 1990 2000 2010
Korea
primary
secondary
tertiary
35
D. Productivity
With the labor no longer the driver of growth and with capital formation limited by investment rates, a significant part of future growth would need to come through the productivity improvements, especially in the context of the transition towards a high-income economy. Here, there is scope for further reforms to reduce bottlenecks and increase productivity via: (i) upgrades and restructuring of public utilities; (ii) public enterprise reform; (iii) investments in road decongestion; (iv) a growth friendly tax regime; (v) growth-enhancing public expenditures; and (vi) further improvements in the business environment.
Public sector performance is emerging as a binding constraint on growth. Public utilities that provide critical services such as water and electricity need to become more efficient and have their infrastructure upgraded.21 For example, while all population has access to safe potable water, it is not unusual to have water rationing, especially during the dry season, both due to water losses as a result of leakage and to non-market tariff schedule. Public enterprises control significant parts of the Mauritian economy and do not always address market failures or operate according to market principles. Reforms in that sector could increase efficiency and create fiscal space for more productive spending.22 Investment in the road and public transport system would go a long way in reducing traffic jams in and out of Port Louis and optimizing the national road system, designed for quick access to sugar plantation, which no longer form the basis of the economy.
Mauritius has a well-functioning tax system with low and stable rates, but some further improvements could be made. For example, the tax system could be made greener through appropriate taxes on energy and congestion; further broadening of the VAT; reduction in tax exemptions for civil servants, and more reliance on real estate taxes.23 Likewise, there is substantial scope to create fiscal space through social benefit reform, which is badly targeted at the moment, but consumes substantial fiscal resources. Means-testing of benefits and better targeting to the truly poor would allow higher expenditure allocations to human and physical capital.
While Mauritius has made significant leaps in improving its business environment with the Business Facilitation Act of 2006, there is still room for further reforms in getting credit, enforcing contracts, closing a business, and registering property (Table 6). The hoped for transition to a knowledge-based higher value added economy will need to rely also on private
21 See also appendix on physical infrastructure needs and pricing policies in IMF (2013) – Mauritius 2013 Article IV Consultation, IMF Country Report No. 13/97.
22 See also appendix on state-owned enterprises in IMF (2012) – Mauritius 2012 Article IV Consultation, IMF Country Report No. 12/62.
23 See Parry (2011), “Reforming the Tax System to Promote Environmental Objectives: An Application to Mauritius”, IMF Working Paper No. 11/124.
36
sector discovery as a source of growth, facilitating technology absorption. Mauritius needs to maintain its positioning as a friendly and progressive environment for private sector development in order to tap into firms from India and China wishing to do business in Africa.
VII. CONCLUSION
Mauritius has done well in the past, anticipating and aggressively tackling change. Its transition into the high-middle income group was underpinned by creating a well-managed Export Processing Zone, conducting diplomacy regarding trade preferences, spending on education, avoiding currency overvaluation, and facilitating business. The question of when it will be able to join high income country status will depend on its ability to improve the skill set of its labor force, the quality of infrastructure, and the speed of technology adoption. Further improvements in business environment will be essential to attract FDI, generate domestic investment, and maintain and improve on Mauritius’ image as an open, stable, and well-functioning place to do business. For the longer term, policies to attract foreign high skilled labor, increase fertility rates and labor force participation should also be analyzed. Finally, reforms for pensions, public enterprises, social benefits, and the tax system can make the public sector more efficient, while macro policies to increase public and private savings can create the room for further productive investments.
37
REFERENCES
Aiyar, S, Duval, R., Puy, D, Wu, Y., and L. Zhang, 2013. “Growth Slowdowns and the Middle-Income Trap”, IMF Working Paper No. 13/71, March.
Barro, R. J. and J. W. Lee, 2001. “International data on educational attainment: Updates and implications.” Oxford Economic Papers 53(3): 541-563.
Bosworth, B. P., and S.M. Collins, 2003. "The Empirics of Growth: An Update," Brookings Papers on Economic Activity, vol. 34(2003–2), pages 113–206.
Bu, Y., 2006. "Fixed capital stock depreciation in developing countries: Some evidence from firm level data," The Journal of Development Studies, Taylor and Francis Journals, vol. 42(5), pages 881-901, July.
Central Statistics Office, 2010. “Digest of Productivity and Competitiveness Statistics, 2009.” Mauritius.
Central Statistics Office, 2009. “Poverty Analysis 2006/07.” Mauritius.
Cohen, D. and M. Soto, 2007. "Growth and human capital: good data, good results," Journal of Economic Growth, Springer, vol. 12(1), pages 51-76, March.
Dadush, U. and B. Stancil, 2010. “The World Order in 2050.” Carnegie Endowment for International Peace Policy Outlook.
Day-Hookoomsing, P. and V. Essoo, 2003. “Promoting Female Entrepreneurship in Mauritius: Strategies in Training and Development.” SEED Working Paper No. 58, ILO.
David, A. and M. Petri, 2013, “Inclusive Growth and the Incidence of Fiscal Policy in Mauritius — Much Progress, But More Could be Done”, IMF Working Paper No. 13/116, May.
Diwan, I., 2001. “Debt as Sweat: Labor, financial crises, and the globalization of capital.” Washington D.C.: World Bank, mimeo.
Djankov, S., McLiesh, C., and A. Shleifer, 2007. "Private credit in 129 countries," Journal of Financial Economics, Elsevier, vol. 84(2), pages 299–329, May.
Frankel, J. A., 2010. "Mauritius: African Success Story," NBER Working Papers 16569, National Bureau of Economic Research, Inc.
Gollin, D., 2002."Getting Income Shares Right," Journal of Political Economy, University of Chicago Press, vol. 110(2), pages 458-474, April.

38
Greenaway, D. and Dabee, R. (eds), 2001. The Mauritian Economy: A Reader, Palgrave: London, 2002.
Harrison, A.E., 2002. “Has Globalization Eroded Labor’s Share? Some Cross-Country Evidence.” Berkeley, CA: University of California at Berkeley and NBER, mimeo.
Iman, P., and C. Minoiu, 2008, “Mauritius: A Competitiveness Assessment,” IMF working paper 08/212, Sept.
International Monetary Fund, 2013, “Mauritius: 2013 Article IV Consultation”, IMF Country Report No. 13/97, April.
International Monetary Fund, 2012, “Mauritius: 2012 Article IV Consultation”, IMF Country Report No. 12/62, March.
Lutz, A., Goujon, S K.C., and W Sanderson, 2007. “Reconstruction of population by age, sex and level of educational attainment of 120 countries for 1970–2000.” Vienna Yearbook of Population Research, vol. 2007, pp 193–235.
Mankiw, N., Romer, D., and D. Weil, 1992. "A Contribution to the Empirics of Economic Growth," The Quarterly Journal of Economics, MIT Press, vol. 107(2), pages 407–37, May.
McDonald, C. and J. Yao, 2003. "Mauritius: Unemployment and the Role of Institutions," IMF Working Papers 03/211, International Monetary Fund.
Meade, J.E., 1961. “Mauritius: a Case Study in Malthusian Economics,” Economic Journal, 71, 233–35.
Meade, J.E., et al., 1961. “The Economic and Social Structure of Mauritius – Report to the Government of Mauritius,” London: Metheun.
Mauritius Commercial Bank, 2013. “Mauritius Inc. – The Challenge of Investing in Growth”, MCB Focus, Occasional Paper No. 55, October 2013.
Narrainen, Streevarsen Pillay, 2013, “Industrialization: The Mauritian Model” in Stiglitz et al., eds, “The Industrial Policy Revolution II: Africa in the Twenty-first Century”, Palgrave Macmillan, pp. 572-87.
Nehru, V. and A. Dhareshwar, 1993. “A New Database on Physical Capital Stock: Sources, Methodology, and Results,” Rivista de Analisis Economico, 8, 37-59.
Odit, M. P. , Dookhan, K. and S. Fauzel, 2010. “The Impact of Education on Economic Growth- The Case of Mauritius.” International Business & Economics Research Journal (IBER), North America, 9, Dec. 2010.

39
Parry, Ian, 2011, “Reforming the Tax System to Promote Environmental Objectives: An Application to Mauritius”, IMF Working Paper No. 11/124, June.
Porter, N., 2004, “Wage compression, employment restrictions and unemployment: the case o f Mauritius,” IMF Working Paper WP/04/205
Psacharopoulos, G. and H. A. Patrinos, 2004. "Returns to investment in education: a further update," Education Economics, Taylor and Francis Journals, vol. 12(2), pages 111–134, August.
Romer, P., 1992. “Two Strategies for Economic Development: Using Ideas and Producing Ideas,” Proceedings of the World Bank Annual Conference on Development Economics.
Sachs, J. D. and A. Warner, 1995, "Economic Reform and the Process of Global Integration (with comments and discussion)" Brookings Papers on Economic Activity 1 1–118.
Sachs, J. and A. Warner, 1997, “Sources of Slow Growth in African Economies,” Journal of African Economies, Vol. 6, pp. 335-76.
Samir, K.C., Barakat, B., Goujon, A., Skirbekk, V., Sanderson, W. and W. Lutz, 2010. “Projection of populations by level of educational attainment, age, and sex for 120 countries for 2005–2050.” Demographic Research 22(15): 383-472
Subramanian, A., 2001, “Mauritius: A Case Study,” Finance and Development, IMF, Dec., 38, no. 4.
Subramanian, A, 2009, “The Mauritian Success Story and Its Lessons,” UN/WIDER Research Paper No. 2009/36 2009.
Subramanian, A. and D. Roy, 2001. "Who Can Explain the Mauritian Miracle: Meade, Romer, Sachs, or Rodrik?," IMF Working Paper 01/116, International Monetary Fund.
Stiglitz, J., 2011. “The Mauritius Miracle.” Project Syndicate, 2011.
Trinh Le, J.G. and L.Oxley, 2005. "Measures of human capital: A review of the literature," Treasury Working Paper Series 05/10, New Zealand Treasury.
World Bank, 2007. “Managing Change in a Changing World.” Mauritius Country Economic Memorandum. Washington DC.
World Bank, 2010. “Enhancing and Sustaining Competitiveness in Mauritius: Policy Notes on Trade and Labor.” Washington DC.
40
Young, A., 1995. "The Tyranny of Numbers: Confronting the Statistical Realities of the East Asian Growth Experience," The Quarterly Journal of Economics, MIT Press, vol. 110(3), pages 641-80, August.
Zafar, A., 2011. “Mauritius: An Economic Success Story.” in Yes Africa Can: Success Stories from a Dynamic Continent. (eds. Chuhan-Pole, P. and M. Angwalo) World Bank Group: Washington D.C.