matthew thomas domonkos a dissertation submitted in ...peplweb/pdf/1999_domonkos_thesis.pdf ·...
TRANSCRIPT

Evaluation of Low-Current Orificed Hollow Cathodes
by
Matthew Thomas Domonkos
A dissertation submitted in partial fulfillmentof the requirements for the degree of
Doctor of Philosophy(Aerospace Engineering)
in The University of Michigan1999
Doctoral Committee:
Associate Professor Alec D. Gallimore, ChairProfessor Luis P. BernalProfessor Ward D. GettyProfessor Yue Ying LauDoctor Ira Katz, Maxwell Technologies Federal Division

©Reserved Rights All
Domonkos Thomas Matthew1999

ii
For my parents

iii
ACKNOWLEDGMENTS
I could not have prevailed in this effort without the support of a number of others.First and foremost, I must thank my God for giving me a life where I would be able toaccomplish the things I have. By extension, I am indebted to my parents, my brother, mysister, and their families. They have been my primary support throughout my education.As such, this dissertation is in part theirs as well.
My advisor, Professor Alec Gallimore, has been tremendously supportive of myresearch by providing an open learning environment, ample funds for myexperimentation, and invaluable insight when I missed the obvious and not-so-obvious. Iam also grateful to Dr. Ira Katz for his insight and for jump starting my modelingefforts—the computer just doesn’t look much like a tool to an experimentalist. I alsothank the other members of my committee, Professor Luis P. Bernal, Professor Ward D.Getty, and Professor Yue Ying Lau.
The work presented in this thesis was supported primarily by the NASA John H.Glenn Research Center as part of a NASA Graduate Student Research ProgramFellowship, reference Grant No. NGT-3-52311. Michael Patterson of NASA Glenn putup with me and provided additional technical and equipment support. In addition, theentire On-Board Propulsion Branch at NASA Glenn has helped me in some form in mygraduate career. I especially acknowledge all of the technical assistance from MikePastel, Bob Roman, Ralph Jacko, Fred Jent, Bob Kozlo, Hardy Hartman, WinstonJohnson, John Miller, Glen Bowers, Wayne Condo, and Randy Miele. And for helpingme get my foot in the door at NASA Glenn in the first place, I thank Jim Parkes andRoger Myers.
The technical and administrative assistance at the University of Michigan’sAerospace Engineering Department was also instrumental in my work. I greatlyappreciate the work of Margaret Fillion, Tom Griffin, Gary Gould, Dave Mclean, and,even though he could be a real pain, Terry Larrow.
Of course, I couldn’t really manage this work without the company of those whoalso chose this peculiar form of self-abuse. Colleen, John, James, and Brad helped keepmy mind fresh in spite of the expiration date, not to mention what great friends they havebeen to me. I’ve also enjoyed a beer or two with Patty, Jose, Farnk, Jon, George, Tim,Mike, and Sang.

iv
PREFACE
The research presented in this dissertation focuses on the development of low-power and low-flow-rate orificed hollow cathodes for low-current applications. Forelectric propulsion in the 100 to 300-W range, cathode power and flow consumption canbecome greater than ten percent of the respective totals for the system. For kW-classelectric propulsion systems, consumption of power and propellant by the cathode istypically only a few percent of the total for the thruster. This research aims to scaleorificed hollow cathodes for low-current electric propulsion, with the ultimate goal ofcathodes for 100-300-W electric propulsion which consume significantly less than tenpercent of the power and flow-rate.
A number of 3.2-mm outer diameter cathodes were designed based on scalingexisting 6.4-mm diameter cathodes to low-current. The orifice aspect-ratio was variedbetween cathodes to examine the effects of orifice geometry on performance, and acathode was also built with a removable, enclosed keeper to test the effectiveness of theenclosure for reducing cathode power consumption. Alternate cathode geometries werealso investigated. The performance of these cathodes was measured in both diode andtriode discharges. A temperature distribution in the cathode was measured using animaging radiometer in order to evaluate the dominant mechanisms of heat transfer awayfrom the high-temperature thermionic emitter. Langmuir probes were used to measurethe electron temperature, number density, plasma potential, and electron energydistribution function of the plasma internal to the hollow cathode, in the cathode-to-keeper gap, and downstream of the keeper.
A computer model, combining elements of other hollow cathode models, wasdeveloped to examine the operation of low-current hollow cathodes. Both the insert andorifice regions were modeled, and the insert region predictions agreed with theexperimental data. The results also supported several of the conclusions of theexperimental investigation regarding cathode optimization. The model failed to predictthe elevated internal cathode pressure observed experimentally. A constricted arc in theorifice was hypothesized to be responsible for the elevated pressure due to a combinationof arc heating and the pinch effect. Simplified models were constructed to providetheoretical support to the constricted arc hypothesis.
The theoretical and experimental results were used to design a second-generationlaboratory model, low-current hollow cathode. The design was modified to limit thermalconduction, facilitate ionization in the insert region, and increase electron transportdownstream of the keeper. The cathode consumed 20 percent less power at the sameflow-rate as the best of the cathodes tested previous. Additionally, the improved cathodewas able to operate in spot-mode at much lower flow-rates than the first-generationcathodes.

v
TABLE OF CONTENTS
DEDICATION.............................................................................................................. ii
ACKNOWLEDGMENTS ........................................................................................... iii
PREFACE....................................................................................................................iv
LIST OF FIGURES.................................................................................................. viii
LIST OF TABLES.....................................................................................................xvi
NOMENCLATURE ..................................................................................................xiii
LIST OF APPENDICES .........................................................................................xxiii
CHAPTER
1. INTRODUCTION.............................................................................................1
1.1 Hollow Cathode Applications..................................................11.1.1 Ion Thrusters ............................................................11.1.2 Hall Thrusters ...........................................................31.1.3 Plasma Contactors ....................................................5
1.2 Overview of Hollow Cathode Physics .....................................71.2.1 Insert Region ............................................................81.2.2 Orifice Region ........................................................101.2.3 Cathode-To-Keeper ................................................111.2.4 Downstream Plasma ...............................................11
1.3 Summary of Hollow Cathode Development ..........................111.4 Contributions of Research .....................................................14
2. EXPERIMENTAL APPARATUS..................................................................15
2.1 The Hollow Cathodes............................................................152.1.1 Hollow Cathode Design and Fabrication .................15Cathode...........................................................................182.1.2 Hollow Cathode Operation......................................21
2.2 Diagnostics and Experimental Techniques.............................232.2.1 Cathode Performance..............................................232.2.2 Cathode Temperature Distributions.........................262.2.3 Plasma Diagnostics .................................................31
2.3 Vacuum Facilities..................................................................352.3.1 Feed System Components .......................................352.3.2 Feed System Bake-Out ...........................................362.3.3 Feed System Evaluation..........................................362.3.4 Feed System Purge .................................................36

vi
2.3.5 Vacuum Chambers..................................................36
3. INITIAL EXPERIMENTAL INVESTIGATION OF 3.2 MMORIFICED HOLLOW CATHODES .....................................................40
3.1 Cathode Performance ............................................................403.1.1 Performance Variance.............................................403.1.2 Spot and Plume-Mode Characterization ..................423.1.3 Voltage-Flow-rate Characterizations.......................443.1.4 Effects of a Small Insert Inner Diameter .................493.1.5 Multichannel Cathode Performance ........................503.1.6 Minimum Power in a Diode Discharge ...................523.1.7 Minimum Spot-Mode Flow-rate in a Diode
Discharge ..................................................................533.1.8 Electron Emission Characteristics in a Triode
Discharge ..................................................................543.1.9 Cathode Operating Pressure ....................................56
3.2 Cathode Temperature Distribution.........................................583.2.1 Axial Temperature Distribution ..............................583.2.2 Tip Temperature Variation with Geometry..............62
3.3 Cathode Plasma Characteristics .............................................643.3.1 Insert Plasma ..........................................................653.3.2 Cathode-To-Keeper Plasma ....................................693.3.3 Plasma Downstream of the Keeper..........................723.3.4 Calculation of Plasma Parameters ...........................77
4. HOLLOW CATHODE MODEL AND RESULTS........................................79
4.1 Orifice Model........................................................................794.1.1 Conservation of Ions...............................................794.1.2 Conservation of Energy...........................................82
4.2 Insert Model..........................................................................854.2.1 Current Continuity ..................................................854.2.2 Ion Conservation.....................................................884.2.3 Conservation of Energy...........................................89
4.3 Model Predictions .................................................................914.3.1 Sensitivity of the Orifice Results to the Free
Parameters .................................................................914.3.2 Sensitivity of the Insert Results to the Free
Parameters .................................................................934.3.3 Low-Current Predictions for Various Conditions
and Geometries..........................................................974.3.4 Discussion of Implications for Low-Current
Hollow Cathode Performance ..................................1044.4 Discussion of a Recently Developed Cathode Thermal
Model..................................................................................105

vii
4.5 Theoretical Treatment of Cathode Internal Pressure ............1054.5.1 Current Density Induced Pinch Effect Pressure .....1084.5.2 Radial Distribution of the Heavy Particle
Temperatures...........................................................109
5. DESIGN AND TESTING OF NEXT-GENERATIONLABORATORY MODEL CATHODE ................................................115
5.1 Cathode Design...................................................................1155.1.1 Thermal Design ....................................................1155.1.2 Insert Design.........................................................1175.1.3 Orifice Plate Design..............................................1175.1.4 Keeper Design .....................................................1195.1.5 Design Summary ..................................................120
5.2 Performance Evaluation ......................................................1215.3 Summary.............................................................................124
6. CONCLUSIONS AND FUTURE WORK ...................................................125
6.1 Performance of Low-Current Hollow Cathodes...................1256.2 Orifice and Insert Models ....................................................1266.3 Test of Improved Design .....................................................1276.4 Suggested Future Work.......................................................127
APPENDICES ...........................................................................................................172
BIBLIOGRAPHY......................................................................................................196

viii
LIST OF FIGURES
Figure 1.1 - Ion Thruster Schematic .................................................................................2Figure 1.2 - Schematic of Hall thruster Operation ...........................................................4Figure 1.3 - Generalized Orificed Hollow Cathode Schematic .........................................6Figure 1.4 - Schematic of an Open-Channel Hollow Cathode. .........................................7Figure 1.5 - Hollow Cathode with Orifice and Thermionic Emitting Pellet. .....................8Figure 1.6 - Schematic of Hollow Cathode Physics........................................................10Figure 2.1 - Engineering Schematic of the Orificed Hollow Cathode .............................16Figure 2.2 - Definition of Hollow Cathode Dimensions .................................................17Figure 2.3 - End View Photographs of the Multichannel Hollow Cathodes ....................20Figure 2.4 - AR3 (AR3-A) with Mesh Keeper, Internal Langmuir Probe, and
Thermocouples ......................................................................................................21Figure 2.5 - Open Keeper Configuration of the Extended Tube Cathode (OK1) .............21Figure 2.6 - The Enclosed Keeper Cathode ....................................................................21Figure 2.7 - Circuit Diagram for the Hollow Cathode in a Triode Configuration ............22Figure 2.8 - Cathode Control and Diagnostic Scheme ....................................................24Figure 2.9 - Sample Data Log from AR1. ......................................................................25Figure 2.10 - Simplified Flow Schematic .......................................................................26Figure 2.11 - Thermography Experimental Set-Up.........................................................28Figure 2.12 - Sample Image Generated by the Imaging Radiometer ...............................28Figure 2.13 - Radiometer Image of the Enclosed Keeper................................................29Figure 2.14 - Sample Line Profile Results From the Radiometer....................................30Figure 2.15 - Langmuir Probe Locations and Designations. ...........................................32Figure 2.16 - Comparison of Numerically Evaluated Second Derivative of Probe Current
with Maxwellian and Druyvesteyn Characteristics. ................................................35Figure 2.17 – The Cathode Test Facility at the Plasmadynamics and Electric Propulsion
Laboratory .............................................................................................................38Figure 2.18 - The VF-52 Test Stand at the NASA Lewis Research Center .....................39Figure 3.1 - Variance in Performance Characterizations of AR6 and AR6´ at 0.75-A.....41Figure 3.2 - Variance in Performance Characterizations of AR6 and AR6´ at 1.50-A.....42Figure 3.3 - Illustration of the Range of Possible Misalignment of the Orifice and Insert
Centerlines.............................................................................................................42Figure 3.4 - Time Resolved Comparison of Spot and Plume-Mode Current and Voltage
Signals ...................................................................................................................43Figure 3.5 - Power Spectra of the Keeper Voltage and Current in Spot and Plume-Modes.
..............................................................................................................................44Figure 3.6 - Diode Performance Characterization of AR6. .............................................45Figure 3.7 - Diode Performance Characterization of AR6´. ............................................46Figure 3.8 - Diode Performance Characterization of AR3. .............................................47Figure 3.9 - Diode Performance Characterization of AR1. .............................................47Figure 3.10 - Diode Performance Characterization of AR3-A. .......................................48Figure 3.11 - Diode Performance Characterization of OK. .............................................49Figure 3.12 - Diode Performance Characterization of EK. ............................................49Figure 3.13 - Diode Performance Characterization of AR6´´..........................................50Figure 3.14 - Diode Performance Characterization of MC7............................................51Figure 3.15 - Diode Performance Characterization of MC13..........................................52

ix
Figure 3.16 - Cathode-to-Keeper Power at the Spot-Mode Minimum Flow-rate.............53Figure 3.17 - Minimum Spot-Mode Flow-rates. .............................................................54Figure 3.18 - Current-Voltage Characteristics of EK6 for the Second Anode in a Triode
Configuration.........................................................................................................55Figure 3.19 - Cathode Potential of EK6 as an Indicator of Emission Capability. ............56Figure 3.20 - Cathode Internal Pressure Under Various Operating Conditions. Results for
EK6, Except Where Noted. ....................................................................................57Figure 3.21 - Start-Up Transient Response of Cathode Pressure for EK6. ......................58Figure 3.22 - Illustration of the Raw Thermocouple and Radiometer Data. Both EK and
OK Were Operated at 1.00-A.................................................................................59Figure 3.23 - Axial Temperature Profiles of EK and OK at 0.50-A. ...............................60Figure 3.24 - Axial Temperature Profiles of EK and OK at 1.25-A. ...............................60Figure 3.25 - Axial Temperature Profiles of EK and OK at 1.50-A. ...............................61Figure 3.26 - Axial Temperature Profiles of the Enclosed Keeper at 1.00-A. .................62Figure 3.27 - Orifice Plate Temperature Dependence On Aspect-Ratio in a 1.00-A
Discharge to the Keeper. ........................................................................................63Figure 3.28 - Orifice Plate Temperature Dependence On Orifice Diameter in a 0.75-A
Discharge to the Keeper. ........................................................................................63Figure 3.29 - Orifice Plate Temperature Dependence On Keeper Type in a Diode
Discharge...............................................................................................................64Figure 3.30 - Variation of Internal Plasma Characteristics with Flow-rate......................66Figure 3.31 - Variation of Internal Plasma Characteristic with Current Approximately
0.7-mm Upstream of the Orifice Plate. ...................................................................67Figure 3.32 - Internal Plasma Electron Energy Distribution Function Variation with
Flow-rate at 0.75-A, 0.7-mm Upstream of the Orifice Plate....................................68Figure 3.33 - Internal Plasma Electron Energy Distribution Function Variation With
Current at 2.0-sccm, 0.7-mm Upstream of the Orifice Plate....................................69Figure 3.34 - Variation of Plasma Properties in the Extended Cathode-to-Keeper Gap of
AR3. Plasma Potential Was Measured With Respect to the Keeper. ......................71Figure 3.35 - Spot-Mode Electron Energy Distribution Functions in the Cathode-to-
Keeper Gap of AR3. ..............................................................................................72Figure 3.36 - Variation in Observed Electron Temperatures in the Radial and Axial
Directions. .............................................................................................................73Figure 3.37 - Emission Plasma Electron Temperature In Spot and Plume-Mode ............74Figure 3.38 - Emission Plasma Electron Temperature with Electron Extraction. ............74Figure 3.39 - Electron Energy Distribution Function Downstream of the Keeper at 0.75-A
and 2.4-sccm..........................................................................................................75Figure 3.40 - Potential Variation in the Emission Plasma...............................................76Figure 3.41 - Potential Variation While Extracting Current Downstream. ......................76Figure 3.42 - Emission Electron Number Density. .........................................................77Figure 4.1 - Illustration of the Orifice and Insert Model Approximations. ......................80Figure 4.2 - Thermionic Current Density for Various Effective Work Functions. ...........87Figure 4.3 - Dependence of the Thermionic Emission Current Density on the Plasma
Potential Based on Double Sheath Analysis. Material Work Function = 2.0-eV. ...87

x
Figure 4.4 - Relative Dependency of Orifice Plasma Properties on the Fraction ofExcitation Collisions Contributing to Ionization. AR6 Geometry at 0.50-A and 0.9-sccm. .....................................................................................................................92
Figure 4.5 - Relative Dependency of the Orifice Region Plasma Properties on theAverage Excitation Energy. AR6 Geometry at 0.5-A and 0.9-sccm.......................93
Figure 4.6 - Dependency of the Insert Region Plasma Properties on the Fraction ofExcitation Collisions Contributing to Ionization. AR6 Geometry at 0.50-A and 0.9-sccm. .....................................................................................................................94
Figure 4.7 - Dependency of the Insert Region Plasma Properties on the AverageExcitation Energy. AR6 Geometry at 0.50-A and 0.9-sccm. ..................................95
Figure 4.8 - Dependency of the Insert Region Plasma Parameters on the Plasma Potential.AR6 Geometry at 0.50-A and 0.9-sccm..................................................................96
Figure 4.9 - The Effect of the Material Work Function on the Predicted InsertTemperature for AR6 at 0.50-A, and 0.9 sccm. ......................................................97
Figure 4.10 - Variation of Plasma and Control Volume Properties within the Orifice asFunctions Discharge Current And Flow-rate. AR6 Geometry. ...............................99
Figure 4.11 - Variation of Orifice Model Calculated Properties as a Function of OrificeDiameter and Length. ID = 0.50-A at 0.9 sccm with di,i = 1.2-mm........................100
Figure 4.12 - Variation of Orifice Model Calculated Properties as a Function of theOrifice Length. AR6 Geometry at 0.50-A and 0.9 sccm. .....................................101
Figure 4.13 - Insert Model Calculated Plasma and Control Volume Properties asFunctions of Both Current and Flow-rate. AR6 Geometry. ..................................102
Figure 4.14 - Variation of Insert Region Properties with Orifice Diameter. ID = 0.50-A at0.9 sccm and di,i = 1.2-mm. ..................................................................................103
Figure 4.15 - Dependency of Insert Region Properties on the Insert Inner Diameter.....104Figure 4.16 - Comparison of the Flow-rate Calculations With Experiments for Room
Temperature Neutral Xe Flow for AR6. ...............................................................107Figure 4.17 - Comparison of the Flow-rate Calculations With Experiments for 1228-K
Neutral Xe Flow in AR6. .....................................................................................107Figure 4.18 - Predicted Peak Pinch Effect Pressures as a Function of Arc Radius.........109Figure 4.19 - Radial Heavy Particle Temperature Profile for AR6 at 1.25-A and 2.4-sccm
(Te = 2.00-eV, ne = 8.5 x 10²¹ m-3, no = 2.3 x 10²³ m-3). ........................................112Figure 4.20 - Radial Variation of the Ion and Neutral Temperatures in the Orifice as a
Function of Electron Temperature. (ne = 8.5 x 10²¹ m-3, no = 2.3 x 10²³ m-3)........113Figure 4.21 - Radial Variation of the Ion Temperature within the Orifice as a Function of
Electron Number Density. Te = 0.50 eV and no = 2.3 x 10²³ m-3. .........................113Figure 4.22 - Radial Distribution of Heavy Particle Temperatures Based on the Arc
Column Hypothesis (Te = 2-eV)...........................................................................114Figure 5.1 - Schematic of the Next-Generation Laboratory Model Low-Current Hollow
Cathode (SC.012). ...............................................................................................116Figure 5.2 - Photograph of SC.012 Showing The Electron Beam Welds and Two Tube
Diameters ............................................................................................................117Figure 5.3 - Engineering Drawing of SC.012 Orifice Plate (Dimensions in inches). .....118Figure 5.4 - Illustration of the Tendency of Chamfered Orifice Plate to Collect Ions
Emitted from the Orifice. .....................................................................................119Figure 5.5 - Photograph of SC.012 with Shallow Orifice Plate Chamfer. .....................119

xi
Figure 5.6 - Diagram of the Open Keeper Used with SC.012. ......................................120Figure 5.7 - Voltage-Flow-rate Characterization of SC.012..........................................121Figure 5.8 - Reduction of Cathode Internal Pressure for Spot-Mode Operation. ...........122Figure 5.9 - Comparison of the Minimum Power Consumption at Transition. ..............123Figure 5.10 - Emission Current at 0.50-A to the Keeper...............................................124Figure A.1 Illustration of the Standard Langmuir Probe Analysis................................132Figure A.2 - Sequence of Derivatives Calculated for the EEDF Analysis. ....................133Figure A.3 - Final Processing of the EEDF Data and Comparison of Results Based on
Two Values for the Plasma Potential....................................................................134Figure B.1 - Length Scales 1.3-mm Upstream of the Orifice Plate. ..............................136Figure B.2 - Length Scales in the CK Gap at 0.5-A and 1.0-sccm. ...............................136Figure B.3 - Length Scales Downstream of the Keeper at 0.5-A and 2.4-sccm. ............137Figure B.4 - Length Scales Downstream of the Keeper at 1.50-A and 2.4 sccm............137Figure C.1 - Electron Impact Cross-Sections in Xenon.68,71,72 ......................................140Figure D.1 – The Inputs Worksheet .............................................................................143Figure D.2 - The Orifice Worksheet............................................................................144Figure D.3 - The Insert Worksheet...............................................................................145Figure D.4 - The Results Worksheet with Completed and Uncompleted Data Sets. ......146Figure D.5 - The Pressure Worksheet. .........................................................................146Figure D.6 - Partial Illustration of the Ion, Neutral Temps Worksheet. .........................147

xii
LIST OF TABLES
Table 1.1 – NSTAR and 100 to 300-W Class Ion Thruster Operating Characteristics10,11,12
................................................................................................................................3Table 1.2 - D55 Anode Layer Thruster and SPT-30 Stationary Plasma Thruster
Operating Characteristics13,14,15,16 .............................................................................5Table 1.3 - Space Station Hollow Cathode Plasma Contactor Operating Parameters17......5Table 2.1 - Dimensions of the Orificed Hollow Cathodes Tested in this Investigation in
mm ........................................................................................................................18Table 3.1 - Cathode Operating Conditions for the Emission Plasma Parameters.............64Table 3.2 - Comparison of the Langmuir Probe and EEDF Derived Internal Electron
Temperatures for AR3 at 2.0-sccm.........................................................................69Table 3.3 - Summary of Plasma Length Scales and Definition Parameters. ....................78Table 4.1 - Test Matrix for the Orifice and Insert Models...............................................97Table 4.2 – Calculated Heavy Particle Temperature to Match Cathode Internal Pressure
Data .....................................................................................................................108Table 5.1 Low-Current Hollow Cathode Design Considerations ..................................120

xiii
NOMENCLATURE
A Normalization constantAeff Effective emission area on the insert (m2)Ao Orifice area, m2
Apr Langmuir probe areaAR Richardson coefficient (60 A/cm2-K2)b Exponential constant for EEDF curve fit or coefficientc Speed of light (3 x 10⁸ m/s)ci Ion acoustic speed (m/s)cp Specific heat at constant pressure (J/kg-K)C ConstantCa Coefficient a of a polynomial curve fitdh Heater diameter including radiation shields (mm)di,i Inner diameter of the cathode insert (mm)di,o Outer diameter of the cathode insert (mm)dm Hard-sphere molecular diameter (2.1 x 10⁻¹⁰ m for xenon)do Orifice diameter (m unless otherwise noted)dt,i Inner diameter of the cathode tube (mm)dt,o Outer diameter of the cathode tube (mm)e Electron charge (1.6 x 10⁻¹⁹ C)E Electron energy (eV)Eds Electric field in the double sheath adjacent to the insert (V/m)Ex Axial electric field (V/m)f Escape fraction of emitted electronsfex Fraction of excitations causing ionizationf(E) Normalized electron energy distribution function, EEDFf(ve) Normalized electron speed distribution functionh Planck constant (6.626 x 10⁻³⁴ J-s)ID Cathode discharge current (A)Ie Electron current to the Langmuir probe (A)Ie,ins Electron current from the insert region to the orifice region (A)Ie,ori Electron current emitted from the orifice (A)Ii Bohm ion current at sheath boundary (A)Ii,emit Emitted ion current from the orifice (A)Ii,ori Orifice ion current (A)Ip(x) Pixel intensity at position x (arbitrary units)Ip,max Maximum pixel intensity on a line profile (arbitrary units)Ip,min Minimum pixel intensity on a line profile (arbitrary units)Ipr Langmuir probe current (A)j Current density (A/m2)je,back Plasma electron backstreaming flux (#/m2)je,thm Thermionic electron current density (A/m2)ji Ion flux, (#/m2)Ji Bohm ion current density at sheath boundary (A/m2)

xiv
k Boltzmann constant (1.38 x 10⁻²³ J/K)KL Coefficient of loss through orifice entrance (0.5)lch Characteristic length scale in plasma region (cm)lc-k Length of cathode-to-keeper gap (mm)lhtr Length of heater on cathode tube (mm)li Insert length (mm)lk Thickness of keeper orifice (mm)lk-a Length of keeper-to-anode gap (mm)lo Orifice length (mm)ltip Orifice plate thickness (mm)lnΛ Coulomb logarithmLeff Effective emission length from the insert (m)me Electron mass (9.11 x 10⁻³¹ kg)mi Ion mass (2.19 x 10⁻²⁵ kg for xenon)m& Mass flow-rate (mg/s or sccm) (1 sccm = 0.097 mg/s)Me Atomic mass of an electron (1/1836)Mi Atomic mass of an ion (131 for xenon)Mo Atomic mass of a neutral (131 for xenon)n index of refractionnx Number density of species x(cm-3 or m-3)Neo Number density-rate of electron impact ionization events (#/m3-s)Nsph Number of particles in a Debye spherep Pressure (Pa)pc Critical sonic pressure (Pa)pin Pressure in the insert region (Pa)qconv Convective power loss (W)qe,back Convective power loss due to backstreaming electrons (W)qe,con Convective power loss due to electron current (W)qe,thm Convective power input by thermionic electrons (W)qex Power loss due to radiation of excited states (W)qi,loss Convective power loss due to ion loss (W)qi,ori Convective power input by orifice ions (W)qion Ionization power loss (W)qOhmic Ohmic heat generation (W)r Radial coordinate (m)ro Orifice radius (m)R Resistance (Ohms)Rsp Specific gas constant (63.1 J/kg-K for xenon)t Time (s)teq Equipartition time (s)T(x) Cathode temperature at a position x (ºC)TBB Blackbody temperature of a body (ºC)Tx Temperature of species x (eV or K)Tmax Maximum cathode temperature on a line profile (ºC)Tmin Minimum cathode temperature on a line profile (ºC)Twall Temperature of the orifice wall, (K)

xv
Tβ Brightness or emittance corrected temperature of a body (ºC)
ou Average gas velocity (m/s)
Uex Average excitation energy (eV)vd Drift velocity (m/s)ve, ev Electron thermal speed (m/s)
iv Average ion speed (m/s)
Vds Voltage across a planar double sheath (V)Vf Floating potential (V)Vp Plasma potential (V)Vpr Langmuir probe voltage (V)Vsph Volume of a Debye sphere (cm3)x Distance from an established zero point (mm) or exponent on the
electron energy for EEDF curve fitx Property x averaged over Maxwellian distribution
Z Charge stateε Emittance of a surfaceεo Permittivity of free space (8.85 x 10⁻¹² F/m)φeff Effective work function (eV)φi Ionization potential (12.12 eV for xenon)φo Material work function (eV)γ Ratio of specific heats (5/3 for xenon)η Plasma resistivity (Ω-m)κ Thermal conductivity (W/m-K)λ Wavelength of pyrometer optics (m)λD Debye length (cm or m)λee Electron mean free path for self-collision (m)λex Electron mean free path for excitation (m)λion Electron mean free path for ionization (m)µ Permeability (H/m) or dynamic viscosity (N-s/m2)µο Permeability of free space (4π x 10-7 H/m)νa,b Collision frequency of a with b (Hz)ρ Mass density (kg/m3)ρo Mass density in the orifice (kg/m3)σ Self collision cross section for ions and neutrals (m2)σa,b Collision cross section for a colliding with b (m2)σex Electron-impact excitation cross-section (m2)σion Electron-impact ionization cross-section (m2)
Subscripts
coll Collected particle

xvi
e Electronemit Emitted particleex Excited neutrali Ionins Inserto Neutralori Orificep Plasmapr Primary

xvii
LIST OF APPENDICES
Appendix
A. Sample Analysis of Langmuir Probe Data and Electron EnergyDistribution Function Calculation..............................................................173
B. Evaluation of the Validity of the Standard Langmuir Probe Analysis.......179
C. Derivation of the Equations Used in the Hollow Cathode Model .............183
D. Hollow Cathode Design Code Manual and Description ...........................189

1
CHAPTER 1
INTRODUCTION
Hollow cathodes, in their various forms, are used in a wide variety of applicationswhere high current densities, low cathode-fall voltages, and extended lifetimes arerequired.1,2,3,4,5,6 Electric propulsion devices, plasma contactors, lasers, and magnetronsall use hollow cathodes in some form. Hollow cathodes are capable of operation at afraction of an Ampere up to several hundred Amperes, all in an arc discharge. At highpressure internal to the hollow cathode, discharge voltages can occur below the ionizationpotential of the propellant due to the formation of a negative anode sheath. Lifetimes upto 28,000 hours have been demonstrated, with even greater lifetimes theoreticallypossible.6,7,8 These operating characteristics make hollow cathodes ideal for use withelectric propulsion systems and as space plasma contactors.
1.1 Hollow Cathode Applications
1.1.1 Ion Thrusters
Ion thrusters employ two hollow cathodes as shown in Figure 1.1. The dischargehollow cathode creates an internal plasma which enables emission of an electron currentin excess of space charge limitations. A magnetic circuit is created within the ion thrusterusing permanent magnets in a ring-cusp configuration.9 The electrons emitted by the gas-fed hollow cathode stream toward the anode along the magnetic field lines. Neutralpropellant molecules (usually xenon) are also injected directly into the dischargechamber. Collisions between the electrons and neutrals create the ions in the dischargechamber. The magnetic circuit also acts to control the effective anode area and to containthe high-energy electrons for ionization while thermalized low temperature (a few eV)electrons conduct the current to the anode.9 The ions are focused and accelerated by thegrids, while the electrons are contained within the discharge chamber. An externalhollow cathode emits an electron current equal to the ion beam current to neutralize thespace charge within the beam. The hollow cathode neutralizer uses a keeper electrode tosustain its discharge. Loss of ions to the walls of the discharge chamber and the neutralflux through the grids constitute the major sources of performance degradation.Additionally, the neutralizer flow is also considered a loss since it is used only to bridgethe neutralizer to the ion beam electrically. Typical operating conditions of the NSTARion thruster used on the Deep Space One spacecraft are reported in Table 1.1.10 Alsolisted in Table 1.1 are the target parameters for a 100-300-W ion thruster which couldfulfill the primary propulsion role for small spacecraft.11,12 The discharge hollow cathodeis operated at a relatively high current to increase the plasma density within the dischargechamber, while the keeper on the neutralizer is kept at low-current to optimize efficiency.Flow to both cathodes is kept to the minimum necessary for the operating conditions.

2
The high specific impulse makes ion thrusters ideal for planetary probes where the lowthrust density can be tolerated.
Xe+Xee-Xe
e-Xe+
Xe+
DischargePlasma
Ion Beam
Propellant Feed
e-
e-
Xe
Xe
Hollow Cathode Neutralizer
Anode
DischargeHollowCathode
Permanent Magnets
Acceleration Grid
Screen Grid
e-
Figure 1.1 - Ion Thruster Schematic

3
Table 1.1 – NSTAR and 100 to 300-W Class Ion Thruster OperatingCharacteristics10,11,12
Parameter NSTAR NominalConditions
100 to 300 W ThrusterTargets
Discharge Voltage, V 25 to 28 28Discharge Current, A 4.8 to 12.8 1.05 to 1.90
Beam Voltage, V 634 to 1096 600 to 900Beam Current, A 0.54 to 1.76 0.09 to 0.2
Neutralizer Keeper Voltage, V 14.2 to 21.2 20Neutralizer Keeper Current, A 1.5 0.1
Coupling Voltage, V -13.6 to –14.2 15Main Flow-rate, mg/s 0.59 to 2.32 0.15 to 0.34
Cathode Flow-rate, mg/s 0.21 to 0.36 Included in main flow.Neutralizer Flow-rate, mg/s 0.21 to 0.30 0.05
Power, kW 0.51 to 2.32 0.1 to 0.3Thrust, mN 21.6 to 92.6 4 to 11.3
Specific Impulse, s 2200 to 3300 2000 to 2950Efficiency 0.45 to 0.66 0.38 to 0.54
1.1.2 Hall Thrusters
Single-stage Hall thrusters typically employ only one hollow cathode, althoughsome are equipped with two for redundancy. In the case of Hall thrusters, the hollowcathode acts as the discharge cathode and the neutralizer, as shown in Figure 1.2. Anannular anode is surrounded by inner and outer electromagnets which create a radial
magnetic field. Electrons traveling from the cathode to the anode are caught in an BErr
×azimuthal drift. The strength of the magnetic field scales inversely with the anodediameter since higher field strengths become necessary to contain the electrons as theconfinement scale decreases. The Hall-effect increases the electron mobility, enablingelectron-impact ionization of the neutrals. The ions are accelerated axially by the closed-drift of electrons. The magnetic field strength is insufficient to magnetize the ions.Beyond this electron cloud, the Debye lengths are very short, and the ions are quicklyshielded from the influence of the acceleration region. Like its ion thruster counterpart,the hollow cathode also emits an electron current to neutralize the ion beam. While thehollow cathodes are typically equipped with a keeper, the discharge current is usuallysufficient to maintain the high temperature needed for cathode operation. The flow ofpropellant to the cathode again represents a performance degradation since the flow isonly weakly ionized and the few ions formed are not accelerated to a significant velocity.Typical operating conditions for the D55 anode layer (Hall) thruster are listed in Table1.2.13,14,15,16 The higher thrust density of Hall thrusters makes them more ideal forsatellite stationkeeping applications due to trip time and satellite packaging constraints.

4
Figure 1.2 - Schematic of Hall thruster Operation

5
Table 1.2 - D55 Anode Layer Thruster and SPT-30 Stationary Plasma ThrusterOperating Characteristics13,14,15,16
Parameter D55 NominalConditions
SPT –30 NominalConditions
Discharge Voltage, V 300 150 to 250Discharge Current, A 4.5 0.6 to 1.0
Discharge Flow-rate, mg/s 4.76 0.6 to 1.0Cathode Flow-rate, mg/s 0.78 0.1
Cathode Floating Voltage, V -13 to -15 Not reported.Power, kW 1.35 0.09 to 0.26Thrust, mN 39 to 118 4.9 to 13.2
Specific Impulse, s 1250 to 2700 521 to 1230Efficiency 0.5 to 0.6 0.14 to 0.31
1.1.3 Plasma Contactors
Hollow cathodes have also found application as plasma contactors.6,17,18,19
Photoemission of electrons from spacecraft surfaces cause charging relative to theambient space plasma. Spacecraft charging also occurs when high voltage solar arraysare used.17 This leads to arc discharges which damage instruments, or the spacecraftcharge imbalance distorts measurements being made by scientific payloads.19 Theplasma contactor regulates the spacecraft potential relative to the space plasma. Hollowcathode plasma contactors are operated with keeper electrodes, and consequently thekeeper power and propellant supplies for the cathode must be onboard the spacecraft.Typical operating conditions for the Space Station Plasma Contactors (SSPC) are listed inTable 1.3.17 With plasma contactors, the plasma flow facilitates the transfer of chargebetween the spacecraft and the ambient plasma, and system lifetime may be limited bythe onboard propellant supply.
Table 1.3 - Space Station Hollow Cathode Plasma Contactor OperatingParameters17
Parameter Nominal ConditionsKeeper Current, A 3.0Keeper Voltage, V 12.2 to 20
Flow-rate, mg/s 0.44 to 0.88Coupling Voltage, V 10 to 16
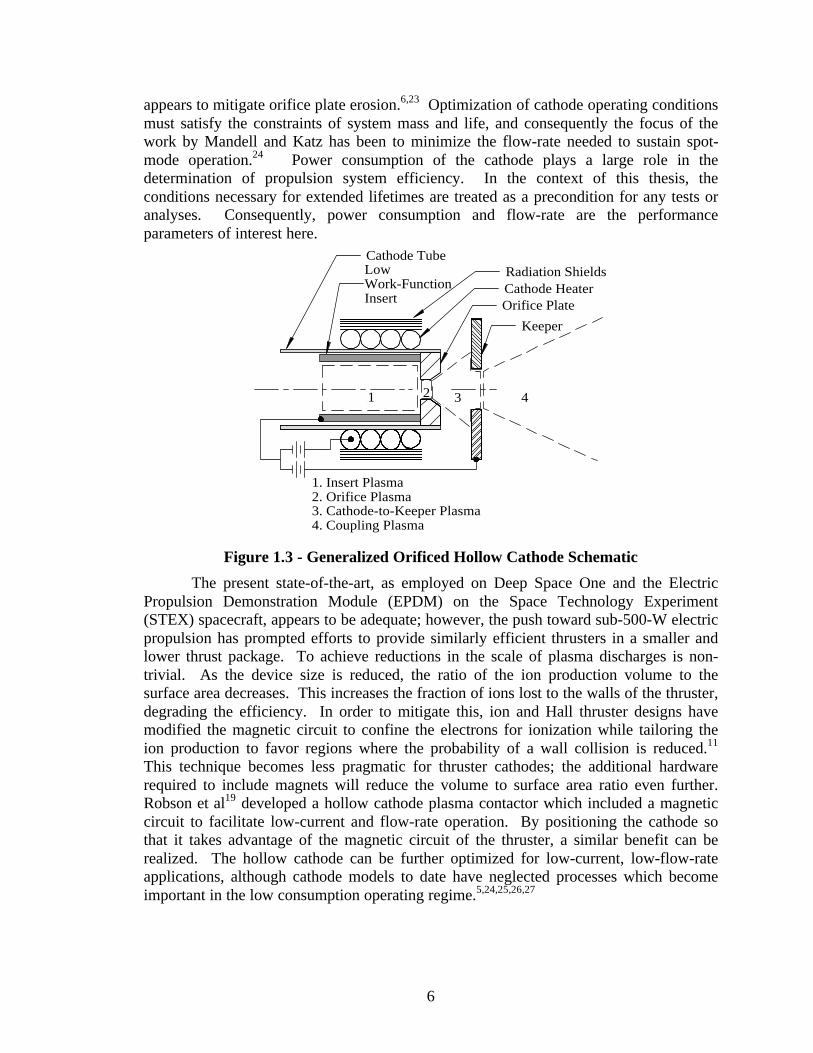
Plasma contactors, and ion and Hall thrusters all use hollow cathodes as electronsources. The orificed hollow cathode, depicted in Figure 1.3, emits electronsthermionically from a low work-function insert, and a plasma is generated by electron-neutral collisions. The plasma mitigates the space charge limitations of an ordinarythermionic emitter. In order to evaluate the effectiveness of hollow cathodes as electronemitters, it is useful to define the operational parameters to be optimized. Several workshave documented the conditions necessary for extended-life of hollow cathodes.8,18,20,21,22
Besides the clear need to reduce the contaminants, spot-mode operation, characterized bysmall amplitude oscillations of current and voltage, minimizes the discharge voltage and
6
appears to mitigate orifice plate erosion.6,23 Optimization of cathode operating conditionsmust satisfy the constraints of system mass and life, and consequently the focus of thework by Mandell and Katz has been to minimize the flow-rate needed to sustain spot-mode operation.24 Power consumption of the cathode plays a large role in thedetermination of propulsion system efficiency. In the context of this thesis, theconditions necessary for extended lifetimes are treated as a precondition for any tests oranalyses. Consequently, power consumption and flow-rate are the performanceparameters of interest here.
Orifice PlateCathode HeaterRadiation ShieldsLow
Work-FunctionInsert
Cathode Tube
Keeper
1 2 3 4
1. Insert Plasma2. Orifice Plasma3. Cathode-to-Keeper Plasma4. Coupling Plasma
Figure 1.3 - Generalized Orificed Hollow Cathode Schematic
The present state-of-the-art, as employed on Deep Space One and the ElectricPropulsion Demonstration Module (EPDM) on the Space Technology Experiment(STEX) spacecraft, appears to be adequate; however, the push toward sub-500-W electricpropulsion has prompted efforts to provide similarly efficient thrusters in a smaller andlower thrust package. To achieve reductions in the scale of plasma discharges is non-trivial. As the device size is reduced, the ratio of the ion production volume to thesurface area decreases. This increases the fraction of ions lost to the walls of the thruster,degrading the efficiency. In order to mitigate this, ion and Hall thruster designs havemodified the magnetic circuit to confine the electrons for ionization while tailoring theion production to favor regions where the probability of a wall collision is reduced.11
This technique becomes less pragmatic for thruster cathodes; the additional hardwarerequired to include magnets will reduce the volume to surface area ratio even further.Robson et al19 developed a hollow cathode plasma contactor which included a magneticcircuit to facilitate low-current and flow-rate operation. By positioning the cathode sothat it takes advantage of the magnetic circuit of the thruster, a similar benefit can berealized. The hollow cathode can be further optimized for low-current, low-flow-rateapplications, although cathode models to date have neglected processes which becomeimportant in the low consumption operating regime.5,24,25,26,27

7
1.2 Overview of Hollow Cathode Physics
Several different types of cathodes are referred to as hollow cathodes. Generallyspeaking, all hollow cathodes are thermionic devices which rely on electronbombardment ionization of a neutral gas to generate a plasma. The open-channel hollowcathode, depicted in Figure 1.4, is one of the simplest hollow cathode devices. The arcattaches upstream of the cathode exit plane, and these devices typically operate above1500 ºC due to the high work function of the tube material.5 A variation on the orificedhollow cathode is shown in Figure 1.5. This design utilizes an orifice to increase theneutral density near the low-work function emitter, facilitating ionization. The workfunction of lanthanum hexaboride is approximately 2.6-eV, and self-heating of the pelletis insufficient to maintain the necessary emission current density. Consequently, thistype of cathode requires continuous operation of the cathode heater. The hollow cathodesbeing discussed in this work consist of a refractory metal tube with an orifice platewelded to the downstream end as shown in Figure 1.3. A low work function insert emitselectrons to create the insert plasma which flows downstream through the various regionsillustrated. The cathode heater is used initially to heat the insert to emission, and self-heating sustains the discharge following ignition. The keeper is typically used to initiatethe discharge and maintain it when the emission current, the current to beam or spaceplasma, is insufficient to provide the self-heating for stable operation. The variousregions of the discharge are discussed in more detail below.
Propellant Flow
Arc Attachment
Hollow Cathode
Anode or Keeper
Plasma Electron Paths
Figure 1.4 - Schematic of an Open-Channel Hollow Cathode.

8
Propellant Flow
Hollow Cathode
Anode or Keeper
t
Heater Radiation Shield
Cathode Heater
Lanthanum HexaborideLow-Work Function Emitter
Current CarryingPlasma
Figure 1.5 - Hollow Cathode with Orifice and Thermionic Emitting Pellet.
1.2.1 Insert Region
The cathode insert is made of porous tungsten impregnated with a 4:1:1 molarmixture of barium oxide (BaO), calcium oxide (CaO), and aluminum oxide (Al2O3). Thiscomposite has a low work function, and the mechanisms controlling insert propertieshave been described in detail.7,8,21,22,28,29 Rittner, Rutledge, and Ahlert28 first proposedthe mechanisms responsible for the low-work function operation of the impregnatedcathodes. While the specific mechanisms governing the generation and transport ofbarium have been argued, the consensus agrees that gaseous barium, liberated fromcompounds within the insert, is transported to the surface of the cathode.28,29 A bariumand oxygen monolayer on the surface of the cathode reduces the work-function.28,29 Thecalcium oxide has been linked to the reduction in the rate of barium evaporation. Suitch29
states that the insert must operate in the range from 1000-ºC to 1100-ºC; below 1000-ºC,the discharge becomes unstable, and above 1100-ºC, the impregnant evaporates at a ratewhich curtails the lifetime. This statement of the optimal insert operating temperaturerange is oversimplified. The results of a recent life test indicate that cathode life canreach 28,000 hours with an orifice plate temperature above 1100-ºC, and the insert stillcontained constituent elements of the impregnant.6 For the purposes of the presentinvestigation, it is sufficient to consider the insert as a thermionic electron emitter withestablished operating procedures and temperature regime which enable demonstrated lifeto 28,000 hours.6
The emission of thermionic electrons from the insert creates a negative chargedensity immediately adjacent to the cathode surface, as shown in Figure 1.6. Ions fromthe plasma are accelerated toward the insert by the radial electric field. The presence of arelatively high-electron density near the insert surface results in a change in curvature inthe sheath potential profile which several authors have referred to as a doublesheath.25,26,30,31 Figure 1.6 exaggerates the structure of the sheath to emphasize the

9
presence of electrons in the sheath. A double sheath develops at the boundary betweenquasineutral plasmas of different densities where the sheath is ion-attracting for oneplasma and electron-attracting for the other. The thermionic electrons are accelerated bythe potential of the sheath and comprise a high-energy component to the electronpopulation within the cathode.31 The high-energy electrons are referred to here asprimary electrons, using Siegfried’s terminology.25 The primary electrons perform thebulk of the ionization within the cathode, by both electron impact ionization and step-wise excitations. Through these collisions and Coulomb collisions, the primary electronsbecome thermalized. The bulk of the insert volume contains a partially ionizedquasineutral gas with a two component electron population. Only the thermal electronsin the tail of the distribution are able to stream back to the insert. The remaining thermalelectrons are accelerated toward the axis and the orifice by the electric field. The Debyelengths are on the order of a few hundred nanometers to a few micrometers. Ions in theinsert region are accelerated toward the insert double sheath by the radial electric field.Ions enter the sheath at or above the acoustic speed, according to the Bohm sheathcriterion.25,26,31,32 The collisions and recombination of the ions on the insert surface heatit to sustain the discharge. This ion current also accounts for part of the total cathodecurrent. The primary electrons comprise the balance of the discharge current from theinsert region.

10
Cathode Tube
Cathode Insert
Virtual Anode
i+
i+ e- e-
i+
Anode Sheath
e-
n, e-
Orifice Plate
Keeper
i+,e-,ni+
i+
Cathode Sheath
+ + + + + + + + ++ + + + + + + + +
Orifice Plate
Plasma
Ion Sheath
e- i+
------
------
++++++
++++++
DoubleSheath
OrificePlasma
InsertPlasma
e-
i+
n
e-
i+
Quasineutral Plasma
i+ e- e-
- - - - - - - - - - - - - - - - - -- - - - - - - - - - - - - - - - - -+ + + + + + + + + + + + ++ + + + + + + + + + + + ++ + + + + + + + + + + + +
Insert Plasma
Double Sheath
Cathode Insert
n = neutrali+ = ione- = electron
Figure 1.6 - Schematic of Hollow Cathode Physics
1.2.2 Orifice Region
A double sheath forms at the boundary between the insert and orifice regions.27,33
The electrons are accelerated into the orifice region by this sheath, while orifice regionions entering the sheath are accelerated toward insert region. The density and electricfield gradients prevent ions born in the insert region from entering the orifice.
The highest current density in the hollow cathode occurs in the orifice. TheDebye length is much smaller than the orifice diameter, and most collision mean freepaths are ten to one hundred times smaller than the dimensions of the orifice.24
Consequently most of the ions created in the orifice recombine on the orifice walls. Theelectrons in the orifice ionize the neutrals at a rate sufficient to replenish the ions lost tothe boundaries.24 The electron population within the orifice continues to diffuse towardthe outlet, carrying the discharge current in the process. Given that the Debye lengths aremuch smaller than the dimensions of the orifice, the small electric field in the plasmadrawing the ions toward the cathode potential surfaces is countered by ambipolardiffusion at the orifice exit. This allows ions to be emitted from the cathode.

11
1.2.3 Cathode-To-Keeper
Sheath thickness increases rapidly outside the cathode as the density decreases.If the current density of emitted ions is sufficient to maintain quasineutrality, then theelectrons readily stream toward the keeper due to the slight axial electric field presentoutside of the sheaths. This mode of operation, referred to as spot-mode, is typified byrelatively high flow-rate, low discharge voltage (8 to 20-V), and small amplitude voltagefluctuations. As the flow-rate, and consequently the ion current density, is decreased, thesheaths must grow in order to draw the electrons to the keeper or anode. Electrontemperatures increase due to a decrease in inelastic collisions and the shape of the electricfield. The density in the region is sufficiently low that many of the excited atoms andions decay before successive collisions ionize them. This mode of operation is referredto as plume-mode because it is usually associated with a luminous plasma plume betweenthe cathode and the keeper or anode. Other characteristics which typify plume-modeinclude relatively high discharge voltages (20 to 30-V) and large amplitude, high-frequency discharge voltage fluctuations (>4-V and >1-MHz). Some researchers havepostulated that the creation of ions within the cathode-keeper gap in plume-mode leads tocathode orifice plate erosion;23 the large voltage fluctuations accelerate the ions past thesputter threshold of the orifice plate material.
1.2.4 Downstream Plasma
Downstream of the keeper, Williams and Wilbur have observed the formation of apotential hill.34 Williams and Wilbur postulated that immediately downstream of thekeeper, the density is still sufficient for ionization to occur.34 The electrons, havinggreater thermal velocity than the ions, expand from this region leaving a net positivecharge density in this region which accounts for the potential hill. Further downstream,the electrons and ions, being many Debye lengths from the electrodes, expand sphericallyuntil they encounter another plasma where a double sheath forms. This expansion regionis especially critical for determining the emission current that a plasma contactor canprovide. Given the geometries of typical Hall and ion thrusters, the beam plasmas areexpected to be closely coupled to the cathode plasma, and the expansion of the cathodeplasma cannot be treated without considering the beam.
1.3 Summary of Hollow Cathode Development
Some of the earliest work with orificed-hollow cathodes for electric propulsiondevices was conducted by researchers at the NASA Lewis Research Center (LeRC) andHughes Research Laboratories (HRL) beginning in the 1960’s.1,23,35,36,37 The initialdevelopment work focused on the neutralizer hollow cathode for the Space ElectricRocket Test II (SERT II) mercury ion thruster. Rawlin and Pawlik characterized theoperation in spot and plume-modes and established that the cathode performance wasinsensitive to orifice aspect ratio over the range which they tested.1 By 1969, Rawlin andKerslake had demonstrated cathode lifetimes to more than 10,000 hours, and beganinvestigating the use of impregnated tungsten inserts.36 Byers and Snyder determined

12
that cathode power scaled inversely with keeper and collector surface area presented tothe cathode.35 An investigation performed at the Jet Propulsion Laboratory (JPL) in 1971determined the cathode tube temperature distribution experimentally and analytically.38
Mirtich reported the findings of an investigation into orifice plate erosion andtemperature distributions in hollow cathodes for 30-cm ion thrusters in 1973.37 Aninvestigation of the operating characteristics of hollow cathodes with barium oxideimpregnated porous tungsten inserts found that cathode operation with these inserts waseffectively identical to cathode operation with a rolled foil insert with a low workfunction coating.39 The impregnated tungsten orifice plates used in this investigationdegraded over several hundred hours of operation, suggesting that the barium hadevaporated.39 Rawlin also reported on the results of a 13,000 hour life test of a mercuryhollow cathode in 1973.23 The orifice plate had eroded from the downstream end inaccordance with the theory by Rawlin mentioned in the previous section.23 Whileexperimental investigations of hollow cathodes at NASA LeRC, HRL, and JPL havecontinued to the present, several efforts to model hollow cathode processes were reportedor started in the 1970’s.5,6,20,25,40,41,42
While Fearn and Philip did not present a predictive model, they were able toquantify several of the parameters necessary for the development of such a model.40 Thiswork focused primarily on the current emission processes. It was postulated that spot-mode operation occurred when the internal surface area of the orifice was sufficient tocarry the discharge at an experimentally determined current density; the current attachedto the upstream end of the orifice plate and the insert in plume-mode. A cathode wasconstructed with a solid tantalum insert to determine the role of the low work functionimpregnant. While discharges were obtained with the solid tantalum insert, the cathodegenerally operated at higher power and temperature than the cathode with a low work-function insert. In an attempt to better quantify the role of the orifice geometry, theupstream side of the orifice was chamfered, and the performance was compared with astraight orificed hollow cathode. Qualitatively, the results supported the authors’contention concerning the physics of spot and plume-modes. A discussion concerningelectron-impact ionization concluded that this mechanism was feasible at high flow-rates,but the path lengths became too great to account for the ionization at low-flow-rates. Thepresent work assumes that electron impact ionization and excitation are the dominantmechanisms controlling the plasma generation for reasons that will be discussed later.
Rehn and Kaufman performed some of the first investigations into the use ofnoble gases with hollow cathodes.41,42 The initial investigation involved a parametricexperimental study of the effects of changing the geometry of the hollow cathodeassembly. This work provides experimental evidence that the ionization processesdetermine cathode performance over a wide range of operating paramenters.41 Thecollaborative work by Rehn and Kaufman was an attempt to define parameters whichgovern cathode operation independent of geometry and propellant.42 While the resultsshowed distinct branches for spot and plume-modes while using a keeper, the dataobtained using a cylindrical anode failed to show similar structure.42 These analyses areattractive because of the ease of use, however, a predictive model requires more detail.
One of the first attempts to comprehensively model the hollow cathode dischargewas performed by Ferreira and Delcroix.5 This model uses theoretical derivations for themass flow, the ionization rate, and the radial and axial transport of charged particles.

13
This model is the only instance where an ionization model is used for an inert gascathode. The use of an ionization rate model mitigates the issues associated with theassumption of an equilibrium plasma. While this model details the physical processes,the thermal analysis for the cathode tube relies upon empirically determined temperatureprofiles. Consequently, the model lacks the flexibility necessary to predict the behaviorof new designs.
Siegfried and Wilbur developed a model for a mercury orificed hollowcathode.25,43 To provide validation data for the model, the charged particle fluxes to theinsert and orifice surfaces were quantified. The internal plasma was also probed todetermine the electron temperature, number density, and plasma potential. While thismodel uses a semi-empirical equation to predict internal pressure as a function of flow-rate and current, it also uses an ionization model to account for the primary electrons andtheir contribution to the ionization in the insert region. The effective emission length onthe insert was determined to be approximately two mean free paths for the primaryelectrons. Unfortunately, the use of an ionization model complicates the application ofthe overall set of equations to other propellants. The model also included a simplifiedheat transfer analysis of the energy transport to the cathode tube.
In the 1980’s, interest in inert gas thrusters increased, and the use of the hollowcathode as a plasma contactor emerged.34,44 These new developments created the needfor two new aspects to the modeling of hollow cathodes: 1) examination of the couplingof the hollow cathode plasma with the space or discharge plasma, and 2) an insert regionmodel for inert gases. The first of these necessities was addressed in the work byWilliams and Wilbur.34 They developed a model to describe the formation of thepotential hill downstream of the cathode and the expansion of the plasma from thedownstream side of the potential hill. In addition, they measured a plasma double layerbetween the contactor plasma and the ion source plasma.
Salhi and Turchi sought to address the need for an orificed hollow cathode modelfor inert gas propellants.26,45,46 Salhi began by developing an insert region model similarto that used by Siegfried.25,26 However, Salhi used a theoretically derived relation for thecathode pressure and modeled the electron number density using a two-temperature Sahaequation. It should be noted that the mass flow-pressure relation in Salhi26 contains twoerrors, and the two-temperature Saha equation was developed mathematically, withoutphysical basis. A parametric study of the plasma properties inside the insert region wasconducted to provide validation data for the model. The results of the experimentalinvestigation agreed with the trends reported by Siegfried, while adding spectroscopictemperature and insert internal temperature measurements.25 One of the changes Salhi26
made to his model as a result of the experimental investigation was to incorporate theradial variation in the heavy particle temperature as a function of the discharge current.The major shortcoming of the model by Salhi26 in terms of the current work is theassumption of electron cooling being the only heat rejection term for the insert.Conduction and convection to the neutrals are terms which become important at low-power density.
The models of Siegfried25 and Salhi26 both focus on the processes in the insertregion and neglect the orifice physics. Mandell and Katz have developed a model forhollow cathode operation which is based primarily upon the processes within theorifice.24 The insert region is treated simply as a plasma source. Ion loss in the orifice is

14
balanced by volume ionization based upon a simplified model which takes only electron-impact ionization into account. By also solving a power balance in the orifice, theelectron temperature and number densities are calculated. The model is able to predictthe transition from spot to plume-modes based on whether the ion current expelled issufficient to maintain charge neutrality in the cathode-keeper gap. Given the high currentdensity within the orifice and the relatively large voltage drop predicted across theorifice, the need for modeling the insert physics is clear, particularly for low-powercathodes.
In addition to the efforts in the United States, the United Kingdom, and Francementioned above, similar work for the European RIT 10 ion thruster and space plasmacontactors for tethers has been conducted in Germany and Italy.27,47,48,49 The work byCapacci, et al. presents a model which incorporates all of the plasma regions depicted inFigure 1.3. The insert region model is based primarily on the work of Siegfried and usesthe Saha equation to evaluate the electron number density.25 The Saha equation is onlystrictly valid for a thermal plasma where the electrons and ions have the sametemperature. A planar double sheath approximation is used at the entrance to the orifice.Within the orifice, the Saha equation is again used; the equilibrium assumption necessaryfor the Saha equation may be violated considering the plasma has typically two or moreparticle temperatures. A detailed thermal analysis from previous work is also used in themodel.
1.4 Contributions of Research
The research to be presented here has focused on the development of hollowcathodes for low-flow-rate and low-power applications. The devices tested weredesigned based on extrapolation from existing space qualified hollow cathodes, and thelimitations of this basic design were examined in the search for an optimal design. Theprincipal goal of this dissertation was to minimize the power and propellant consumed byhollow cathodes for electric thrusters and plasma contactors. The experimentalinvestigation included the following contributions:
• A parametric investigation of the effects of orifice aspect ratio over a largerrange than previous studies.
• Thermographic analysis of the cathode temperature distribution to establishthe nature of the dominant heat transfer mechanisms in the cathode tube andto enable cathode material selection to minimize cathode power consumption.
• Observation of cathode pressures for small insert and orifice inner diameters.• Examination of the electron energy distribution function in the plume of the
hollow cathode.• Internal plasma diagnostics for low-current 3.2-mm hollow cathodes.In addition to the experimental investigation supporting the optimized cathode
goal, a conglomeration of several cathode models was developed to facilitate theoptimization process. The conglomeration was dictated by the extreme operatingconditions and the need to include the contributions of each section of the hollow cathodedischarge (Figure 1.3). By modeling the hollow cathode processes from end-to-end,more of the physics are included than in previous models.

15
CHAPTER 2
EXPERIMENTAL APPARATUS
The purpose of the experiments reported here was to generate cathodeperformance data at low-current and mass flow-rate to use in the design optimizationprocess. Just as it was initially unclear how to scale hollow cathodes to low-powerapplications effectively, the operating conditions and plasma parameters in low-currentdischarges were a priori unknown. Consequently many of the experiments performed inthis investigation were similar to those reported elsewhere.25,26,35,38 Quantifying thedifferences in operating characteristics between 6.4 and 3.2-mm diameter hollowcathodes was one of the principal goals of the experimental investigation. In order to gobeyond previous experiments, thermography was used to evaluate external cathodetemperature profiles, and the electron energy distribution function was measured in theinternal and emitted plasmas. The temperature profiles on the cathode indicate whichmechanisms of heat loss are dominant. Ionization rates, both inside and outside thecathode, are strongly dependent upon the electron energy distribution function. Byunderstanding the heat loss and ionization mechanisms, the accuracy of a predictivemodel is improved, and the apparatus described here were essential to the overalloptimization effort.
2.1 The Hollow Cathodes
The design and fabrication of the hollow cathodes used in this investigation werederived from existing hollow cathode and plasma contactor procedures.6,17 Since thecathodes were laboratory models, a number of the specifications and inspectionprocedures required for flight hardware were either relaxed or omitted. However, theauthor attempted to follow the flight hardware procedures when it was reasonable to doso, in order to facilitate the transition from laboratory models to flight units.
2.1.1 Hollow Cathode Design and Fabrication
An engineering schematic of the 3.2-mm diameter hollow cathodes is presented inFigure 2.1. The cathode orifice plates were made from two-percent thoriated tungsten.This material has a low sputter yield and a long history of use for hollow cathode orificeplates. The orifice and chamfer on the downstream end were made using a lathe.Following the machining, the orifice plate was cleaned in a heated, ultrasonic bath ofacetone for one half hour, and then a bath of ethyl alcohol for one half hour. Thiscleaning procedure was used for all metallic components used in the cathode; the insert,heater, and propellant isolator were used as is, without additional cleaning. The cathodetube was a molybdenum-rhenium alloy, which was used because of its strength at high-temperature and its resistance to oxygen adsorption. Materials which adsorb oxygen mayrelease it at high operating temperatures, thereby poisoning the cathode. To reduce theoxygen content of the alloy, the tube is heated in a hydrogen furnace after it has been

16
machined to accept the orifice plate. Next, the orifice plate is electron beam welded tothe cathode tube.
Heater and Radiation Shields
Cathode Insert
Orifice Plate
Keeper
Cathode TubeInsert Legs
Leg Holder
Figure 2.1 - Engineering Schematic of the Orificed Hollow Cathode
Refractory metal electrical leads attached to the upstream end of the emitter wereswaged into electrical contact the with cathode tube through the use of a leg holder. Thisalso fixed the position of the emitter within the cathode tube. A sheathed tantalum heaterwas wound and friction fit to the end of the cathode tube. Twelve wraps of 0.13-mmthick tantalum foil were spot-welded to the heater to serve as a radiation shield. Thecathode insert was a cylindrical tube of sintered porous tungsten impregnated with 4BaO-CaO-Al2O3 by molar ratio.
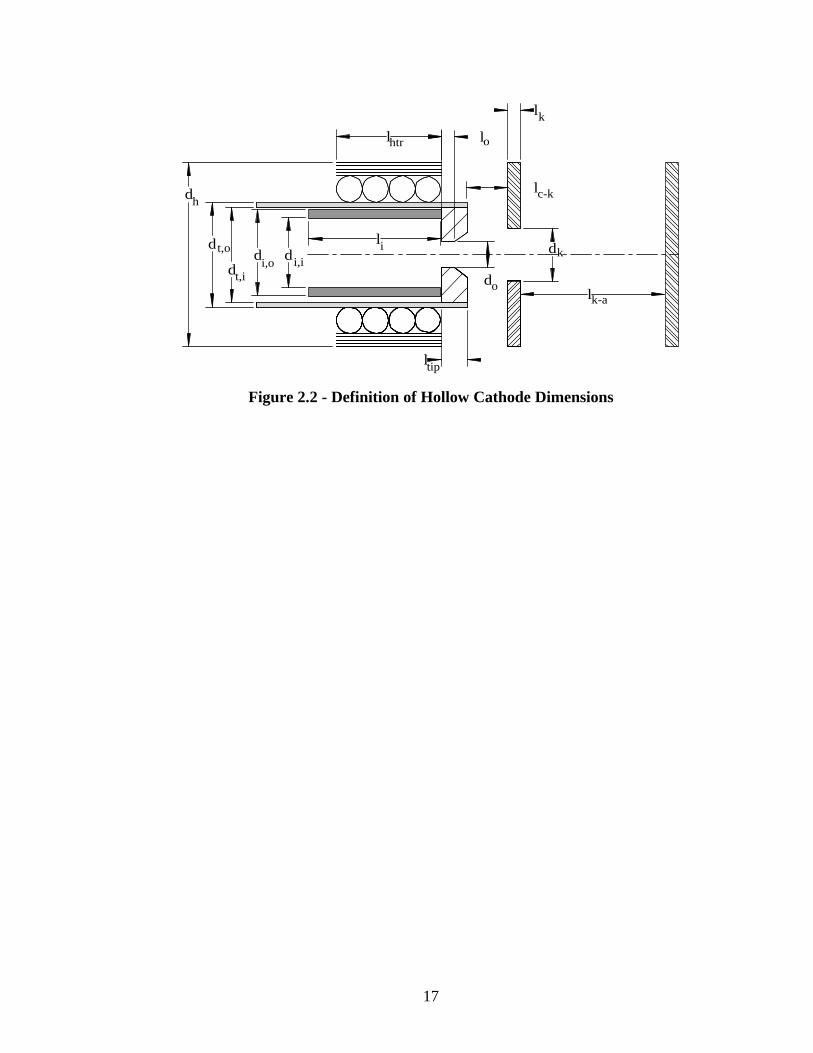
The initial set of experiments involved performance evaluations of twomechanically identical cathodes. When attempting to assess experimentally the effects ofvarying the orifice geometry on the performance of hollow cathodes, the ideal techniqueis to change only the orifice plate. This was done by Siegfried,25 using a slide valve withthree orifice geometries. Siegfried’s25 experiment was conducted on a mercury hollowcathode, and the aspect-ratios (lo/do in Figure 2.2) of the orifices were negligibly small incomparison with those considered in the current investigation. A similar experimentperformed with the aspect-ratios of interest would have been feasible. However,throughout the current investigation, the experiments were designed for hollow cathodeassemblies which could easily be integrated with a thruster. Consequently, to test theeffects of varying the orifice aspect-ratio on the performance of the cathode, separateassemblies were fabricated and tested. The variance in performance betweenmechanically identical cathodes was examined in order to validate that the observedperformance changes were due to orifice geometry changes. For reference, theconvention used in this work for the hollow cathode dimensions is illustrated in Figure2.2, and the specific cathode geometries tested are listed in Table 2.1. The cathodes AR6and AR6´ were used to determine the unit-to-unit variance, enabling accurate comparisonof test results between cathodes of differing geometries.
17
l
l l
l
l
l
d
ddd
d
d
l
d
h
t,o
t,ii,o i,i
i
o
k
c-k
k-a
htr o
k
tip
Figure 2.2 - Definition of Hollow Cathode Dimensions

18
Table 2.1 - Dimensions of the Orificed Hollow Cathodes Tested in this Investigationin mm
Cathode dt,o dt,i di,o di,i li do lo ltip lc-k dk lk
AR1 3.18 2.67 2.29 1.22 12.7 0.12 0.18 1.22 1.00 2.29 1.52AR3 3.18 2.67 2.29 1.22 12.7 0.13 0.38 1.22 1.00 2.29 1.52AR3-a 3.18 2.67 2.29 1.22 12.7 0.08 0.23 1.22 1.00 2.29 1.52AR6 3.18 2.67 2.29 1.22 12.7 0.13 0.71 1.22 1.00 2.29 1.52
AR6´ 3.18 2.67 2.29 1.22 12.7 0.13 0.71 1.22 1.00 2.29 1.52OK1 3.18 2.67 2.29 1.17 12.7 0.13 0.71 1.22 1.00 2.29 1.52EK1 3.18 2.67 2.29 1.17 12.7 0.13 0.71 1.22 1.00 2.29 1.52
Three factors motivated the particular orifice geometry chosen for AR6 and AR6´.The orifice diameter was chosen based on the expected maximum emission current of thecathode. The orifice has been found to erode over a few tens of hours until the ratio ofthe current to the orifice diameter is below 12 A/mm.50 Consequently, the diameter waschosen to be 0.13 mm which corresponds to a maximum current of 1.56 A. The cathodeswere operated at up to 1.50 A for several hours at a time. The orifice length wasdetermined both by the need to facilitate ionization within the orifice and by fabricationconsiderations. As the physical path length for electrons increases within the orifice, theprobability for ionization increases. To first order this effect causes ion flux from theorifice to scale with the orifice length; the ion flux from the cathode is directly tied to theionization rate. By increasing the ion density in the orifice, the flux of ions emitted isincreased, allowing the cathode to remain in spot-mode emission at lower flow-ratescompared to cathodes with shorter orifices.24 The power deposited in the orifice alsoscales with length, and a trade-off must be made. The third consideration is the ability tofabricate the cathode. The limiting fabrication issues with the techniques used here werethe electron beam weld of the orifice plate to the cathode tube and drilling the orifice.For orifice plate thickness less than about 1.2-mm, the electron beam would melt theentire orifice plate, destroying the orifice. Consequently, the overall thickness was set to1.2-mm. This still allowed the orifice length to be adjusted from 0 to 1.2-mm by varyingthe depth of the chamfer. The final orifice length of 0.71-mm was set to increase thepower deposition to the cathode at low-currents where self-heating is reduced and toreduce the flow-rate necessary to maintain spot-mode emission. The cathode tube outerdiameter was set to 3.2-mm due principally to the availability of both tube materialsmaller than the 6.4-mm standard and appropriately sized inserts. By using 3.2-mm, asopposed to 6.4-mm, diameter tubes, conduction and radiation losses from the cathodewere reduced. All of the inserts used in this study, except where noted, were chosenbecause of their availability, and no attempt was made in the initial studies to optimizethis component.
Given that the orifice aspect-ratio of the baseline cathode was nearly 6,considerably higher than is typically used in orificed hollow cathodes, the focus of part ofthe initial investigation was to examine the effects of orifice aspect-ratio. This wasaccomplished by varying the orifice length. The resulting cathodes, AR1 and AR3, hadorifice aspect-ratios of just over one and approximately 3, as their names suggest. Theseratios were selected because AR1 closely approximates the geometry of 6.4-mm diameter

19
cathodes and AR3 provides an intermediate geometry between the extremes. The orificegeometry was expected to play a large role in determining cathode performance sinceconducting most of the current through the orifice causes the most extreme plasmaconditions (temperature and number density) to occur in the constricted channel. Ionsbackstreaming to the cathode face account for only a small fraction of the total current.25
The cathode AR3-a was designed for slightly lower currents than the cathodesmentioned previously. The projected current limit of this cathode was 1-A. The aspect-ratio was chosen in part to reduce the power deposition in the orifice. The fabricationtechniques also drove the design toward a shorter orifice.
Initially cathode AR6´ was fabricated with an insert made of rolled tantalum foildipped in the emissive mixture R500. This cathode is referred to AR6´´ and was furtherdistinguished from all the other cathodes by an insert inner diameter on the same order asthe orifice diameter. This insert was later discarded in favor of a standard impregnatedporous tungsten insert. The R500 emissive mixture was also used to coat 0.5-mmdiameter tungsten wires which were bundled to serve as an electron emitter in twomultichannel hollow cathodes. Neither of these cathodes had an orifice plate. They arereferred to here as MC7 and MC13 indicating the number of wires bundled in the insert.Figure 2.3 shows an end view of the cathodes. These were intended to operate at reducedvoltage when compared with an orificed hollow cathode due to the less constricted pathfor the current and the increased emitter surface area. Multichannel hollow cathodeshave been used successfully in a number of other applications.51,52
The keeper design and gap were invariant throughout the testing of the effects oforifice geometry. After the performance of AR3 had been characterized, a molybdenummesh keeper was installed as shown in Figure 2.4. This configuration, referred to as AR3-A was chosen for ease of alignment and to test the performance of this type of keeper.

20
Tungsten Wires Coated with R500
Heater andShield
a) MC7 with R500 Visible (White Areas Indicate R500)
Tungsten Wires Without R500
b) MC13 Post-Test (Note the Depletion of R500)
Figure 2.3 - End View Photographs of the Multichannel Hollow Cathodes
One of the most basic means to improve the efficiency of low-current hollowcathodes is to thermally isolate the high temperature elements to the extent possible. Thedistinction between low-current, less than 2.0-A, and high-current, greater than 2.0-A,hollow cathodes is important; as the total emission current is reduced, the electroncooling of the emitter surface becomes fractionally smaller compared to conductive andradiative losses. When considering the design illustrated in Figure 2.1, modificationswere incorporated to reduce the conduction and radiation losses from the cathode.Without changing the tube material, increasing the length of the tube was chosen toreduce the conductive losses; in this case, the low-temperature “reservoir” of componentswere farther from the high-temperature emitter. This configuration was tested with theopen keeper geometry, OK1, shown in Figure 2.5. This design also enabled the use of aremovable, enclosed keeper, as depicted in Figure 2.6. The use of an enclosed keeperprovides a radiation enclosure for the cathode. Since this cathode was operated with bothopen and enclosed keepers, the performance benefits of the enclosed keeper system werequantified.

21
Cathode
Keeper
Figure 2.4 - AR3 (AR3-A) with Mesh Keeper, Internal Langmuir Probe, andThermocouples
Cathode Tube Cathode Heater
Open Keeper
Thermocouples
Figure 2.5 - Open Keeper Configuration of the Extended Tube Cathode (OK1)
Keeper Enclosure
Cathode Tube
Cathode Heater
Thermocouples
Figure 2.6 - The Enclosed Keeper Cathode
2.1.2 Hollow Cathode Operation
The barium impregnated emitter in the hollow cathode required conditioning afterexposure to atmosphere and prior to operation. The procedure was derived from a

22
cathode activation process first reported by DePauw.53 Initially the cathode and feedsystem up to the flow controller or metering valve were evacuated to less than 1.3 x 10⁻⁴
Pa for at least 12 hours. Next, the cathode was heated to approximately 500 ºC on theinsert for three hours. The heater was then deactivated for 30 minutes. Finally thecathode was heated to approximately 1000 ºC for one hour and then allowed to cool for30 minutes. This process removed the adsorbed carbon dioxide and water in the insertwhile preparing the surface for electron emission. In practice, it was infeasible to directlymeasure the insert temperature, and the orifice plate temperature was assumed to providean accurate approximation.
The cathode ignition procedure was directed toward low-voltage (<40 V) ignitionof the discharge. Figure 2.7 shows the circuit used in these experiments. Initially theheater was activated to raise the cathode temperature to at least 1000 ºC. After severalminutes, a 0.4 to 0.5 mg/s flow of xenon was initiated; steady-state operating flow-ratesfor these cathodes were below 0.3 mg/s. Once the feed lines had pressurized, the keeperpower supply was turned on. In most cases this procedure was sufficient to initiate thedischarge. In some instances, it was necessary to use a high-voltage (>500 V) igniterpower supply attached in parallel with the keeper supply to start the discharge.Following ignition, the heater coil was de-energized.
A
A
AnodeKeeper
Heater
A
V
V
Cathode
Anode Supply
Heater Supply
Keeper Supply
Figure 2.7 - Circuit Diagram for the Hollow Cathode in a Triode Configuration
The performance characterizations were conducted by varying the flow-rate atconstant current in a diode discharge between the keeper and cathode. The discharge washeld at a constant condition for at least 15 minutes prior to taking data. The cathode wasoperated initially in spot-mode, and the flow-rate was decreased until the onset of plume-mode. Spot-mode is also characterized by having a small AC component in the current(<<0.1-A) and voltage (<1-V), and a small luminous “spot” at the orifice of the cathode.1
Plume-mode by contrast has a luminous “plume” that extends downstream to the keeper

23
and beyond, and the AC component of the current and voltage becomes a large fractionof the DC values. The limitations on the regime of discharge currents were determinedby cathode temperature at large relative current and by discharge stability at low relativecurrent. Spot-mode emission at orifice plate temperatures below 1300 ºC was chosen asan operational limit for these experiments to be consistent with practices proven to enablelifetimes greater than 10,000 hours.64 The cathode tip temperature has been consideredthat which is the most closely related to the insert temperature.26,64 If the temperature istoo high, the barium in the insert evaporates more quickly than it can be replenishedthrough diffusion, and the discharge becomes unstable; low temperatures are insufficientto drive the chemical reactions at a rate that sustains the low work function surface of theemitter.28 Since the lower limit represents a non-destructive condition, the cathodes wereoperated at as low of an orifice plate temperature as stable operation permitted.
The goal of the performance characterizations was to obtain the lowest power andflow-rate for spot-mode emission. By focusing on a diode discharge, comparisonbetween the performance of the hollow cathodes was straightforward. This approachassumes that the total emission current, the sum of the keeper and secondary anodeemission currents, dominates the conditions at the cathode, regardless of the distributionof the current to the keeper and secondary anode.
2.2 Diagnostics and Experimental Techniques
Since the ultimate goal of this investigation was to determine a means to optimizehollow cathodes for low-current applications, the power and propellant consumptionwere the primary focus of the experiments. The performance of each of the cathodes wasdetermined by examining the variation in the operating voltage and mode as a function offlow-rate and current. This type of examination yielded the end product, the mass flowand power consumed by the cathode in spot-mode. Detailed experiments focused onprocesses known to affect cathode performance were conducted in order to determinemore precisely the mechanisms governing cathode performance. Heat loss from theemitter constitutes one of the major performance-influencing processes. Consequently adetailed thermal study was conducted to determine the mechanisms governing heat loss.The character of the plasma discharge and electron transport also influences cathodeperformance, and plasma properties were measured both in the insert region anddownstream of the keeper using electrostatic probes. The thermography, plasma, andseveral other diagnostics are summarized in this section.
2.2.1 Cathode Performance
The cathode performance was considered the relationship between the cathodepower and the flow-rate required to maintain spot-mode emission. Consequently thevoltage, current, and flow-rate were monitored in all of the experiments. Current andvoltage of both the discharge and the heater were monitored using digital multimeters anda computer data acquisition system. Figure 2.7 shows the circuit with the multimeterpositions, and Figure 2.8 illustrates the computer data acquisition scheme. A digitaloscilloscope with x10 voltage probes was used to observe high frequency fluctuations in

24
the discharge voltage. The computer data acquisition and control system enabledextended duration (> 100 hours) tests which were performed to examine the performancevariance in time. Although cathode life times were expected to be two orders ofmagnitude longer than the extended duration tests, the term of these performanceevaluations was deemed sufficient in the context of the present investigation. Figure 2.9shows some of the data collected during a 160 hour test of AR1. The heater was onlyactivated during cathode conditioning and ignition. About 52 hours into the test, thecathode was shut-down during a performance characterization, and the cathode wasrestarted the following day. Performance characterizations are shown in Figure 2.9where the mass flow-rate varied greatly over a relatively short period. The cathodeoperating temperature varied by less than 100 ºC during the discharge.
Cathode Heater Keeper
Signal Conditioner
Multiplexer
Digital-to-Analog Converter
Computer
I
I
V
V
Heat
Keep
Heat
Keep
Analog-to-Digital Converter
Hea
ter
and
Kee
per
Con
trol
Sig
nals
Thermocouples
Heater Supply Keeper Supply
Figure 2.8 - Cathode Control and Diagnostic Scheme

25
8
6
4
2
0I he
at (
A)
160140120100806040200
Time (hrs)
2.01.51.00.50.0
I keep
(A
)
43210
Vhe
at (
V)
50403020100
Vke
ep (
V)
54321m
dot
(scc
m)
20015010050P
port
( µµT
orr)
1000800600400200
0
Ttc
(C
)
Figure 2.9 - Sample Data Log from AR1.
The xenon flow system is illustrated in Figure 2.10. The flow-rate was measuredusing either a Unit UTM-1101 mass flow meter or a Unit 1660 mass flow controller bothwith a full-scale flow of approximately 0.5 mg/s. The flow meters and controller werecalibrated using a National Institute of Standards and Technology (NIST) traceablebubble flow meter. The flow-rates reported here are accurate to within ±7x10⁻³ mg/s.

26
Shut-off ValvesCapacitance Manometer
P
Xe
Flow Meter
Flow Control Valve
HollowCathodeAssembly
VacuumFlange
P
Figure 2.10 - Simplified Flow Schematic
While cathode performance and emission capabilities are the primary concerns forthe overall thruster design, the cathode pressure when combined with plasma diagnosticsenables a detailed physical picture of the cathode processes to be developed. Salhi26
found that the pressure in a 6.4-mm diameter cathode with a 1.21-mm diameter orificewas approximately 665 Pa on xenon at operating conditions similar to those reportedhere. As an approximation, the cathode pressure scales as the ratio of the orifice areas.Given the data from Salhi,26 the enclosed/open keeper cathode, AR1, AR3, AR6, andAR6´ were expected to operate in the range of 40 kPa. Consequently, a MKScapacitance manometer with a full-scale range to 133 kPa and accuracy over four decadeswas used to measure the pressure inside the cathode. The capacitance manometer zeroagreed well with the other vacuum gages in the vacuum chamber, and the atmosphericpressure reading was accurate to within 1.3 kPa. Although the interrogation point wasapproximately 0.5-m upstream of the cathode insert, it was concluded that the measuredpressure accurately represented the cathode internal pressure; calculation of the Reynoldsnumber and expected pressure drop based on Poiseuille flow yielded results on the orderof 10 and 1-Pa, respectively.
2.2.2 Cathode Temperature Distributions
Type R thermocouples were used for accurate, calibrated point measurements ofthe cathode temperature. Thermocouples operate on the principle that the Fermi energyvaries between any two materials, and by joining two dissimilar metals, an electric fieldis established at the interface between the materials. The resulting Seebeck voltage canbe measured and compared with data from thermocouple tables for a specificcombination of materials. Type R thermocouples consist of platinum and platinum 90% /rhodium 10% wires welded to each other at the ends. The ANSI tolerances for type Rthermocouples are ±1.4 ºC from 0 to 538 ºC and ±0.25% from 538 to 1482 ºC.54
The thermocouple readout was calibrated against a NIST traceable standard priorto the tests reported here. Random errors in the thermocouple measurements werenegligible since readout values never oscillated more than 0.5 ºC during a sampling.

27
Systematic errors in the thermocouple measurements were most likely to occur due topoor thermal contact with the cathode material. To minimize the error due to contactthermal resistance, the thermocouples were spot welded to the cathode surfaces. In theworst case for the thermocouple attached to the orifice plate, the power conducted awayfrom the site was on the order of 1000 times smaller than the discharge power andcomparable to the radiative component in the absence of the thermocouple.55
Consequently the temperature measurement had an estimated uncertainty of less than onepercent.
The thermocouple data provided discrete measurements of the cathode tubetemperatures with a high degree of accuracy. In order to fully evaluate the thermaldesign of a hollow cathode, a continuous temperature map enables determination of thedominant heat transfer and deposition methods. Optical measurements provide data overthe entire visible surface of the cathode while sacrificing some of the accuracy ofthermocouples. A combination of these temperature measurements is described below.
2.2.2.1 Thermal Imaging SystemCathode and enclosed-keeper temperature profiles were acquired with the
imaging system illustrated in Figure 2.11. The overall scheme was conceptually similarto that reported by Polk and Goodfellow56 with appropriate modifications based on theexpected temperature range. A commercially available imaging radiometer was usedbecause the anticipated temperature range required the capability of scanning beyondvisible wavelengths. The radiometer had a spectral bandpass of 8-12 µm. A coated zincselenide viewport, with a transmittance greater than 95% between 8 and 12 µm, wasinstalled for these experiments. The radiometer incorporated germanium optics whichhave a high transmittance in the infrared. A 3.0x germanium telescope, with atransmittance of 0.80, was used with close-up optics to enlarge the cathode image.Within the radiometer, incoming light was scanned horizontally and vertically usingelectromechanical servos and focused onto a mercury-cadmium-telluride detector. Thedetector was encased in a dewar cooled by liquid nitrogen. The finite size of the detectorlimited the true spatial resolution of the diagnostic. This limitation was especiallyapparent at boundaries where emissivity and temperature changed over a small distance.The effect was to attenuate the measurement in the high intensity region and to inflate thevalues in the low temperature area. The extent to which this occurred in thisinvestigation will be discussed later. The system was rated for temperatures ranging from0 to 1500 °C with selectable spans from 5 to 500 °C. Each of these temperature spanshad a maximum dynamic range of 8 bits using the image averaging software.
The video output of the radiometer was connected to an 8 bit grayscale framegrabber board in a computer. The grayscale acquisition relied only on the luminanceportion of the video signal. The resulting image on the computer had an intensitybetween 0 and 255 dependent upon the input luminance. The radiometer system attacheda grayscale bar to the image as seen in Figure 2.12, which was used as a check of thelinearity of the transfer function of the frame grabber board; a linearly increasing profileof the pixel intensity in the grayscale bar ensured that the radiometer output was beingrepresented accurately on the computer. Figure 2.13 shows an infrared image of theenclosed-keeper with a reference mark for position calibration. The line profile tool inthe image acquisition package was used to evaluate the distribution of pixel intensityalong a line drawn on the image. The pixel profile was related to the temperature profile

28
through the transfer functions. For this investigation, only centerline profiles wereacquired since the emitted radiation intensity depended only on the normal emittance; thistechnique minimized apparent temperature variation due to emittance and geometriceffects.
Control/Electronics Unit
Computer
Imaging Radiometer
3x Telescope
ZnSe Viewport
Hollow
Equipped with a Frame Grabber Board and Image Analysis Software
Cathode
τ = 0.95
τ = 0.80
Figure 2.11 - Thermography Experimental Set-Up
Cathode Tube
Cathode Heater
Cathode FaceReflected in Keeper
Figure 2.12 - Sample Image Generated by the Imaging Radiometer

29
PositionCalibration Mark
Figure 2.13 - Radiometer Image of the Enclosed Keeper.
2.2.2.2 Calibration of the RadiometerAlthough the radiometer was capable of correcting for the estimated emittance of
the cathode and the transmittances of the viewport and lenses, the images were leftuncorrected for the following reasons: 1) uncertainty in the emittance of the target as afunction of wavelength and temperature and 2) uncertainty in the true transmittance ofthe optics. Instead, the temperature profiles were compared with thermocouple data toprovide a calibration. This method assumed that the thermocouples were in equilibriumwith the cathode tube at the point of interrogation, that they were a negligible heat sink,and that the temperature distribution was azimuthally symmetric, since the thermocoupleswere located opposite of the radiometer. Type R thermocouples were spot welded toselected locations on the cathode and keeper. Although the spot weld provided a lowthermal resistance contact between the thermocouple and the cathode or keeper, thetendency of the thermocouple to act as a heat sink was mitigated by using 0.25 mmdiameter wire. The assumption of azimuthal symmetry was taken for convenience, andthe results of the destructive analysis of the 28,000 hour hollow cathode suggest a highdegree of azimuthal symmetry for all the cathode properties.6 The calibration procedurerequired at least two thermocouple references on each material in the field of view of theradiometer. With two temperature measurements, a slope and an offset were determinedusing Equation (2.1) for the transfer function between pixel luminance and temperature.
( ) ( )( )
max min,min min
,max ,min
( ) ( )p p
p p
T TT x I x I T
I I
−= − +
−(2.1)
Essential to an accurate temperature calibration, position calibrations wereperformed using known references within the image. The position calibration was savedto the computer viewport which provided the same scale for all the images collectedduring a test. In the case of the enclosed keeper, only two thermocouples were requiredfor calibration since the material properties were assumed to be uniform.

30
2.2.2.3 Profile Acquisition and ProcessingOnce the camera was sighted on the cathode or keeper and the spatial calibration
was configured, data acquisition consisted of grabbing a frame and downloading the lineprofile. The frame grabber software was configured to average 10 images, which whencombined with the four image average performed by the radiometer control package,yielded an overall averaging of 40 frames. Further averaging appeared to have anegligible impact on the smoothness of the line profiles. Images were acquired at all theconditions represented in the performance characterization. Temperatures and operatingconditions were recorded for reference and calibration of the image data.
The line profile data were recorded as a spreadsheet column. From the spatialcalibration, position in the column was related to a location along the cathode or keepercenterline. Next, the pixel intensity was correlated to the thermocouple measurements.Thus by definition the line profiles matched the thermocouple data reported here. Figure2.14 shows a line profile prior to temperature calibration.
250
200
150
100
50
0
Pix
el V
alue
(0
- 25
5)
-40 -30 -20 -10 0
Distance from Cathode Tip (mm)
Figure 2.14 - Sample Line Profile Results From the Radiometer
2.2.2.4 Error Analysis of the Temperature MeasurementsThe accuracy of the thermocouple data was discussed previously, and the image
data were averaged to minimize the random errors. Calibrating the image againstthermocouple data eliminated the difficulty in obtaining a thorough characterization ofthe surfaces and optics which would be required to treat the radiometer output as anabsolute measurement of the two-dimensional temperature field. The largest source ofsystematic error was associated with the inability of the radiometer to handle largetemperature gradients in the two-dimensional space of the image. This effect can be seenin Figure 2.14. At the boundaries between the cathode tube and the heater radiationshield, the pixel data failed to reflect the same sharp transition in intensity expected witha step change in both temperature and emittance. This data artifact was characteristic ofthe imaging radiometer. The data from these transition locations were omitted whenpresenting the temperature profiles.

31
2.2.2.5 Optical Pyrometer Based Orifice Plate Temperature MeasurementsIn most of the tests reported here, the orifice plate temperature was measured
independently of the thermocouples using an optical pyrometer. Both a disappearingfilament pyrometer and an optical thermometer were used. The disappearing filamentpyrometer operates by comparing the color of an incandescent filament with that of thetarget. The pyrometer used in these investigations had a correction for the emittance ofthe material, and a value of 0.39 was used based on previous work.57 Ramalingam andJacobson58 measured the emissivities of various tungsten alloys, and their data indicate anemissivity as high as 0.525 depending upon temperature and composition. In addition,the effect of the surface geometry of the orifice plate will determine the effectiveemittance as seen by the pyrometer. Corrected temperatures for an emittance of 0.53were also obtained using the transfer function for the pyrometer power supply. Thepyrometer data reported in Chapter 3 represents the mean value, with the error barsextending to the limits of the estimated emittance. The definition of emissivity was usedto calculate a temperature span for the optical thermometer. Wein’s Law can be used toderive the following equation relating brightness temperature (Tβ) to the blackbodytemperature (TBB) with a correction for emittance (ε):54
1 1ln
BB
nk
T T hcβ
λε= − (2.2)
where λ is the wavelength transmitted by the red filter of the pyrometer, n is the index ofrefraction, k is Boltzmann’s constant, h is Planck’s constant, and c is the speed of light.Here the brightness temperature is defined as the temperature necessary for a blackbodyto emit the observed radiation intensity, and the blackbody temperature, TBB, is the truebody temperature corrected for the emittance. Using Equation (2.2), the meantemperature between the limits of the emittance is reported here. By using the limits ofthe estimated emissivities (0.39 to 0.53), the accuracy of the optical thermometertemperature measurement was approximately ±1 percent.
2.2.3 Plasma Diagnostics
2.2.3.1 Langmuir ProbesLangmuir probe diagnostics were conducted in the emission plasma downstream
of the keeper, in the cathode-to-keeper gap, and in the insert region of AR3 as part of thisinvestigation, as shown in Figure 2.15. The temperature, number density, and characterof the distribution of the plasma both internal and external to the hollow cathodeinfluence the power deposition to the cathode and the keeper. The plasma properties alsoallow for accurate descriptions of the current conduction processes.24 The insert plasmaproperties are important for understanding the power deposition to the insert, forproviding an accurate description of the particle flux to the orifice entrance, and fordetermination of the parameters governing the cathode internal pressure. Measurementof the plasma properties in the orifice was considered infeasible with electrostatic probes.The mechanisms governing spot and plume-mode operation can be discerned from thecharacter of the plasma in the cathode-keeper gap. The emission plasma properties

32
determine the ease of the charge transport to a secondary anode, ion beam, or ambientplasma.
Internal Probe
CK Gap Probe
Radial Probe
Axial Probe
Cathode
Anode
Keeper
Figure 2.15 - Langmuir Probe Locations and Designations.
Planar Langmuir probes were used for all of the results presented here. The probediameters were chosen to be 2-mm in the emission plasma, 0.13-mm in the cathode-to-keeper gap, and 0.25-mm in the insert region, much larger than the expected Debyelengths and yet small enough to draw a negligible current in the electron saturationcondition (~20 mA). Downstream of the keeper, one probe was placed with its faceperpendicular to the flow from the cathode (axial probe), and the other probe wasoriented parallel with the flow (radial probe). The cathode assembly, complete with thesecondary anode located 60 mm downstream of the keeper, was mounted to a lineartranslation stage which moved the assembly with respect to the probes. The probes werepositioned on axis with the hollow cathode, and data were taken at 5-mm incrementsbetween 2 and 52-mm downstream of the keeper. In addition, a 0.5-mm diameter planarLangmuir probe was used to examine the plasma 5-mm downstream of the keeper of bothMC7 and MC13. This probe was operated similarly to the axial and radial probes onAR3. The cathode-to-keeper gap of AR3 was increased to 4-mm to enable a planarLangmuir probe to be inserted radially into the gap. Again, the translation stage was usedto move the cathode with respect to the probe. The test configuration dictated a fixedprobe for the insert region, and axial resolution was only possible by replacement of theprobe. The results presented here were from three such tests, and the reader should beaware that the radial location of the probe was confined by the insert and the aluminashield on the probe, but otherwise undetermined. The probes extended to 1.5, 0.7, andwithin 0.5-mm upstream of the orifice. The discharge appeared to be unaffected by thepresence of any of the Langmuir probes.
The axial and radial probes, downstream of the keeper, were biased using abipolar power supply with a triangular voltage ramp at a few Hz. The axial and radialprobes were biased with respect to the secondary anode. The current was measured usinga calibrated shunt resistor. A digital oscilloscope was used to record the probe current

33
and voltage, and a computer data acquisition system was used to download the current-voltage (I-V) characteristics. A source meter was used to bias and measure the I-Vcharacteristic of the internal probes and the cathode-to-keeper (CK) gap probe. Theinsert probes were ramped with respect to cathode potential, and the CK gap probe wasbiased with respect to the keeper. The source meter sent the current and voltage data ofthe probe directly to a computer via a GPIB connection.
Simplified Langmuir probe analysis was performed to reduce the data. Theassumptions for this analysis are listed below for reference:59
• Infinite, quasineutral, and homogeneous plasma.• Maxwellian electron and ion populations with Te>>Ti. Note that experimental
laser induced fluorescence data show that this assumption does not strictlyhold. 60
• Electron and ion mean free paths much greater than probe or sheathdimensions.
• Charged particles collected at the probe surface without reflection or reaction.• Sheath size is small compared to probe dimensions.
Implicit in the assumption of a homogeneous plasma is the requirement of isotropy in thevelocity distribution. The electron temperature was taken as the inverse slope of thenatural log of the electron current near the floating potential as shown in Equation (2.3).The plasma potential was taken as the probe voltage at the peak of the first derivative ofthe current, defined in Equation (2.4). The electron number density was calculated basedon the current at plasma potential for the axial, radial, and internal probe data because themeasurement of the ion saturation current was insufficiently accurate. Equation (2.5)defines the electron number density calculated from the plasma potential current. The ionsaturation current was defined as the probe current at ten electron temperatures below thefloating potential and was used to obtain the electron number density for the cathode-to-keeper gap plasma; use of the electrometer permitted a high degree of accuracy inmeasuring the ion saturation current. The electron number density was calculated in theion saturation region using Equation (2.6). The details of the Langmuir probe and EEDFanalysis are summarized in Appendix A.

34
( )1
ln ee
pr
d IT
dV
−
=
(2.3)
prp pr
pr
dIV V maximum
dV
= =
(2.4)
( ) 0.52pr p e
epr e
I V mn
eA kT
π =
(2.5)
( ) 0.510 2pr f i
epr e
I V T mn
eA kT
π− = −
(2.6)
2.2.3.2 Electron Energy Distribution Function MeasurementIn addition to the standard Langmuir probe analysis, the electron energy
distribution functions were evaluated by examining the character of the second derivativeof the probe current with respect to voltage. For an isotropic electron population, thesecond derivative of the probe current is approximately proportional to the electronenergy distribution function (EEDF)61,62
( )2
2
pr
pr
d If E A E
dV; (2.7)
where A is a normalization constant and the electron energy, E, is defined as
.p prE V V= − (2.8)
The second derivative of the probe current was obtained by numerical differentiation.Rundle, et al.63 measured the electron energy distribution function in an O2 glowdischarge, and used the generalized formula
( ) ( )exp xf E A E bE= − (2.9)
where A, b, and x are constants, to curve fit the distribution data. The case where x = 1 isthe Maxwellian distribution, and when x = 2, Equation (2.9) yields the Druyvesteyndistribution. The coefficients in Equation (2.9) were determined by fitting the secondderivative to an exponential with the argument Ex. The exponent, x, was allowed to varybetween 1 and 2, and the correct value of x was determined by the quality of the fit. Thecoefficient b was determined directly from the fit, while A was determined bynormalizing the distribution function.
In practice, it was necessary to fit the probe current and its first derivative to cubicsplines so that the numerical differentiation yielded meaningful results; in the absence ofthe cubic spline fits, small random fluctuations at high values of E were magnified byboth the numerical differentiation and the factor of E1/2 in Equation (2.9). Additionally,the plasma potential used in Equation (2.8) was the probe voltage at the peak of the

35
second derivative of the probe current. This modification was chosen to yield adistribution function that more closely followed the form of Equation (2.9), and thedifference in the value of the potential was typically less than 1-V.
The nature of the Langmuir probe current-voltage characteristics were such thatall of the best curve fits indicated a Druyvesteyn distribution, and an example is depictedin Figure 2.16. In each case, the second derivative reached its peak with a diminishingnegative slope rather than the sharp peak indicative of a Maxwellian distribution. Thederivative of a cubic spline accurately reflects a sharp change in slope only if sufficientpoints are included in the spline. Consequently, the EEDF data were used to examine thestructure of any populations in the tail of the distribution and as a check of the electrontemperature calculated using the standard Langmuir probe analysis.
70x10-6
60
50
40
30
20
10
0
-10
-20
d2 I/dV
2 (E
)
2.01.51.00.50.0
Electron Energy (eV)
Second Derivative Maxwellian Druyvesteyn
Continuous curvature ofsecond derivative leads toward Druyvesteyn fit.
Figure 2.16 - Comparison of Numerically Evaluated Second Derivative of ProbeCurrent with Maxwellian and Druyvesteyn Characteristics.
2.3 Vacuum Facilities
The SSPC and NSTAR ion thruster programs have developed hollow cathodeswith demonstrated lifetimes to just under 28,000 hours.6 In the course of thesedevelopment efforts, it was discovered that the quality of the vacuum and the cleanlinessof the feed system played key roles in determining cathode life. The method adopted wasto eliminate all impurities introduced to the cathode to the extent possible. This approachhas enabled long-lived cathodes at the expense of facility simplicity and cost. Thefollowing section describes the feed system requirements and vacuum facilitycapabilities, both of which follow the SSPC test-stand protocols.
2.3.1 Feed System Components

36
The feed systems, all similar to the one illustrated in Figure 2.8 (page 24),consisted of electropolished stainless steel tubing, and all fittings were either orbital-welded or used VCR metal gasket seals. This construction minimized the potential fortrapped volumes within the feed system which may contaminate the cathode. The valveswere chosen to have metal seals and minimal use of polymers or lubricants in theirconstruction. A capacitance manometer and feed system vent-to-vacuum line wereincluded to determine leak rates. Heater tape was wound about the outside to permitsystem bake-out.
2.3.2 Feed System Bake-Out
After any modifications to the feed system where internal surfaces were exposedto the atmosphere, such as xenon bottle replacement, the feed system was baked-out atvacuum. The goal of this procedure was to expel most of the contaminants that adhere tothe feed system surfaces. First the system was evacuated to high vacuum for at least 12hours. Heater tape was then activated to maintain tube temperatures in excess of 373-Kfor a minimum of 24 hours. The feed system was allowed to return to room temperaturebefore continuing.
2.3.3 Feed System Evaluation
After the bake-out, the leak rate of the feed system was determined to verify feedsystem integrity. This was done by closing the feed system to vacuum and monitoringthe pressure and temperature of the system for at least 24 hours. With an estimate of thefeed system volume, the leak rate was determined to be less than 1.5 x 10⁻⁵ sccm for eachof the test stands used in this investigation. The reader should note that for xenon, 1sccm is equivalent to approximately 0.097 mg/s.
2.3.4 Feed System Purge
Prior to cathode activation the feed system from the flow control valve throughthe cathode was evacuated to high vacuum for at least 12 hours. Using this procedure, thecontaminants from the feed-system interior were removed at ambient temperature whenthey are less likely to react with the cathode surfaces.
2.3.5 Vacuum Chambers
Three vacuum facilities were used in this investigation: 1) Port 2 of Tank 11 atNASA Glenn Research Center (GRC), 2) Vacuum Facility 52 (VF-52) at GRC, and 3)the Cathode Test Facility (CTF) at the University of Michigan’s Plasmadynamics andElectric Propulsion Laboratory (PEPL). Both VF-52 and the CTF were constructed in the

37
course of this investigation. The CTF measured 0.61-m in diameter by 2.44-m long andis depicted in Figure 2.17. Figure 2.18 shows the VF-52 chamber, which was 0.61-m indiameter by 0.91-m long. Port 2 was 0.3-m in diameter by 0.3-m long. All of thesefacilities were cryopumped, and Port 2 and CTF have base pressures in the high-10-6 Parange. Cryopumps provide the pumping speed necessary for cathode testing whilemaintaining a pristine environment for cathode exposure. During cathode operation, thetank pressure in all three facilities varied from 3 to 11 x 10-3 Pa. Pressure was measuredusing a cold cathode gage in the CTF, and Bayard-Alpert ion gages in both Port 2 andVF-52.
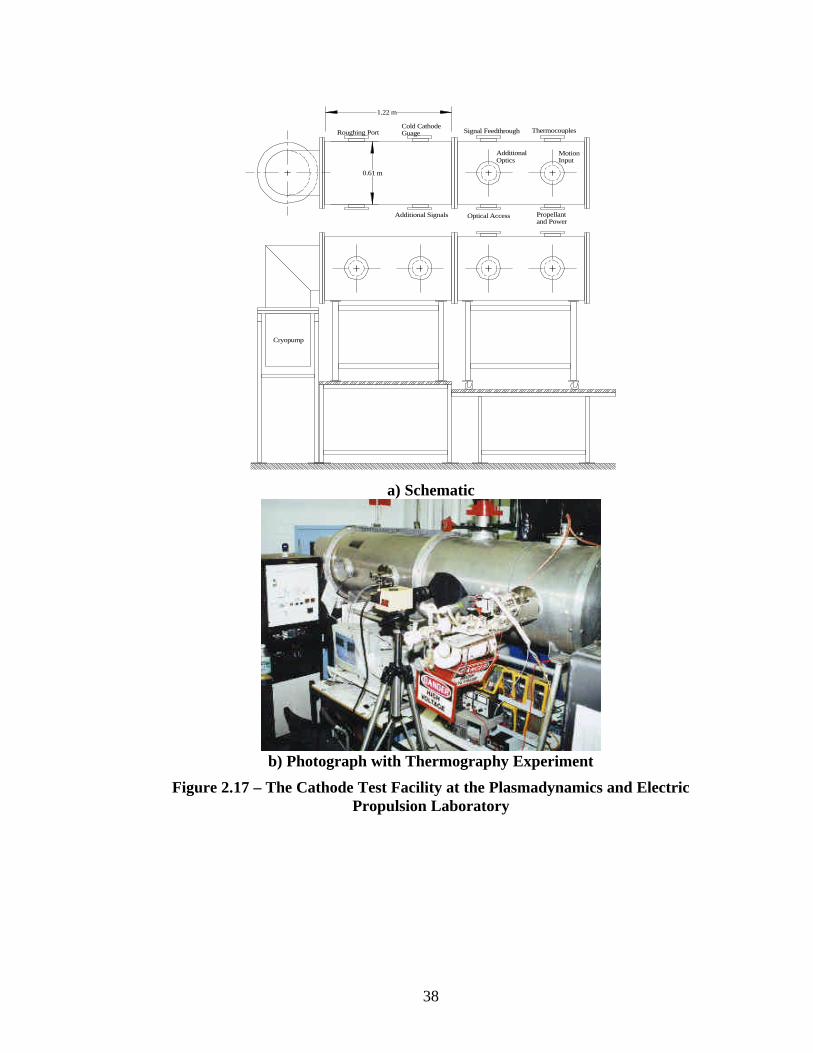
38
Roughing PortCold CathodeGuage Signal Feedthrough Thermocouples
Propellant and Power
Optical AccessAdditional Signals
AdditionalOptics
MotionInput
1.22 m
0.61 m
Cryopump
a) Schematic
b) Photograph with Thermography Experiment
Figure 2.17 – The Cathode Test Facility at the Plasmadynamics and ElectricPropulsion Laboratory

39
Figure 2.18 - The VF-52 Test Stand at the NASA Lewis Research Center

40
CHAPTER 3
INITIAL EXPERIMENTAL INVESTIGATION OF 3.2 MM ORIFICEDHOLLOW CATHODES
The experiments reported in this chapter form the foundation upon which todesign more efficient cathodes and more effective design tools. The first step in theexperimental investigation was to benchmark the performance of the first generationlaboratory model low-current hollow cathodes. Performance influencing andperformance related data were also sought. Since the hollow cathode is a thermionicdevice, the rate of heat transfer from the high-temperature emitter directly influences thepower consumption. Consequently, detailed temperature profiles were made. Whileothers have measured the plasma properties in a variety of hollow cathodes, the characterof the plasma was examined to compare with the previous studies and for use invalidating the predictive model described in Chapter 4.
3.1 Cathode Performance
Cathode performance has various definitions. The cathode-to-keeper dischargepower, minimum flow-rate for spot-mode emission, and the emission current (eitherbeam or thruster discharge current) as a function of flow-rate were the three componentswhich were emphasized in this work. The cathode-to-keeper discharge power and thecathode flow in the Hall thruster or ion thruster neutralizer adversely impact thrusterefficiency. The ideal situation is to have an electron emitter that requires zero inputpower or flow while emitting all the electrons needed by the thruster or for plasmacontacting applications. While this goal is beyond the capabilities of hollow cathodes,and any other electron emitter, this section reports on the efficiency of the first generationlaboratory model cathodes.
3.1.1 Performance Variance
When attempting to assess experimentally the effects of varying the orificegeometry on the performance of hollow cathodes, the ideal technique is to change onlythe orifice plate. This was done by Siegfried,25 using a slide valve with three orificegeometries. The experiment was conducted on a mercury hollow cathode, and theaspect-ratios (Lo/Do) of the orifices were negligibly small in comparison with thoseconsidered in the current investigation. A similar experiment performed with the aspect-ratios of interest would have been feasible. However, throughout the currentinvestigation, the experiments were designed for hollow cathode assemblies which couldeasily be integrated with a thruster. Consequently, to test the effects of varying theorifice aspect-ratio on the performance of the cathode, separate assemblies werefabricated and tested. In order to validate that the observed changes in performance were

41
due to orifice geometry changes, it was necessary to examine the operating variancebetween cathodes fabricated to identical specifications.
For reference, the work on the ISS plasma contactor has demonstrated variancesof ±0.5-V above 7-sccm of Xe, increasing to approximately ±1.0-V around 5-sccm.17
The flow-rate where the spot-to-plume-mode transition occurred appeared to beinvariant.17 Sarver-Verhey64 demonstrated that over the life of a 6.4-mm diametercathode, the operating voltage for a given flow-rate and current can vary by at least ±1.0-V. It should be noted that the fluctuations referred to here occur over many tens tothousands of hours.
The voltage-flow-rate characteristics of two mechanically identical cathodes, AR6and AR6´, at 0.75-A and 1.50-A are presented in Figure 3.1 and Figure 3.2, respectively.The characteristics show a variance of approximately ±1.0-V in the spot-mode regime,and the transition flow-rate varied by as much as 0.4-sccm. These variances were typicalof those observed throughout the range of operating conditions evaluated. The keepervoltage fluctuations for individual cathodes were examined over the course of tens ofhours and were found to be on the order of 0.2-V when operated at constant current andflow-rate. Figure 3.1 and Figure 3.2 show that the variance between subsequentcharacterizations was on the order of 0.2-V. This effect was attributed to changes in theinsert chemistry which occurred at differing rates depending upon cathode operatingconditions between the performance characterizations. The transition flow-rate generallyincreased with time. This effect was attributed to an increase in the orifice diameter, andcomparison of microscopic images of the orifice supported this conclusion. Given thatsimilar fabrication and operating procedures were employed with both the 3.2-mmdiameter hollow cathodes and the ISS plasma contactors, the variance exhibited in Figure3.1 and Figure 3.2 was taken to be a reasonable representation of the performancevariance expected with these cathodes. Consequently, the overall voltage and transitionflow-rate variances were taken to be ±1.4-V and ±0.25 sccm.
30
28
26
24
22
20
18
16
14
Kee
per
Vol
tage
(V
)
3.53.02.52.01.51.00.5
Xe Flow Rate (sccm)
AR6 AR6'
Circles = 1st CharacterizationSquares = 2nd Characterization
Typical Error
Figure 3.1 - Variance in Performance Characterizations of AR6 and AR6´ at 0.75-A.

42
30
28
26
24
22
20
18
16
14
Kee
per
Vol
tage
(V
)
3.53.02.52.01.51.00.5
Xe Flow Rate (sccm)
AR6 AR6'
Circles = 1st CharacterizationSquares = 2nd CharacterizationTriangles = 3rd Characterization
Typical Error
Figure 3.2 - Variance in Performance Characterizations of AR6 and AR6´ at 1.50-A.
The variation noise, differences between cathodes manufactured from the samespecifications, could be minimized by rigidly attaching the insert to the cathode tube. Asa consequence of the fabrication technique followed for the cathodes tested in thisinvestigation, the axis of the insert may be misaligned with the orifice axis. Figure 3.3illustrates that the worst case results in a misalignment of the axes by 16 percent of theinsert diameter. The relaxed specification on the insert outer diameter introduced anindeterminate mechanical alteration between cathodes and contributed to the variationnoise shown in Figure 3.1 and Figure 3.2.
i
Ideal Case Worst Case
0.16 * D
Insert Diameter, D
Orifice Diameter, Di
o
Figure 3.3 - Illustration of the Range of Possible Misalignment of the Orifice andInsert Centerlines.
3.1.2 Spot and Plume-Mode Characterization

43
Figure 3.1 and Figure 3.2 illustrate typical performance characterizations. Theportion of the curves where the voltage is only weakly dependent upon the flow-rate isknown as spot-mode. Spot-mode is also characterized by having a small luminous “spot”at the orifice of the cathode.1 Plume-mode by contrast has a luminous “plume” thatextends downstream to the keeper and beyond. The spot and plume-mode current andvoltage oscillations for AR3 appear in Figure 3.4. The period of the oscillations inplume-mode was far shorter, 200 ns, than the transient response time of the regulated DCpower supply, 50 µs, used to drive the discharge. The magnitude of the voltageoscillations appeared to be limited only by the output capability of the power supply.With the voltage fluctuating between zero and 55-V, ions created in the cathode-keepergap will be accelerated toward the cathode at up to 55-V, as postulated by Rawlin.23
1.6
1.4
1.2
1.0
0.8
0.6
0.4Cat
hode
Cur
rent
(A
)
2.5µs2.01.51.00.50.0
Time
60
40
20
0
Cat
hode
Vol
tage
(V
)
Plume Mode Spot Mode
Figure 3.4 - Time Resolved Comparison of Spot and Plume-Mode Current andVoltage Signals
The data presented in Figure 3.4 were analyzed in the frequency domain, and theresulting power spectra are plotted in Figure 3.5. Spot-mode current and voltageconsisted of much smaller amplitude components beyond 100 kHz. The dominant peakin plume-mode occurred at 5.91 MHz, and the harmonics were also observed. Severalother peaks in the power spectrum of plume-mode voltage and current were alsoobserved. As will be shown later in this chapter, these frequencies were much smallerthan the electron plasma frequency, but possibly on the order of the ion plasma frequencyat the keeper.

44
10-9
10-8
10-7
10-6
10-5
10-4
10-3
10-2
Pow
er, p
k (r
el. u
nits
)
5 6 7 8100kHz
2 3 4 5 6 7 81MHz
2 3 4 5 6 7 810MHz
2
Frequency
1.07 MHz
4.79 MHz
5.91 MHz
6.98 MHz
11.8 MHz17.7 MHz
Plume
Spot
a) Keeper Voltage
10-13
10-12
10-11
10-10
10-9
10-8
10-7
10-6
10-5
Pow
er, p
k (r
el. u
nits
)
5 6 7 8100kHz
2 3 4 5 6 7 81MHz
2 3 4 5 6 7 810MHz
2
Frequency
Plume
Spot
5.91 MHz
4.79 MHz1.07 MHz
b) Keeper Current
Figure 3.5 - Power Spectra of the Keeper Voltage and Current in Spot and Plume-Modes.
3.1.3 Voltage-Flow-rate Characterizations
The primary means used to compare the performance of the cathodes was thevoltage-flow-rate characteristics in a diode discharge between the cathode and the keeper.Figure 3.6 through Figure 3.12 present the results of the performance characterizations of

45
AR6, AR6´, AR3, AR1, OK, and EK, respectively. The sudden increase in keepervoltage at low-flow-rate indicates the onset of plume-mode. The operating envelope ofAR6 was limited to 0.75-A to 1.50-A, as opposed to AR6´ which operated down to 0.50-A. AR6 was unstable at 0.50-A, and the data were omitted from Figure 3.6. The spot-mode voltage of AR6 varied from 17 to 19-V, with a negligible difference between the1.25-A and 1.50-A conditions. In addition to stable operation at 0.50-A, AR6´ alsooperated at lower voltage in spot-mode than AR6. AR6´ required slightly more flow tomaintain spot-mode emission. The disparity between AR6 and AR6´ was discussed inSection 3.1.1.
24
22
20
18
16
14
12
Kee
per
Vol
tage
(V
)
3.02.52.01.51.00.5
Xe Flow Rate (sccm)
0.75-A 1.00-A 1.25-A 1.50-A
Figure 3.6 - Diode Performance Characterization of AR6.

46
24
22
20
18
16
14
12
Kee
per
Vol
tage
(V
)
3.02.52.01.51.00.5
Xe Flow Rate (sccm)
0.50 A 0.75 A 1.00 A 1.25 A 1.50 A
Figure 3.7 - Diode Performance Characterization of AR6´.
Since AR3 and AR1 had shorter orifices than AR6 and AR6´, it was expected thattheir operating voltage would be lower than AR6 or AR6´. As Figure 3.8 shows, AR3operated very similarly to AR6´. While the performance characterization of AR3 wasonly conducted between 0.75 and 1.50-A, AR3 was able in subsequent tests to operatedown to 0.50-A continuously. The operating regime of AR1 is depicted in Figure 3.9,and it differs from AR6, AR6´, and AR3 significantly. AR1 was marginally stable at0.75-A, and while 1.50-A was effectively the Kaufman limit on current for AR1, opticalpyrometer measurements of the orifice plate temperature indicated that the cathode wasstill within the predetermined limit of 1300 ºC. The shorter orifice of AR1 paiddividends with the reduced voltage operation, however, the flow-rate required for spot-mode emission was increased. Reducing the orifice diameter had the expected effects onoperating voltage and minimum spot-mode flow-rate as indicated in Figure 3.10, namelyan increase in the keeper voltage and a decrease in the minimum spot-mode flow-rate.While AR3-A performed as expected in terms of voltage and flow consumption, theoperating regime was more limited than the other cathodes, and it failed to achieveequilibrium below 0.65-A.

47
24
22
20
18
16
14
12
Kee
per
Vol
tage
(V
)
3.02.52.01.51.00.5
Xe Flow Rate (sccm)
0.75-A 1.00-A 1.50-A
Figure 3.8 - Diode Performance Characterization of AR3.
24
22
20
18
16
14
12
Dis
char
ge V
olta
ge (
V)
3.02.52.01.51.00.5
Xe Flow Rate (sccm)
0.75 A 1.00 A 1.25 A 1.50 A 1.75 A 2.00 A
Figure 3.9 - Diode Performance Characterization of AR1.

48
24
22
20
18
16
14
12
Kee
per
Vol
tage
(V
)
3.02.52.01.51.00.5
Xe Flow Rate (sccm)
0.65-A 0.75-A 0.95-A
Figure 3.10 - Diode Performance Characterization of AR3-A.
While the cathode with the extended tube used to test the open (OK) versusenclosed keeper (EK) geometries had an orifice plate mechanically identical to AR6 andAR6´, the insert was from a different batch and had a slightly smaller inner diameter.This fact when coupled with the lengthening of the cathode tube invalidated thecomparison of OK with AR6 and AR6´ as mechanically identical cathodes.Nevertheless, Figure 3.11 shows that the spot-mode voltage was similar to that of AR6while the transition flow-rate was somewhat lower for OK. As shown in Figure 3.12, theenclosed keeper led to a reduction in the spot-mode voltage.

49
24
22
20
18
16
14
12
Kee
per
Vol
tage
(V
)
3.02.52.01.51.00.5
Xe Flow Rate (sccm)
0.50-A 0.75-A 1.00-A 1.25-A 1.50-A
Figure 3.11 - Diode Performance Characterization of OK.
24
22
20
18
16
14
12
Kee
per
Vol
tage
(V
)
3.02.52.01.51.00.5
Xe Flow Rate (sccm)
0.50-A 0.75-A 1.00-A 1.25-A 1.50-A
Figure 3.12 - Diode Performance Characterization of EK.
3.1.4 Effects of a Small Insert Inner Diameter

50
The second cathode with an orifice aspect ratio of approximately six, AR6´, wasinitially fabricated with an insert whose inner diameter was on the order of the orificediameter. Salhi and Turchi45 reported that the insert inner diameter should be muchlarger than the orifice diameter for optimal performance. The increased physical pathlength enables the primary electrons, those accelerated through the cathode sheath, tosupport a higher degree of ionization. By easing the ion production process, performanceis enhanced. On this basis, AR6´´ was expected to require much higher flow-rates forspot-mode emission than the cathodes with 1.2-mm inner diameter inserts. Figure 3.13depicts the performance characterization of AR6´´. The propellant flow-rate required forspot-mode emission was nearly seven times that required by the other orificed cathodespresented in this study. With the short physical path lengths, a high neutral density wasnecessary to allow ionization; the high neutral density also acts to quench the dischargeby lowering the electron temperature. Contrary to the trends observed in the otherorificed hollow cathodes, the keeper voltage of AR6´´ scaled with discharge current.This suggests that the plasma conductivity was relatively insensitive to the increasedpower deposition.
24
22
20
18
16
14
12
Kee
per
Vol
tage
(V
)
9.08.58.07.57.06.56.05.5
Xe Flow Rate (sccm)
Spot-ModePlume-Mode
0.75-A 1.00-A 1.25-A 1.50-A
Figure 3.13 - Diode Performance Characterization of AR6´´.
3.1.5 Multichannel Cathode Performance
The multichannel cathodes, MC7 and MC13, operated only in plume-mode by thedefinition presented earlier. The discharge voltage oscillated at several megahertz withan amplitude on the order of the discharge current. As both Figure 3.14 and Figure 3.15illustrate, the operating voltages were quite low, especially when compared to the plume-mode voltages of the orificed cathodes. The discharge current envelope wascomparatively larger than most of the orificed cathodes. To establish an upper limit tothe operating current, the maximum temperature at any point within the cathodes was

51
limited to 1300 ºC. An optical pyrometer was focused on the tungsten wires slightlyupstream of the exit plane of the cathodes, because both multichannel and open tubehollow cathodes have a peak temperature just upstream of the cathode tip.5,52 Despiteusing similar criteria to limit the operating temperature of the multichannel cathodes, theR500 coating on the wires was nearly depleted after less than 20 hours as Figure 3.14shows. The initial characterization of MC7 at 1.00-A was nearly 4-V lower than thecharacterization after only 15 hours of operation. Post test visual inspection of both MC7and MC13 indicated that most of the R500 had been removed, and Figure 2.3 shows pre-and post-test images for comparison. This type of operation is a show-stopper for theR500 coated wires. However, the use of lanthanum hexaboride in a multichannel hollowcathode may be feasible since it can operate up to about 200 ºC warmer than R500 or4:1:1 impregnated porous tungsten. The plume-mode operation of the multichannelcathodes and the relatively large amount of propellant required by the cathode make thesedevices unattractive for use as ion beam neutralizers or plasma contactors. Themultichannel cathodes may be acceptable for ion thruster discharge cathodes where thehigh flow-rate can be better tolerated.
24
22
20
18
16
14
12
Kee
per
Vol
tage
(V
)
54321
Xe Flow Rate (sccm)
1.00-A, Begining of Test 1.00-A, ~15 hours 1.50-A, ~15 hours 2.00-A, ~15 hours
Figure 3.14 - Diode Performance Characterization of MC7.

52
24
22
20
18
16
14
12
Kee
per
Vol
tage
(V
)
54321
Xe Flow Rate (sccm)
0.50-A 0.75-A 1.00-A 1.25-A 1.50-A 1.75-A
Figure 3.15 - Diode Performance Characterization of MC13.
3.1.6 Minimum Power in a Diode Discharge
Cathode power consumption at the minimum flow-rate condition for spot-modeemission is plotted as a function of the discharge current in Figure 3.16. Whencomparing AR1, AR3, and AR6´, the smallest aspect-ratio cathode consumed the leastamount of power at a given current. While this result was expected since power scaleswith orifice length according to Ohm’s law, AR3 and AR6´ operated at roughly equalpower levels throughout the range of currents. This result suggests that the change inpower consumption with orifice length occurs more rapidly at low aspect-ratios. Thepower consumption for AR1 was the lowest of all the cathodes tested. Changing theorifice diameter resulted in a negligible change in the power consumption as evidencedby Figure 3.16b. The use of an enclosed keeper reduced the power requirement on theorder of five to ten percent over the open keeper configuration. Since the enclosedkeeper provides a superior radiation environment, the small improvement in powerconsumption by using the enclosed keeper suggests that conduction was the dominantheat transfer mechanism for the cathode tube; if the open keeper were radiating strongly,the enclosed keeper would improve the performance more significantly than observed.The operating temperature must also be taken into account in making this statement, andthe results of a thermographic analysis are presented later.

53
30
25
20
15
10a) A
spec
t R
atio
2.01.61.20.80.4
Keeper Current (A)
30
25
20
15
10
b) O
rifi
ce D
iam
eter
30
25
20
15
10
c) K
eepe
r G
eom
etry
AR1 AR3 AR6'
AR3 AR3'
OK6 EK6
Cat
hode
-to-
Kee
per
Pow
er (
W)
Figure 3.16 - Cathode-to-Keeper Power at the Spot-Mode Minimum Flow-rate.
3.1.7 Minimum Spot-Mode Flow-rate in a Diode Discharge
The flow-rate required for spot-mode emission, plotted in Figure 3.17, alsostrongly influences efficiency in low-power thrusters. The model by Mandell and Katz24
predicts that ion production within the orifice, and consequently ion flux out of theorifice, increase with orifice length for a given current, diameter, and flow-rate. As theorifice length is increased, the electron temperature in the orifice also increases due toOhmic heating. The elevated electron temperature and increased channel length facilitateionization. Figure 3.17a shows that the model predictions were consistent with the trendsobserved for aspect-ratios between 1 and 6. The AR6´ and AR3 cathodes appeared totransition at approximately the same flow-rates, suggesting diminishing returns inoptimizing the transition flow-rate by increasing the orifice length. Indeed, one must alsoconsider the ion losses as the orifice aspect-ratio is increased. The results in Figure 3.17bdemonstrated the expected trend that as orifice diameter decreases, the flow-rate required

54
for spot-mode operation also decreases. The increased current density within the orificefacilitates ion production and emission; ion emission occurs by ambipolar diffusionoutside of the cathode sheath and may constitute several mA of current. The transitionflow-rate was less for the open keeper configuration than for the enclosed keeper. Thisresult was unexpected because the pressure in the cathode-keeper gap is expected to begreater with the enclosed keeper, thereby facilitating ion transport by reducing thecathode sheath size. An increase in the neutral density in the cathode-to-keeper gap alsoimpedes the flow of ions through collisions with neutrals. This adverse effect appearedto dominate the operation of the enclosed keeper.
2.5
2.0
1.5
1.0a) A
spec
t R
atio
2.01.61.20.80.4
Keeper Current (A)
2.5
2.0
1.5
1.0
b) O
rifi
ce D
iam
eter
2.5
2.0
1.5
1.0
c) K
eepe
r G
eom
etry
AR1 AR3 AR6'
AR3 AR3'
OK6 EK6
Flo
w R
ate
at T
rans
itio
n (s
ccm
)
Figure 3.17 - Minimum Spot-Mode Flow-rates.
3.1.8 Electron Emission Characteristics in a Triode Discharge
A secondary, planar anode 48 mm in diameter was placed 60-mm downstream toassess the electron emission capability of the 3.2-mm diameter hollow cathodes. Theflow was set to the minimum for spot-mode operation in a diode discharge, and the

55
secondary anode was biased with respect to the cathode. The resulting characteristics areshown in Figure 3.18. Despite decreasing flow-rates, the emission current scaled with thekeeper current. Additionally, current saturation occurred at a bias of approximately 20-V. The AR3 cathode with a mesh keeper yielded emission currents of 0.17-A at 20-Vand 0.30-A at 24-V with a 0.75-A keeper current at 2.4 sccm. Since the mesh keeper andorifice geometry were expected to contribute weakly to the change in emission current,the effect of increasing the flow at 0.75-A to the keeper was established; an increase of0.6 sccm led to a 100 percent increase in the emission current.
0.3
0.2
0.1
0.0
Ano
de C
urre
nt (
A)
6050403020100-10
Anode Voltage (V)
Keeper Current, Flow 0.50 A, 2.4 sccm 0.75 A, 1.8 sccm 1.00 A, 1.4 sccm 1.25 A, 1.0 sccm 1.50 A, 1.0 sccm
Figure 3.18 - Current-Voltage Characteristics of EK6 for the Second Anode in aTriode Configuration.
The floating potential of the cathode with respect to the tank, shown in Figure3.19, also provided information on the ability of the cathode to emit an electron current.Increasing the keeper current and decreasing the flow-rate both led to floating potentialscloser to facility ground. Plume-mode data indicate the lower limit of emission at a givenkeeper current. In spot-mode, the maximum emission current occurred at the floatingpotential closest to ground for a given flow-rate.

56
12
10
8
6
4
2
0
-2Cat
hode
Pot
enti
al B
elow
Gro
und(
V)
3.53.02.52.01.51.00.5
Xe Flow Rate (sccm)
0.50 A 0.75 A 1.00 A 1.25 A 1.50 A
Figure 3.19 - Cathode Potential of EK6 as an Indicator of Emission Capability.
3.1.9 Cathode Operating Pressure
While cathode performance and emission capabilities are the primary concerns forthe overall thruster design, the cathode pressure when combined with plasma diagnosticsenables a detailed physical picture of the cathode processes to be developed. Salhi26
found that the pressure in a 6.4-mm diameter cathode with a 1.21-mm diameter orificewas approximately 665 Pa on xenon at operating conditions similar to those reportedhere. As an approximation, the cathode pressure scales with the ratio of the orifice areas.Given the data from Salhi,26 the enclosed/open keeper cathode, AR1, AR3, AR6, andAR6´ were expected to operate in the range of 40 kPa. The cathode operating pressuresfor EK6 and AR3 are plotted in Figure 3.20. Both cathodes were operated in diode modefor these data, and the pressure scaled strongly with the flow-rate at all of the dischargecurrents. Between 1.00-A and 1.50-A, the pressure appeared to be more weaklydependent upon current than below 1.00-A. For the enclosed keeper cathode, thetransition to plume-mode occurred at approximately 39.2 kPa regardless of the currentand flow-rate. The argument that the pressure scales principally with orifice area fails toaccount for the reduced pressure operation of AR3 compared with EK6, which has anidentical orifice diameter; cathode pressure is also proportional to orifice length.Conceptually this is reasonable when one considers that the orifice geometry approachesa Poiseuille flow condition.
To assess the cathode pressure as a function of neutral flow, the cathode pressurewas monitored while flowing xenon in the absence of a discharge at room temperatureand with an orifice plate temperature of 1228-K, maintained by the cathode heater.Figure 3.20 also shows the pressure variation with neutral flows for EK6 at roomtemperature (298-K) and at 1228-K. The xenon was assumed to be in equilibrium with

57
the cathode orifice temperature. The discharge processes account for the increase inpressure of approximately 200 percent over a neutral flow at 1228-K.
The start-up transients are depicted in Figure 3.21 to illustrate the effect of thedischarge on cathode pressure. Initially, the cathode was starved for propellant andoperated in plume-mode, while the propellant feed line between the metering valve andthe cathode pressurized. The facility pressure was also observed to decrease uponignition, indicating that a significant fraction of the flow was involved in raising thecathode internal pressure. Approximately three minutes after ignition, the cathodepressure was sufficient (~39.2 kPa) to transition to spot-mode. The cathode took morethan 7 minutes to reach a steady state pressure. In this particular case, the cathode tiptemperature dropped 170 K transitioning from the preheat condition to a steadydischarge. Despite an orifice plate temperature of 1033-K, the presence of the dischargedrove the cathode pressure to more than twice that observed with a purely neutral flow at1228-K.
100x103
80
60
40
20
0
Inte
rnal
Cat
hode
Pre
ssur
e (P
a)
3.53.02.52.01.51.00.5
Xe Flow Rate (sccm)
Spot
Plume
Keeper Current 0.50 A
0.75 A
1.00 A 1.00 A, AR3
1.25 A 298-K, No Discharge
1.50 A 1228-K, No Discharge
Figure 3.20 - Cathode Internal Pressure Under Various Operating Conditions.Results for EK6, Except Where Noted.

58
1200
1160
1120
1080
1040
Tip
Tem
pera
ture
(C
)
1086420
Time (min)
50x103
45
40
35
30
25
Cathode P
ressure (Pa)
20
19
18
17 Kee
per
Vol
tage
(V
)
Figure 3.21 - Start-Up Transient Response of Cathode Pressure for EK6.
3.2 Cathode Temperature Distribution
3.2.1 Axial Temperature Distribution
The degree to which an axial temperature profile deviates from linearity indicatesthe relative importance of radiation heat transfer with respect to conduction. Several ofthe temperature profiles acquired in this investigation are plotted in Figure 3.22 throughFigure 3.25. The thermocouple data and radiometer generated profiles are separated inFigure 3.22 to illustrate the calibration technique. The data markers represent thecalibration locations for the thermocouples. All of these data were taken in a diodedischarge with the keeper. At 0.50-A, the shape of the profiles appeared similar upstreamof the radiation shields. The enclosed keeper cathode operated approximately 100 ºChigher at the tip. The slopes and slope changes in the profiles for both configurations areapproximately equal beyond –12 mm upstream. Estimates limited the radiative transferto about 0.4 W/cm of axial length at –12 mm, while the conduction was 2 to 4 Watts.Consequently, thermal conduction was found to be the dominant heat transfer mechanismin the upstream section of the tube at low-current. The resolution of the camera wasinsufficient to accurately determine the profile at the cathode tip. At 1.25-A and 1.50-A,the enclosed keeper upstream profiles were noticeably more linear than the open keeperdistributions. By limiting the radiative transfer, the use of an enclosed keeper simplifiesthe problem of cathode optimization; minimizing the heat losses is accomplished bylimiting thermal conduction. The profiles on the heater shield and the cathode tiptemperatures followed the same trends throughout the current range tested. As is shown

59
in the next section, the temperatures were weakly dependent upon on the flow-rate, andthe data presented in Figure 3.22 through Figure 3.25 were representative of thedistributions at all of the flow-rates tested.
250
200
150
100
50
0
Raw
Pix
el D
ata
-40 -35 -30 -25 -20 -15 -10 -5 0
Distance from Cathode Tip (mm)
800
700
600
500
400
300Tem
pera
ture
(C
)
Nearly Constant Slope
1.00 A, 1.4 sccm, Open Keeper 1.00 A, 1.4 sccm, Enclosed Keeper
Figure 3.22 - Illustration of the Raw Thermocouple and Radiometer Data. Both EKand OK Were Operated at 1.00-A.
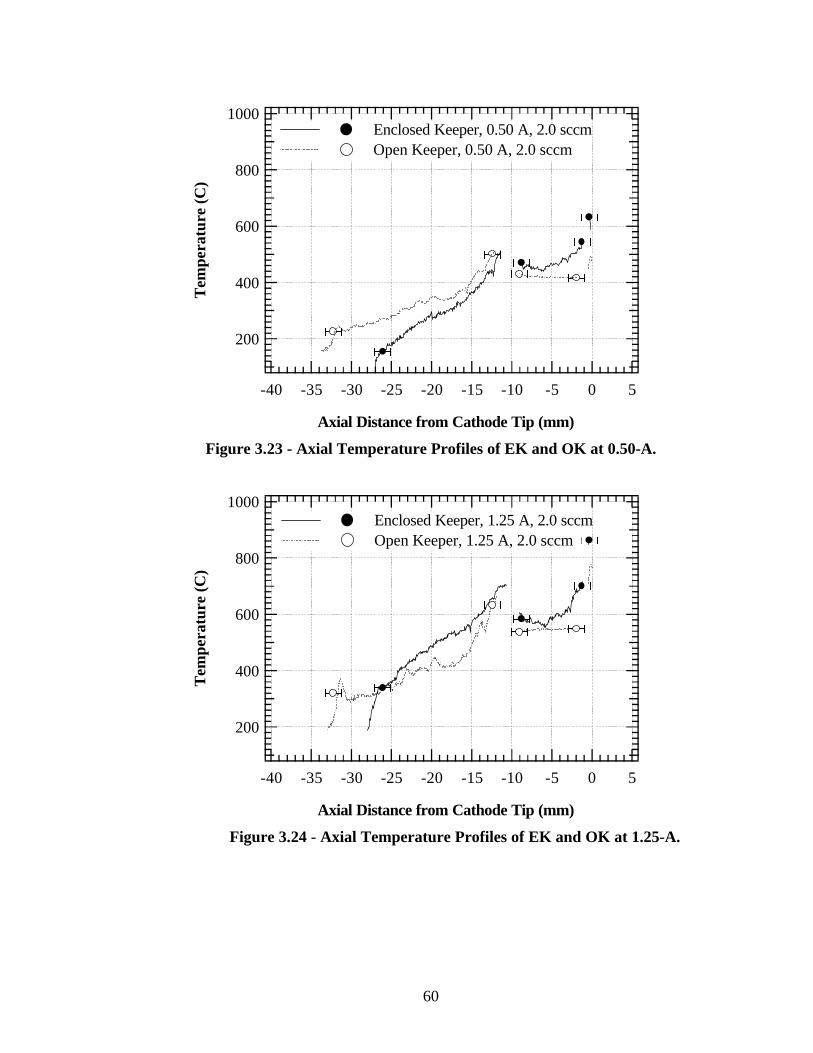
60
1000
800
600
400
200
Tem
pera
ture
(C
)
-40 -35 -30 -25 -20 -15 -10 -5 0 5
Axial Distance from Cathode Tip (mm)
Enclosed Keeper, 0.50 A, 2.0 sccm Open Keeper, 0.50 A, 2.0 sccm
Figure 3.23 - Axial Temperature Profiles of EK and OK at 0.50-A.
1000
800
600
400
200
Tem
pera
ture
(C
)
-40 -35 -30 -25 -20 -15 -10 -5 0 5
Axial Distance from Cathode Tip (mm)
Enclosed Keeper, 1.25 A, 2.0 sccm Open Keeper, 1.25 A, 2.0 sccm
Figure 3.24 - Axial Temperature Profiles of EK and OK at 1.25-A.

61
1000
800
600
400
200
Tem
pera
ture
(C
)
-40 -35 -30 -25 -20 -15 -10 -5 0 5
Axial Distance from Cathode Tip (mm)
Enclosed Keeper, 1.50 A, 2.0 sccm Open Keeper, 1.50 A, 2.0 sccm
Figure 3.25 - Axial Temperature Profiles of EK and OK at 1.50-A.
Keeper temperature was most sensitive to the flow-rate as shown in Figure 3.26,and the minimum operating temperature was reached at 2.0-sccm. The onset of plume-mode created a large increase in the mean temperature along the profile. The shapebetween -7 and -27 mm appears to reflect radiative heat transfer from the cathode tube;the drop around 12 to 16 mm roughly corresponds to the location of the cathode heatershields which radiate considerably less than the cathode tube. The increase in keepertemperature beyond -27 mm was also seen in the raw data, and is believed to be an effectof the inability of the radiometer to measure accurately near sharp gradients in emittanceor temperature.

62
460
440
420
400
380
Enc
lose
d K
eepe
r T
empe
ratu
re (
C)
-40 -30 -20 -10 0
Axial Position (mm)
Increasing Flow
2.4 sccm 2.0 sccm 1.6 sccm 1.4 sccm
Symbols = Thermocouple DataLines = Radiometer Data
EmittanceChangeEffect
Figure 3.26 - Axial Temperature Profiles of the Enclosed Keeper at 1.00-A.
3.2.2 Tip Temperature Variation with Geometry
A disappearing filament optical pyrometer with emissivity correction was used todetermine the orifice plate temperatures. The variation of the orifice plate temperatureswith geometry, current, and flow-rate is presented in Figure 3.27 through Figure 3.29.The temperature was observed to scale in proportion with the aspect ratio. As the aspectratio increases, the power loss in conducting current through the orifice also increases,leading to the observed temperature differences. Figure 3.29 shows the orifice platetemperatures for EK6 and OK6 as a function of flow-rate for three currents. In all casesthe enclosed keeper operated at higher temperatures than the open keeper. Most of theorifice plate temperature data exhibited a slight increase in temperature at the onset ofplume-mode, the lowest flow-rate for each curve. The contributing factors are thebombardment of the orifice plate by ions created in the cathode-keeper gap, and increasedpower deposition to the anode, thereby altering the thermal radiation environment.

63
1200
1100
1000
900
800
700Ori
fice
Pla
te T
empe
ratu
re (
C)
4.03.53.02.52.01.51.00.5
Xe Flow Rate (sccm)
AR1 AR3 AR6
1.0-A to Keeper
Figure 3.27 - Orifice Plate Temperature Dependence On Aspect-Ratio in a 1.00-ADischarge to the Keeper.
1100
1000
900
800
700Ori
fice
Pla
te T
empe
ratu
re (
C)
3.53.02.52.01.51.00.5
Xe Flow Rate (sccm)
AR3 AR3'
0.75-A to Keeper
Figure 3.28 - Orifice Plate Temperature Dependence On Orifice Diameter in a 0.75-A Discharge to the Keeper.

64
1100
1000
900
800
700Ori
fice
Pla
te T
empe
ratu
re (
C)
3.53.02.52.01.51.00.50.0
Xe Flow Rate (sccm)
Keeper Current 0.75 A 1.00 A 1.50 A
Open Symbols = OK6Closed Symbols = EK6
Figure 3.29 - Orifice Plate Temperature Dependence On Keeper Type in a DiodeDischarge.
3.3 Cathode Plasma Characteristics
The focus of the measurement of the plasma properties was to obtain informationapproaching the extremes of the operating envelope of the cathodes. Consequently, thecathodes were operated throughout the range of currents and in spot and plume-modes.Table 3.1 summarizes the operating conditions during the probe diagnostics.
Table 3.1 - Cathode Operating Conditions for the Emission Plasma Parameters.
FiguresKeeperCurrent
(A)
KeeperVoltage
(V)
AnodeCurrent
(A)
AnodeVoltage
(V)
Flow-rate(sccm)
Mode
Figure 3.37,Figure 3.40 0.50 18.60 0.00 2.4 PlumeFigure 3.37,Figure 3.42 0.75 24.42 0.00 1.31 1.3 PlumeFigure 3.36,Figure 3.37,Figure 3.38,Figure 3.40,Figure 3.41,Figure 3.42 0.75 17.20 0.00 2.30 2.4 SpotFigure 3.42 0.75 17.05 0.00 3.3 SpotFigure 3.38, 0.75 17.28 0.17 20.00 2.4 Spot

65
Figure 3.41,Figure 3.42Figure 3.36,Figure 3.38,Figure 3.41,Figure 3.42 0.75 16.52 0.30 24.22 2.4 SpotFigure 3.37,Figure 3.40,Figure 3.42 1.50 15.75 0.00 5.78 2.4 Spot
3.3.1 Insert Plasma
Both Siegfried25 and Salhi26 have measured the plasma properties in the insertregion of 6.4 mm outer diameter hollow cathodes, and despite the different propellants,both measured similar temperatures, potentials, and number densities. The goal in thepresent investigation was to verify that the plasma properties in 3.2-mm diameter hollowcathodes were of the same order as those measured by Siegfried25 and Salhi.26
The axial variation of the insert plasma properties with flow-rate is plotted inFigure 3.30. The plasma potential rose slightly with decreasing flow-rate and morestrongly as the orifice was approached. The potential values and the trends were similarto those observed by Salhi.26 The plasma property variation with current 0.7 mmupstream of the orifice is depicted in Figure 3.31. Here the plasma potential wasobserved to decrease with increasing current, again comparable to the data taken bySalhi.26 As will be shown later for the external plasmas, the electron temperature in spot-mode generally remained below 1 eV in the insert region as well. The electrontemperature was observed to increase as the current was increased. The axial variation inthe plasma number density shown in Figure 3.30 exhibited a much sharper gradient thanthat observed by either Siegfried25 or Salhi.26 Otherwise, the number density datafollowed the same trends and were approximately equal in peak magnitude to the data bySiegfried.25 Salhi26 measured the plasma number density to be a factor of five higher inmagnitude than those reported here. The tendency of the high neutral density within theinsert region will be to quench the discharge, and the sharp gradients in number densityreported here reflect that intuition.

66
14
12
10
8
6
4
Pla
sma
Pot
enti
al (
V)
4.03.53.02.52.01.51.00.5
Xe Flow Rate (sccm)
1.6
1.2
0.8
0.4Ele
ctro
n T
empe
ratu
re (
eV)
1014
1013
1012
1011
1010
Ele
ctro
n N
umbe
r D
ensi
ty (
cm-3
)
Distance to Orifice Plate
< 0.5 mm 0.7 mm 1.3 mm
Figure 3.30 - Variation of Internal Plasma Characteristics with Flow-rate.

67
12
10
8
6
4
Pla
sma
Pot
enti
al (
V)
1.81.61.41.21.00.80.60.40.2
Keeper Current (A)
0.90
0.80
0.70
0.60
Ele
ctro
n T
empe
ratu
re (
eV)
4
68
1011
2
4
68
Ele
ctro
n N
umbe
r D
ensi
ty (
cm-3
)
Figure 3.31 - Variation of Internal Plasma Characteristic with CurrentApproximately 0.7-mm Upstream of the Orifice Plate.
The variation of the internal plasma electron energy distribution function withflow-rate and keeper current is plotted in Figure 3.32 and Figure 3.33, respectively.While the character of the EEDF data most closely resemble the Druyvesteyndistribution, the traces plotted here exhibit a higher degree of structure. As mentioned inChapter 2 and Appendix B, the EEDF methodology precluded the measurement of thelow-energy spread electron beam indicative of the primary electrons emitted from theinsert and accelerated through the cathode sheath. The EEDF data were taken primarilyto assess whether the plasma was in equilibrium and to characterize the degree of error

68
introduced by using the Maxwellian assumption to calculate the electron temperature.For a Maxwellian distribution, the electron temperature is two-thirds of the averageelectron energy.
( )2 2
3 3eT E Ef E dE= = ∫ (3.1)
The average electron energy was calculated using the results of the EEDF analysis, andTable 3.2 shows the comparison of the calculated average electron energy with theelectron temperature deduced from the standard Langmuir probe analysis. At eachcurrent, the two calculations for the electron temperature agree to within a few percent,and the level of disparity between the methods was considered acceptable for the presentinvestigation.
0.7
0.6
0.5
0.4
0.3
0.2
0.1
0.0
Nor
mal
ized
EE
DF
86420
Electron Energy (eV)
1.4 sccm 1.8 sccm 2.0 sccm
Figure 3.32 - Internal Plasma Electron Energy Distribution Function Variation withFlow-rate at 0.75-A, 0.7-mm Upstream of the Orifice Plate.

69
0.7
0.6
0.5
0.4
0.3
0.2
0.1
0.0
Nor
mal
ized
EE
DF
86420
Electron Energy (eV)
0.50-A 1.00-A 1.50-A
Figure 3.33 - Internal Plasma Electron Energy Distribution Function VariationWith Current at 2.0-sccm, 0.7-mm Upstream of the Orifice Plate.
Table 3.2 - Comparison of the Langmuir Probe and EEDF Derived InternalElectron Temperatures for AR3 at 2.0-sccm.
Current (A) Te (eV) 2/3 E (eV)
0.50 0.61 0.680.75 0.73 0.801.00 0.77 0.761.25 0.80 0.791.50 0.80 0.84
3.3.2 Cathode-To-Keeper Plasma
Although the current density is greatest in the orifice and the plasma in thecathode-to-keeper gap greatly influences the onset of plume-mode, little experimentaldata have been taken in these regions using electrostatic probes, due to the small scales ofthe orifice and CK gap. To the authors’ knowledge, the electron number density in theorifice has yet to be measured experimentally. Siegfried and Wilbur43 measured thefraction of the current collected by the orifice plate as a whole. To gain insight into thephysical conditions within the orifice, the model developed by Mandell and Katz24 wasused. The electron density was calculated to vary from 5 x 10¹⁴ to 1 x 1016 cm-3 for thegeometries and test conditions in this investigation. At this density, with electrontemperatures of up to 2.5 eV, the electrons, ions, and neutrals undergo several thousandcollisions along the length of the orifice. The collisional heating of the ions by electronssignificantly increases the heavy particle temperature.26 This is believed to be the

70
mechanism responsible for the elevated pressures observed in Figure 3.20 during cathodeoperation. A more detailed presentation of this phenomenon appears in Chapter 4.
Plasma potential data were sought by Williams et al.60 in order to explain ionvelocities observed by laser induced fluorescence (LIF) measurements. The plasmaparameters in the CK gap are presented in Figure 3.34. Both cases at 1 sccm wereplume-mode, while the condition at 3 sccm was spot-mode. Only the potentials for twoof the conditions are reported in Figure 3.34 because the noise associated with plume-mode operation made it difficult to determine the plasma potential accurately. Thepotential variation in spot-mode supports the notion that charge neutralization in the gapwas maintained, while in plume-mode, the plasma was more highly negative with respectto the keeper, thereby creating a more favorable condition for ions to maintainquasineutrality. The electron temperature distributions also corroborated thisexplanation; the increased electron temperature in plume-mode was a manifestation ofthe onset of space-charge limitations to the electron flow. The electron number densityvaried from 3 x 10¹² to 2 x 1013 cm-3. The error on the number density was calculated tobe approximately ±60 percent. The density decreased with diminishing flow-rate,dwindling current, and axial distance from the cathode.

71
-12
-8
-4
0
Pla
sma
Pot
enti
al (
V)
4.03.02.01.00.0
Axial Position Downstream of Orifice (mm)
2.5
2.0
1.5
1.0
0.5
0.0Ele
ctro
n T
empe
ratu
re (
eV)
3
4
5
67
1013
2
Ele
ctro
n N
umbe
r D
ensi
ty (
cm-3
) Keeper Current, Flow, Mode 1.00-A, 1-sccm, Plume 1.00-A, 3-sccm, Spot 0.50-A, 1-sccm, Plume
Figure 3.34 - Variation of Plasma Properties in the Extended Cathode-to-KeeperGap of AR3. Plasma Potential Was Measured With Respect to the Keeper.
Figure 3.35 depicts the spot-mode electron energy distribution functions in thecathode-to-keeper gap. The bulk of the electrons formed a distribution that approximateda Druyvesteyn distribution to 1.5 eV. Between 1.5 and 4 eV, the tail of the distributionappeared inflated. The tail decayed with axial distance from the orifice, indicating thatcollisional events were driving the distribution toward equilibrium. The decrease inelectron energy with axial distance from the orifice was also apparent in Figure 3.35.Although the EEDFs were Druyvesteyn, the average electron energy was approximately1.5 times the calculated electron temperatures, again showing agreement between the twomeasurements.

72
1.2
1.0
0.8
0.6
0.4
0.2
0.0
-0.2
Nor
mal
ized
EE
DF
6eV543210
Electron Energy (eV)
1.00 A, 3 sccm 0 mm 1 mm 2 mm 3 mm
Figure 3.35 - Spot-Mode Electron Energy Distribution Functions in the Cathode-to-Keeper Gap of AR3.
3.3.3 Plasma Downstream of the Keeper
Since axial and radial Langmuir probes were used downstream of the keeper, itwas possible to assess the relative anisotropy of the emitted plasma; an isotropic plasmais also assumed in the classical Langmuir probe analysis. When no current is beingextracted to the secondary anode, the ability of an electron to stream past the keeper isdetermined by its energy, and the temperature of the plasma increases with distance fromthe keeper. By extracting a current to the secondary anode, the net charge density in thegap is decreased, allowing lower-temperature electrons to populate the space. However,by extracting a current, the axial electron energy is increased, and the degree of isotropyin the plasma is decreased. These effects can be seen in Figure 3.36. When the assemblywas operated as a diode, the axial and radial temperatures differed by approximately 0.2eV. As expected, the difference between the temperatures increased when electroncurrent was extracted axially, indicating a higher degree of anisotropy. As a result of thisanalysis, the radial Langmuir probe data were considered to be more representative of thetrue plasma temperature, and only the results obtained with the radial probe are presentedbelow.

73
1.4
1.2
1.0
0.8
0.6
0.4
0.2
0.0
Ele
ctro
n T
empe
ratu
re (
eV)
6050403020100-10
Axial Position Downstream of Keeper (mm)
0.00-A Emission 0.30-A Emission
2.4 sccm, 0.75 A on KeeperOpen = Radial, Closed = Axial
Figure 3.36 - Variation in Observed Electron Temperatures in the Radial and AxialDirections.
A comparison of the electron temperatures in spot and plume-modes is depicted inFigure 3.37. The spot-mode electron temperatures were consistently less than 1 eV,while in plume-mode, the electron temperature varied from approximately 1.5 to 2.5 eV.These results are consistent with the theory for spot and plume-modes described inReference 23. In spot-mode, the ion flux to the keeper and beyond was sufficient toneutralize the space charge, and a low-energy population of electrons is emitted. Whenthe ion flux becomes too small in plume-mode, space charge limitations allow only ahigh-energy electron population to escape. The high-energy electron population excitesand ionizes the xenon at an increased rate, giving rise to the greatly increased lightemission from the plasma. Figure 3.38 illustrates that as the secondary anode extracts acurrent, lower-energy electron populations were obtained, although the change was onlya few tenths of an electron volt. The electron temperatures immediately downstream ofthe keeper and immediately upstream of the secondary anode were invariant in thesetests. The discharge with the secondary anode deposited energy into the emissionplasma, raising the electron temperature near the anode. While the EEDFs appearedDruyvesteyn as shown in Figure 3.39, calculation of the average electron energy yieldedresults in agreement with the electron temperatures in Figure 3.37 and Figure 3.38.

74
3.5
3.0
2.5
2.0
1.5
1.0
0.5
0.0
Ele
ctro
n T
empe
ratu
re (
eV)
6050403020100-10
Axial Position Downstream of Keeper (mm)
Keeper Current, Flow 0.50 A, 2.4 sccm 0.75 A, 2.4 sccm 0.75 A, 1.3 sccm 1.50 A, 2.4 sccm
Figure 3.37 - Emission Plasma Electron Temperature In Spot and Plume-Mode
1.0
0.8
0.6
0.4
0.2
0.0
Ele
ctro
n T
empe
ratu
re (
eV)
6050403020100-10
Axial Position Downstream of Keeper (mm)
0.00-A Emission 0.17-A Emission 0.30-A Emission
0.75 A on Keeper2.4 sccm
Figure 3.38 - Emission Plasma Electron Temperature with Electron Extraction.

75
2.0
1.5
1.0
0.5
0.0
Nor
mal
ized
EE
DF
4eV3210
Electron Energy (eV)
Distance From Keeper 2 mm 12 mm 22 mm
Figure 3.39 - Electron Energy Distribution Function Downstream of the Keeper at0.75-A and 2.4-sccm.
The plasma potential data also illustrate the processes described above, as shownin Figure 3.40. In the case of zero current to the secondary anode, the plume-mode (0.50-A) plasma potential decayed rapidly downstream of the keeper, indicative of the low-density plasma. In spot-mode, the downstream plasma potential was nearly invariantwith keeper current. The higher density spot-mode plasma was able to sustain a greatercharge density than the plume-mode plasma. While the plasma potential generallydecayed with increasing distance from the keeper, Figure 3.41 shows that during currentextraction, the downstream potential leveled out and increased with the extractioncurrent. As the electrons were depleted from the plasma at the secondary anode, thepotential was adjusted to facilitate current collection.

76
24
20
16
12
8
Pla
sma
Pot
enti
al (
V)
6050403020100-10
Axial Position Downstream of Keeper (mm)
0.50 A 0.75 A 1.50 A
2.4 sccm0.00 A on Anode
Figure 3.40 - Potential Variation in the Emission Plasma
24
22
20
18
16
14
12
10
Pla
sma
Pot
enti
al (
V)
6050403020100-10
Axial Position Downstream of Keeper (mm)
0.00 A 0.17 A 0.30 A
2.4 sccm0.75 A on Keeper
Figure 3.41 - Potential Variation While Extracting Current Downstream.
The electron number densities in the emission plasma are plotted in Figure 3.42.To summarize Figure 3.42, the number density increased with flow-rate, keeper current,and emission current, and the densities approximately followed a cubic expansion withradius as expected. The keeper current appeared to have the strongest effect upon thedownstream density. The emission electron number densities were one to two orders ofmagnitude lower than those observed in the very-near-field of the 1.35 kW D55 anode

77
layer thruster.65 Ion thruster beam densities are of the same order as those observedemitted from the hollow cathode.66
4
109
2
4
1010
2
4
a) 0
.75-
A, 0
.00-
A t
o A
node
6050403020100-10
Axial Position Downstream of Keeper (mm)
4
109
2
4
1010
2
4
b) 2
.4 s
ccm
, 0.0
0-A
on
Ano
de
4
109
2
4
1010
2
4
c) 2
.4 s
ccm
, 0.7
5-A
on
Kee
per
1.3 sccm 2.4 sccm 3.3 sccm
Keeper Current 0.50-A 0.75-A 1.50-A
Anode Current 0.00-A 0.17-A 0.30-A
Ele
ctro
n N
umbe
r D
ensi
ty (
cm-3
)
Figure 3.42 - Emission Electron Number Density.
3.3.4 Calculation of Plasma Parameters
Having presented the number density and temperature data, it is useful tocalculate the parameters that were assumed to perform the analysis. Appendix B presentsa detailed discussion of the validity of the probe theory. The Langmuir probe analysis

78
assumed an isotropic, Maxwellian plasma with cold ions. A collisionless, thin sheath wasalso assumed which is especially critical for planar probes without a guard ring; at theprobe edge, a large sheath creates an effective collection area much greater than the probediameter used in the analysis. The isotropic and Maxwellian assumptions were discussedin Chapter 2. The assumption of cold ions will be evaluated in Chapter 4. As Table 3.3shows, the probe diameter was 3 times the Debye length for plume-mode in the insertregion, at 1.3-mm upstream of the orifice, and at approximately 6 cm downstream of thekeeper. In both instances, the data were of approximate quantitative interest, and largeinduced error could be tolerated. The electron-electron collision mean free path was usedto estimate whether the sheaths were collisionless; the ion-ion mean free path isproportional to that of the electrons by the following ratio.
2
2ii i e
ee e i
T m
T m
λλ
≈ (3.2)
The ion-ion mean free paths were greater than or equal to the Debye lengths for iontemperatures between 0.1 and 0.5-eV.
Table 3.3 - Summary of Plasma Length Scales and Definition Parameters.
Region Mode dpr (cm)lch
(cm)Te
(eV)ne
(cm-3) λD (cm)Vsph
(cm3)Nsph λee (cm)
Spot 0.75 1014 6 x 10⁻⁵ 1 x 10-12 100 3 x 10⁻²
InsertPlume
3 x 10⁻² 0.11.50 1010 9 x 10⁻³ 3 x 10⁻⁶ 30000 6 x 10²
Spot 0.50 2 x 10¹³ 1 x 10⁻⁴ 7 x 10-12 140 6 x 10⁻²
CK GapPlume
1 x 10⁻² 0.11.80 3 x 10¹² 6 x 10⁻⁴ 8 x 10⁻¹⁰ 2400 4
Spot 0.2 5 x 10¹⁰ 2 x 10⁻³ 1 x 10⁻⁸ 500 3Emission
Plume0.2 >1
2.5 3 x 10⁸ 7 x 10⁻² 1 x 10⁻³ 4 x 10⁵ 5 x 10⁴
The most basic assumption contained within the Langmuir probe analysis was thepresence of a plasma. The two relevant definitions for a plasma are that the characteristiclength scale of the plasma is much larger than the Debye length and that there are a largenumber of electrons and ions in a Debye sphere. In each case, the characteristic lengthscale was much larger than the Debye length. The minimum electron count in a Debyesphere was 100 for the insert region in spot-mode. Although this number is considered tobe borderline for the definition of a plasma, the ionized gas in this region will be treatedas a plasma nevertheless in the model presented in Chapter 4.

79
CHAPTER 4
HOLLOW CATHODE MODEL AND RESULTS
The primary goal of the theoretical examination of low-current hollow cathodeswas to be able to examine the sensitivity of cathode performance to geometry andmaterial choices. The model presented in this chapter is an ensemble of original work bythe author and previous work by others, specifically, Mandell and Katz,24 Salhi,26 Ferreiraand Delcroix,5 and Capacci, et al.27 To begin with, the processes in the orifice regionwere considered to be one of the primary drivers in determining cathode performance,since the current density was greatest in this volume (up to 1.6 x 10⁸ A/m2 for AR1). Thepresentation of the hollow cathode model begins with the orifice model derived from thatof Mandell and Katz.24 The orifice model contained comparatively few free parameters,and its results were used to bound the free parameters for the insert model. Next, theinsert region model is presented followed by the results of both the orifice and insertmodels. A recently developed thermal model by Van Noord67 successfully examined theroles of cathode material properties, and in lieu of duplicating that work here, the majorfindings are discussed. The orifice and insert models, with consideration of the thermalmodel findings, are sufficient to describe cathode performance. However, theexperimentally determined cathode internal pressure was significantly greater than thatpredicted by the orifice and insert models. Finally, a hydrodynamic pressure model isdiscussed, and plasma processes are assessed for their contribution to the cathode internalpressure.
4.1 Orifice Model
As the electrons conducting the current enter the orifice, they experience bothelastic and inelastic collisions with the neutrals and ions present in the orifice. Thesecollisions produce the ions and a resistance to the electron current. In steady-stateoperation, the ion production and loss rates must be equal, and the Ohmic heating in theplasma must be balanced by the energy losses. Mandell and Katz24 developed a simplemodel of the orifice processes based on these conservation equations, and the presentderivation includes current continuity.
4.1.1 Conservation of Ions
The insert region is modeled as a cylindrical control volume bounded by acathode sheath at the orifice radius, by a double sheath at the entrance to the orifice, andby the exit plane of the orifice. Figure 4.1 illustrates the orifice model approximations.The chamfer is neglected in the analysis of the control volume. In the formulation of themodel, the plasma properties are assumed to be uniform within the orifice, and the radialelectric field is neglected. The axial electric field, however, is included in the orificemodel.

80
Orifice Region
Insert Region
Electron and IonFlux Out of Orifice
Orifice Plate
Keeper
Electron Emission
Double Sheath
Cathode Sheath
1
4i i ij n v=
0.61i i ij n c=
T(insert)
Calculated:1. Electron Density2. Electron Temperature.3. Insert Temperature.
Free Parameters:1. Plasma Potential2. Insert Work Function3. Step-Wise Excitation (2)4. Emission Length
0.61i i ij n c=
1
4i i ij n v=
2,
eff
inskTe th R insj A T e
φ−
=
,
1
4
p
e
eV
kTe back e ej n v e
−
=
Electron currentto satisfy orificecurrent continuity.
,0.5eff i iL d=
Calculated:1. Electron Density2. Electron Temperature
Free Parameters:1. Orifice Temperature2. Step-wise excitation
tk
lck
dk
Figure 4.1 - Illustration of the Orifice and Insert Model Approximations.
The steady-state continuity equation applied to the ions states that the creation andin-flux of ions is balanced by the out-flux.
0i i i i
ionization in flux out flux
dn dn dn dn
dt dt dt dt− −
= = + −
(4.1)
The second term is negligible, and a justification follows. The flux of ions from theinsert region into the orifice is impeded by the potential structure in this region.Nevertheless, an upper bound was evaluated based on the thermal flux of insert ions to asurface with the same area as the orifice. The thermal flux is used in this estimation sincethe sheath at the orifice repels ions, and the Bohm sheath criterion is inapplicable. The

81
experimental data from Chapter 3 were used with the electron temperature, and the in-flux was found to be approximately 3.2 x 10¹⁴ ions/s or about 5 µA. Since this estimateneglects the presence of an ion retarding sheath, the real number is much lower. As willbe seen, the other terms were consistently more than 1000 times this number. Ions in thecathode-to-keeper gap tend to fall toward the cathode due to the axial electric field.Given the large density gradient between the orifice plasma and the CK gap, ionsbackstreaming toward the cathode are more likely to recombine on the downstream sideof the orifice plate than to enter the orifice. In order to evaluate the first term in Equation(4.1), a collision analysis was performed, and the derivation appears in Appendix C. Forsimplicity, electron-impact ionization was assumed to be the only mechanism for creatingions within the orifice. Equation (4.2) describes the ionization rate
( )23
2223
0
44 2
e
e
mv
kTi o eo e o e e ion e
ionization e
dn d ml n n dv v v e
dt kTπ π σ
π
∞ − =
∫ (4.2)
where ve is the electron velocity and σion(ve) is the cross section for electron-impactionization. The neutral number density is calculated by assuming choked flow at the exitof the orifice
o
o o sp o
mn
M A R Tγ=
&(4.3)
where Mo is the atomic mass of the propellant, Ao is the orifice cross sectional area, andthe neutral temperature is assumed to be equal to the orifice plate temperature. Theorifice plate temperature was estimated based on the experimental data. The integral inEquation (4.2) is evaluated numerically using the experimental values for the cross-section by Rapp and Englander-Golden.68 The ion flux out of the control volume isdetermined using the Bohm condition at sheath boundaries and the thermal flux at thedownstream boundary of the control volume.
( )( ) ( ) ( )
( ) ( )
2 2 2
2 2
12 0.61 2
4
810.61 2
4
i i io o o i i o o o i i o
out flux
e ie o o o i o
i i
dn I Jr l r n c r l r n v r
dt e e
kT kTn r l r n r
m m
π π π π
π π ππ
−
= = + = + +
= + +
(4.4)
This equation implicitly includes the effects of the radial electric field with the use of theBohm criterion. At the exit of the orifice the thermal flux of ions is used. The Debyelengths in the orifice indicate that the bulk of the orifice volume is free of the strongradial electric field near the orifice wall. Consequently the density gradient at the exit ofthe orifice determines the ion motion. The model by Capacci, et al.27 included a sheath atthe downstream end of the orifice which is neglected in the present derivation. Thesudden expansion of the plasma at the orifice exit approximates the conditions of adecaying plasma, and ion transport was hypothesized to occur by ambipolar diffusion.The transport of ions downstream of the orifice in a quasineutral plasma is essential to thetheory of spot and plume-mode operation proposed by Mandell and Katz.24 In thepresent model, the emitted ion current is also used to estimate the emitted electron currentbeyond the keeper.

82
Current continuity is described at the orifice entrance and at the orifice exit. Atthe entrance, the total discharge current is calculated as the sum of the electron currentfrom the insert region and the ion current to the walls of the orifice less the ion currentemitted into the cathode-to-keeper gap.
, , ,D e ins i ori i emitI I I I= + − (4.5)
The orifice ion current is calculated as part of Equation (4.4), as is the emitted ioncurrent. The insert electron current is determined using Equation (4.5). At thedownstream end of the orifice, the discharge current is assumed to be the differencebetween the emitted electron and ion currents.
, ,D e ori i emitI I I= − (4.6)
Equation (4.7) combines Equations (4.5) and (4.6).
( ) ( ) ( )2 2 2, ,
1 10.61 2
4 4D e ins e i o o o e i o e ori e i oI I n c r l r n v r I n v rπ π π= + + − = − (4.7)
This type of accounting is necessitated by estimation of the ion current in the orificebeing on the order of ten percent of the total current. The electron current is assumed toincrease linearly between the orifice boundaries. While the rest of the orifice plasmamodel treats all of the properties as spatially invariant, the axial variation of the electroncurrent influences the Ohmic heating within the orifice.
4.1.2 Conservation of Energy
Conservation of energy within the orifice control volume is approximated byequating the Ohmic heating with the losses from ionization, radiative decay of excitedstates, and convection.
Ohmic ion ex convq q q q= + + (4.8)
The Ohmic heating is calculated using the resistivity based on electron-neutral andelectron-ion collisions, as shown in Equation (4.9)69
2e
e
m
n e
νη = (4.9)
where ν is the sum of electron-ion and electron-neutral elastic collision frequencies. Theelectron-ion collision frequency is calculated from the formula in the NRL PlasmaFormulary.70
3
23.9lnei e en Tν−
= Λ (4.10)
where the dimensions are consistent with those listed in the Nomenclature and theCoulomb logarithm is

83
( )1
2
32
610ln 23 ln
e
e
n
T
− Λ = −
(4.11)
An effective value of the electron-neutral elastic collision cross-section is estimated bynumerically integrating the velocity dependent elastic collision cross-section data fromBrode over the Maxwellian electron population in the same manner as Equation (4.2).71
The effective cross-section is then used to evaluate the electron-neutral elastic collisionfrequency as defined in Equation (4.12),
( ), ,e o o e e o en n vν σ= − (4.12)
where the neutral number density based on flow, no, is reduced by the electron densityunder the quasineutral assumption, and the velocity of the electrons is defined as
ee
e
kTv
m= (4.13)
The factor of 2 typically used to calculate the collision frequency is omitted fromEquation (4.12) because the electron velocity is assumed to be much greater than theneutral velocity, thus defining the relative velocity. Since the properties within theorifice are assumed to be constant everywhere, Equation (4.9) defines the plasmaresistivity in the orifice. The electron current in the orifice is assumed to increase linearlytoward the orifice exit due to the creation of ions and electrons through collisions withneutrals along the length of the orifice. The variation in the electron current implies anaxial variation in electron density, however the electron density was treated as uniform inthe orifice control volume for simplicity. The formulation of the Ohmic heating termaccommodates the axial variation of the electron current. Thus for x < lo
( ) ,e e insI x I bx= + (4.14)
where Ie,ins and b are determined by the requirement for current continuity, and aredefined in Equations (4.15) and (4.16), respectively.
( )2, 0.61 2e ins D e i o o oI I n c r l rπ π= − + (4.15)
( ), , 210.61 2e ori e ins
e i o o oo o
I Ib n c r l r
l lπ π
− = = + (4.16)
Calculation of the Ohmic heating of the electrons is modified to account for the variableelectron current along the length of the orifice.
2 2 2 2 3, ,
1
3Ohmic e ins o e ins o oo
q I R I l I bl b lA
η = = + + (4.17)
The ionization power loss due to the flow of ions out of the control volume is the productof the ionization rate, the charge, and the ionization potential:

84
( )2iion i eo o o i
ionization
dnq e N r l e
dtφ π φ = =
(4.18)
where Neo is determined from Equation (4.2), and φi was equal to 12.12 eV for xenon.The second term on the right-hand side of Equation (4.8) describes the power lost
from the free electrons as they excite bound electrons within neutral xenon. The energylost by free electrons in excitation events is calculated similarly to the ionization energyloss. The excitation collision rate in the orifice is (4.19)
( ) ( ) ( )23
2
22 3
0
42
e
e
mv
kTex eo o e o e e e ex e
e
dn mr l n n n dv v v e
dt kTπ π σ
π
∞ − = −
∫ (4.19)
where the collision cross-section data were taken from Hayashi.72 The total energy lossof the free electrons to the excitation of the bound electrons is
exex ex
dnq eU
dt =
(4.20)
where the average energy lost in an excitation event, Uex, is a constrained parameter.Similarly to Mandell and Katz,24 the average excitation energy is set to 10 eV. While thisvalue is representative, provided the overwhelming majority of the excitations are fromthe ground state, the average excitation energy decreases as the fraction of secondaryexcitations increases. In order to rigorously evaluate the power loss due to neutralexcitation, a detailed ionization model is required. Development of such an ionizationmodel was beyond the scope of the present investigation, and reduced accuracy of theresults can be tolerated when using the model to assess the relative capabilities of a givencathode design.
The convective power loss considers the temperatures of the electrons enteringthe control volume from the insert region and those exiting the orifice:
, , , ,conv e ori e ori e ins e insq I T I T= − (4.21)
Equation (4.21) leaves the insert region electron temperature as a free parameter,however, the data presented in Chapter 3 showed that in spot-mode, the insert regionelectron temperature was nearly invariant. In general, the total convection term is a smallfraction of the energy lost in neutral excitation.
The ion continuity (4.1) and energy equations (4.8) are solved iteratively by usinga numerical goal seeking program which varies the electron temperature and numberdensity, respectively. First the electron temperature is varied to satisfy Equation (4.1).Next, the number density is determined, satisfying Equation (4.8). If the solution ofEquation (4.1) holds within established limits, the solution is considered to haveconverged. The solution technique is discussed in more detail in Appendix D.
After the orifice model solution converges, several Knudsen numbers arecalculated to verify that the plasma is indeed collisional, and the Debye ratio and particlecount in a Debye sphere are evaluated to determine if the ionized gas meets theconditions for a plasma. The results showed that the plasma was collisional withKnudsen numbers generally much less than one for plasma-related collisions. The

85
Knudsen numbers for neutral and ion self-collisions were as high as a few tenths. This isconsidered borderline for any continuum theory describing their properties.
The converged solution also permits a relative estimate of the electron emissioncapabilities of a given cathode design. For a cathode operating in spot-mode, the absenceof a luminous plume suggests that few ions are created in the plume. Hence, therequirement of quasineutrality implies that ions are emitted with the electrons. Equation(4.4) states that the ions are emitted based on the thermal efflux. The emitted electroncurrent is calculated based on the ratio of electron-to-ion mobility.
, ,2i
e emit i emite
mI f I
mπ= (4.22)
where f is the escape fraction of electrons moving beyond the keeper. The escapefraction is estimated based upon a cosine distribution to be
2sin2 Tfπ
θ = −
(4.23)
where Tθ is calculated using the cathode and keeper geometries
arctan .
2
ck kT
k
l td
θ
+ =
(4.24)
Examination of Equation (4.24) shows that the emission current can be increased bydecreasing lck or tk or by increasing dk. These modifications also influence spot-to-plume-mode transition and the cathode-to-keeper discharge voltage. Despite theirpotential for increasing electron emission, keeper geometry changes were ignored forsimplicity.
4.2 Insert Model
In the same spirit as the orifice model, the plasma in the insert region isapproximated by a control volume with uniform plasma properties throughout. Figure4.1 illustrates the basis for the insert model. The efficiency of the ionization processeswithin the insert region is expected to contribute to the overall performance. In additionto the statements of ion continuity and energy conservation, the insert model has anexplicit statement of current continuity. These three equations still leave four freeparameters, and the choice of those parameters is discussed below.
4.2.1 Current Continuity
In the insert region, the current continuity statement is written by equating thetotal operating current, ID, with the current emitted from and collected at the cathodesurface. This approach necessitates inclusion of the ion current in the orifice, and the

86
statement is therefore dependent upon the results of the orifice model calculations. Themathematical expression representing current continuity is written in Equation (4.25).
, , , ,D e emit i coll e coll i emitI I I I I= + − − (4.25)
The first term in Equation (4.25) refers to the thermionic electron emission current fromthe insert which is determined using the Richardson-Dushman equation.
( ) 2, , 2
eff
inskTe emit e th i eff R insI I r L A T e
φ
π−
= = (4.26)
The value of the Richardson coefficient was set constant at 60-A/cm2-K2 which isconsistent with Goodfellow.73 The work function is considered as a bounded freeparameter. Typical values for the work function of the insert range from 2.0 to 2.1-eV,and the variation of the thermionic current density as a function of temperature is plottedin Figure 4.2.8 An effective work function is used to account for the Schotky effectwhich acts to reduce the apparent work function of a material in the presence of a strongelectric field.
4ds
eff oo
e Eφ φ
πε= − (4.27)
A double sheath analysis for an electron emitting surface estimates the electric field inEquation (4.27) to be43
12
2 1 2 4pe eds
o e
eVn kTE
kTε
= + −
(4.28)
The plasma potential in Equation (4.28) is a restricted parameter in this investigation.Experimental data showed that the plasma potential varied between 8 and 12-V above thecathode potential depending upon axial position. The effect of the plasma potential onthe thermionic current density is depicted in Figure 4.3 for plasma parameters similar tothose expected. While the emission current density is relatively insensitive to the plasmapotential, the double sheath effect increases the emission current density significantly.The insensitivity of the emission current to the plasma potential argued for its use as afree parameter.

87
0.01
0.1
1
10
100
The
rmio
nic
Cur
rent
Den
sity
(A
/cm2 )
1600K150014001300120011001000
Surface Temperature (K)
φeff = 1.9 eV
φeff = 2.0 eV
φeff = 2.1 eV
Figure 4.2 - Thermionic Current Density for Various Effective Work Functions.
0.01
0.1
1
10
100
The
rmio
nic
Cur
rent
Den
sity
(A
/cm2 )
1600K150014001300120011001000
Surface Temperature (K)
ne = 1020
m-3
, Te = 1 eV
Vp = 8V
Vp = 10V
Vp = 12V
No Schotky Effect
Figure 4.3 - Dependence of the Thermionic Emission Current Density on the PlasmaPotential Based on Double Sheath Analysis. Material Work Function = 2.0-eV.
The ion current collected at the cathode surfaces includes the ion flux in theorifice and insert regions. Ion backstreaming to the insert region is also calculated usingthe Bohm criterion, and these ions are assumed to recombine on the cathode surface inthe insert region. Additionally, the plasma ions, generated in the insert region, alsocontribute to the ion current. In the context of the control volume approximation, ions

88
enter the cathode sheath at the Bohm velocity and diffuse upstream at the thermalvelocity. Ions diffusing upstream were also assumed to recombine on the cathodesurface. In actuality, some ions are collected on the external cathode surfaces. The ioncurrent to the external cathode surfaces is assumed to be negligible due to the reduceddensity in this region. Based on the results presented in Chapter 3, the external ioncurrent was on the order of a few 10-2 A, or about one percent of the total.
Ion emission and electron backstreaming are both small terms, however they areincluded for completeness. Electron backstreaming to the insert surface is describedusing Equation (4.29)
,
1
4
p
e
eV
kTe back e e effI n v eA e
−
= (4.29)
which is on the order of a few milliamperes typically. The effective surface area forelectron collection, Aeff, includes both the effective emission region of the insert and theorifice plate surface. Diffusion of electrons upstream of the insert control volume isneglected based on the assumption that the axial electric field overwhelms the tendencyof the electrons to diffuse in that direction.
4.2.2 Ion Conservation
This species specific form of conservation of mass is essentially the same as thatused in the orifice mode, Equation (4.1). The primary difference is the consideration oftwo electron populations: one a low-temperature beam from the thermionic emissionthrough a double sheath, and the other the Maxwellian plasma electrons. Thecontribution of the plasma electrons to the creation of ions and excited atoms is exactlythat prescribed by Equations (4.2) and (4.19) using the insert effective volume.
The electrons emitted from the insert are referred to here as the primary electrons.The primary electron speed distribution function is approximated as
( )( )23
2
2242
e e d
ins
m v v
kTee e
ins
mf v v e
kTπ
π
−−
=
(4.30)
where vd is the electron drift velocity induced by the sheath voltage, and the temperatureof the primary electron beam is assumed to be the insert temperature. Since the primaryelectrons were created at the insert, excitation and ionization collisions deplete thepopulation with increasing distance from the insert. The mean free path for either ofthese collisions is calculated as shown in Equation (4.31)
( )( )23
2
1
23
0
1
42
e e b
e
m v v
kTee e e e
e
n
mn dv v v e v
kT
λσ
π σπ
−−∞ −
=
= ∫
(4.31)
where the number density is that of the target. Evaluation of Equation (4.31) for theelectron-impact excitation cross-section and the electron-impact ionization cross-section

89
indicates that the mean free path for the ionization interaction is at least 10 times greaterthan for excitation. For simplicity, a planar geometry is used to approximate the primaryelectron number density at the mean free path for electron-impact ionization.
( ) ( ), , 1 ione pr o ion e pr o
ex
n r n r erfλ
λλ
− = −
(4.32)
For ion exλ λ? , the contribution of electron-impact ionization by the primary electrons is
negligible. Consequently the only mechanisms considered for ion creation are electron-impact ionization by plasma electrons, and step-wise excitation by the primary electrons,leading to ionization. The latter phenomenon is considered without a rigorous derivationof the contribution of this term. To evaluate the contribution, a fixed percentage of theexcitation collisions are assumed to create ions. The resulting expression describing theion production in the insert region is
( ) ( )
( )( )
( ) ( )
232
32
2
22 3
0
22
23,
0
42
22
4 .
e
e
e
ins
mv
kTi ei eff e o e e ion e
ionization e
eex i i ex eff
ins
mv
kTe pr o e e e ex e
dn mr L n n dv v v e
dt kT
mf r r L
kT
n n n dv v v e
π π σπ
π λπ
π σ
∞ −
∞ −
=
+ − −
× −
∫
∫
(4.33)
The percentage of excitation collisions which create ions exf is one of the free parameters
in the insert model, and was expected to be a few percent at most. The effective volumefor the excitation of neutrals is limited to two mean free paths from the insert. Thisadjustment accounts for the depletion of primary electrons beyond this distance from theinsert. This picture of the ionization processes in the insert is considered simplistic, butthe approximations are expected to yield meaningful results.
Ion creation by collisions of electrons with neutrals and ion in-flux from theorifice are balanced by ion convection across the control-volume boundaries. Plasmaions enter the cathode sheaths at the insert radius and at the orifice plate with a fluxdetermined by the Bohm condition. Ion loss from the control volume is also calculatedby the thermal flux to the upstream boundary. The various fluxes calculated in thissection are also useful in determining the conservation of energy within the orifice.
4.2.3 Conservation of Energy
The conservation of energy in the insert region is written for the plasma as awhole. Energy enters or is released in the control volume by electron convection fromthe insert, ion convection from the orifice region, and Ohmic heating. The energyconvected with the thermionic electrons is

90
,
3
2ins
thm e thm f
kTq I V
e = +
(4.34)
where the fall voltage, fV , is approximated by the plasma potential. The energy
convected with the orifice ions is
( )2,
20.61 i
i ori e i o dsori
kTq n c e r V
eπ = +
(4.35)
where the average thermal energy of the ion flux to the upstream orifice boundary is 2 ikT
because the energy transport favors the high-energy particles.81 The voltage drop acrossthe double sheath at the boundary between the insert and orifice regions, Vds, wasestimated by Capacci, et al.27 to be
23
2
9.
7.5 2D e e
dso e
I kT mV
A n e e
=
(4.36)
Ohmic heating is calculated in a similar manner as described for the orifice. The plasmaresistivity is determined assuming uniform density and temperature. The electron currentto the orifice calculated from Equation (4.5) is used for the Ohmic heating calculation.Since the current is carried mostly in the radial direction, an average cross-sectional areafor current conduction is used. The resulting expression for the Ohmic heating is
2, 4
3
.iOhmic e ins
i eff
rq I
r Lη= (4.37)
The energy loss mechanisms from the insert region are ion loss, excitationcollisions, electron convection of the current, and electron backstreaming to the insert.The ion loss term is calculated based on the ion flux to the boundaries of the controlvolume.
( )( )2 2,
10.61 2
4
2
i loss e i i eff i o e i
ii
q n c e r L r r n v e
kT
e
π π
φ
= + − + × +
(4.38)
The energy lost in excitation collisions is calculated as the product of the rate of excitedneutral production and the average excitation energy.
( ) ( ) ( ),2
excitedex ex
e o e e ex o eff e pr o e e ex exp pr
dnq eU
dt
n n n v r L n n n v eUσ π σ
= = − + −
(4.39)
where the average excitation energy Uex is another free parameter. The value of Uex issomewhat lower than in the orifice because the energy lost by electrons in secondaryexcitation collisions, which play an important role in ionization in the insert region, isless than 4-eV, thereby reducing the average energy compared to the case where only
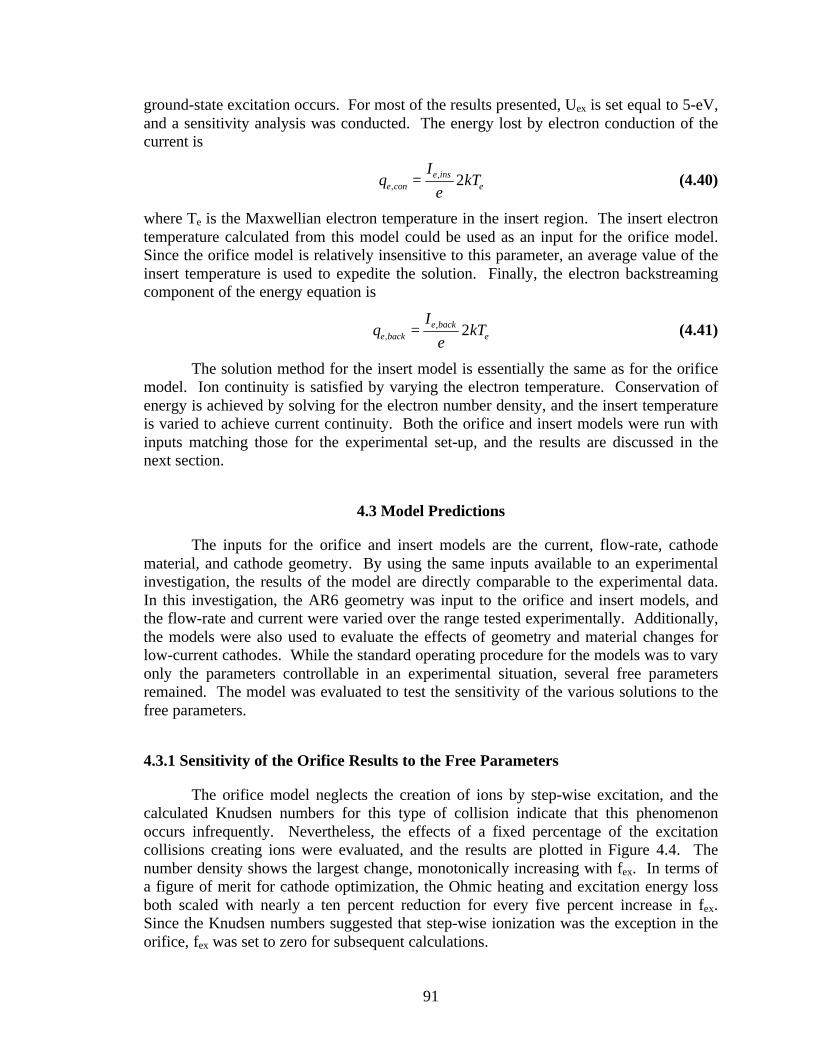
91
ground-state excitation occurs. For most of the results presented, Uex is set equal to 5-eV,and a sensitivity analysis was conducted. The energy lost by electron conduction of thecurrent is
,, 2e ins
e con e
Iq kT
e= (4.40)
where Te is the Maxwellian electron temperature in the insert region. The insert electrontemperature calculated from this model could be used as an input for the orifice model.Since the orifice model is relatively insensitive to this parameter, an average value of theinsert temperature is used to expedite the solution. Finally, the electron backstreamingcomponent of the energy equation is
,, 2e back
e back e
Iq kT
e= (4.41)
The solution method for the insert model is essentially the same as for the orificemodel. Ion continuity is satisfied by varying the electron temperature. Conservation ofenergy is achieved by solving for the electron number density, and the insert temperatureis varied to achieve current continuity. Both the orifice and insert models were run withinputs matching those for the experimental set-up, and the results are discussed in thenext section.
4.3 Model Predictions
The inputs for the orifice and insert models are the current, flow-rate, cathodematerial, and cathode geometry. By using the same inputs available to an experimentalinvestigation, the results of the model are directly comparable to the experimental data.In this investigation, the AR6 geometry was input to the orifice and insert models, andthe flow-rate and current were varied over the range tested experimentally. Additionally,the models were also used to evaluate the effects of geometry and material changes forlow-current cathodes. While the standard operating procedure for the models was to varyonly the parameters controllable in an experimental situation, several free parametersremained. The model was evaluated to test the sensitivity of the various solutions to thefree parameters.
4.3.1 Sensitivity of the Orifice Results to the Free Parameters
The orifice model neglects the creation of ions by step-wise excitation, and thecalculated Knudsen numbers for this type of collision indicate that this phenomenonoccurs infrequently. Nevertheless, the effects of a fixed percentage of the excitationcollisions creating ions were evaluated, and the results are plotted in Figure 4.4. Thenumber density shows the largest change, monotonically increasing with fex. In terms ofa figure of merit for cathode optimization, the Ohmic heating and excitation energy lossboth scaled with nearly a ten percent reduction for every five percent increase in fex.Since the Knudsen numbers suggested that step-wise ionization was the exception in theorifice, fex was set to zero for subsequent calculations.

92
40
30
20
10
0
-10
-20
-30
Per
cent
age
Cha
nge
in P
aram
eter
121086420-2
fex
in Orifice (percent)
ne
Te
qohm
qex
Figure 4.4 - Relative Dependency of Orifice Plasma Properties on the Fraction ofExcitation Collisions Contributing to Ionization. AR6 Geometry at 0.50-A and 0.9-
sccm.
The average excitation energy is also considered a free parameter since thedistribution of the excitation transitions was unknown. Excitation from the ground statein xenon costs between 8.44 and 10.40-eV.74 If this event dominates the excitationcollisions, then the average excitation energy is on the order of 10-eV. While thepreceding paragraph discounted the contribution of step-wise excitation in the orifice, theeffect of reducing the average excitation energy was evaluated to examine the potentialconsequences of this simplification, and the results are shown in Figure 4.5. The mostsensitive parameters are the number density and the power consumption. The powerconsumption was expected to scale with the excitation energy. The number densityincreases as the excitation energy decreased, ensuring that the convective power termsaccount for the difference between the Ohmic heating and the excitation loss. Theprevious discussion concerning the orifice Knudsen number for excitation supports theconclusion that ground state excitations dominate, and the average excitation energy wasset to 10-eV for all subsequent calculations.

93
-60
-40
-20
0
20
40
60
Per
cent
age
Cha
nge
in P
aram
eter
11109876543
Uex
in Orifice (eV)
ne
Te
qohm
qex
Figure 4.5 - Relative Dependency of the Orifice Region Plasma Properties on theAverage Excitation Energy. AR6 Geometry at 0.5-A and 0.9-sccm.
4.3.2 Sensitivity of the Insert Results to the Free Parameters
By contrast, the excitation processes in the insert region are essential to plasmageneration. The primary electrons undergo excitation collisions almost exclusively.Figure 4.6 depicts the sensitivity of insert region plasma parameters and powerconsumption to the value of fex in the insert region. Electron convective powerconsumption decreases by ten percent for an increase of two percent to fex, while thenumber density increases by twenty percent over the same interval. Although the numberof excitation events possible in xenon argue that only a small fraction create ions, anionization model is needed to rigorously determine the value of fex. The fraction ofexcitations creating ions was set to 0.05 for all subsequent calculations, since the resultsagreed well with the experimental data.

94
40
30
20
10
0
-10
-20
-30
Per
cent
age
Cha
nge
in P
aram
eter
98765432
fex
in Insert Region (percent)
ne
Te
qe,conv
Ie,thm
Figure 4.6 - Dependency of the Insert Region Plasma Properties on the Fraction ofExcitation Collisions Contributing to Ionization. AR6 Geometry at 0.50-A and 0.9-
sccm.
As important as the value of fex is to the solution of the insert region parameters,the average excitation energy in the insert region influences the solution to a greaterdegree. Figure 4.7 depicts the sensitivity of the plasma properties and energy terms in theinsert region to changes in the average excitation energy. While the plasma propertiesand energy terms are highly sensitive to Uex, the preponderance of the secondaryexcitations in the insert region is expected to reduce the average excitation energycompared with the ground-state value used in the orifice calculations. Over the rangefrom 3 to 8-eV, the change in power consumption by excitations scales with Uex. Thenumber density is highly sensitive to the average excitation energy in the insert region,changing by about ten percent per electron-Volt. Since many of the possible transitionsbetween excited states in neutral xenon involve less than 1-eV,74 the lack of detailedaccounting of the population of the excited states makes the value chosen for Uex
somewhat arbitrary, although it should be weighted for the ground-state transitions whichenable secondary excitations. The average excitation energy was set to 5-eV in lieu of amore rigorous evaluation. This number accounts for electron collisions with excitedstates while a lower number requires that the plasma approach optically thick conditions.The experimental data indicated that the insert region plasma was far from optically thickconditions.

95
-120
-80
-40
0
40
80
Per
cent
age
Cha
nge
in P
aram
eter
111098765432
Uex
in Insert Region (eV)
ne
qex
qohm
Figure 4.7 - Dependency of the Insert Region Plasma Properties on the AverageExcitation Energy. AR6 Geometry at 0.50-A and 0.9-sccm.
The plasma potential is a free parameter in the insert model, althoughexperimental data put bounds on the value chosen. Furthermore, the sharp axial gradientin the plasma potential made the choice of a volume-averaged value perilous. Theplasma potential was varied from 7 to 12-eV to obtain the data in Figure 4.8. Again thenumber density is highly sensitive to this parameter as is the convected energy from thethermionic emission current. The latter finding is expected since the reduction in thework function by the Schotky effect scales with number density. While the insert regionplasma potential near the insert was as high as 12-V, a value of 8-V was used forsubsequent calculations both in consideration of the volume averaged value and becauselarge values for Vp degraded the stability of the model.

96
80
60
40
20
0
-20
-40
Per
cent
age
Cha
nge
in P
aram
eter
131211109876
Insert Region Plasma Potential (V)
ne
Tins
qthm
Ie,thm
Figure 4.8 - Dependency of the Insert Region Plasma Parameters on the PlasmaPotential. AR6 Geometry at 0.50-A and 0.9-sccm.
The final free parameter considered here is the material work function of theinsert. While the available data confine the work function to between 2.0 and 2.1-eV,this range strongly affects the requisite cathode operating temperature as shown in Figure4.9. A change of 0.1-eV in the work function leads to more than a 50-K increase in theinsert temperature. It should be noted that in a real system, the plasma potential dependsupon the material work function, and the variation of either of these parametersindependently is artificial. A value of 2.00-eV was chosen for subsequent calculationsprimarily due to an apparent over-prediction of power consumption; a low-work functionreduces the power consumption gap at high flow-rates.

97
1500
1480
1460
1440
1420
Inse
rt T
empe
ratu
re (
K)
2.122.102.082.062.042.022.001.98
Insert Material Work Function (eV)
Figure 4.9 - The Effect of the Material Work Function on the Predicted InsertTemperature for AR6 at 0.50-A, and 0.9 sccm.
4.3.3 Low-Current Predictions for Various Conditions and Geometries
The values of the free parameters are listed in Table 4.1, as is the matrix ofoperating conditions and geometries evaluated using the orifice and insert models. TheAR6 geometry is used as the baseline condition. In each test, the flow-rate is varied overits full range. The effect of the discharge current on the predicted cathode operatingconditions was examined for consistency with the experiments. The orifice diameter isvaried for two different orifice lengths. The shorter orifice accommodates the AR3´geometry. The orifice length is altered to provide data on aspect-ratios from 1 to 6.Finally the sensitivity of the insert plasma properties to the inner diameter of the insertwas examined. The results of these numerical experiments are presented below.
Table 4.1 - Test Matrix for the Orifice and Insert Models
Test m& (sccm) ID (A) do (mm) lo (mm) di,i (mm)Current 0.6 to 2.4 0.50 to 1.25 0.127 0.71 1.2
do Test 1 0.6 to 2.4 0.50 0.08 to 0.25 0.25 1.2do Test 2 0.6 to 2.4 0.50 0.13 to 0.25 0.71 1.2
lo 0.6 to 2.4 0.50 0.13 0.13 to 0.71 1.2di,i 0.6 to 2.4 0.50 0.13 0.71 0.8 to 2.0Free
Parametersfex
(orifice)Uex
(orifice)fex
(insert)Uex
(insert)Vp
(insert)φ
(insert)Value 0.0 10.0-eV 0.05 5.0-eV 8.0-V 2.00-eV

98
4.3.2.1 Results of the Orifice ModelFigure 4.10 depicts the results of the calculations varying the discharge current.
The lack of experimental data in the orifice region dictates that the results are comparedonly with the overall experimentally observed performance trends. The electron numberdensities are greater than those determined experimentally both upstream anddownstream of the orifice plate. This result is consistent with the expectation of amaximum current density in the orifice. Further, the number density increases with bothcurrent and flow-rate. The dependency of number density on both of these parameters isconsistent with experimental data downstream of the orifice plate. The electrontemperature by contrast is insensitive to current and only varies with flow-rate. For spot-mode operation, the experimentally determined electron temperature downstream of theorifice was also found to be insensitive to current. The magnitude of the electrontemperature is larger than expected based on the experimental data. The requirement thatthe tail of a Maxwellian electron population create the ions in the orifice drives thesolution toward high electron temperature. The Druyvesteyn distributions observed bothupstream and downstream of the orifice contained a larger fraction of the electrons at theenergies of interest for ionization than a Maxwellian with the same average energy.Consideration of a Druyvesteyn distribution function may bridge the gap between thetheory and the experiment. Also of note in Figure 4.10 are the power generated byOhmic heating and the power lost through excitation. Excitation power losses representthe largest fraction of the loss terms in all cases. In some cases, the predictions of powerconsumption exceed the experimentally determined discharge power of the cathode. Thisnon-physical solution had several possible contributing factors, including the use of aMaxwellian electron population, the neglect of excitation-based ionization, and the valueassumed for the average excitation energy. Both the ionization and excitation rates weredependent upon the electron temperature, and an over-prediction of the electrontemperature leads to excessive power consumption. Finally, the electron emissioncurrent is predicted to scale with current and flow-rate in nearly the same manner as theelectron number density. This finding is a result of the proportionality of the emitted ioncurrent to the orifice electron number density. The emitted electron current also scalesmore strongly with the discharge current, in agreement with the findings shown in Figure3.18 (page 55). These results show that the orifice model accurately predicts the trendsexpected with flow-rate and current, while the electron temperature and the powerconsumption are slightly higher than expected.

99
8x10²¹
6420
n e (m
-3)
3.02.52.01.51.00.5
Xenon Flow Rate (sccm)
2.62.42.22.0T
e (eV
)
403020100
q ohm
(W
)
3020100
q ex (
W)
4.03.02.01.0I e,
emit
(R
el.)
Discharge Current
0.50 A 0.75 A 1.00 A 1.25 A
Reference
Figure 4.10 - Variation of Plasma and Control Volume Properties within the Orificeas Functions Discharge Current And Flow-rate. AR6 Geometry.
The dependency of the orifice plasma properties on the orifice diameter isdepicted in Figure 4.11. The density scales inversely with the orifice diameter, while theelectron temperature increases with the diameter. The neutral number density decreaseswith increasing orifice diameter, according to Equation (4.3). The ionization rate isdirectly proportional to the neutral number density, while the ion loss rate is dependentonly on the electron temperature and number density. The reduction in neutral numberdensity with increasing orifice diameter is responsible for both the decrease in theelectron number density and the increase in the electron temperature, through the ioncontinuity condition. The power consumption terms are equally sensitive to orificelength and diameter. Both the Ohmic heating and excitation terms are strongly dependentupon both electron and neutral number densities, and the relation is seen in Figure 4.11.The power consumption in the orifice increases with orifice length as expected. Theplasma resistivity is relatively insensitive to the orifice length, and the Ohmic heatingterm scales strongly with orifice length. Similarly, the excitation energy loss term alsoincreases; the addition of orifice length enabled more ionization collisions to occur. Theemission current again follows the electron number density, with electron emissionincreasing with diminishing orifice diameter.

100
1020
1021
n e (m
-3)
300x10-6
20015010050
Orifice Diameter (m)
2.82.62.42.2T
e (eV
)
86420
q ohm
(W
)
6420
q ex (
W)
1.61.20.80.4
I e,em
it (
Rel
.)
lo = 0.25 mm
lo = 0.71 mm
Figure 4.11 - Variation of Orifice Model Calculated Properties as a Function ofOrifice Diameter and Length. ID = 0.50-A at 0.9 sccm with di,i = 1.2-mm.
The results of varying the orifice length are plotted in Figure 4.12. The numberdensity becomes nearly invariant with increasing orifice length at three times the orificediameter, while the electron temperature still exhibits a modest decline. Increases inorifice length are met with corresponding rises in ionization and excitation collisions. Asthe orifice length is increased beyond three times the diameter, the loss of ions to thewalls of the orifice scale with orifice length in nearly the same proportion as theionization rate, resulting in little change in either electron temperature or number density.Conversely, the additional collisions predicted by the increasing orifice length meant thatpower consumption scaled linearly with orifice length. The design tolerance for theorifice diameter was 1 x 10⁻⁵ m, which according to Figure 4.11 results in a variance inthe Ohmic power term on the order of 1-W. The experimental findings showed littledifference in the power consumption between AR6 and AR3 (Figure 3.16, page 53),which was partially explained by the design tolerance in the orifice. Nevertheless, Figure4.12 also argues for limitation of the orifice aspect-ratio to three; increasing values for theorifice aspect-ratio yield no additional emitted electron current while power consumptionis increased.

101
2.4x10²¹
2.01.6
1.2n e (m
-3)
800x10-6
6005004003002001000
Orifice Length, lo (m)
2.62.42.22.0
Te (
eV)
8642q oh
m (
W)
642q ex
(W
)
1.41.21.00.80.6
I e,em
it (
Rel
.)
Figure 4.12 - Variation of Orifice Model Calculated Properties as a Function of theOrifice Length. AR6 Geometry at 0.50-A and 0.9 sccm.
4.3.2.2 Results of the Insert ModelThe results of the insert model are plotted in Figure 4.13 for several discharge
currents and flow-rates. The density and temperature follow trends similar to those in theorifice, with reduced sensitivity. Both the electron temperature and number density agreewith the experimental data. The electron temperature results also display a degree ofinstability in the numerical solution. The predicted insert temperature and emittedthermionic current are more dependent upon current than flow-rate.

102
200x1018
160
120
80
40n e (
m-3
)
3.02.52.01.51.00.5
Xe Flow Rate (sccm)
1.40
1.36
1.32
1.28
Te (
eV)
1500
1450Tin
s (
K)
1.0
0.8
0.6
0.4I e,th
m (
A)
0.50 A 0.75 A 1.00 A 1.25 A
Figure 4.13 - Insert Model Calculated Plasma and Control Volume Properties asFunctions of Both Current and Flow-rate. AR6 Geometry.
The insert power consumption and thermionic current are dependent upon theorifice diameter through the current continuity requirement. Figure 4.14 depicts thevariation of insert plasma conditions with orifice diameter. For the large orifice diameter,the insert electron temperature decreases significantly with diminishing orifice length.The convected thermionic electron power term is highly dependent not only on orificediameter, but also the length. The thermionic current is expected to decrease as thelength of the orifice increased due to the collected ion current. Recalling Figure 4.11, theelectron number density in the orifice decreases sharply as the diameter is increased. Theion current to the orifice walls is proportional to the number density. Consequently theincreased orifice diameter reduces the ion current, and the thermionic current is requiredto maintain current continuity. This finding also implies that to minimize powerconsumption in the insert region, the orifice diameter should be as small as possible for agiven application.

103
2
4
1020
2
n e (m
-3)
300x10-6
20015010050
Orifice Diameter (m)
1.60
1.50
1.40
1.30
Te (
eV)
1500145014001350
Tin
s (
K)
4.03.83.63.43.2
q e,th
m (
W)
1.41.21.0
q e,co
nv (
W)
0.480.460.440.420.40I e,
thm
(A
)
Lo = 0.25 mm
Lo = 0.71 mm
Figure 4.14 - Variation of Insert Region Properties with Orifice Diameter. ID =0.50-A at 0.9 sccm and di,i = 1.2-mm.
The formulation of the orifice and insert models is such that variation of the insertinner diameter did not alter the results from the orifice model, and the influence of theinsert inner diameter on the plasma properties is presented in Figure 4.15. The mostsignificant dependencies are that of the number density and the insert temperature. Thenumber density is expected to rise as the insert inner diameter decreased out of necessityto provide a sufficient plasma for current conduction. The electron convection term,proportional to the electron temperature, is only slightly higher for the small diameterinsert than the large insert diameter. The effective emission length is set to half of theinsert diameter. Consequently, the power density increased greatly for the small insertdiameter. While the power convected into the control volume by the thermionic electronsis a weak function of the insert diameter, the reduced power density enables electronemission at decreasing insert temperatures. The result is that the heat conducted and

104
radiated away from the insert is reduced with increasing insert diameter, and efficiency isincreased.
4
6
1020
n e (m
-3)
2.2x10⁻³
1.81.61.41.21.00.80.6
Insert Inner Diameter (m)
1.381.361.341.32
Te (
eV)
1500
1400Tin
s (
K)
3.30
3.28
3.26
3.24
q e,th
m (
W)
1.41.21.0q e,
conv
(W
)
0.440.420.400.380.36I e,
thm
(A
)
Figure 4.15 - Dependency of Insert Region Properties on the Insert Inner Diameter.
4.3.4 Discussion of Implications for Low-Current Hollow Cathode Performance
The findings from the orifice and insert models indicate some trends andlimitations to consider in the design of low-current hollow cathodes. In terms of theorifice, the diameter should be as small as necessary to carry the current based on theKaufman criterion. The orifice aspect-ratio should be kept less than three as furtherincreases yield no additional electron emission, and power consumption increases withlength. The efficiency of the insert region also favored a minimized orifice diameter. Itshould be noted that this finding was in agreement with Salhi and Turchi.45 The insert

105
model also showed that ion collection in the orifice reduced the thermionic electronemission requirements for the insert, thereby reducing the power consumption. A trade-off must be struck between ion current collected in the orifice and thermionic electroncurrent to determine the most efficient combination, and the orifice length can then bedetermined. Finally, maximizing the insert inner diameter was found to improveperformance. This last suggestion cannot be taken to extremes in the absence of athermal model. Cathode thermal mass and heat transfer from the cathode tip must also beconsidered when significant modifications to the design are proposed.
4.4 Discussion of a Recently Developed Cathode Thermal Model
Considering the axial temperature distributions presented in Chapter 3, calculationof the heat transfer in the cathode tube was considered to be advantageous. However,Van Noord67 has developed a thermal model of the hollow cathode which considers moreof the processes determining the cathode operating temperature than previous models.27,38
The model was largely derived from the works by Siegel and Perlmutter,75 and Siegel andKeshock.76 The plasma parameters were estimated based on the data by Salhi.26 Onlyclassical gray body radiation was considered. The plasma radiation, both blackbody andBremsstrahlung, were estimated and determined to be negligible. The heating terms forthe orifice by the plasma were largely the reciprocal of the insert model conservation ofenergy terms. The model solved for a solution which ensured current continuity. Theresulting model contained second order differential terms, fourth order temperature terms,and two integrations. Van Noord67 solved the heat transfer equation by linearizing theradiation terms and using a finite difference method similar to that employed by Siegeland Keshock.76 With the model, Van Noord was able to examine the roles of thermalconductivity, convection with the propellant, the emissivity, and the plasma heatdeposition in determining the cathode temperature distribution. The findings of the workby Van Noord67 provided sufficient closure to the question of designing thermallyefficient cathodes.
Several of Van Noord’s67 conclusions directly concerned this investigation. Inagreement with the findings of the experimental investigation, the heat transfer along thecathode length was conduction limited. This finding suggested that alternate materialsshould be considered, particularly for low-current hollow cathodes. As expected, thematerial work function strongly influenced cathode operating temperature. This findingwas similar to that from Figure 4.9. Van Noord67 also showed that the externalemissivity dominates the radiative portion of the heat transfer. These findings were themost pertinent to the design of low current hollow cathodes.
4.5 Theoretical Treatment of Cathode Internal Pressure
The cathode pressures reported in Chapter 3, though high, were consistent withthe values reported by Salhi26 scaled by the ratio of the orifice areas. Under theassumptions made previously that the ions and neutrals were at the same temperature asthe cathode, the predicted internal cathode pressure fell well short of the measuredvalues. The cathode internal pressure was written as

106
o o i i e ep n kT n kT n kT= + + (4.42)
Based on typical values calculated for the orifice, the neutral, ion, and electron partialpressures were 2.57 kPa, 0.10 kPa, and 1.96 kPa, respectively. By contrast, theexperimental total pressure for similar operating conditions was more than 40 kPa. Theworks by Siegfried25 and by Capacci, et al.27 avoided this issue by using an empiricallyderived pressure relation. A predictive model requires an expression for the pressurewhich limits the use of empirical relations. Salhi26 introduced an expression based onisothermal flow in the cathode with a sonic condition at the exit of the orifice. In thepresent derivation, an effort was made to account for the pressure drop between thecathode interior and the sonic point at the orifice exit. The Reynolds numbers werebelow five for the cases expected in the 3.2-mm diameter cathodes, indicating laminarflow. Borderline Knudsen numbers were calculated for a flow-rate of 0.6 sccm, and theflow was more accurately described by continuum theory at higher flow-rates. Ferreiraand Delcroix5 derived a Poiseuille flow expression which used an empirically determinedweight factor to address the degree of continuum flow. This approach was discarded dueto both the empirical constant and the fact that the viscous solution supported a largerpressure gradient than the free-molecular result. The flow was modeled as continuumPoiseuille flow. The resulting equation for the pressure in insert region was
( ) ( )0.5
2 24
128 12 1
2in sp c o o Lo
p m R T x p u Kd
µρ
π
= + + +
& (4.43)
where µ is the dynamic viscosity, x is the distance upstream, ou is the bulk average gas
velocity, KL is a loss coefficient associated with the orifice entrance, and
2
4 1c sp
o sp
p mR Td R Tπ γ
= & (4.44)
is the sonic condition at the orifice.Equations (4.43) and (4.44) were used to model the pressure measured in the
hollow cathode with a neutral flow, and the comparison is depicted in Figure 4.16 andFigure 4.17. Initially, the xenon temperature was equated with the observed orifice platetemperature at 298 and 1228-K. The agreement between the theory and the experimentwas poor at 298-K, although the accuracy of the theory improved at 1228-K. Theprediction for the latter case suggested that the gas temperature was greater than theorifice plate temperature. Physically this was reasonable considering that the interior ofthe hollow cathode acted like a blackbody enclosure, and the temperature interrogationpoint was external to the cathode, where radiative losses were important.

107
8000
6000
4000
2000Cat
hode
Pre
ssur
e (P
a)
3.02.52.01.51.00.5
Xe Flow Rate (sccm)
Experiment (298-K) Theory (298-K) Theory (373-K) Theory (573-K)
Figure 4.16 - Comparison of the Flow-rate Calculations With Experiments forRoom Temperature Neutral Xe Flow for AR6.
30x103
25
20
15
10
5
Cat
hode
Pre
ssur
e (P
a)
3.53.02.52.01.51.00.5
Xe Flow Rate (sccm)
Experiment Theory (1228-K) Theory (1373-K) Theory (1473-K)
Figure 4.17 - Comparison of the Flow-rate Calculations With Experiments for 1228-K Neutral Xe Flow in AR6.
Examination of Figure 3.20 (page 57) and Figure 4.17 indicates that the theorydeveloped here would require very-high heavy particle temperatures to match thepressures observed during the cathode discharge. By varying only the temperature inEquations (4.43) and (4.44), the data between 0.50 and 1.50-A were modeled adequately

108
for gas temperatures ranging from 3300 to 6500-K, as listed in Table 4.2. WhileWilliams, et al.60 presented data indicating ion and neutral temperatures of severalthousand Kelvin, the existence of high-temperature heavy particles has so far defiedexplanation.
Table 4.2 – Calculated Heavy Particle Temperature to Match Cathode InternalPressure Data
Current (A) Heavy Particle Temperature (K)0.50 3300 ± 1000.75 4800 ± 1001.00 5700 ± 1001.25 6200 ± 1001.50 6500 ± 150
Several plasma related phenomena were evaluated to determine if they wereresponsible for either the elevated cathode internal pressure or the observed high-temperature heavy particles. Given the current density within the orifice, the pinch-effectwas examined. Finally, a radial distribution of the heavy particle temperatures wascalculated based on heat transfer with the electrons.
4.5.1 Current Density Induced Pinch Effect Pressure
The pinch effect in the orifice was estimated in order to determine whether itcontributed significantly to the cathode internal pressure. The pressure generated by thepinch effect in the hollow cathode was approximated by Equation (4.45).77
( ) ( )2
2 2
4 o o
jp r r r p
µ= − + (4.45)
where po is the ambient pressure outside of the arc. The permeability of the plasma wasapproximated by that of free space, µo.
78 Using this substitution and calculating themaximum pressure, r = 0, the pinch effect was estimated to contribute on the order of 10-Pa for the operating conditions of the hollow cathode. Equation (4.45) was evaluated fora range of radii and currents to explore what radius was required for the pinch effect toaccount for the experimentally determined pressures. The results are shown in Figure4.18, and they indicate that the pinch effect could account for the internal cathodepressure only if the arc were constricted to a few micrometers. The veracity of thishypothesis has yet to be proven experimentally. However, the gas temperature in the arcis related to the pressure by an equation of state, and this mechanism would explain thetemperature measurements by Williams, et al.60 Indeed, the ion and neutral temperatureswere measured in the expansion downstream of the orifice, where one would expect thetemperature to be less than in the orifice according to the equation of state.

109
101
102
103
104
105
Pin
ch E
ffec
t P
ress
ure
(Pa)
5 6 71µm
2 3 4 5 6 710µm
2 3 4 5 6
Arc Radius
0.50-A 0.75-A 1.00-A 1.25-A 1.50-A
Spot-to-Plume ModeTransition Pressurepspot-to-plume
pspot-to-plume-pneutral
Figure 4.18 - Predicted Peak Pinch Effect Pressures as a Function of Arc Radius.
4.5.2 Radial Distribution of the Heavy Particle Temperatures
A model was developed to examine the radial distribution of heavy particletemperatures in the orifice of low-current hollow cathodes. The model considered theheat transfer between the electrons, ions, and neutrals in the orifice. While the energyequation was based on continuum assumptions, the conductivity used was derived fromthe mean free path method. Spitzer79 reported a model for the equipartition in a two-temperature plasma, which Salhi26 modified to predict the radial distribution of the iontemperature in the insert region. Salhi assumed that the neutrals equilibrated with theions over length scales much shorter than the dimensions of the cathode. Rather thanassuming that the neutrals equilibrated with the ions, the present derivation included ion-neutral energy transport in Equation (4.46).
1 i ip
dT dTdr c
r dr dr dtκ ρ= (4.46)
The time derivative was defined according to Spitzer:79
i i e
eq
dT T T
dt t
−≈ (4.47)
where teq was the equipartition time. Spitzer79 reported the convenient form of theequipartition time show below:

110
32
2 25.87
lne i e i
eqe e i e i
M M T Tt
n Z Z M M
= + Λ
(4.48)
An approximately equivalent statement to Equations (4.47) and (4.48) was used todescribe the transport of energy from the electrons to the neutrals, and is shown inEquation (4.49).80
( ) ,
2 3
2n e
p n e n e nn e n
dT mc k T T n
dt mρ ν
−
= − (4.49)
where νn,e is an energy weighted momentum transfer collision frequency. Equation(4.49) was modified to describe the transport of energy from the ions to the neutrals.
( ) ,3np n i n i n
n i
dTc k T T n
dtρ ν
−
= − (4.50)
The collision frequencies were calculated from the generalized formula81
,
8 8a ba b ab b
a b
kT kTn
m mν σ
π π= + (4.51)
The energy balance for the ions contained a reciprocal statement to Equation (4.50).Finally, Equation (4.46) was rewritten in terms of both the ion and neutral temperatures,as shown in Equations (4.52)
( )
( ) ( )
,
, ,
12
212
i i ep i n i n
eq
n ep n e n e n i n i
n
dT T Tdr c T T
r dr dr t
dT mdr c T T T T
r dr dr m
κ ρ ν
κ ρ ν ν
−= + −
= − + −
(4.52)
The thermal conductivity was calculated using the mean free path method,81
,
,
2 i n
i n
kTk
mκ
σ π= (4.53)
and the density and specific heat were rewritten using the kinetic description81
, ,
3 3
2 2p e n i e ni
kc n m n k
mρ
= =
(4.54)
Note that the conductivity is independent of density and depends only on the temperature,mass, and collision cross-section. The collision cross section used was that defined basedon the hard sphere molecule assumption.81

111
22
3 mdσ π= (4.55)
Equation (4.55) yielded a cross-section of 9.3 x 10⁻²⁰ m2.82 The boundary conditions forEquations (4.52) were that the temperature at the orifice surface was equivalent to thewall temperature and that the radial temperature gradient was zero on the axis. Theseboundary conditions are expressed mathematically in Equations (4.56):
( ),
0
0
o wall
i n
r
T r r T
dT
dr =
= =
=
(4.56)
Equations (4.52) were solved using a 4th order Runge-Kutta technique, and iterationtoward a solution was necessary since the temperature distributions were interdependent.Note that Salhi26 calculated the heavy particle distribution in the insert region, whereasthe present discussion focuses on the orifice region.
The orifice mode was used to obtain estimates of the electron temperature andnumber density within the orifice. The predicted number densities varied from 3 x 10²⁰
to 1 x 10²² m-3, and the electron temperatures ranged between 1.8 and 3.0 eV for thegeometries of AR6, AR3, and AR1. Figure 4.19 presents the radial temperaturedistribution of the ions and neutrals for AR6 at 1.25-A and 2.4-sccm. Under theassumption of uniform particle density, the results from the orifice model yielded onlymodest increases in the heavy particle temperature based on the orifice model results. Atslightly higher densities and lower electron temperatures, the results indicated that theions and neutral temperatures on centerline were several hundred to around 1000 Khigher than the wall temperature. The remainder of this section discusses the solutionsobtained from Equations (4.52) in the range where the ion and neutral temperaturesdeviate significantly from the wall temperature.

112
1490
1480
1470
1460
1450
1440
1430
1420
Tem
pera
ture
(K
)
70x10-6 50403020100-10
Radial Position (m)
Ions Neutrals
Figure 4.19 - Radial Heavy Particle Temperature Profile for AR6 at 1.25-A and 2.4-sccm (Te = 2.00-eV, ne = 8.5 x 10²¹ m-3, no = 2.3 x 10²³ m-3).
Under the conditions depicted in Figure 4.19, the electron-neutral momentumtransfer frequency was so much greater than the electron-ion collision frequency that theneutrals were better heated by the electrons. This situation occurred due to the highelectron temperature. As the electron temperature was reduced from the values in Figure4.19, the ions were better able to accommodate towards the electron temperature, asshown in Figure 4.20. Nevertheless, the maximum centerline temperature in thisexample was still considerably below that predicted by the gasdynamic model. Figure4.21 illustrates the radial distribution of the heavy particle temperatures for electronnumber densities in excess of 8.5 x 10²¹ m-3. While the results indicated that the heavyparticle could deviate by several thousand K from the wall temperature, the numberdensities required to yield this result also violated the current continuity expression forthe orifice and insert models.

113
1475
1470
1465
1460
1455
1450
1445
1440
1435
1430
Tem
pera
ture
(K
)
70x10-6 50403020100-10
Radial Position (m)
Ions Neutrals
Te = 0.50 eV
Te = 0.50 eV
Te = 1.00 eV
Te = 1.50 eVTe = 1.00 eV
Te = 1.50 eV
Figure 4.20 - Radial Variation of the Ion and Neutral Temperatures in the Orifice asa Function of Electron Temperature. (ne = 8.5 x 10²¹ m-3, no = 2.3 x 10²³ m-3).
3500
3000
2500
2000
1500
1000
Tem
pera
ture
(K
)
70x10-6 50403020100-10
Radial Position (m)
Ions Neutrals
ne = 2 x 10²² m-3
ne = 5 x 10²² m-3
ne = 1 x 10²³ m-3
Figure 4.21 - Radial Variation of the Ion Temperature within the Orifice as aFunction of Electron Number Density. Te = 0.50 eV and no = 2.3 x 10²³ m-3.
The orifice model was run with several test cases to evaluate whether theproperties within a constricted arc could satisfy the current continuity condition and yieldelevated ion and neutral temperatures. The neutral number density was initially

114
calculated for the orifice model given the standard orifice radius. This value was fixedfor the orifice model, and the “radius” of the orifice was reduced to the limits of themodels’ ability to converge. The result was a nearly fully ionized plasma within the arc,and the electron density was then artificially forced to decay smoothly for positionsbeyond the arc radius. The electron and neutral densities in the orifice are illustrated inFigure 4.22. The results of the of the heavy particle temperature distribution, also shownin Figure 4.22, indicated that the ion temperature could exceed the wall temperature byabout 1000-K for an arc of about twenty percent of the orifice radius.
2600
2400
2200
2000
1800
1600
1400
1200
Tem
pera
ture
(K
)
70x10-6 50403020100-10
Radial Position (m)
2
4
1021
2
4
1022
2
4
1023
Num
ber
Den
sity
(m-3
)
Ions Neutrals
FullyIonized
Figure 4.22 - Radial Distribution of Heavy Particle Temperatures Based on the ArcColumn Hypothesis (Te = 2-eV).
Although the evidence to suggest that current conduction in the orifice occurredby means of a constricted arc was indirect, this theory was suggested for the operation oforificed hollow cathodes. Optical methods offer the best opportunity for experimentalverification of this theory. The important processes should be preserved if scaling of thecathode is necessary to facilitate optical access. Experimental measurement of thisphenomenon was left to future work.

115
CHAPTER 5
DESIGN AND TESTING OF NEXT-GENERATION LABORATORY MODELCATHODE
The best test of a theory or empirically drawn conclusions is to use thatknowledge to predict the outcome of a new experiment. In the case of the presentinvestigation, the goal was to use the knowledge and insights gained from theexperimental investigation to develop a theoretical model which can be used to designmore efficient cathodes. This chapter presents the design and performance of a second-generation, laboratory-model hollow cathode.
5.1 Cathode Design
The design of the second-generation, low-current hollow cathode SC.012incorporated improvements based on several findings of the experimental and theoreticalinvestigations combined with the practical considerations of available material. Whilecomprehensive testing of the model predictions requires comparison between theory andexperiment of the effects of individual design changes, several design modifications wereimplemented simultaneously at the risk of introducing an unexpected outcome. This wasdone in order to achieve the goal of a low-consumption, low-current hollow cathode moredirectly. Heat conduction was reduced in order to better thermally isolate the thermionicemitter. The insert electrical connection was modified to improve insert positionaccuracy. The insert geometry was modified to facilitate ionization. The orifice platewas designed for low-flow-rate operation with minimal power. The keeper was designedto enhance ion and electron transport to a secondary anode or plasma. The design ofSC.012 is discussed in detail below.
5.1.1 Thermal Design
Minimization of the heat conduction from the high temperature region of SC.012was accomplished geometrically and by using materials with lower thermal conductivity.Figure 5.1 depicts SC.012 schematically. Although the insert used in SC.012 had a largerdiameter than any of the cathodes examined in Chapter 3, conduction and thermal masswere reduced by shortening the insert, 9.5-mm as opposed to 12.7-mm. The use of twotube diameters required that the insert be electron beam welded in place (see Figure 5.2).Electron beam welding the insert to the cathode tube eliminated the cathode legs and legholder, and the thermal conduction path was reduced to the thin wall of the cathode tubeupstream of the insert. The interface between the cathode tube and the insert was isolatedto the upstream edge of the insert. Any contact between the insert and the cathode tubeor orifice plate was incidental and would have a high contact resistance. The cathodetube and orifice plate of SC.012 were made of tantalum. Tantalum has a conductivity ofapproximately 61 W/m-K at 1300 K which is only slightly better than Mo-50%Re alloy(64 W/m-K).83,84 The conductivity of the tungsten is 113 W/m-K at 1300 K, and the use
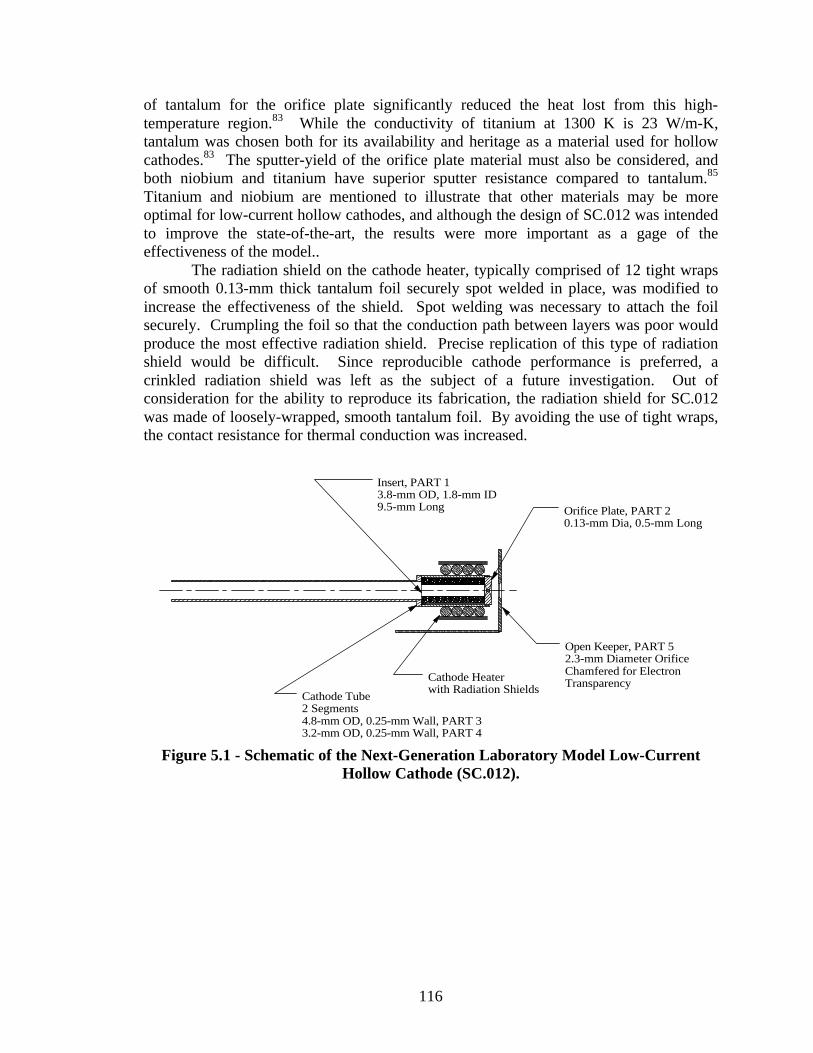
116
of tantalum for the orifice plate significantly reduced the heat lost from this high-temperature region.83 While the conductivity of titanium at 1300 K is 23 W/m-K,tantalum was chosen both for its availability and heritage as a material used for hollowcathodes.83 The sputter-yield of the orifice plate material must also be considered, andboth niobium and titanium have superior sputter resistance compared to tantalum.85
Titanium and niobium are mentioned to illustrate that other materials may be moreoptimal for low-current hollow cathodes, and although the design of SC.012 was intendedto improve the state-of-the-art, the results were more important as a gage of theeffectiveness of the model..
The radiation shield on the cathode heater, typically comprised of 12 tight wrapsof smooth 0.13-mm thick tantalum foil securely spot welded in place, was modified toincrease the effectiveness of the shield. Spot welding was necessary to attach the foilsecurely. Crumpling the foil so that the conduction path between layers was poor wouldproduce the most effective radiation shield. Precise replication of this type of radiationshield would be difficult. Since reproducible cathode performance is preferred, acrinkled radiation shield was left as the subject of a future investigation. Out ofconsideration for the ability to reproduce its fabrication, the radiation shield for SC.012was made of loosely-wrapped, smooth tantalum foil. By avoiding the use of tight wraps,the contact resistance for thermal conduction was increased.
Insert, PART 13.8-mm OD, 1.8-mm ID9.5-mm Long
Cathode Tube2 Segments4.8-mm OD, 0.25-mm Wall, PART 33.2-mm OD, 0.25-mm Wall, PART 4
Cathode Heaterwith Radiation Shields
Open Keeper, PART 52.3-mm Diameter OrificeChamfered for ElectronTransparency
Orifice Plate, PART 20.13-mm Dia, 0.5-mm Long
Figure 5.1 - Schematic of the Next-Generation Laboratory Model Low-CurrentHollow Cathode (SC.012).

117
Electron Beam Welds
Larger Diameter at Insert
Figure 5.2 - Photograph of SC.012 Showing The Electron Beam Welds and TwoTube Diameters
5.1.2 Insert Design
The insert inner diameter for SC.012 was 0.6-mm (50 percent) larger than that ofany other cathode tested in this investigation. The findings of both the experimental andtheoretical investigations indicated that the insert diameter should be large for increasedefficiency. The experiments showed reduced power and propellant consumption withincreasing insert inner diameter. The insert temperature required to emit the electronsdecreased as the emission surface area increased. Consequently, heat loss was reducedby increasing the insert inner diameter. Further, Salhi and Turchi45 developed somescaling relations for hollow cathodes including a relation between cathode performanceand insert-to-orifice diameter ratio. As the insert diameter increases relative to the orificediameter, spot-mode cathode propellant consumption is reduced. The physical pathlength for the primary electrons from the insert increases with insert diameter, facilitatingionization. While the choice of the insert used in SC.012 was driven by hardwareavailability, the resulting geometry was serendipitous; the larger insert inner diameterwould enhance ionization. The larger outer diameter and the need to minimizeconduction were the reasons for the use of two diameters of cathode tube. The electronbeam weld fixed the insert position, mitigating the issue raised by mismatch of the insertouter diameter with the cathode tube inner diameter.
5.1.3 Orifice Plate Design
As with the cathodes evaluated in Chapter 3, the diameter of SC.012 was chosenbased upon the Kaufman50 criterion for the maximum current. To safely maintain anemission of 1.5-A, the orifice diameter was 0.125-mm. The orifice length was chosenbased on both the experimental and theoretical results. The experimental results showedthat transition flow-rate scaled inversely with orifice length, and power consumptionincreased with orifice length. These trends were mirrored in the theoretical predictions.

118
An orifice length of 0.38-mm was chosen as a compromise slightly favoring low-flow-rate over low-power consumption. Figure 5.3 is an engineering drawing of the orificeplate.
0.015"+0.003"
-0.001"
0.013"+0.002"
-0.002"
Angle Not Critical
Angle Not Critical
ø0.0050"+0.0005"
-0.0005"
ø0.095"+0.005"
-0.005"
ø0.176"+0.002"
-0.002"
0.040"+0.008"
-0.005"
Figure 5.3 - Engineering Drawing of SC.012 Orifice Plate (Dimensions in inches).
In addition the orifice dimensions, the plate thickness and chamfer were alsoconsidered in the design. As with previous designs, the thickness was driven largely bythe requirements of the spot welding process. If the orifice plate were too thin, welding itwould cause melting or softening of the entire plate, and the orifice could becomedistorted or closed. The orifice plate thickness was 1.0-mm, which was 2.67 times largerthan the designed orifice length.
The orifice of SC.012 was chamfered to accommodate the difference between thedesired orifice length and required plate thickness. The shape of the chamfer was derivedfrom a concept proposed by Katz and Patterson.86 According to the orifice model, ionswere lost from the orifice control volume with a uniform flux equal to the product of theelectron number density and ion acoustic speed. The flux to the downstream surfaceprovided an estimate of the ion emission from the hollow cathode. Regardless of whetherthe emitted ion flux was hemispherical or cosine in distribution as shown in Figure 5.4,the fraction of ions lost to downstream cathode surfaces decreases as the chamfer angleand depth are decreased. Consequently, a shorter chamfer with a shallower angle enablesincreased ion emission for charge neutralization in the cathode-keeper gap and spot-modeemission at reduce flow-rates. The orifice plate was made symmetrically with internaland external chamfers of 0.32-mm depth and 15 degree half-angle; most hollow cathodesemploy a 45 degree half-angle. The internal chamfer facilitated a shallower externalchamfer without greatly increasing the distance from the insert to the orifice. Thedownstream angle was limited to avoid interference with the welding process, and Figure5.5 illustrates this point.

119
Orifice Plate
Cosine Expansion
HemisphericalExpansion
Unobstructed Path
Cathode Absorbed Path
Enclosed Keeper
Chamfered Orifice Plate No Chamfer
Ion Paths at Orifice Exit
Figure 5.4 - Illustration of the Tendency of Chamfered Orifice Plate to Collect IonsEmitted from the Orifice.
Orifice Platewith ShallowChamfer
Figure 5.5 - Photograph of SC.012 with Shallow Orifice Plate Chamfer.
5.1.4 Keeper Design
An engineering drawing of the keeper is shown in Figure 5.6. While an enclosedkeeper is more thermally efficient than an open keeper, the open geometry was

120
considerably simpler to fabricate and enabled optical and thermocouple access to theentire cathode tube. The keeper orifice diameter was identical to the cathodes reported inChapters 2 and 3. A chamfer was added to the downstream end to facilitate electrontransport downstream of the keeper. In this case, electrons entering the keeper sheath arelost for carrying current to a downstream electrode. The chamfer minimizes the keepersurface area presented to the emitted plasma without increasing the aperture diameter.The purpose was to increase electron emission capacity at a given flow-rate.
0.02"+0.01"
-0.01"
90°
ø 0.19"+0.02"
-0.02"
ø 0.09"+0.01"
-0.01"
0.25"+0.02"
-0.02"
0.2
5"+
0.0
2"
-0.0
2"
0.7
5"+
0.0
2"
-0.0
2"
Figure 5.6 - Diagram of the Open Keeper Used with SC.012.
5.1.5 Design Summary
In order to summarize the design process for low-current hollow cathodes, thevarious considerations are listed in Table 5.1. The reader should keep in mind thatalthough the model presented in Chapter 4 is a useful design tool, the number of factorsinfluencing cathode operation make a comprehensive optimization routine beyond thescope of this work.
Table 5.1 Low-Current Hollow Cathode Design Considerations
Design Aspect Specific Considerations
Material Choice• Low-thermal conductivity• Low-sputter yield/high-sputter threshold• Strength at elevated temperature
Insert Design
• Low-work function• Maximize inner diameter• Maximize insert position accuracy• Maximize thermal isolation
Orifice Design
• Diameter determined by total current requirement• Length a trade-off between power and flow consumption• Minimize chamfer dimensions• Orifice plate thickness determined by fabrication technique
Keeper Design• Aperture diameter determines power consumption and spot-
to-plume transition• Downstream chamfer to facilitate electron transport

121
• Enclosed keeper to limit radiative heat loss
5.2 Performance Evaluation
The most meaningful test of any cathode determines the cost in terms of flow-rateand power consumption for a given current. Consequently the test of SC.012 focused oncathode performance throughout its operating regime. Cathode current, voltage, flow-rate, and internal pressure were measured according to the techniques outlined in Chapter2. Cathode flow-rate was initially set to approximately 2.4 sccm at a constant current.The flow-rate was then decreased until the onset of plume-mode or an unstable conditionwas reached. In this respect, the evaluation was very similar to those performedpreviously.
Evaluation of the keeper voltage as a function of flow-rate and current is depictedin Figure 5.7. The trends observed with SC.012 were very similar to those of the othercathodes. While the lowest flow-rate condition of each of the characteristics in Figure5.7 appears to indicate plume-mode operation, the high-frequency, large-amplitude ACcomponent of the keeper voltage was absent at each of the data points in Figure 5.7. Thepreviously defined plume-mode condition was observed with SC.012 at flow-rates lowerthan reported in Figure 5.7. However, the plume-mode operation was comparativelyunstable, and the arc extinguished itself within a few seconds of the onset of the mode.Due to the nature of this phenomenon, it was difficult to define precisely the transitionflow-rate. Consequently, the reader is left to observe from Figure 5.7 that stable, spot-mode operation of SC.012 was achieved at lower flow-rates for a given current than all ofthe cathodes tested previously in this investigation.
24
22
20
18
16
14
12
Kee
per
Vol
tage
(V
)
3.53.02.52.01.51.00.50.0
Flow Rate (sccm)
0.50 A 0.75 A 1.00 A 1.25 A 1.50 A AR6', 1.00 A
Figure 5.7 - Voltage-Flow-rate Characterization of SC.012.

122
Both the increased insert inner diameter and the orifice geometry contributed tothe reduced spot-mode flow-rates. Figure 5.8 shows that SC.012 could operate in spot-mode with internal pressures significantly below those of the first-generation cathodes.The internal pressure of SC.012 was intermediate between that of AR3 and EK6 for thesame operating conditions. Geometrically the orifices of SC.012 and AR3 were nearlyidentical, and the difference in internal pressure for SC.012 was attributed to moreefficient arc-heating of the ions. In some cases, spot-mode emission was maintained withSC.012 at slightly more than half the flow necessary for EK6.
90x103
80
70
60
50
40
30
20
10
Cat
hode
Pre
ssur
e (P
a)
3.53.02.52.01.51.00.50.0
Flow Rate (sccm)
0.50 A 0.75 A 1.00 A 1.25 A 1.50 A 1.00 A, AR3 1.00 A, EK6
Spot-ModeMinimumFor AR6
Spot-Mode Minimum for AR3.
Spot-Mode Minimum for SC.012.
Figure 5.8 - Reduction of Cathode Internal Pressure for Spot-Mode Operation.
To directly compare the performance of SC.012 with the other cathodes, Figure3.16 (page 53) was replicated in Figure 5.9, and the data from SC.012 were added. Sinceplume-mode operation was absent from SC.012, the transition flow-rates for AR6´ wereused in Figure 5.9. At each keeper current, SC.012 consumed approximately 20 percentless power than AR6´. Thus cathode operation was improved in SC.012 in both powerand flow consumption. The power consumption of SC.012 was also less than that ofAR1, illustrating that although the orifice length of SC.012 results in a larger amount ofOhmic heating in the orifice, the rest of the thermal design makes up the difference.

123
30
25
20
15
10
5
Kee
per
Pow
er (
W)
2.01.61.20.80.4
Current (A)
2.61
1.9
1.61
1.44
1.2
2.44
1.39
1.4
1.38
1.18
AR6' AR3 AR1 SC.012
Flow rates in sccm are listed for AR6' and SC.012 data.
Figure 5.9 - Comparison of the Minimum Power Consumption at Transition.
Finally, SC.012 was also operated in the triode configuration used previously togage its emission capabilities. The only test was performed with a keeper current of 0.5-A under the premise that in most applications, the keeper would be operated at theminimum current necessary for stable operation. The resulting emission current iscompared with EK6 in Figure 5.10. The scale in Figure 5.10 is expanded to show thecapability of SC.012. Although SC.012 was operated over a more limited range of anodevoltage than EK6, the emission current capabilities of SC.012 were clearly superior toEK6. This result is a product of both the improved efficiency of the cathode design andthe chamfered keeper.

124
0.20
0.15
0.10
0.05
0.00
Ano
de C
urre
nt (
A)
2422201816141210
Anode Voltage (V)
SC.012, 2.0 sccm EK6, 2.4 sccm
Low-Power Ion ThrusterBeam Current Range
Figure 5.10 - Emission Current at 0.50-A to the Keeper.
5.3 Summary
A second-generation laboratory model hollow cathode was designed to operate atreduced flow-rate and power requirements compared with those tested initially. Theinitial experimental and theoretical investigations were used to determine the mosteffective modifications to be employed in the second-generation cathode. The resultingdesign balanced the considerations of performance optimization, available materials, andfabrication techniques. While other materials and geometries were presented whichwould be more optimal for very-low-current hollow cathodes, the cathode SC.012demonstrated superior performance to all of the cathodes tested initially. The powerconsumption was reduced by 20 percent compared with the best first-generation cathodeat comparable flow-rates. The spot-mode requisite flow was less at each keeper currentthan all of the previously tested cathodes. Finally, SC.012 demonstrated superiorelectron emission capabilities when operated as part of a triode configuration. Thesuccessful design of SC.012 is testament to the lessons learned in the experimental andtheoretical investigations.
125
CHAPTER 6
CONCLUSIONS AND FUTURE WORK
This work focused on reduction of the power and propellant consumption of low-current orificed hollow cathodes. Hollow cathodes which operate with minimal powerand flow consumption are of interest for electric propulsion devices and as plasmacontactors. Recent efforts to develop 100 to 300-W class electric propulsion systemsheightened the need for efficient hollow cathodes.11,12,16 As the scale of the electricthrusters decreases, plasma generation is hampered by the reduction in the availablevolume to surface area ratio of the ionization region; ions are more easily lost to the wallsand the close proximity of the walls tends to cool the plasma. These phenomena occur inhollow cathodes as well, and the research presented here examined the factors drivinglow-current hollow cathode efficiency.
The approach taken in this investigation had four components. Initially a numberof hollow cathodes were designed using a mixture of existing scaling relationships anddesign heritage. Next, the performance of these cathodes was evaluated, the cathodetemperature distributions were measured, and the plasma environment was mappedextensively. The results of the experimental investigation were used to validate a modelof the orifice and insert regions of low-current hollow cathodes. Finally the results ofboth the experimental investigation and the model were used to design a second-generation low-current hollow cathode.
6.1 Performance of Low-Current Hollow Cathodes
Five separate 3.2 mm diameter orificed hollow cathodes were designed and testedin a number of different configurations. Power consumption increased with orificelength, while the minimum flow-rate decreased. The use of an enclosed keeper reducedthe power consumption, however the minimum flow-rate was observed to increase. Thelatter finding was unexpected because the use of an enclosure increases the local pressurein the cathode-keeper gap, which should lead to increased ion creation and transport withthe electrons downstream. The cathode internal pressure was found to vary from 39.2 to66.5 kPa in spot-mode, and the transition to plume-mode occurred at a nearly fixedinternal pressure regardless of the current or flow-rate. Subsequent analysis of the insertplasma with Langmuir probes and the cathode-to-keeper plasma suggested that severaltens of kPa were possible only if the heavy particle temperature was on the order ofseveral thousand Kelvin. LIF measurements by Williams, et al.60 indicated that theneutral temperatures were several thousand Kelvin.
The behavior of the cathode external temperatures was also studied to determinethe important heat transfer modes. Conduction dominated the heat transfer from thecathode surface. The condition was more pronounced when an enclosed keeper wasused. This conclusion means that cathode performance at low-power can be readilyimproved by choosing materials with a low-thermal conductivity. In the limit of low-

126
power density, the issue of thermal stability only arises when attempting to maintainsufficient temperature for electron emission.
Finally, plasma parameters were measured in the insert region, in the cathode-to-keeper gap, and downstream of the keeper. These data were intended to providevalidation for a cathode model. While the dimensions in the insert region precludeddetailed mapping similar to Salhi,26 the resolution was sufficient to compare the plasmaproperties in the 3.2-mm orificed hollow cathodes with those measured by others.25,26
The electron number density in the insert was of the same order, and exhibited a sharpergradient near the orifice than the data by Siegfried.25 The electron temperature in spot-mode was consistently less than 1-eV, while the onset of plume-mode led to electrontemperatures above 1-eV. The number density in all regions scaled with the flow-rateand the current. The anisotropy of the plasma downstream of the keeper was found toincrease with beam extraction. The electron energy distribution function was alsomeasured to validate the parameters determined using the standard Langmuir probeanalysis. While the distribution functions all appeared to be Druyvesteyn, the calculatedaverage electron energies agreed well with the previously determined electrontemperatures.
6.2 Orifice and Insert Models
A model describing the processes occurring in the orifice was derived from theone by Mandell and Katz.24 The model evaluated ion continuity and conservation ofenergy within the orifice assuming uniform properties. A current continuity statementwas added for use with the insert model. The orifice model, like its predecessor, wasused to evaluate the effects of orifice geometry on the performance of the cathode. Theorifice model was used in conjunction with an insert model based along similarsimplifying assumptions. This model was used to examine which factors influencedpower consumption in the insert region. The prediction of the plasma properties were ingood agreement with the experimentally determined values. The prediction of theelectron temperature in the orifice was significantly higher than was observed eitherupstream or downstream of the orifice. Since the electron temperature was obtained bysolving for ion continuity, the use of a Maxwellian versus a Druyvesteyn electronpopulation resulted in an overestimation of electron energy due to the need for ionization.For a given electron temperature, the Druyvesteyn distribution has a greater number ofhigh-energy electrons which facilitate ionization. An overestimation of the electrontemperature was also responsible for the predicted power consumption exceeding thedischarge power in some cases.
The combined orifice/insert model was used to determine an approach to optimalcathode design. The results showed that the orifice diameter should be as small aspossible to facilitate electron emission. As the orifice aspect-ratio increased beyondthree, the cathode simply consumed additional power in the orifice without additionalelectron emission. Power consumption decreased as the insert diameter was increased.
The findings of the orifice and insert models were combined with a gasdynamicexpression for the pressure in the cathode as a function of temperature and flow-rate. Themodel indicated that for heavy particle temperatures of several thousand Kelvin, thecalculated cathode pressure agreed with the experimental results. A constricted arc

127
column in the orifice was proposed as the mechanism responsible for the elevated neutraland ion temperatures.
6.3 Test of Improved Design
A second-generation laboratory model hollow cathode was designed, fabricated,and tested based on the findings of both the experimental and theoretical investigations.In addition to the design features inspired by the previous results, the cathodeincorporated several new fabrication techniques which were expected to further reducethe heat loss from the insert region. The orifice plate was modified so that the fraction ofthe emitted ions which became lost to the cathode sheath was reduced. Tests of thecathode showed that at the same current and flow-rate, it consumed twenty percent lesspower than the best of the first-generation cathodes. This result was especiallyremarkable considering the increased thermal mass of the cathode imposed by materialavailability. The cathode also demonstrated spot-mode operation to significantly lowerflow-rates than previously achieved.
6.4 Suggested Future Work
While the design changes incorporated in SC.012 resulted in significantlyimproved low-current performance, examination of Table 1.1 (page 3) shows that thedesign goals for the neutralizer on a 100 to 300 W ion thruster remain out of reach. Forthe 100-W case, the total current (keeper and emission/beam neutralization) is only 0.2-A. In the course of this investigation, none of the cathodes demonstrated even short term(tens of hours) stability below 0.5-A. Further, spot-mode operation at 0.5 sccm, the flow-rate requirement, was achieved only for relatively high current conditions. The design ofa neutralizer for the low-power ion engine must incorporate as many of the modificationssuggested in Chapter 5 as is feasible. Below are discussions of several possibilities forfuture development of low-current hollow cathodes.
To begin with, the extremely low current requirement means that the materialswill be exposed to a relatively low-density plasma and experience a low-thermal load.Consequently the sputter yield and melting point requirements become relaxed comparedwith high-current cathodes. The extremely low thermal conductivity of titaniumcompared with the other materials used in this investigation is ideal for this application.The sputter yield is also acceptable despite the lower melting temperature of titanium. Inaddition to reducing the thermal conductivity, the design must also include an enclosedkeeper. In a further effort to minimize the conduction away from the high temperaturecomponents, the insert could be brazed directly to the orifice plate prior to impregnationof the insert. This process would be similar to the method currently used to braze thecollar to the insert. The issue of whether the braze material could withstand the cathodeoperating temperature must be addressed. The power deposited in the orifice would beeasily conducted to the insert, where it is needed, and conduction to the low temperatureend of the tube would be more torturous. This configuration also lends itself to the use ofa short insert, where the thermal mass is reduced. In the spirit of reducing the thermalmass, a trade study should be implemented comparing the benefits of increased insert

128
inner diameter with the need to keep the overall dimensions small to minimize bothconductive and radiative losses.
The low emission current specified for a 100-W class ion thruster raises thepossibility of significantly altering the keeper geometry. If the electron emission fromthe hollow cathode tends toward a cosine distribution, then placing the keeperimmediately downstream of the orifice would reduce the cathode-to-keeper voltage andenable reduced flow-rate. The low emission current would be accommodated by theemission at high angles of the cosine distribution. This configuration would have to betested since the emission current generally decreases with flow-rate.
For applications where low-power is important and a flow-rate of several sccmcan be tolerated, the multichannel hollow cathode may be an option. The design of thesecathodes must be modified so that the low work function surface is long lived. Theresults of the current investigation showed that these cathodes scale poorly to low currentapplications since the physical path lengths for ionization to occur are too short for lowflow-rates. The multichannel hollow cathodes lend themselves to higher currentapplications.
In order to meet the specifications set out in Table 1.1 (page 3) or more restrictivedesign goals, alternate cathode schemes must be considered. One of the most promisingtechnologies for low current electric propulsion is the field emitter array cathode. Thesecathodes operate without propellant. The field emitter array cathodes consist of millionsof field emission cones with a gate electrode which functions similarly to the keeper on ahollow cathode. The small scale of the cones (typically a few atoms wide at the tip)enables a very strong electric field to be generated with relatively low voltage (<100-Von the gate). The technology, primarily developed for flat-panel displays, typicallyrequires ultra-high vacuum to ensure life, and long-term operation in millitorrenvironments must be established.

129
APPENDICES

130
APPENDIX A
SAMPLE ANALYSIS OF LANGMUIR PROBE DATA AND ELECTRONENERGY DISTRIBUTION FUNCTION CALCULATION
The raw current-voltage data from the Langmuir probes was sufficiently free ofnoise to perform the standard analysis. However, small fluctuations were amplified bytaking two numerical derivatives of the data, and a cubic spline interpolation of the rawdata was necessary to calculate the derivatives. Consequently, the cubic splineinterpolation was used in the standard analysis out of convenience. The ion saturationcurrent was subtracted from the total probe current to calculate the electron current asshown in equation (A.1).
( ) ( ) ,e pr pr pr i satI V I V I= − (A.1)
Next, the natural logarithm of the electron current was evaluated. As shown in FigureA.1, a linear curve fit was performed, and the electron temperature was set equal to theinverse slope of the line. This statement is equivalent to equation (2.3). The plasmapotential was determined by the probe voltage at the peak of the first derivative of theprobe current as defined in equation (2.4). The derivatives were evaluated according tothe following formulas:
( ) ( ) ( )
( ) ( ) ( )
( ) ( ) ( )
1 00
1 1
2 11
2i i
i
N NN
f x f xdf x
dx xf x f xd
f xdx x
f x f xdf x
dx x
+ −
− −−
−=
∆−
=∆
−=
∆
(A.2)
The nature of the current-voltage characteristic in Figure A.1 made determinationof the electron saturation current problematic. All of the data collected in thisinvestigation exhibited the gentle positive slope seen in Figure A.1. In order to establisha consistent means of determining the electron number density based on this portion ofthe curve, the current at the plasma potential was used in equation (2.5). While the ionsaturation region of the current-voltage characteristic in Figure A.1 appears to mitigatethe issues raised in the electron saturation region, sufficiently accurate measurement ofthe ion saturation current was accomplished only in the cathode-to-keeper gap. In fact,the data in Figure A.1 were taken in the insert region, and the ion saturation current wasmeasured as 1.9 x 10⁻⁸ A; a negative current is needed for equation (2.6) to calculate areal number density.
Figure A.2 summarizes the procedure involved in evaluating the two derivativesof the probe current to calculate the EEDF. The first derivative must be interpolated byanother cubic spline so that the second derivative is piecewise smooth. Equations (A.2)are then used to compute the second derivative of the probe current. Next the electron

131
energy must be defined according to Equation (2.8). Examination of Figure A.2 showsthat the probe voltage at the peaks of the first and second derivatives are different. Witha Maxwellian EEDF, these peaks occur at the same voltage, the plasma potential. Thisrepresents the first indication that the population is non-Maxwellian. As stated inChapter 2, the peak of the second derivative was used in Equation (2.8) so that thedistribution more closely resembled either a Maxwellian or Druyvesteyn. Thisassumption is justified by considering that for a Maxwellian distribution, the probevoltage at the peak of the second derivative is the plasma potential which is used inEquation (2.8). Figure A.3 shows the results of multiplying the second derivative by thesquare root of the electron energy. The EEDF calculated based on the peak of the firstderivative is included for reference. Figure A.3 also shows the effect of small signalperturbations at electron energies significantly higher than the bulk of the population; thefactor of E1/2 amplifies the noise at large values of E.

132
700x10-6
600
500
400
300
200
100
0
-100
Pro
be C
urre
nt (
A)
14121086420
Probe Voltage with Respect to Cathode (V)
200x10-6
100
0
dI/d
V-20
-16
-12
-8
ln I e
Data Cubic Spline
Vf = 5.72 V
Te = 0.66 eV
Vp = 9.96 V
Ipr(Vp) =
3.05 x 10⁻⁴
AIpr(Vf-10Te) =
1.9 x 10⁻⁸
A
Linear Curve Fit
Figure A.1 Illustration of the Standard Langmuir Probe Analysis.
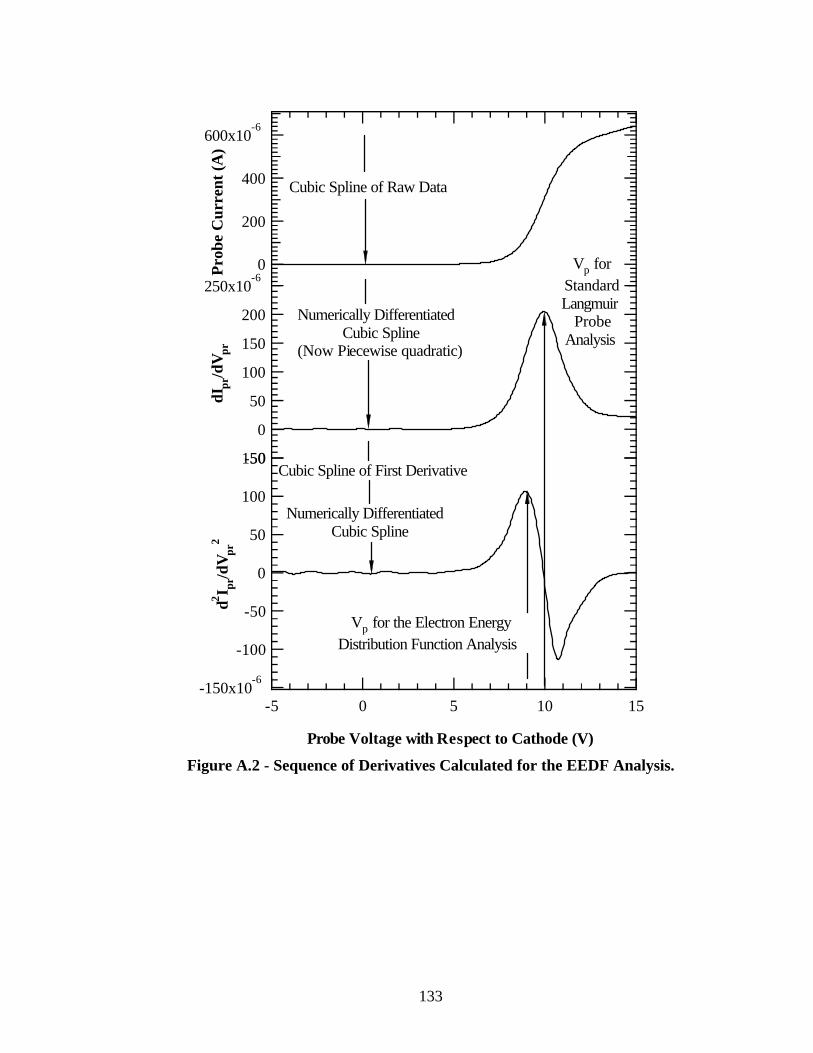
133
600x10-6
400
200
0
Pro
be C
urre
nt (
A)
151050-5
Probe Voltage with Respect to Cathode (V)
250x10-6
200
150
100
50
0
-50
dIpr
/dV
pr
-150x10-6
-100
-50
0
50
100
150
d2 I pr/d
Vpr
2
Cubic Spline of Raw Data
Numerically DifferentiatedCubic Spline
(Now Piecewise quadratic)
Cubic Spline of First Derivative
Numerically DifferentiatedCubic Spline
Vp forStandardLangmuir
ProbeAnalysis
Vp for the Electron EnergyDistribution Function Analysis
Figure A.2 - Sequence of Derivatives Calculated for the EEDF Analysis.

134
120x10-6
80
40
0
d2 I pr/d
Vpr
2
16eV14121086420
Electron Energy
0.6
0.5
0.4
0.3
0.2
0.1
0.0
Nor
mal
lized
EE
DF Multiply by E
1/2
Noise amplified by factor of E1/2
Using Vp = Peak Second Derivative Using Vp = Peak First Derivative
Figure A.3 - Final Processing of the EEDF Data and Comparison of Results Basedon Two Values for the Plasma Potential.

135
APPENDIX B
EVALUATION OF THE VALIDITY OF THE STANDARD LANGMUIR PROBEANALYSIS
The Langmuir probe analysis used in this dissertation assumed that the sheath wasthin and collisionless. A sheath is considered thin when it is much smaller than thecharacteristic dimensions of the Langmuir probe, in this case the diameter. If the sheathis large compared to the probe diameter, the effective collection area is larger thanexpected and the measured density is greater than the true density. Since sheath size istypically several Debye lengths, the thin sheath assumption requires that the probediameter be much larger than the Debye length. The collisionless sheath assumption isnecessary to insure that the electrons and ions entering the sheath have the same identityas when they entered the sheath; collisional exchange phenomena within the sheath alterthe character of the ions or electrons collected by the probe. The collisionless sheathassumption is satisfied if the collision mean free paths are much greater than the Debyelength.
The length scales 1.3-mm upstream of the orifice plate are depicted in Figure B.1.In this case, the collisionless sheath assumption holds while the thin sheathapproximation was considered to be marginally valid. The closeness of the Debye lengthto the probe diameter results in increased error in the electron number densitymeasurements. The data presented in Figure B.1 represent the worst-case conditions forthe insert plasma, as do those in Figure B.2 for the CK gap plasma. In the cathode-to-keeper gap, probe diameter and mean free paths were both 10 to 100 times larger than theDebye length, and the standard Langmuir probe analysis was considered valid.
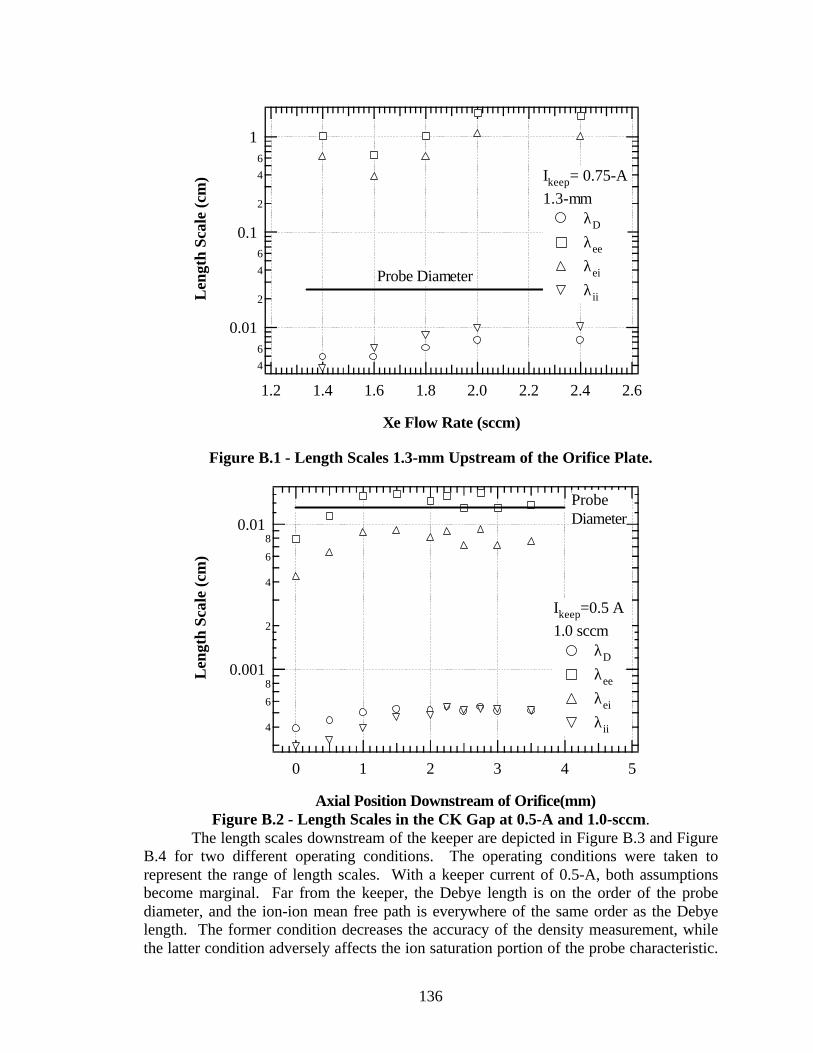
136
4
6
0.01
2
4
6
0.1
2
4
6
1
Len
gth
Scal
e (c
m)
2.62.42.22.01.81.61.41.2
Xe Flow Rate (sccm)
Ikeep= 0.75-A
1.3-mm λD
λee
λei
λii
Probe Diameter
Figure B.1 - Length Scales 1.3-mm Upstream of the Orifice Plate.
4
6
80.001
2
4
6
80.01
Len
gth
Scal
e (c
m)
543210
Axial Position Downstream of Orifice(mm)
Ikeep=0.5 A
1.0 sccm λD
λee
λei
λii
ProbeDiameter
Figure B.2 - Length Scales in the CK Gap at 0.5-A and 1.0-sccm.The length scales downstream of the keeper are depicted in Figure B.3 and Figure
B.4 for two different operating conditions. The operating conditions were taken torepresent the range of length scales. With a keeper current of 0.5-A, both assumptionsbecome marginal. Far from the keeper, the Debye length is on the order of the probediameter, and the ion-ion mean free path is everywhere of the same order as the Debyelength. The former condition decreases the accuracy of the density measurement, whilethe latter condition adversely affects the ion saturation portion of the probe characteristic.

137
As noted in Chapter 2, the electron saturation portion of the probe characteristic was usedbecause of the poor resolution in the ion saturation region. The poor resolution was duein part to the collisional ion sheath. Even at higher current, Figure B.4, the ion mean freepath is still on the order of the Debye length suggesting a collisional sheath for the ions.The thin sheath approximation holds for the 1.50-A case indicating that for all but the0.50-A case, the error induced by this assumption was negligible.
0.1
1
10
100
1000
Len
gth
Scal
e (c
m)
6050403020100-10
Axial Position Downstream of Keeper (mm)
Ikeep=0.50A
flow=2.4 sccm λD
λe,e
λe,i
λi,i
Probe Diameter
Figure B.3 - Length Scales Downstream of the Keeper at 0.5-A and 2.4-sccm.
0.01
0.1
1
Len
gth
Scal
e (c
m)
6050403020100-10
Axial Position Downstream of Keeper (mm)
Ikeep=1.50A
flow=2.4 sccm λD
λe,e
λe,i
λi,i
Probe Diameter
Figure B.4 - Length Scales Downstream of the Keeper at 1.50-A and 2.4 sccm.

138

139
APPENDIX C
DERIVATION OF THE EQUATIONS USED IN THE HOLLOW CATHODEMODEL
C.1 Orifice Plasma Model Collision Operators Derivation
Since the ionization fraction of the hollow cathode plasma is expected to be muchless than one, the primary energy exchange mechanisms for the electrons are Coulombcollisions with other electrons, and elastic and inelastic collisions with neutrals. Thecollisional processes between the electrons and neutrals are derived from the collisionrate equation:81
( ) ( ) ( )3 312 12 1 2 1 2 1 1 2 2N n n d v d v g gf v f vκ σ
∞ ∞
= ∫∫∫ ∫∫∫ (C.1)
Since we are considering neutrals and electrons, κ12 is set equal to one. The neutrals aretaken to be essentially motionless with respect to the electrons, and we can write
( ) ( )0o of v δ= (C.2)
eg v= (C.3)
which enables the following simplification of equation (C.1),
( ) ( )3eo e o e e e e eN n n d v v v f vσ
∞
= ∫∫∫ (C.4)
The neutral number density, no, is calculated based on the mass flow-rate. Next, the tripleintegral is split up using spherical coordinates.
( ) ( )2
2
0 0 0
sineo e o e e e e eN n n d d dv v v v f vρ π
ϕ θ θ σ∞
= ∫ ∫ ∫ (C.5)
This simplifies to
( ) ( )3
0
4eo e o e e e eN n n dv v v f vπ σ∞
= ∫ (C.6)
Equation (C.6) was numerically integrated with experimental data for the appropriatecollision cross-section for ionization, excitation, and elastic collisions with neutrals.Figure C.1 summarizes the experimental cross-sections used for xenon.68,71,72 The neutralnumber density used in Equation (C.6) when calculating the rate of ionization was basedon the flow-rate. In equilibrium, the rate of ionization must equal the rate of ion lossfrom the control volume, and ions leaving the control volume are replaced by soon-to-be-

140
ionized neutrals. In the case of excitation and elastic collisions, the number density ofneutrals is the difference between the density predicted by the flow-rate requirement andthe electron number density. The ionization collisions de-populate the neutral populationby an amount equal to the electron number density, and excitation and elastic collisionsoccur with the remaining neutral population.
10-21
10-20
10-19
Cro
ss-S
ecti
on (
cm2 )
6040200
Electron Energy (eV)
Elastic
Ionization
Total Excitation
Figure C.1 - Electron Impact Cross-Sections in Xenon.68,71,72
The ionization rate calculated using Equation (C.6) was multiplied by the orificevolume to determine the rate at which ions were created in the orifice, and this rate wasequated to the rate of ions lost from the volume. The ionization rate was also used todetermine the power consumed by electron impact ionization. Equation defines thepower consumed by ion production.
( )2ionizeionize i eo o oq e N r lϕ π= (C.7)
where the ionization potential, φi, for xenon is 12.12 eV. A similar expression was usedto evaluate the power consumed in neutral excitation.
( )2exciteexcite e eo o oq e N r lϕ π= (C.8)
where φe is an average number for the energy consumed in an excitation event, and wasset equal to 10-eV, unless stated otherwise. The elastic collisions with neutrals enter theenergy equation in the calculation of the Ohmic heating. From the results of Equation(C.6), the collision frequency is calculated
eoeo
e
N
nν = (C.9)
which is used to determine the resistivity in a partially ionized gas.

141
C.2 Orifice Pressure Model Derivation
Here, an expression is derived which includes elements from Salhi26 withconsideration of the effects of a finite length orifice. It should be noted that the massflow equations reported by Salhi26 contains errors which have been corrected in thepresent derivation. In order to determine the appropriate set of equations to use, theReynolds number is calculated:
ReD
uDρµ
= (C.10)
In order to determine the flow velocity, mass continuity in steady state, 1-D,incompressible flow is assumed,
0Dm
divuDt
= =r
(C.11)
hence
m Auρ=& (C.12)
where m& is the Xe flow-rate in kg/s, µ is the dynamic viscosity of Xe in kg/m-s, and D isthe insert diameter in m. For Xe in the temperature range expected in the hollow cathode,the viscosity ranges from 23.3 x 10⁻⁶ to 83.3 x 10⁻⁶ kg/m-s.87 This results in Reynoldsnumbers below 5 for all of the cases expected in the 3.2-mm diameter cathodes.
Ferreira and Delcroix5 derived a Poiseuille flow expression which uses a weightfactor to address the degree to which they were in continuum flow. The 3.2-mm hollowcathodes are fully in continuum flow internally (>100 Torr, 1.2-mm inner diameter),consequently, this region was modeled using continuum Poiseuille flow. The averagevelocity expression for Poiseuille flow is,
2
32
D dpu
dxµ = −
(C.13)
The pressure gradient was linearized
( ) op x pdp
dx x
−− = (C.14)
where po is a reference pressure in the cathode, and x indicates an upstream location. Atthe low flow velocity in the cathode, the pressure drop along the cathode tube isnegligible compared with the drop across the orifice. Consequently, the referencepressure must be in the orifice. The result when put back into continuity is an expressionfor the mass flow-rate as a function of the pressure p(x):
( ) ( )4
128 2o op p x p x pD M
mRT x
πµ
+ −=&
% (C.15)
from which we can solve for p(x):

142
( ) ( )0.5
24
1282 o
RTp x m x p
D M
µπ
= +
%& (C.16)
This leaves po and the temperature unknown. The continuity equation and a choked flowcondition at the exit of the orifice lead to the following relation:
2
4c o
RT Mp p m
M D RTπ γ= =
%&
%(C.17)
By equating pc with po, the pressure at the entrance of the orifice is determined for agiven gas temperature. To account for the pressure drop across the orifice entrance, anisothermal energy equation is used
( )211
2in x o o Lp p u Kρ= + + (C.18)
where pin is the pressure in the insert region, and KL=0.5 is the coefficient of loss at theorifice entrance.

143
APPENDIX D
HOLLOW CATHODE DESIGN CODE OPERATING MANUAL ANDDESCRIPTION
The hollow cathode model described in Chapter 4 and Appendix B wasimplemented in an Excel™ spreadsheet utilizing Visual Basic™ developed macros. Thecode presumes a working knowledge of Excel™ and macros. In addition, the modelshould be used primarily to evaluate how a given design will perform. The code is titledhollcat.xls, and can be found at the following website:
http://www.engin.umich.edu/dept/aero/spacelab/research/cathode/This appendix is intended to be a guide to the specific worksheets in the model
and to provide a basic description of the functions of the macros in the spreadsheet.
Inputs Worksheet
This worksheet, shown in Figure D.1, contains the cathode dimensions andmaterial properties which are used in the various sub-models. A drawing is included inthis worksheet to define the geometry. The worksheet also contains parameters usedspecifically in the axial heat transfer calculations. Physical constants are listed on thisworksheet. Finally the cathode flow-rate and current are entered in this worksheet.Cathode Construction UnitsTube Outer Diameter 3.18E-03 mTube Inner Diameter 2.67E-03 mTube Length 4.85E-02 mTube Therm Cond W/m-KTube Elec CondTube Emittance
Insert Outer Diameter 2.29E-03 mInsert Inner Diameter 1.17E-03 mInsert Length 1.27E-02 mInsert Work Function 2.10E+00 eVInsert Therm CondInsert Elec CondInsert Emittance
Orifice Length 6.86E-04 mOrifice Diameter 1.27E-04 mOrifice Plate Thickness mOrifice Chamfer Half-angle degreesOrifice Therm Cond W/m-K Physical Constants Cathode Operating ConditionsOrifice Elec Cond e 1.60E-19 C Ikeep 5.00E-01 AOrifice Emittance k 1.38E-23 J/K mdot 2.40E+00 sccm
pi 3.14E+00 Vanode 2.50E+01 VKeeper Length 1.02E-03 m me 9.11E-31 kgKeeper Diameter 2.29E-03 m mi 2.19E-25 kgCathode-Keeper Gap 1.00E-03 m Avogadro 6.02E+23 mol^-1Keeper Therm Cond W/m-K Gas Const 8.31E+00 J/K-molKeeper Emittance Loschmidt 2.69E+25 m^-3
gamma 1.67E+00THERMAL MODEL INPUT Kelvin/eV 1.16E+04 K/eVRad. Shield Length 1.00E-02 m Eps 8.85E-12 F/m^2Stanton Number 1.00E-02Input Gas Temperature 3.07E+02 KTube Entrance Temp. 3.07E+02 KSurroundings Temp. 3.00E+02 KFreestream Conv. Coeff. 3.90E-01 W/m^2-K
Li
Lhtr Lo
Lck
Lk
Ltip
Do
IDiODiIDt
ODt
Dh
Lka
Dk
Figure D.1 – The Inputs Worksheet

144
Orifice Worksheet
This worksheet, shown in Figure D.2, contains the equations used to solve for theplasma properties and power consumption in the orifice. This worksheet may be used ineither of two ways, as a stand-alone model or as part of the overall hollow cathode model.In the first case, the OrificeNeTe macro is used after the geometry and operatingconditions have been set-up in the Inputs worksheet. This macro uses Excel’s Goalseekfunction to solve for the electron temperature and number density for a consistentsolution. This solution technique has limited stability, and the initial values for electrontemperature and number density must be close to the final solution. Abrupt changes ingeometry, flow-rate, or current can cause the solution to diverge when there is in fact astable solution. A number of orifice geometries and cathode operating conditions can beevaluated automatically using the Results worksheet as will be described below. TheOrifice worksheet is also used to determine plasma properties in the orifice for use in theother parts of the hollow cathode model. The Orifice worksheet also calculates severalKnudsen numbers, the Debye ratio, and the number of ions in a Debye sphere to examinethe validity of the theory used.
Preliminary Calculations Value Units Development notesCollisional Analysis Value Units Orifice Outputs Value UnitsEquivalent Current 1.72E-01 A Elastic XS at Te 2.21E-13 m^2 Electron Temperature 2.00E+00 eVElectron Current Density 3.95E+07 A/m^2 Average ValueElectron Elastic mfp 1.39E-11 m Electron Number Density 4.60E+21 m^-3
Electron Elastic freq 4.98E+10 HzOrifice Temperature 1.12E-01 eV May not be accurate for gas temperature. See Ion, Neutral Temps worksheet.Electron-Ion Scat freq 8.24E+10 Hz NRL. Formula for Consistency. Chen uses 2e-6 for coefficient.Plasma Conductivity 9.77E+02 mho/m Chen's Defn.Orifice Temperature 1.30E+03 K Plasma Resistivity 1.02E-03 ohm-mInput Elec. Temp. 2.00E-01 eV Not necessarily equal to the insert electron temp due to double sheathScattering Events 6.94E+03 # Voltage (IR) 2.42E+01 V Calculated using the average electron current
Elastic n Scattering 2.61E+03 #Neutral Average Velocity 4.57E+02 m/s Ira uses kT/2piM, for kinetic efflux. Strictly valid for Kn>>1.Coulomb Scattering 4.32E+03 # Ions Out 1.06E-03 A Thermal efflux of ions. Neglects any exit sheath. Not calculated from ambipolar diffusion.Neutral Sonic Velocity 3.70E+02 m/s This velocity is used assuming a sonic condition at the orifice exit. Strictly valid only for Kn<<1.. Ion Loss 9.78E+17 #/s Bohm condition to walls and upstream orifice boundary. Thermal flux to exit.Ion Acoustic Velocity 1.21E+03 m/s Used for the Bohm Sheath condition. Ionization 9.78E+17 #/s Formulation with arbitrary contribution from excitations.Ion Average Velocity 4.57E+02 m/s Ion Cathode Current 2.55E-01 AIon Thermal Velocity 2.86E+02 m/s Ionization Fraction 2.00%Electron Thermal Velocity 5.93E+05 m/s SQRT(kT/m) Ohmic Heating 1.07E+01 W
Elec. Current In 3.73E-01 A Total current minus ion flux to cathode surfacesIonization Power Loss 1.91E+00 WNeutral Density 2.30E+23 m^-3 Based on sonic velocity for Kn<<1. Most cases only Kn<1.Elec. Current Slope 1.87E+02 A/m (Total e current out - total e current in)/orifice lengthRadiative Losses 7.84E+00 W
2.30E+23 Dummy Cell to hold formula when holding Nn constant.. Convective Losses 9.00E-01 WCoulomb Logarithm i-e 1.30E+01 NRL. Condition where Ti is not much smaller than Te.Ionization mfp 2.89E-08 m Power OUT 1.06E+01 WElectron Debye Length 1.54E-07 m NRL. Excitation mfp 2.88E-09 mCoulomb Logarithm i-i 4.97E+00 NRL. Single ion species and temperaturen-n mfp 2.26E-05 m Continuity -2.61E+14
i-i mfp 2.06E-07 m Energy 9.27E-03Double Sheath Voltage 3.62E-01 V h-h mfp 2.22E-05 m
Max e- Emission Current 4.42E-02 AOrifice Viscosity 7.57E-05 kg/m-s Curve fit to data up to 1500K. Fit as approximates physical dependency on temperature.Kn electron-elast 1.10E-07Bulk Neutral Velocity 1.36E+02 m/s Average from Poiseuille flow.Kn electron-ionize 2.27E-04 Orifice Pressure 5.67E+03 Pa sum nkT
Kn electron-excite 2.27E-05 Critical Pressure (sonic) 4.13E+03 PaOrifice Volume 8.69E-12 m^3 Kn n-n 1.78E-01Orifice Area 1.27E-08 m^2 Kn i-i 1.62E-03 Reynolds Number 1.15E+01
Kn h-h 1.74E-01Fraction of Ionize from Excite 0.00E+00 Used to examine the potential for this mechanism to influence ion production. Note that Kn excite usually < Kn ionize. e- orifice pressure 1.47E+03 PaAverage Excitation Energy 5.00E+00 eV e- insert pressure 1.47E+01 Pa
Hemispherical Emission Frac. 1.13E-01 Debye Ratio 1.22E-03 << 1?Cosine Emission Fraction 2.13E-01 Debye Sphere 7.08E+01 >> 1?
Figure D.2 - The Orifice Worksheet.
Insert Worksheet
The Insert worksheet, shown in Figure D.3, contains the equations for the insertmodel. The inputs are linked to the Inputs worksheet. The worksheet solves for the ioncontinuity, energy conservation, and current continuity by varying the electron

145
temperature, the electron number density, and the insert temperature, respectively. Theworksheet can be used either as a stand alone model, or as part of the combined orifice-insert model. In the stand alone case, the macro Insert is run after the inputs have beenconfigured. The model can also be solved in conjunction with the orifice model, and alarge number of solutions can be generated using the Results worksheet. The lattertechnique is recommended since the insert model relies on inputs from the orifice model.Preliminary Calculations Value Units Development notesCollisional Analysis Value Units Insert Outputs Value UnitsEquivalent Current 0.107 A Elastic XS for Te 1.26E-13 m^3/s Electron Temperature 1.32 eVInsert Work Function 2.00 eV Average ValueElastic XS for Beam 1.65E-10 m^3/s Electron Number Density 1.27E+20 m^-3Insert Temperature 0.128 eV Ionize XS for Te 3.50E-18 m^3/s Insert Temperature 1481 KPlasma Potential 8.00 V May not be accurate for gas temperature. See Ion, Neutral Temps worksheet.Ionize XS for Beam 6.26E-15 m^3/s NRL. Formula for Consistency. Chen uses 2e-6 for coefficient..
Excite XS for Te 9.49E-17 m^3/s Thermionic Efield Assist 3.14E+06 V/mNeutral Average Velocity 457 m/s Not necessarily equal to the insert electron temp due to double sheathExcite XS for Beam 1.58E-12 m^3/s Effective Work Function 1.933 eVNeutral Sonic Velocity 370 m/s Thermionic Current Density 3.52E+05 A/m^2Ion Acoustic Velocity 1258 m/s Elastic freq for Te 1.80E+10 Hz Thermionic Electron Density 1.31E+18 m^-3Ion Average Velocity 457 m/s Ionize freq for Te 5.02E+05 Hz Thermionic Current 0.7541 AIon Thermal Velocity 286 m/s Used for the Bohm Sheath conditionIonize freq for Beam 8.99E+08 Hz Collected Ion Current 0.2664 AElectron Thermal Velocity 4.82E+05 m/s Excite freq for Te 1.36E+07 Hz Emitted Ion Current 0.0013 AElectron Beam Velocity 1.19E+06 m/s Excite freq for Beam 2.26E+11 Hz Electron Backstreaming 1.98E-02 A
SQRT(kT/m)Electron-Ion Scat freq 2.35E+09 HzNeutral Density 1.43E+23 m^-3 Scattering Events 9.46E+03 # Ion Loss 3.29E+17 #/s
Elastic n Scattering 8.37E+03 # Ionization 3.29E+17 #/sCoulomb Logarithm i-e 7.18 Coulomb Scattering 1.09E+03 #Electron Debye Length 7.54E-07 m Plasma Conductivity 1.76E+02 mho/mCoulomb Logarithm i-i 6.14 NRL. Condition where Ti is not much smaller than Te.Elastic mfp for Te 1.89E-05 m Plasma Resistivity 5.70E-03 ohm-m
NRL.Elastic mfp for Beam 3.55E-08 m Voltage (IR) 1.87E+00 VDouble Sheath Voltage 0.526 V NRL. Single ion species and temperatureIonize mfp for Te 6.79E-01 m Ohmic Heating 1.26E+00 W
Ionize mfp for Beam 9.33E-04 m Thermionic Electrons 6.18E+00 WOrifice Viscosity 8.26E-05 kg/m-s Excite mfp for Te 2.50E-02 m Ion Backstreaming 6.62E-03 W
Excite mfp for Beam 3.71E-06 m Power IN 7.44E+00 Wn-n mfp 3.55E-05 m
Effective Insert Volume 6.26E-10 m^3 i-i mfp 7.30E-06 m Radiative Losses 4.62E+00 WEffective Emission Area 2.14E-06 m^2 h-h mfp 3.55E-05 m Backstreaming Electrons 5.23E-02 WInsert Ion Collection Area 4.28E-06 m^2 Current Carrying Electrons 2.12E+00 WEff. Primary Ionization Volume 6.01E-10 m^3 Kn electron-elast 1.62E-02 Ion Flux to Walls 6.51E-01 WEff. Primary Excitation Volume 1.58E-11 m^2 Used to examine the potential for this mechanism to influence ion production. Note that Kn excite usually < Kn ionizeKn electron-ionize 7.98E-01 Power OUT 7.44E+00 W
Kn electron-excite 3.17E-03Kn n-n 3.04E-02 Ion Continuity -2.75E+14 #
Fraction of Ionize from Excite 5.00% Kn i-i 6.25E-03 Energy 1.88E-03 WAverage Excitation Energy 5.00 eV Kn h-h 3.03E-02 Current Continuity 6.42E-04 A
Ionization Fraction 0.09%Debye Sphere 2.28E+02 << 1?Debye Ratio 1.55E+03 >> 1?
Figure D.3 - The Insert Worksheet
Results Worksheet
The Results worksheet, shown in Figure D.4, was created to facilitate theperformance evaluation of a number of different orifice geometries and operatingconditions. The first five columns contain geometry and operating condition inputs.Next, the fraction of excitation events which create ions and the average excitationenergy are included as free parameters. The insert region plasma potential and the insertwork function are also considered free parameters. These are color-coded gray toemphasize that variation of these numbers is a “gray” area. The defaults for the fractionof excitation events which create ions and the average excitation energy are zero percentand 10-eV, respectively. Next, are the various results from the orifice model. TheIterCatSets macro is used with this worksheet to run the orifice model over a number ofdata sets. When run, the macro asks the user the number of data sets to be iterated. TheResults worksheet must be active, and the orifice diameter cell of the first data set mustbe selected before running the IterCatSets macro. The macro runs OrificeNeTe andInsert after transferring the inputs to the appropriate cell, and the outputs are transferred

146
to the Results worksheet. When the solution fails to converge, the results are highlightedin bright, light-blue. The IterCatSets macro then goes to the next line where there is apositive number for the orifice diameter and repeats the process. The first row of theResults worksheet is frozen so that the data columns can be easily referred to regardlessof the position within the sheet.
Do (m) lo (m) Idis (A) mdot (sccm)Excitaion
Contribution (%)Uexcite
(eV) ne (m^-3) Te (eV) dni/dt (#/s) ions out (A) Ohmic (W) Ionize (W) Convect (W) Radiate (W) IR (V) Max Ie (A)
AR6, 5 percent from excitation, my model, diffuse orifice plasma1.27E-04 6.86E-04 0.50 0.60 5% 1.00E+01 2.18E+21 2.42 5.09E+17 5.05E-04 5.94 0.74 1.11 4.14 12.70 0.02101.27E-04 6.86E-04 0.50 0.90 5% 1.00E+01 2.47E+21 2.23 5.54E+17 5.71E-04 6.88 0.77 1.01 5.08 14.80 0.02371.27E-04 6.86E-04 0.50 1.20 5% 1.00E+01 2.70E+21 2.11 5.90E+17 6.25E-04 7.61 0.79 0.95 5.85 16.44 0.02601.27E-04 6.86E-04 0.50 1.50 5% 1.00E+01 2.89E+21 2.02 6.18E+17 6.69E-04 8.23 0.81 0.91 6.50 17.85 0.02781.27E-04 6.86E-04 0.50 1.80 5% 1.00E+01 3.05E+21 1.96 6.42E+17 7.06E-04 8.78 0.82 0.88 7.07 19.09 0.02931.27E-04 6.86E-04 0.50 2.10 5% 1.00E+01 3.19E+21 1.91 6.63E+17 7.39E-04 9.27 0.83 0.85 7.57 20.22 0.03071.27E-04 6.86E-04 0.50 2.40 5% 1.00E+01 3.32E+21 1.86 6.82E+17 7.68E-04 9.72 0.84 0.83 8.04 21.24 0.0319
1.27E-04 6.86E-04 0.75 0.60 5% 1.00E+011.27E-04 6.86E-04 0.75 0.90 5% 1.00E+011.27E-04 6.86E-04 0.75 1.20 5% 1.00E+011.27E-04 6.86E-04 0.75 1.50 5% 1.00E+011.27E-04 6.86E-04 0.75 1.80 5% 1.00E+011.27E-04 6.86E-04 0.75 2.10 5% 1.00E+011.27E-04 6.86E-04 0.75 2.40 5% 1.00E+01
Figure D.4 - The Results Worksheet with Completed and Uncompleted Data Sets.
Orifice X-Sec Dat and Insert X-sec Dat Worksheets
These worksheets contain the experimental collision cross section which areintegrated to provide the collision terms for the orifice and insert models. The referencesare listed on this worksheet, and the data have been converted to a function of speed foruse in the equations presented in Chapter 4. This worksheet supports the orifice andinsert models, and users need modify the data only when considering hollow cathodeoperation on gases other than xenon. In such a case, the electron-impact ionization,electron-impact total excitation, and the elastic electron-neutral collision cross-sectionsmust replace those for xenon on this sheet.
Pressure Worksheet
The Pressure worksheet, shown in Figure D.5, calculates the pressure in the insertregion of the hollow cathode based on some of the results of other sections of the model.The theory behind this mode is presented in Chapter. 4. Since the model consists ofstraightforward algebraic equations, the worksheet is stand-alone, independent of anymacros.
Preliminary Calculations PressuresMass Flow Rate 2.33E-07 kg/s Critical Sonic Pressure 4.08E+03 PaSpecific Gas Constant 6.31E+01 J/kg-K Orifice Entrance Pressure 1.81E+04 PaOrifice Viscosity 7.57E-05 kg-m/s Insert Region Pressure 1.92E+04 Pa
Insert Region Pressure (Torr) 1.45E+02 Torr
Figure D.5 - The Pressure Worksheet.

147
Ion, Neutral Temps Worksheet
The Ion, Neutral Temps worksheet, shown in Figure D.6, is used to calculate theradial temperature profiles of the ions and neutrals in the orifice. The differentialequations describing radial temperature variation are solved using a fourth order Runge-Kutta method. The centerline boundary condition of zero temperature gradient isspecified in the problem formulation. The Excel™ Solver analysis tool was used todetermine the centerline temperature which satisfied the boundary condition that the ionsand neutrals must equal the wall temperature at the wall. Typically this technique wasiterated upon until both the ions and neutrals matched the boundary conditions, and theconstraints for the solver were restrictive in order to maintain stability. A majordrawback of this method was that once the solver solution went unstable, a stablesolution was no longer possible. The results of this model could be used with the orificemodel to provide a more accurate estimate of the neutral density in the orifice.CONSTANTS: INPUTS: CALCULATED: Results:k = 1.38E-23 J/K Mi = 1.31E+02 amu Coul.Log = 2.27E+00 Ti (axis) = 1442 Kpi = 3.14E+00 ne avg = 1.00E+23 m^-3 Step Size = 7.94E-07 m Tn (axis) = 1457 Kme = 5.46E-04 amu Te = 2.16E+00 eV Coll. XS (i,n) = 1.39E-19 m^2h = 6.63E-34 J-s Ze = -1.00E+00 Charge Cond. Coeff. 8.90E-04 (J/K-m^2)*(J/K-kg)^0.5
Zi = 1.00E+00 Charge Coll. XS (e,n) = 6.16E-22 Ti, Tn Guessesne radial function Step nn = 1.15E+23 m^-3 Ti (axis) = 1442 KA = 1.61E-10 Ro = 6.35E-05 m 1.71E-02 Tn (axis) = 1457 KC2 = 8.28E-05 Steps = 8.00E+01 # dTwall_Neu = 1.00E-02 K (should be zero)
C3 = -8.86E-10 Twall in = 1.44E+03 K dTwall = -7.07E-03 K (should be zero)IONS Electron Neutral
Radius (m) ne(r) nn(r) teq (s) nu,in (Hz) Heat Heat k1z k2z k3z k4z z0.00E+00 5.67E+21 1.43E+23 1.02E-05 1.36E+07 -5.39E+09 -1.50E+09 -6.89E+09 -1.69E+08 -6.72E+09 -2.49E+08 0.00E+00
7.94E-07 5.67E+21 1.43E+23 1.02E-05 1.36E+07 -5.39E+09 -1.50E+09 -3.40E+09 -3.43E+09 -3.42E+09 -3.43E+09 -2.77E+031.59E-06 5.67E+21 1.43E+23 1.02E-05 1.36E+07 -5.39E+09 -1.50E+09 -3.43E+09 -3.44E+09 -3.44E+09 -3.44E+09 -5.49E+032.38E-06 5.67E+21 1.43E+23 1.02E-05 1.36E+07 -5.39E+09 -1.50E+09 -3.44E+09 -3.44E+09 -3.44E+09 -3.44E+09 -8.21E+033.18E-06 5.67E+21 1.43E+23 1.02E-05 1.36E+07 -5.39E+09 -1.49E+09 -3.44E+09 -3.44E+09 -3.44E+09 -3.44E+09 -1.09E+043.97E-06 5.67E+21 1.43E+23 1.02E-05 1.36E+07 -5.39E+09 -1.49E+09 -3.44E+09 -3.44E+09 -3.44E+09 -3.44E+09 -1.37E+044.76E-06 5.67E+21 1.43E+23 1.02E-05 1.36E+07 -5.39E+09 -1.49E+09 -3.44E+09 -3.44E+09 -3.44E+09 -3.44E+09 -1.64E+045.56E-06 5.67E+21 1.43E+23 1.02E-05 1.36E+07 -5.39E+09 -1.49E+09 -3.44E+09 -3.44E+09 -3.44E+09 -3.44E+09 -1.91E+046.35E-06 5.67E+21 1.43E+23 1.02E-05 1.36E+07 -5.39E+09 -1.48E+09 -3.43E+09 -3.43E+09 -3.43E+09 -3.43E+09 -2.19E+047.14E-06 5.67E+21 1.43E+23 1.02E-05 1.36E+07 -5.39E+09 -1.48E+09 -3.43E+09 -3.43E+09 -3.43E+09 -3.43E+09 -2.46E+047.94E-06 5.67E+21 1.43E+23 1.02E-05 1.36E+07 -5.39E+09 -1.48E+09 -3.43E+09 -3.43E+09 -3.43E+09 -3.43E+09 -2.73E+048.73E-06 5.67E+21 1.43E+23 1.02E-05 1.36E+07 -5.39E+09 -1.47E+09 -3.42E+09 -3.42E+09 -3.42E+09 -3.43E+09 -3.00E+049.53E-06 5.67E+21 1.43E+23 1.02E-05 1.36E+07 -5.39E+09 -1.47E+09 -3.42E+09 -3.42E+09 -3.42E+09 -3.42E+09 -3.27E+041.03E-05 5.67E+21 1.43E+23 1.02E-05 1.36E+07 -5.39E+09 -1.46E+09 -3.42E+09 -3.42E+09 -3.42E+09 -3.42E+09 -3.55E+041.11E-05 5.67E+21 1.43E+23 1.02E-05 1.36E+07 -5.39E+09 -1.45E+09 -3.41E+09 -3.41E+09 -3.41E+09 -3.41E+09 -3.82E+041.19E-05 5.67E+21 1.43E+23 1.02E-05 1.36E+07 -5.39E+09 -1.45E+09 -3.41E+09 -3.41E+09 -3.41E+09 -3.41E+09 -4.09E+041.27E-05 5.67E+21 1.43E+23 1.02E-05 1.36E+07 -5.39E+09 -1.44E+09 -3.40E+09 -3.40E+09 -3.40E+09 -3.40E+09 -4.36E+041.35E-05 5.67E+21 1.43E+23 1.02E-05 1.36E+07 -5.39E+09 -1.43E+09 -3.40E+09 -3.40E+09 -3.40E+09 -3.40E+09 -4.63E+041.43E-05 5.67E+21 1.43E+23 1.02E-05 1.36E+07 -5.39E+09 -1.43E+09 -3.39E+09 -3.39E+09 -3.39E+09 -3.39E+09 -4.90E+041.51E-05 5.67E+21 1.43E+23 1.02E-05 1.36E+07 -5.39E+09 -1.42E+09 -3.38E+09 -3.39E+09 -3.39E+09 -3.39E+09 -5.17E+041.59E-05 5.67E+21 1.43E+23 1.02E-05 1.36E+07 -5.39E+09 -1.41E+09 -3.38E+09 -3.38E+09 -3.38E+09 -3.38E+09 -5.44E+041.67E-05 5.67E+21 1.43E+23 1.02E-05 1.36E+07 -5.39E+09 -1.40E+09 -3.37E+09 -3.37E+09 -3.37E+09 -3.37E+09 -5.70E+041.75E-05 5.67E+21 1.43E+23 1.02E-05 1.36E+07 -5.39E+09 -1.39E+09 -3.36E+09 -3.37E+09 -3.37E+09 -3.37E+09 -5.97E+04
Code Progress
1.43E+03
1.44E+03
1.44E+03
1.45E+03
1.45E+03
1.46E+03
1.46E+03
0.0E+00
1.0E-05 2.0E-05 3.0E-05 4.0E-05 5.0E-05 6.0E-05 7.0E-05
Radius (m)
Tem
p (
K)
Ti
Tn
Figure D.6 - Partial Illustration of the Ion, Neutral Temps Worksheet.

148
BIBLIOGRAPHY
1 Rawlin, V. K. and Pawlik, E. V., “A Mercury Plasma-Bridge Neutralizer,” Journal ofSpacecraft and Rockets, Vol. 5, No. 7, July 1968, pp. 814-820.
2 Kerkow, H., Boubetra, D., and Holldack, K., “A Cold Cathode Ion Source with aMagnetic Hollow Cathode,” Nuclear Instruments and Methods in PhysicsResearch, B68, 1992, pp. 41-44.
3 Kirkici, H. and Bruno, D., “Operating Characteristics of a Segmented Hollow CathodeOver a Wide Pressure Range,” IEEE Transactions on Plasma Science, Vol. 23,No. 3, June 1995, pp. 229-234.
4 Fradkin, D. B., et al., “Experiments Using a 25-kW Hollow Cathode Lithium VaporMPD Arcjet,” AIAA Journal, Vol. 8, No. 5, May 1970, pp. 886-894.
5 Ferreira, C. M. and Delcroix, J. L., “Theory of the Hollow Cathode Arc,” Journal ofApplied Physics, Vol. 49, No. 4, April 1978, pp. 2380-2395.
6 Sarver-Verhey, T. R., “Destructive Evaluation of a Xenon Hollow Cathode After a28,000 Hour Life Test,” NASA/CR—1998-208678.
7 Forman, R. and Elmer, P., “Life Test Studies on Tungsten Impregnated Cathodes,”IEEE Transactions on Electron Devices, Vol. ED-27, No. 7, July 1980, pp. 1309-1310.
8 Shroff, A. M., Palluel, P., and Tonnerre, J. C., “Performance and Life Tests of VariousTypes of Impregnated Cathodes,” Applications of Surface Science, Vol. 8, 1981,pp. 36-49.
9 Patterson, M. J. and Rawlin, V. K., “Derated Ion Thruster Design Issues,” IEPC PaperNo. 91-150, AIDAA / AIAA / DGLR / JSASS 22nd International ElectricPropulsion Conference, Viareggio, Italy, Oct. 1991.
10 Polk, J. E., et al., “The Effect of Engine Wear on Performance in the NSTAR 8000Hour Ion Engine Endurance Test,” AIAA Paper No. 97-3387, 33rd AIAA / ASME/ SAE / ASEE Joint Propulsion Conference and Exhibit, Seattle, WA, July 1997.
11 Patterson, M. J., Grisnik, S. P., and Soulas, G. C., “Scaling of Ion thrusters to Low-power,” IEPC Paper No. 97-098, 25th International Electric PropulsionConference, Cleveland, OH, Aug. 1997.
12 Patterson, M. J. and Oleson, S. R., “Low-Power Ion Propulsion for Small Spacecraft,”AIAA Paper No. 97-3060, 33rd AIAA / ASME/ SAE / ASEE Joint PropulsionConference and Exhibit, Seattle, WA, July 1997.

149
13 Domonkos, M. T., et al, “Very Near-Field Plume Investigation of the D55,” AIAAPaper No. 97-3062, 33rd AIAA / ASME / SAE / ASEE Joint PropulsionConference and Exhibit, Seattle, WA, July 1997.
14 Garner, C. E., et al, “Experimental Evaluation of the Russian Anode Layer Thruster,”3rd Russian-German Conference on Electric Propulsion Engines and TheirTechnical Applications, Stuttgart, Germany, July 1994.
15 Garkusha, V. I., Lyapin, E. A., Semyenkin, A. V., and Tverdokhlebov, S. O., “AnodeLayer Thrusters, State-of-the-Art and Perspectives,” Proceedings of the 23rdInternational Electric Propulsion Conference, Vol. 3, 1993, pp. 2120-2124.
16 Jacobson, D. T. and Jankovsky, R. S., “Test Results of a 200-W Class Hall Thruster,”AIAA Paper No. 98-3792, 34th AIAA / ASME / SAE / ASEE Joint PropulsionConference, Cleveland, OH, July 1998.
17 Patterson, M. J., et al, “Space Station Cathode Design, Performance, and OperatingSpecifications,” IEPC Paper No. 97-170, 25th International Electric PropulsionConference, Cleveland, OH, Aug. 1997.
18 Sarver-Verhey, T. R., “Continuing Life Test of a Xenon Hollow Cathode for a SpacePlasma Contactor,” NASA Contractor Report 195401, Nov. 1994.
19 Robson, R. R., et al, “Plasma Contactor for the ISTP/Polar Spacecraft,” IEPC PaperNo. 91-064, AIDAA / AIAA / DGLR / JSASS 22nd International ElectricPropulsion Conference, Viareggio, Italy, Oct. 1991.
20 Soulas, G. C., “Multiple Hollow Cathode Wear Testing,” NASA Contractor Report195335, June 1994.
21 Ohlinger, W. and Rebestock, K.M., “Barium Calcium Aluminate ImpregnantMaterials: Interaction with Sea-Level Ambient Atmospheres and DecompositionBehaviors of Reaction Products,” AIAA Paper No. 94-3135, 30th AIAA / ASME/ SAE / ASEE Joint Propulsion Conference, Indianapolis, IN, June 1994.
22 Mirtich, M. J. and Kerslake, W. R., “Long Lifetime Hollow Cathodes for 30-cmMercury Ion Thrusters,” AIAA Paper 76-985, AIAA International ElectricPropulsion Conference, Key Biscayne, FL, Nov. 1976.
23 Rawlin, V. K., “A 13,000-Hour Test of a Mercury Hollow Cathode,” NASA TechnicalMemorandum X-2785, June 1973.
24 Mandell, M. J. and Katz I., “Theory of Hollow Cathode Operation in Spot and Plume-modes,” AIAA Paper No. 94-3134, 30th AIAA / ASME / SAE / ASEE JointPropulsion Conference, Indianapolis, IN, June 1994.

150
25 Siegfried, D. E., A Phenomenological Model for Orificed Hollow Cathodes, Ph. D.Dissertation, Colorado State University, 1983.
26 Salhi, A., Theoretical and Experimental Studies of Orificed, Hollow CathodeOperation, Ph. D. Dissertation, Ohio State University, 1993.
27 Capacci, M., Minucci, M., Severi, A., “Simple Numerical Model Describing DischargeParameters in Orificed Hollow Cathode Devices,” AIAA Paper No. 97-2791, 33rd
AIAA / ASME / SAE / ASEE Joint Propulsion Conference and Exhibit, Seattle,WA, July 1997.
28 Rittner, E. S., Rutledge, W. C., and Ahlert, R. H., “On the Mechanism of Operation ofthe Barium Aluminate Impregnated Cathode,” Journal of Applied Physics, Vol.28, No. 12, Dec. 1957, pp. 1468-1473.
29 Suitch, P. R., Thermochemical Reactions in Tungsten-Matrix Dispenser CathodesImpregnated with Various Barium-Calcium-Aluminates, Ph. D. Thesis, GeorgiaInstitute of Technology, 1987.
30 Crawford, F. W. and Cannara, A. B., “Structure of the Double Sheath in a Hot-CathodePlasma,” Journal of Applied Physics, Vol. 36, No. 10, Oct. 1965, pp. 3135-3141.
31 Prewitt, P. D. and Allen, J. E., “The Double Sheath Associated with a Hot Cathode,”Proceedings of the Royal Society of London A, Vol. 348, 1976, pp. 435-446.
32 Bohm, D., The Characteristics of Electrical Discharges in Magnetic Fields (EditorsGuthrie, A. and Wakerling, R. K.), Ch. 3, McGraw-Hill, New York, 1949.
33 Anders, A. and Kühn, M., “Characterization of a Low-Energy Constricted-PlasmaSource,” Review of Scientific Instruments, Vol. 69, No. 3, Mar. 1998, pp. 1340-1343.
34 Williams, J. D. and Wilbur, P. J., “Electron Emission from a Hollow Cathode-BasedPlasma Contactor,” Journal of Spacecraft and Rockets, Vol. 29, No. 6, Nov.-Dec.1992, pp. 820-829.
35 Byers, D. C. and Snyder, A., “Parametric Investigation of Mercury Hollow-CathodeNeutralizers,” Journal of Spacecraft and Rockets, Vol. 8, No. 2, Feb. 1971, pp.133-139.
36 Rawlin, V. K. and Kerslake, W. R., “Durability of the SERT II Hollow Cathodes andFuture Applications of Hollow Cathodes,” AIAA Paper No. 69-304, AIAA 7th
Electric Propulsion Conference, Williamsburg, VA, Mar. 1969.

151
37 Mirtich, M. J., “Investigation of Hollow Cathode Performance for 30-cm Thrusters,”NASA TM X-68298, 1973.
38 Goldstein, R., Pawlik, E. V., and Wen, L.-C., “Preliminary Investigations of IonThruster Cathodes,” JPL Technical Report 32-1536, 1971.
39 Hudson, W. R. and Weigand, A. J., “Hollow Cathodes with BaO Impregnated PorousTungsten Inserts and Tips,” NASA TM X-71417, 1973.
40 Fearn, D. G. and Philip, C. M., “An Investigation of Physical Processes in a HollowCathode Discharge,” AIAA Paper No. 72-416, AIAA 9th Electric PropulsionConference, Bethesda, MD, April 1972.
41 Rehn, L. A., “Argon Hollow Cathode,” NASA CR-135102, Nov. 1976.
42 Rehn, L. and Kaufman, H. R., “Correlation of Inert Gas Hollow CathodePerformance,” AIAA / DGLR 13th International Electric Propulsion Conference,San Diego, CA, April 1978.
43 Siegfried, D. E. and Wilbur, P. J., “A Model for Mercury Orificed Hollow Cathodes:Theory and Experiment,” AIAA Journal, Vol. 22, No. 10, Oct. 1984, pp. 1405-1412.
44 Rawlin, V. K., “Operation of the J-Series Thruster Using Inert Gas,” NASA TM-82977, Nov. 1982.
45 Salhi, A. and Turchi, P.J., “Scaling Relations for Design and Operation of OrificedHollow Cathodes,” AIAA Paper No. 94-3133, 30th AIAA Joint PropulsionConference, Indianapolis, IN, June 27-29, 1994.
46 Salhi, A. and Turchi, P.J., “Theoretical Modeling of Orificed, Hollow CathodeDischarges,” Proceedings of the 23rd International Electric PropulsionConference, Vol. 1, 1993, pp. 253-260.
47 Groh, K. H., Walther, S. E., and Loeb, H. W., “Recent Neutralizer Investigations atGiessen University,” AIAA Paper No. 76-989, AIAA International ElectricPropulsion Conference, Key Biscayne, FL, Nov. 1976.
48 Bianconi, M., Cirri, G. F., Matticari, G., and Severi, A., “Design Consolidation andSpace (Pre)Qualification of a Plasma Bridge Neutralizer for the RITA 10 IonThruster,” IEPC Paper 91-024, AIDAA / AIAA / DGLR / JSASS 22nd
International Electric Propulsion Conference, Viareggio, Italy, Oct. 1991.
49 Cirri, G. F., Matticari, G., Minucci, M., Noci, G., Severi, A., and Svelto, F., “PlasmaContactor Device Based on Hollow Cathode Technology for Spacecrafts

152
Charging Neutralization and Tethered System Applications: Review of ItalianNational Program,” IEPC Paper No. 93-041, AIAA / AIDAA / DGLR / JSASS23rd International Electric Propulsion Conference, Seattle, WA, Sept. 1993.
50 Kaufman, H. R., “Technology of Electron-Bombardment Ion Thrusters,” Advances inElectronics and Electron Physics, Vol. 36, 1974, pp. 265-373.
51 Babkin, G. V., et al, “Experimental Investigation of the Plasma in a MultichannelCathode”, Journal-of-Applied-Mechanics-and-Technical-Physics, Vol.17, No.6,Nov.-Dec. 1976, pp.767-770.
52 Delcroix, J. L., Minoo, H., and Trindade, A. R., “Gas Fed Multichannel HollowCathode Arcs,” The Review of Scientific Instruments, Vol. 40, No. 12, Dec. 1969.
53 DePauw, J. F., “30 cm Thruster Cathode Activation,” NASA Tech Ready InformationMemo No. 13, NASA Lewis Research Center, Dec. 1977.
54 McGee, T. D., Principles and Methods of Temperature Measurement, John Wiley &Sons, Inc., New York, 1988.
55 Yaws, S. L., Handbook of Thermal Conductivity, Volume 4: Inorganic Compoundsand Elements, Gulf Publishing Company, Houston, 1997.
56 Polk, J. E. and Goodfellow, K. D., “High Current Cathode Thermal Behavior, Part II:Experiments,” IEPC Paper No. 93-029, Proceedings of the 23rd InternationalElectric Propulsion Conference, Seattle, WA, Sept. 1993, pp. 293-303.
57 Sarver-Verhey, T. R., “Extended Test of a Xenon Hollow Cathode for a Space PlasmaContactor,” NASA Contractor Report 195402, Nov. 1994.
58 Ramalingam, M. L. and Jacobson, D. L., “An Accurate Method for the Determinationof Normal Spectral Emissivities of Refractory Alloys,” AIAA Paper No. 87-0321,AIAA 25th Aerospace Sciences Meeting, Reno, NV, Jan. 1987.
59 Schott, L. “Electric Probes,” in Plasma Diagnostics, Lochte-Holtgreven, W., Editor,American Institute of Physics, New York, 1995.
60 Williams, G., Smith, T., Domonkos, M., Shand, K., and Gallimore, A., “Laser InducedFluorescence Characterization of Ions Emitted from a Hollow Cathode,” AIAAPaper 99-2862, 35th AIAA / ASME / SAE / ASEE Joint Propulsion Conference,Los Angeles, CA, June 1999.
61 Druyvesteyn, M. J., Z. Physik, Vol. 64, pp. 781, 1930.
62Swift, J. D. and Schwar, M. J. R., Electrical Probes for Plasma Diagnostics, AmericanElsevier Publishing Company, Inc., New York, 1970.

153
63 Rundle, H. W., Clark, D. R., and Deckers, J. M., “Electron Energy DistributionFunctions in an O2 Glow Discharge,” Canadian Journal of Physics, Vol. 51, pp.144-148, 1973.
64 Sarver-Verhey, T. R., “28,000 Hour Xenon Hollow Cathode Life Test Results,” IEPCPaper No. 97-168, 25th International Electric Propulsion Conference, Cleveland,OH, Aug. 1997.
65 Domonkos, M. T., Marrese, C. M., Haas, J. M., and Gallimore, A. D., “Very Near-Field Plume Investigation of the D55,” AIAA Paper No. 97-306, 33rd AIAA /ASME / SAE / ASEE Joint Propulsion Conference, Seattle, WA, July 1997.
66 Jansen, S. W., “Microwave Diagnostics for Ion Thrusters,” IEPC Paper No. 93-237,23rd International Electric Propulsion Conference, Seattle, WA, Sept. 1993.
67 Van Noord, Thermal Modeling of an Ion Thruster, Ph. D. Dissertation, The Universityof Michigan, 1999.
68 Rapp, D. and Englander-Golden, P., “Total Cross Sections for Ionization andAttachment in Gases by Electron Impact. I. Positive Ionization,” The Journal ofChemical Physics, Vol. 43, No. 5, Sept. 1, 1965, pp. 1464-1479.
69 Chen, F. F., Introduction to Plasma Physics and Controlled Fusion, Volume 1: PlasmaPhysics, Plenum Press, New York, 1984.
70 Huba, J. D., editor, Naval Research Laboratory: Plasma Formulary, NRL/PU/6790-94-265, 1994.
71 Brode, R. R., “The Quantitative Study of the Collisions of Electrons with Atoms,”Reviews of Modern Physics, Vol. 5, Oct. 1933, pp. 257-279.
72 Hayashi, M., “Determination of Electron-Xenon Total Excitation Cross-Sections, fromThreshold to 100 eV, from Experimental Values of Townsend’s α,” Journal ofPhysics D: Applied Physics, Vol. 16, 1983, pp. 581-589.
73 Goodfellow, K. D., A Theoretical and Experimental Investigation of CathodeProcesses in Electric Thrusters, Ph. D. Dissertation, The University of SouthernCalifornia, 1996.
74 Striganov, A. R. and Sventitskii, N. S., Tables of Spectral Lines of Neutral and IonizedAtoms, IFI/Plenum Data Corporation, New York, 1968.
75 Siegel, R. and Perlmutter, M., “Convective and Radiant Heat Transfer for Flow of aTransparent Gas in a Tube with a Gray Wall,” International Journal of Heat MassTransfer, Vol. 5, 1962, pp. 639-660.

154
76 Siegel, R. and Keshock, G., “Wall Temperatures in a Tube with Forced Convection,Internal Radiation Exchange, and Axial Wall Heat Conduction,” NASA TechnicalNote D-2116, March 1964.
77 Jahn, R. G., Physics of Electric Propulsion, McGraw-Hill Book Company, New York,1968.
78 Griffiths, D. J., Introduction to Electrodynamics, Second Edition, Prentice-Hall, Inc.,New Jersey, 1989.
79 Spitzer, L., Physics of Fully Ionized Gases, John Wiley & Sons IntersciencePublishers, New York, 1962.
80 Mitchner, M. and Kruger, C. H., Partially Ionized Gases, John Wiley and Sons, NewYork, New York, 1973.
81 Gombosi, T., Gaskinetic Theory, Cambridge University Press, Cambridge, GreatBritain, 1994.
82 Lide, D. R., Editor-in-Chief, CRC Handbook of Physics and Chemistry: 73rd Edition,CRC Press, Boca Raton, 1992.
83 Touloukian, Y. S., Powell, R. W., Ho, C. Y., and Klemens, P. G., ThermophysicalProperties of Matter: Volume 1, Thermal Conductivity, Metallic Elements andAlloys, IFI / Plenum Publishers, New York, 1970.
84 “Rhenium Alloys, Technical Properties Data,” Rhenium Alloys, Inc. Document RA-1001, 1996.
85 Matsunami, N., et al., “Energy Dependence of the Ion-Induced Sputtering Yields ofMonatomic Solids,” Atomic Data and Nuclear Data Tables, Vol. 31, 1984, pp. 1-80.
86 Katz, Ira and Patterson, M. J., “Optimizing Plasma Contactors for ElectrodynamicTether Missions,” presented at Tether Technology Interchange, Sept. 9, 1997,Huntsville, AL.
87 Thermophysical Properties of Matter: Volume 11, Viscosity, IFI/Plenum Publishers,New York, 1970.

155