mattermark q1 2015 quarter midpoint analysis - u.s. venture capital activity
TRANSCRIPT

U.S. Venture Capital Q1 2015 Mid-Quarter Trend Analysis
February 22, 2015

© 2015 ALL RIGHTS RESERVED ● MATTERMARK TRACTION REPORT ● MATTERMARK.COM ● (415) 366-6587
This report provides a data-driven exploration of the United States startup funding environment over the past year. The resources that flow into startups each year are a calculated risk on the part of investors, founders, employees, service-providers and everyone who stands to benefit from the proliferation of new product, better services, and saved time and money.
Understanding how businesses are created, funded, grown and ultimately rewarded with sustainability or an exit helps inform the conversations and actions for the coming years, and it is our hope you will read this report and combine it with your special knowledge of your industry, region, role and community as you charge forward into the New Year.
Sincerely,
Danielle Morrill, CEO & Cofounder of Mattermark
Acknowledgements
This analysis would not be possible without a team effort. Thank you to the Mattermark analysts, researchers, software engineers and designers who made this report possible: Sarah Catanzaro, Bryan Chang, Clare Corthell, Avi Eisenberger, Nick Frost, Kevin Liu, Josh Luxton, Samiur Rahman, and Tristan Williams and many more.
MATTERMARK Q1 2015 MID-QUARTER ANALYSIS
2
Introduction

© 2015 ALL RIGHTS RESERVED ● MATTERMARK TRACTION REPORT ● MATTERMARK.COM ● (415) 366-6587 3
Table of Contents
2 3 5 9
13 16 18 22
MATTERMARK Q1 2015 MID-QUARTER ANALYSIS
INTRODUCTION
METHODOLOGY
DEAL VOLUMES
CAPITAL DISTRIBUTION
CAPITAL CONCENTRATION
MEGA “PRIVATE IPO” ROUNDS
RISING VALUATIONS
ECOSYSTEM IMPACT: NEW YORK
Disclaimer
This information has been prepared by Mattermark Inc. solely for informational purposes. It is not, and should not be regarded as, investment advice or as a recommendation regarding any particular security or course of action. Opinions expressed herein are current opinions as of the date appearing in this material only and are subject to change without notice.
This information is provided with the understanding that with respect to the material provided herein, you will make your own independent decision with respect to any course of action based on your own judgment, and that you are capable of understanding and assessing the merits of a course of action.
Neither the information, nor any opinion contained herein, constitute a solicitation or offer by Mattermark, Inc. to buy or sell any securities, futures, options or other financial instruments or provide any investment advice or service. Mattermark, Inc. does not purport to, and does not, in any fashion, provide broker/dealer, consulting or any related services. Mattermark, Inc. shall not have any liability for any damages of any kind whatsoever relating to this material. By accepting this material, you acknowledge, understand and accept the foregoing.

© 2015 ALL RIGHTS RESERVED ● MATTERMARK TRACTION REPORT ● MATTERMARK.COM ● (415) 366-6587
Time Period
For this report we compared Q1 2014 and the 2014 calendar year to Q1 2015 in progress. For all “pace” metrics, we have taken the current deal volumes or amounts invested between January 1st and February 15th and assumed the same pace for the remainder of the quarter.
Funding Rounds
For venture rounds, we only included deals in which the amount of funding raised was disclosed.
“Late” stage rounds include all rounds Series D and beyond (traditionally the 4th round of venture funding).
“New York” includes the New York metro region (for example Jet is based in New Jersey according to our data set, but was still included in the geographical analysis).
Data Sources
Mattermark uses a broad range of sources to present the most complete picture possible of the startup ecosystem. In addition to extensive primary source research sourced specifically for this report, Mattermark uses publicly-available data from Crunchbase (www.crunchbase.com), AngelList (www.angel.co), NASDAQ (www.nasdaq.com), the United States Securities and Exchange Commission (www.sec.gov), The White House Office of Management & Budget, and source relationships with thousands of investors, community leaders and startup founders.
MATTERMARK Q1 2015 MID-QUARTER ANALYSIS
4
Methodology

DEAL VOLUME
MATTERMARK COPYRIGHT 2015, ALL RIGHT RESERVED — WWW.MATTERMARK.COM

MATTERMARK COPYRIGHT 2015, ALL RIGHT RESERVED — WWW.MATTERMARK.COM
Num
ber o
f Fun
ding
Eve
nts
0
20
40
60
80
100
120
Q1 2015
Seed Series A Series B Series C Late Other
32
78
37
5974
109
U.S. STARTUP FUNDING JAN. 1 - FEB. 15, 2015366 COMPANIES FUNDED

MATTERMARK COPYRIGHT 2015, ALL RIGHT RESERVED — WWW.MATTERMARK.COM
Num
ber o
f Fun
ding
Eve
nts
0
50
100
150
200
250
300
350
400
Seed Series A Series B Series C Late Other
Q1 2014 Q1 2015
3778
375974
108 124
6738
74102
359
U.S. STARTUP FUNDING JAN. 1 - FEB. 15, 2015Q1 ’15 MIDPOINT VS. ’14 MIDPOINT

Q1 2014
Other16%
Late Stage9%
Series C5%
Series B10%
Series A13%
Seed47%
Q1 2015
Other9%
Late Stage20%
Series C9%
Series B15%
Series A19%
Seed27%
MATTERMARK COPYRIGHT 2015, ALL RIGHT RESERVED — WWW.MATTERMARK.COM
U.S. STARTUP FUNDING JAN. 1 - FEB. 15, 2015DEAL VOLUME BY STAGE

CAPITAL INVESTED
MATTERMARK COPYRIGHT 2015, ALL RIGHT RESERVED — WWW.MATTERMARK.COM

U.S. STARTUP FUNDING JAN. 1 - FEB. 15, 2015$9.7B DOLLARS INVESTED
MATTERMARK COPYRIGHT 2015, ALL RIGHT RESERVED — WWW.MATTERMARK.COM
Capi
tal In
veste
d (in
Billi
ons o
f Dol
lars U
SD)
$1
$2
$3
$3
$4
$5
$6
Investment Stage
Seed Series A Series B Series C Late Other
$1.13
$5.18
$1.16$1.26$0.76$0.20

MATTERMARK COPYRIGHT 2015, ALL RIGHT RESERVED — WWW.MATTERMARK.COM
Dol
lars I
nves
ted
(in B
illion
s USD
)
$0.00
$1.00
$2.00
$3.00
$4.00
$5.00
$6.00
Seed Series A Series B Series C Late Other
Q1 2014 Q1 2015
$1.17
$5.18
$1.16$1.26$0.76
$0.20$0.63
$2.00
$1.12$1.06$0.61
$0.21
U.S. STARTUP FUNDING JAN. 1 - FEB. 15, 2015Q1 ’15 MIDPOINT VS. ’14 MIDPOINT

MATTERMARK COPYRIGHT 2015, ALL RIGHT RESERVED — WWW.MATTERMARK.COM
U.S. STARTUP FUNDING JAN. 1 - FEB. 15, 2015CAPITAL ALLOCATED BY STAGE
Q1 2014
Other11%
Late Stage35%
Series C20%
Series B19%
Series A11%
Seed4%
Q1 2015
Other12%
Late Stage53%
Series C12%
Series B13%
Series A8%
Seed2%

TREND #1: GREATER CAPITAL CONCENTRATION IN SEED DEALS
60% YEAR-OVER-YEAR DECLINE IN DEAL VOLUME
25% YEAR-OVER-YEAR INCREASE IN CAPITAL DEPLOYMENT
MATTERMARK COPYRIGHT 2015, ALL RIGHT RESERVED — WWW.MATTERMARK.COM

Roun
d Siz
e (in
Milli
ons o
f Dol
lars U
SD)
$0.00
$0.50
$1.00
$1.50
$2.00
$2.50
Num
ber o
f Rou
nds
0
300
600
900
1200
1500
Q1 2014 Q2 2014 Q3 2014 Q4 2014 Q1 2015*
Average Seed Deal Size Median Seed Deal Size Seed Deal Volume
216202
456421542
U.S. SEED DEAL VOLUME VS. ROUND SIZE * Q1 2015 BASED ON PACE AS OF FEB. 15, 2015
MATTERMARK COPYRIGHT 2015, ALL RIGHT RESERVED — WWW.MATTERMARK.COM

Roun
d Siz
e (in
Milli
ons o
f Dol
lars U
SD)
$0.00
$0.50
$1.00
$1.50
$2.00
$2.50
Tota
l See
d Ca
pita
l Dep
loye
d (in
Milli
ons U
SD)
0
100
200
300
400
500
Q1 2014 Q2 2014 Q3 2014 Q4 2014 Q1 2015*
Average Seed Deal Size Median Seed Deal Size Seed Deal Volume
$397.6$342.6$348.7
$302.7$320.5
U.S. SEED CAPITAL VS. ROUND SIZE * Q1 2015 BASED ON PACE AS OF FEB. 15, 2015
MATTERMARK COPYRIGHT 2015, ALL RIGHT RESERVED — WWW.MATTERMARK.COM

TREND #2: LATE STAGE MEGA “PRIVATE IPO”
ROUNDS
MATTERMARK COPYRIGHT 2015, ALL RIGHT RESERVED — WWW.MATTERMARK.COM
MATTERMARK COPYRIGHT 2015, ALL RIGHT RESERVED — WWW.MATTERMARK.COM
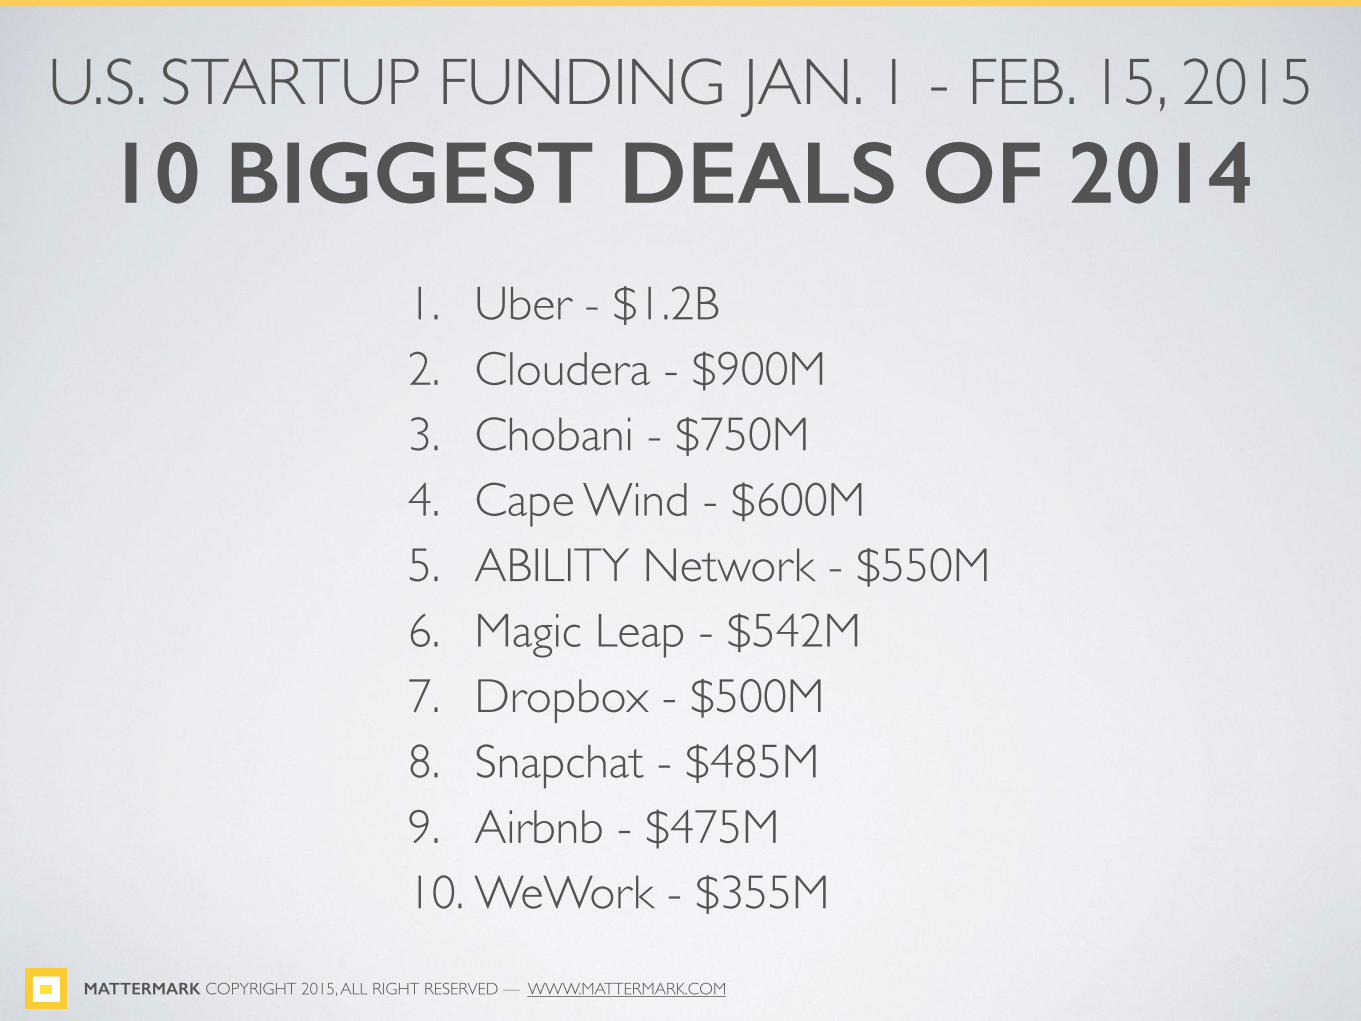
U.S. STARTUP FUNDING JAN. 1 - FEB. 15, 201510 BIGGEST DEALS OF 2014
1. Uber - $1.2B2. Cloudera - $900M3. Chobani - $750M4. Cape Wind - $600M5. ABILITY Network - $550M6. Magic Leap - $542M7. Dropbox - $500M8. Snapchat - $485M9. Airbnb - $475M10. WeWork - $355M

Num
ber o
f Rou
nds
0
18
36
54
72
90
Q1 2014 Q2 2014 Q3 2014 Q4 2014 Q1 2015*
3448
20
30
20
423934
4639
Deals $50M - $100M Deals > $100M
MEGA “PRIVATE IPO” DEAL VOLUME * Q1 2015 BASED ON PACE AS OF FEB. 15, 2015
MATTERMARK COPYRIGHT 2015, ALL RIGHT RESERVED — WWW.MATTERMARK.COM

TREND #3: VC ROUND SIZES (AND VALUATIONS) ON THE RISE AS DEAL VOLUMES CONTINUE TO DECLINE
MATTERMARK COPYRIGHT 2015, ALL RIGHT RESERVED — WWW.MATTERMARK.COM
YoY Change in Average Round
Size
YoY Change in Total Capital
YoY Change in Deal Volume
Pre Series A +142% 25% -60%
Series A +52% +24% -19%
Series B +44% +19% +7%
Series C +16% +3% +14%
Late Stage +19% +159% +16%

Roun
d Siz
e (in
Milli
ons o
f Dol
lars U
SD)
$0
$1
$3
$4
$6
$7
$8
$10
$11
Num
ber o
f Rou
nds
0
100
200
300
400
500
Q1 2014 Q2 2014 Q3 2014 Q4 2014 Q1 2015*
Average Round Size Median Round Size Series A Deal Volume
170176190232210
SERIES A DEAL VOLUME VS. ROUND SIZE * Q1 2015 BASED ON PACE AS OF FEB. 15, 2015
MATTERMARK COPYRIGHT 2015, ALL RIGHT RESERVED — WWW.MATTERMARK.COM

Roun
d Siz
e (in
Milli
ons o
f Dol
lars U
SD)
$0
$4
$8
$11
$15
$19
$23
$26
$30
Num
ber o
f Rou
nds
0
100
200
300
400
500
Q1 2014 Q2 2014 Q3 2014 Q4 2014 Q1 2015*
Average Round Size Median Round Size Series B Deal Volume
14097
127132131
SERIES B DEAL VOLUME VS. ROUND SIZE * Q1 2015 BASED ON PACE AS OF FEB. 15, 2015
MATTERMARK COPYRIGHT 2015, ALL RIGHT RESERVED — WWW.MATTERMARK.COM

Roun
d Siz
e (in
Milli
ons o
f Dol
lars U
SD)
$0
$4
$8
$12
$16
$20
$24
$28
$32
Num
ber o
f Rou
nds
0
100
200
300
400
500
Q1 2014 Q2 2014 Q3 2014 Q4 2014 Q1 2015*
Average Round Size Median Round Size Series C Deal Volume
8059597770
SERIES C DEAL VOLUME VS. ROUND SIZE * Q1 2015 BASED ON PACE AS OF FEB. 15, 2015
MATTERMARK COPYRIGHT 2015, ALL RIGHT RESERVED — WWW.MATTERMARK.COM
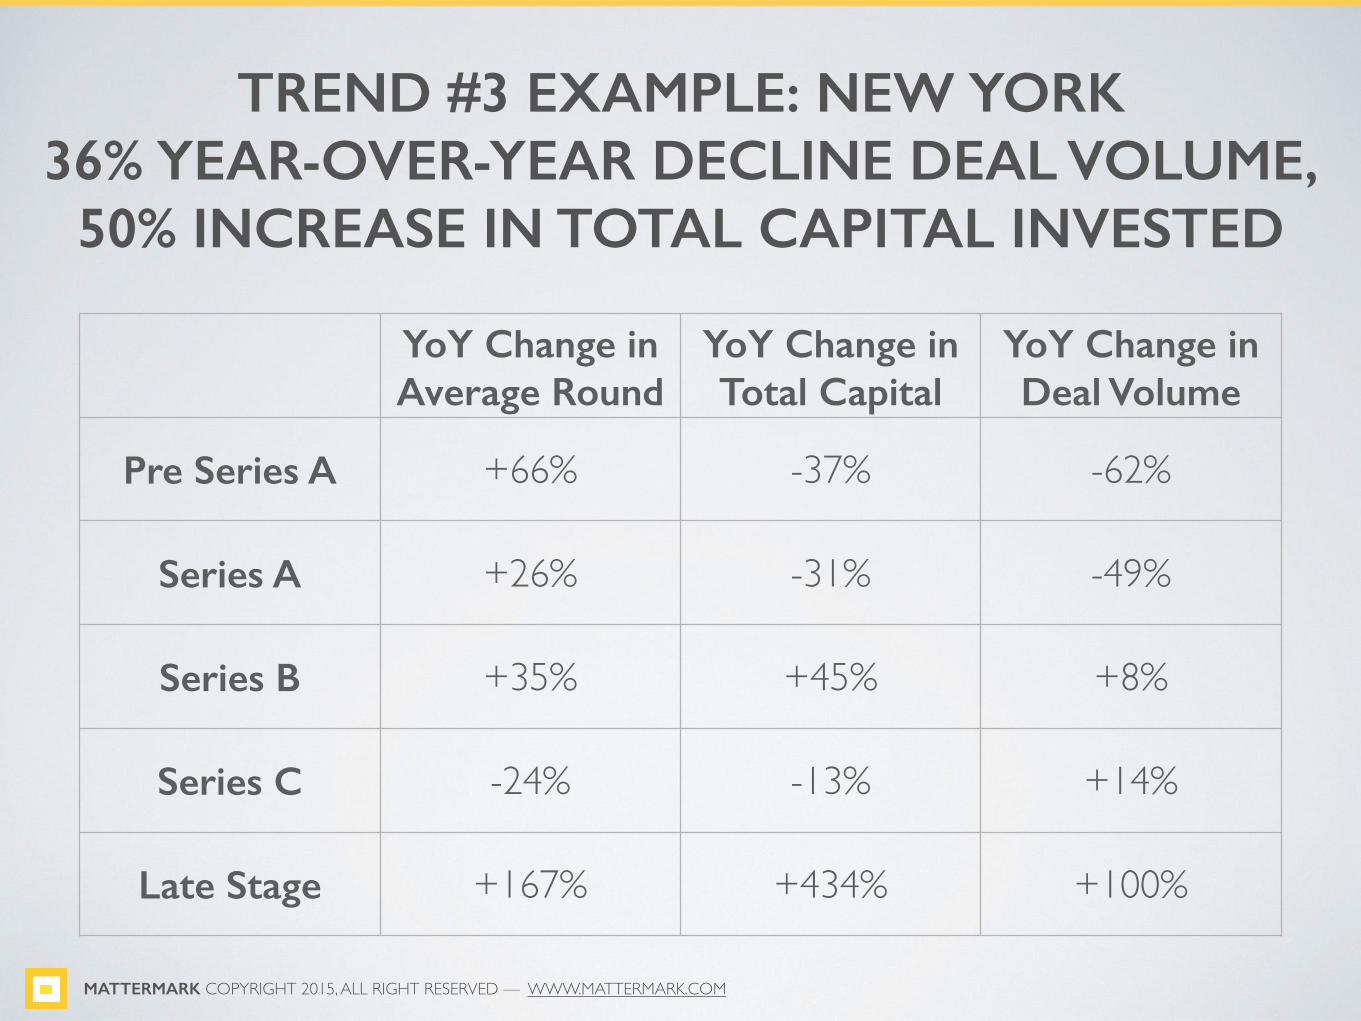
TREND #3 EXAMPLE: NEW YORK 36% YEAR-OVER-YEAR DECLINE DEAL VOLUME,
50% INCREASE IN TOTAL CAPITAL INVESTED
MATTERMARK COPYRIGHT 2015, ALL RIGHT RESERVED — WWW.MATTERMARK.COM
YoY Change in Average Round
Size
YoY Change in Total Capital
YoY Change in Deal Volume
Pre Series A +66% -37% -62%
Series A +26% -31% -49%
Series B +35% +45% +8%
Series C -24% -13% +14%
Late Stage +167% +434% +100%

MATTERMARK COPYRIGHT 2015, ALL RIGHT RESERVED — WWW.MATTERMARK.COM
Dol
lars I
nves
ted
(in M
Illion
s USD
)
$0
$300
$600
$900
$1,200
$1,500
$1,800
Q1 2014 Q2 2014 Q3 2014 Q4 2014 Q1 2015 PROJECTION*
Seed Series A Series B Series C Late Other
NEW YORK CAPITAL ALLOCATION * Q1 2015 BASED ON PACE AS OF FEB. 15, 2015

MATTERMARK COPYRIGHT 2015, ALL RIGHT RESERVED — WWW.MATTERMARK.COM
Dol
lars I
nves
ted
(in M
Illion
s USD
)
$0
$200
$400
$600
$800
$1,000
$1,200
Q1 2014 Q2 2014 Q3 2014 Q4 2014 Q1 2015PROJECTION*
Seed Series A Series B Series C Late Other
NEW YORK CAPITAL ALLOCATION * Q1 2015 BASED ON PACE AS OF FEB. 15, 2015
- WeWork- Harry’s- Rent the Runway
- VICE- AppNexus
- CommonBond- HelloFresh- Taboola

MATTERMARK COPYRIGHT 2015, ALL RIGHT RESERVED — WWW.MATTERMARK.COM
Num
ber o
f Inv
estm
ent D
eals
0
20
40
60
80
100
120
140
160
Q1 2014 Q2 2014 Q3 2014 Q4 2014 Q1 2015 PROJECTION*
Seed Series A Series B Series C Late Other
NEW YORK DEAL VOLUME * Q1 2015 BASED ON PACE AS OF FEB. 15, 2015

MATTERMARK COPYRIGHT 2015, ALL RIGHT RESERVED — WWW.MATTERMARK.COM
Num
ber o
f Dea
ls
0
10
20
30
40
50
60
70
Q1 2014 Q2 2014 Q3 2014 Q4 2014 Q1 2015PROJECTION*
Seed Series A Series B Series C Late Other
12121111
26
20
9107
108
57
117
14
5
1719
1316
22
2931
29
2427
58
46
63
NEW YORK DEAL VOLUME * Q1 2015 BASED ON PACE AS OF FEB. 15, 2015

MATTERMARK COPYRIGHT 2015, ALL RIGHT RESERVED — WWW.MATTERMARK.COM
Dol
lars I
nves
ted
(in M
Illion
s USD
)
$0
$20
$40
$60
$80
$100
$120
Q1 2014 Q2 2014 Q3 2014 Q4 2014 Q1 2015PROJECTION*
Seed Series A Series B Series C Late Other
NEW YORK AVERAGE ROUND SIZES * Q1 2015 BASED ON PACE AS OF FEB. 15, 2015

MATTERMARK COPYRIGHT 2015, ALL RIGHT RESERVED — WWW.MATTERMARK.COM
Dol
lars I
nves
ted
(in M
Illion
s USD
)
$0
$5
$10
$15
$20
$25
$30
Q1 2014 Q2 2014 Q3 2014 Q4 2014 Q1 2015PROJECTION*
Seed Series A Series B Series C
NEW YORK AVERAGE ROUND SIZES * Q1 2015 BASED ON PACE AS OF FEB. 15, 2015

This analysis was created using Mattermark Professional.
Our deal intelligence tools are trusted by the world’s leading venture capital firms, investment banks, hedge funds and sales organizations
to provide data on more than one million private companies.
Sign up for your free 14-day trial todaywww.mattermark.com