matrix effects in membrane introduction mass spectrometry ... alyte permeation rate and its...
TRANSCRIPT

Matrix Effects in Membrane Introduction Mass Spectrometry I. Effect of Po lye thy lene Glycol) on Permeation Rate of 1-Octanol
through Silicone Rubber Membrane
I. JELÍNEK
Department of Analytical Chemistry, Faculty of Natural Sciences,
Charles University, CZ-128 40 Prague
Received 29 September 1995
Simple flow-through capillary membrane interface, suitable for direct measurement of organic compounds in aqueous samples, has been built and its function verified on aqueous solution of 1-octanol. Optimization of experimental conditions involving the adjustment of ion source and inlet transfer line temperatures and the modification of sample solution flow rate resulted in short response time (lower than 1 min), high stability of measured signal and high sensitivity toward 1-octanol. Possible matrix effects of poly (ethylene glycol) (PEG) on the permeation rate of 1-octanol were studied. Both adsorption of PEG on the inner membrane surface and formation of PEG—octanol complexes were recognized as important factors decreasing the measured signal. An attempt to estimate the PEG—octanol binding ratio from available experimental data was made.
Membrane introduction mass spectrometry (MIMS) is increasingly popular analytical technique suitable for direct qualitative and quantitative analysis of gases and volatile organics in solutions and gaseous phases [1]. MIMS proved to be an effective analytical tool in a wide variety of practical applications involving environmental studies [2—5], reaction monitoring [6—9] and in some special clinical analytical studies [10— 12]. An introduction of the sample via membrane inlet system into the mass spectrometer is a result of pervaporation [13], complex transport process of the analyte through a polymer membrane separating the atmospheric pressure sampling region from the evacuated ion source block. So far great attention has been paid to the development of sufficiently robust and reliable membrane introduction system with good mechanical stability and reliability under the extreme pressure conditions. Employing the principle of direct pervaporation into the ion source two innovated configurations of flow-through systems were designed and described in the literature. Planar arrangement [14, 15] in which the membrane takes the form of a flat sheet mounted in close proximity of the ion source, meets the requirements of fast and efficient transfer of permeant molecules directly into the ionization region. Alternative developments have focussed on the use of hollow fibre (capillary) membranes making it possible to construct interfaces with improved mechanical stability and reliability [16—18]. The choice of membrane material fundamentally affects the application field of MIMS. Teflon and poly (ethylene) are commonly used for gas monitoring [19—21], silicone-based polymers
proved to be suitable for the analysis of organics in aqueous solutions [22]. The use of poly (propylene), Lexan, and vinyl acetate copolymer membranes was reported elsewhere, each material exhibits its characteristic selectivity and detection limits toward different types of analytes.
Prom the theoretical point of view pervaporation is the complex membrane separation process involving sorption, diffusion, and evaporation step [23]. The first two steps depend mainly on the molecular properties of the analyte, membrane material, and used experimental conditions, such as temperature and flow rate of the analyzed sample. Matrix effects of constituents accompanying the analyte have been recognized as important factors affecting primarily the process of sorption. Attention has been paid to the study of the analyte permeation rate and its ionization efficiency in the presence of other pervaporating component [24]. The aim of this contribution is to investigate another potentially important matrix effect - pervaporation of the analyte in the presence of high-molecular nonper-vaporating constituent which is supposed a) to change membrane properties due to irreversible sorption on its surface and b) decrease the concentration of the free analyte in solution by formation of nonvolatile complexes. High-molecular mass poly (ethylene glycol) (Mr « 8000) and 1-octanol were chosen as model compounds for the preparation of aqueous test solutes.
E X P E R I M E N T A L
1-Octanol (99 %), methanol (99.9 % HPLC grade),
Chem. Papers 50 (3) 131—137 (1996) 131

and polyethylene glycol) (PEG) (Afr « 8000) were purchased from Aldrich (Steinheim, Germany). Dode-cylethyldimethylammonium bromide (DEDAB) (> 98 %) was purchased from Fluka AG (Buchs, Germany).
Methanolic stock solution of 1-octanol (5 x 10~3
mol d m - 3 ) , aqueous stock solution of PEG (5 x 10" 5 mol d m " 3 ) , and DED AB (2 x 10" 2 mol d m " 3 ) were prepared by dissolving the corresponding compounds in methanol or deionized water (Mili-Q, Milli-pore s.a., Molsheim, France), respectively. All test solutions used in experiments were prepared by diluting or, alternatively, mixing and diluting the corresponding stock solutions with deionized water.
The mass spectrometer used in this study was an HP-5980A quadrupole instrument (Hewlett—Packard, Palo Alto, California, USA) with a unit resolution and 1—1000 mass range. Data acquisition was controlled with DG-10 data station (Data General Corp., West-boro, Massachusetts, USA) with implemented Incos operational system. The mass spectrometer was operated in a total ion mode (mass range m/z 35—250) or SIM mode (m/z 84) using electron impact ionization with standard beam energy 70 eV.
Capillary M e m b r a n e Interface
The experimental design of used simple interface, shown in Fig. 1, originates from the construction schemes described in the literature [16].
Capillary membrane is Silastic medical grade tubing (o.d. = 0.63 mm, i.d. = 0.3 mm) from Dow Corning Corp. (Dow Chemical Company, Midland, Texas, USA). The membrane material is poly (dimethyl viny 1-siloxane) elastomer. Approximately 20 mm long piece of membrane tubing was mounted on inlet and outlet fused silica capillaries (o.d./i.d. = 370 /xm/250 /лп, length 60 mm) and supported with a spring made of tungsten wire (diameter 0.1 mm). The space between the inserted membrane tubing, fused silica and stainless steel capillaries (o.d. = 1.5 mm, i.d. = 0.50 mm ) was sealed with N-1000 silicone rubber sealant (Syn-thesia, Kolín, Czech Republic). The joints between the membrane and fused silica capillaries were enveloped with shrinkable Teflon tubing. The length of inlet and outlet tubings in the vacuum part was adjusted to keep the end of the membrane loop at a distance 3 mm from the entrance slit of ion source. The system was equipped with a simple heating and temperature control element mounted on inlet stainless steel tubing.
The interface was permanently attached to the direct probe inlet flange. The whole arrangement proved to be sufficiently gas-tight and made it possible to attain normal operating pressure of 1.3 x 10~4 Pa in ion source.
Continuous flow of the liquid through the interface with the possibility to inject defined volume of the
Ion source block
Tungsten spring Silicone rubber support tubing
I. JELÍNEK
J High vacuum Fused silica
capillary
Atmospheric pressure
Shrinkable teflon * tubing
Stainless steel ^tubing
Vespel ferrules i
Thermocouple
Stainless steel stopper
Waste B í j y * ^
Flow in
F ig . 1. Capillary membrane interface.
MS Membrane interface
Waste Щ X ^ Sample *J П
loop 250 ц1
(LiLC pump 1 (цЬС pump 2)
F i g . 2. Experimental arrangement of the MIMS system.
sample solution was achieved with ISCO /xLC chromatographic pump (Isco, Lincoln, Nebraska, USA) connected to Rheodyne 7125 six-port injection valve equipped with 250 mm 3 sample loop (Fig. 2). For the experiments with DED AB rinsing solution the second /xLC pump was attached to the system.
132 Chem. Papers 50 (3) 131 —137 (1996)
SILICONE RUBBER MEMBRANE
5.0
2.5
0 . 0 9 10
Fig . 3. Selected ion current response (m/z 84) to injected 250 m m 3 of 1-octanol solution (c = 5 X 10 5 mol dm 3 ) .
5.0
2.5
0 . 0
1
= T
/
(ľ 1 II и
T 1 I T •"
=r~- L
1 Stop-flow for a "
7-.
\
i i ~
3 4 5 6 7 //min
10
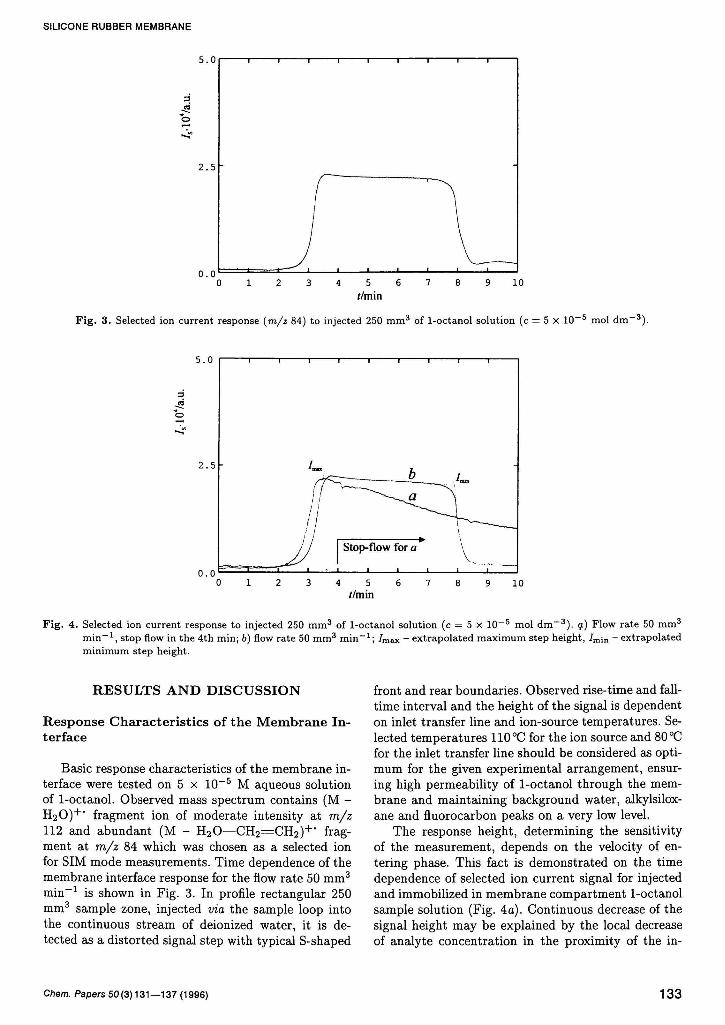
Fig . 4. Selected ion current response to injected 250 m m 3 of 1-octanol solution (c = 5 X 10~ 5 mol d m - 3 ) , q) Flow rate 50 m m 3
m i n - 1 , stop flow in the 4th min; b) flow rate 50 m m 3 m i n - 1 ; / m a x - extrapolated maximum step height, / m i n - extrapolated minimum step height.
R E S U L T S A N D D I S C U S S I O N
Response Character i s t ics of t h e M e m b r a n e Interface
Basic response characteristics of the membrane interface were tested on 5 x 10~5 M aqueous solution of 1-octanol. Observed mass spectrum contains (M -H 2 0 ) + * fragment ion of moderate intensity at m/z 112 and abundant (M - H 2 0 — C H 2 = C H 2 ) + # fragment at m/z 84 which was chosen as a selected ion for SIM mode measurements. Time dependence of the membrane interface response for the flow rate 50 mm3
m i n - 1 is shown in Fig. 3. In profile rectangular 250 mm3 sample zone, injected via the sample loop into the continuous stream of deionized water, it is detected as a distorted signal step with typical S-shaped
front and rear boundaries. Observed rise-time and fall-time interval and the height of the signal is dependent on inlet transfer line and ion-source temperatures. Selected temperatures 110°C for the ion source and 80 °C for the inlet transfer line should be considered as optimum for the given experimental arrangement, ensuring high permeability of 1-octanol through the membrane and maintaining background water, alkylsilox-ane and fluorocarbon peaks on a very low level.
The response height, determining the sensitivity of the measurement, depends on the velocity of entering phase. This fact is demonstrated on the time dependence of selected ion current signal for injected and immobilized in membrane compartment 1-octanol sample solution (Fig. 4a). Continuous decrease of the signal height may be explained by the local decrease of analyte concentration in the proximity of the in
ckém. Papers 50 (3) 131 —137 (1996) 133

I. JELÍNEK
аз
О
Flow rate/(mm min )
F i g . 5. The dependence of selected ion current response to 250 m m 3 of 1-octanol solution (c = 5 x 10 5 mol dm 3 ) on the flow
rate of incoming solution. О Minimum step heights; Л maximum step heights; D average step heights.
ner surface of silicone rubber membrane. Continuous flow of the sample solution compensates the effect of dilution and improves the shape of the signal. Flat course of the signal after rising to its maximum is observed for the flow rate 50 m m 3 m i n _ 1 (Fig. 4 6). This is confirmed by the low value of calculated A / = /max - ^min = 2.2 x 10~ 5 a.u. representing 9.8
% of the maximum response value. The dependence of minimum, maximum, and average step height values on the flow rate of the entering solution is shown in Fig. 5. Observed increase in maximum step height and flattening of the response for the flow rates higher than 20 mm 3 m i n - 1 reflects favourably in the sensitivity and accuracy of the measurements. The decrease of the maximum response for the flow rates higher than 70 mm 3 m i n - 1 is undoubtedly the result of inefficient thermal equilibration of incoming solution and the membrane.
M a t r i x Effects
Two possible matrix effects were supposed to affect the determination of 1-octanol in ternary aqueous solutions containing PEG as a high-molecular nonper-vaporating additive.
The sorption of PEG on silicone rubber membrane may represent the negative factor distorting the measurement of 1-octanol concentration. To characterize such effect the measurement of 1-octanol response height before and after 10 min exposition of inner membrane surface to 5 x 10" 5 M-PEG solution was performed. From the results shown in Fig. 6 it is evident that the response to 1-octanol after prolonged exposition of the membrane to aqueous solution of PEG is significantly lower and represents approximately 65 % of the value measured with unexposed membrane. Although multiple rinsing of inner membrane surface with water gradually increases the response, the signal still remains lower (81 % after triple rinsing step). The effect of decreased response may be simply explained by firm adsorption of PEG on silicone rubber surface. Formed adhesive layer resists to multiple rinsing and apparently decreases permeability of the membrane. The effect is substantially reduced by applying the appropriate rinsing procedure. The results of similar experiment, where rinsing is accomplished alternatively with DED AB solution (с = 2 x 10" 2 mol d m - 3 ) and water are shown in Fig. 7. It is evident that combined DED AB—water rinsing is more effective and the response toward 1-octanol remains the same prior and
134 Chem. Papers 50 (3)131—137 (1996)

SILICONE RUBBER MEMBRANE
5 . 0
2 . 5
0 . 0
Fig . 6. Selected ion current response to multiple injection of 250 m m 3 of 1-octanol solution (c = 5 X 1 0 - 5 mol d m " 3 ) after 10 min
pretreatment of the membrane with PEG solution (c = 5 X 1 0 " 5 mol d m - 3 ) . P - pretreatment interval; R - rinse with
water interval; dashed line - average step height for the measurements with untreated membrane.
5 . 0
2 . 5
0 . 0
P | R\ | R2 | R\ R\
n
10 20 30 40 50
//min
Fig . 7. Selected ion current response to multiple injection of 250 m m 3 of 1-octanol solution (c = 5 x 1 0 - 5 mol d m - 3 ) after 10 min pretreatment of the membrane with PEG solution (c = 5 x 1 0 - 5 mol d m - 3 ) . P - pretreatment interval; Rl - rinse with water interval, R2 - rinse with DED AB solution (с = 2 x Ю - 2 mol d m - 3 ) interval; dashed line - average step height for the measurements with untreated membrane.
after the exposition of the membrane to PEG solution. The effect of formation of PEG—octanol com
plexes in solution on permeation rate of 1-octanol was also studied. The concentration of 1-octanol was measured in the set of ternary PEG—octanol aqueous solutions. The effect of PEG sorption was minimized by applying combined DEDAB—water rinsing between successive analyses. Identical measurements were carried out for the control set of solutions without added PEG. Calibration dependences for both sets of sam
ples are shown in Fig. 8. There is a striking difference in the shape of both curves. Curve a, which corresponds to the measurements of pure 1-octanol solutions, is highly linear (correlation coefficient г = 0.993) with negligible y-axis intercept. Calculated signal to noise ratio for the lowest monitored 1-octanol concentration is about 40. This indicates that the theoretical detection limit should be lower than 5 x 10~7
mol d m - 3 . The course of the curve b indicates that PEG effectively decreases the concentration of free 1-
Chem. Papers 50 (3) 131—137 (1996) 135

I. JELÍNEK
3 OD
ь
1 2 3
c o c t * 1 0 7 ( m o l d m ~ 3 )
Fig. 8. Calibration curves for 1-octanol solutions, a) Without PEG; 6) with PEG (c = 5 x 10~6 mol dm 3 ) .
octanol in the solution, presumably by formation of nonvolatile PEG—octanol complexes which are not able to penetrate through the membrane. The ability of the membrane interface to respond selectively toward free 1-octanol in the solution should be utilized for the estimation of PEG—octanol binding ratio on the basis of the mole ratios method. Apparently, the curve b is composed of two branches. Linearly extrapolated intersection point, corresponding to the value 6 on the upper x-axis, implies the formation of stable [Oct]6PEG complex.
C O N C L U S I O N
MIMS offers many attractive features as a direct method for the analysis of volatile organic compounds in aqueous solutions. The application area of MIMS approaches medium volatile compounds with relatively high polarity as documented in experiments with 1-octanol solutions. By optimizing the conditions of the measurement it is possible to attain highly reproducible as well as sensitive response to selected anály te.
Detailed knowledge of possible matrix effects is important when MIMS is utilized for the purposes of quantification of the analyte in complex matrix mixtures. The study demonstrates the importance of matrix effects of nonvolatile high-molecular components which do not penetrate through the membrane but substantially affect the conditions in solution and on the surface of the membrane. The results presented
here show that PEG adsorbed on the surface of silicone rubber membrane is able to lower the permeation rate of analyzed 1-octanol. The choice of the suitable rinsing procedure diminishes such effect. An efficient cleaning procedure was found in alternative rinsing of inner capillary surface with aqueous surfactant solution and water.
Another experimentally studied matrix effect of high-molecular matrix constituent was the decrease of permeation rate of 1-octanol due to the formation of nonvolatile PEG—octanol complexes. Prom the presented experimental results it is evident that MIMS responds only to free unbound 1-octanol in the solution. An attempt to determine the binding ratio of PEG—octanol from the measured 1-octanol response in solutions containing PEG was made. Unfortunately, there are no data available in the literature which could be compared with our results. The accuracy of the obtained result is undoubtedly affected by additional factors, such as dispersion of actual molecular masses of used PEG and inaccuracy in the determination of intersection point, which were not considered.
R E F E R E N C E S
1. Kotiaho, Т., Lauritsen, F. R., Choudhury, Т. K., Cooks, R. G., and Tsao, G. Т., Anal. Chem. 63, 875A (1991).
2. Harland, B. J., Nicholson, P. J. D., and Gillings, E., Water Res. 21, 107 (1987).
3. Lister, A. K., Wood, K. V., Cooks, R. G., and Noon, K.
136 Chem. Papers 50 (3) 131 —137 (1996)

SILICONE RUBBER MEMBRANE
R., Biomed. Environ. Mass Spectrom. 18, 1063 (1989).
4. S turaro, A., D o r e t t i , C., P a r voli, G., Lecchinato, F.,
Frison, G., and Traldi, P., Biomed. Environ. Mass
Spectrom. 18, 707 (1989).
5. Savickas, P . J., LaPack, M. A., and Tou, J. С., Anal.
Chem. 61, 2332 (1989).
6. Hayward, M. J., Kot iaho, Т., Lister, A. K., Cooks, R.
G., Austin, G. D., Narayan, R., and Tsao, G. Т., Anal.
Chem. 62, 1798 (1990).
7. deMas, C , Jansen, N. В., and Tsao, G. Т., Biotechnol.
Bioeng. 31, 366 (1988).
8. Qureshi, N. and Cheryan, M., Appl. Microbiol. Biotech
nol. 30, 440 (1989).
9. Carlsen, H. N., Joergensen, L., a n d Degn, H., Appl.
Microbiol. Biotechnol. 35, 124 (1991).
10. Brant igan, J. W., D u n n , K. L., and Albo, B. J., J. Appl.
Physiol. 40, 443 (1976).
11. Lundsgaard, J. S., Jensen, B,, and Groenlung, J., J.
Appl. Physiol. 48, 376 (1980).
12. Brodbel t , J . S., Cooks, R. G., Tou, J. C , Kallos, G. J.,
and Dryzga, M. D., Anal. Chem. 59, 454 (1987).
13. Hwang, S. T. a n d K a m m e r m e y e r , К., Membranes in
Separation (Techniques of Chemistry, Vol. VII). Wiley,
New York, 1975.
14. Bier, M. E., Kot iaho, Т., a n d Cooks, R. G., Anal.
Chim. Acta 231, 175 (1990).
15. Bauer, S. J . a n d Cooks, R. G., Talanta 40, 1031 (1993).
16. Bier, M. E. a n d Cooks, R. G., Anal. Chem. 59, 597
(1987).
17. LaPack, M. A., Tou, J. C , a n d Enke, Christ ie G., Anal.
Chem. 62, 1265 (1990).
18. Slivon, L. E., Bauer, M. R., Ho, J. S., and Budde, W.
L., Anal. Chem. 63, 1335 (1991).
19. Westover, L. В., Tou, J. C , a n d Mark, J. H., Anal.
Chem. 46, 568 (1974).
20. Degn, H., Сох, R. P., a n d Lloyd, D., Methods Biochem.
Anal. 31, 165 (1985).
21. Degn, H. and Lauri t sen, F. R., J. Phys. Chem. 93, 2781
(1989).
22. Brodbel t , J . S. a n d Cooks, R. G., Anal. Chem. 57, 1153
(1985).
23. Wankat , P . C , Rate-Controlled Separations. Elsevier
Applied Science, London, 1994.
24. Doerner, P., L e h m a n , J., Piehl, H., a n d Megnet, R.,
Biotechnol. Lett. 4, 557 (1982).
Translated by I. Jelínek
Chem. Papers 50 (3) 131 —137 (1996) 137