maths.bristol.ac.uk quantum i am a 3 graph
TRANSCRIPT
13
2
Use our exhibit to build your own quantum graph. Be creative! Vary the number and length of the strings, and try different ways to connect them. Each time, you will get a new quantum graph with its own spectrum of sounds; how does this spectrum change with the quantum graph?
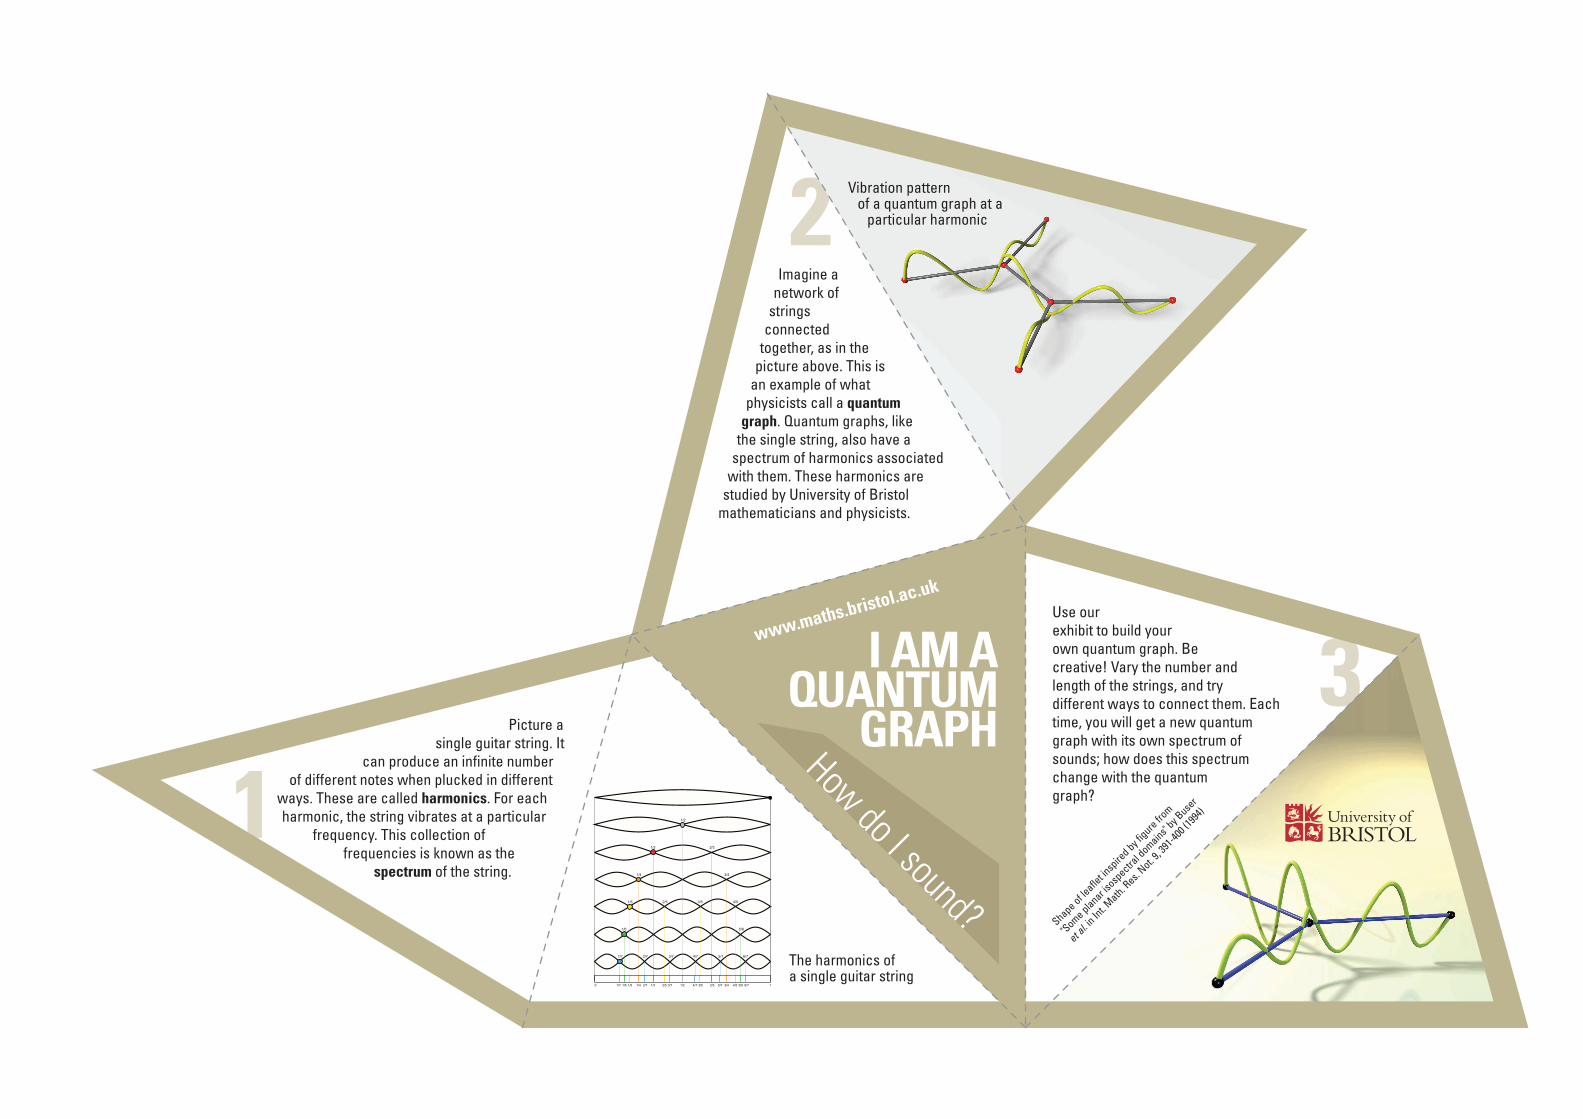
Imagine a network of
strings connected
together, as in the picture above. This is
an example of what physicists call a quantum
graph. Quantum graphs, like the single string, also have a
spectrum of harmonics associated with them. These harmonics are
studied by University of Bristol mathematicians and physicists.
Picture a single guitar string. It
can produce an infinite number of different notes when plucked in different
ways. These are called harmonics. For each harmonic, the string vibrates at a particular
frequency. This collection of frequencies is known as the
spectrum of the string.
I AM AQUANTUM
GRAPHHow do I sound?
Vibration pattern of a quantum graph at a
particular harmonic
www.maths.bristol.ac.uk
1/2
1/3 2/3
1/4 3/4
1/5 2/5 3/5 4/5
1/6 5/6
1/7 2/7 3/7 4/7 5/7 6/7
1/21/3 2/31/4 3/41/5 2/5 3/5 4/51/6 5/61/7 2/7 3/7 4/7 5/7 6/7 10
The harmonics of a single guitar string
Shape of leafle
t insp
ired by f
igure from
"Some planar isosp
ectral d
omains" by B
user
et al. i
n Int. M
ath. Res.
Not. 9, 3
91-40
0 (19
94)