mathematics survey assignment
TRANSCRIPT
1
SCHOOL OF ARCHITECTURE, BUILDING AND DESIGN
THE DESIGN SCHOOL
FOUNDATION IN NATURAL BUILD ENVIRONMENT
Mathematics (MATH0103)
Project – Statistics
Group Member: Lim Chern Yie (0315688)
Lee Kit Hung (0315722)
Gan Jet Foong (0315998)
Bo Yong Khong (0316317)
Lai Choon Feng (0315898)
Lecturer : Ms. Ann See Peng
2
Table of content
Content Page
1. Introduction 3
2. Objectives 4
3. Methodology 5-6
4. Questionnaire 7-8
5. Statistical analysis 9-28
6. Calculation 29-30
7. Conclusion 31
3
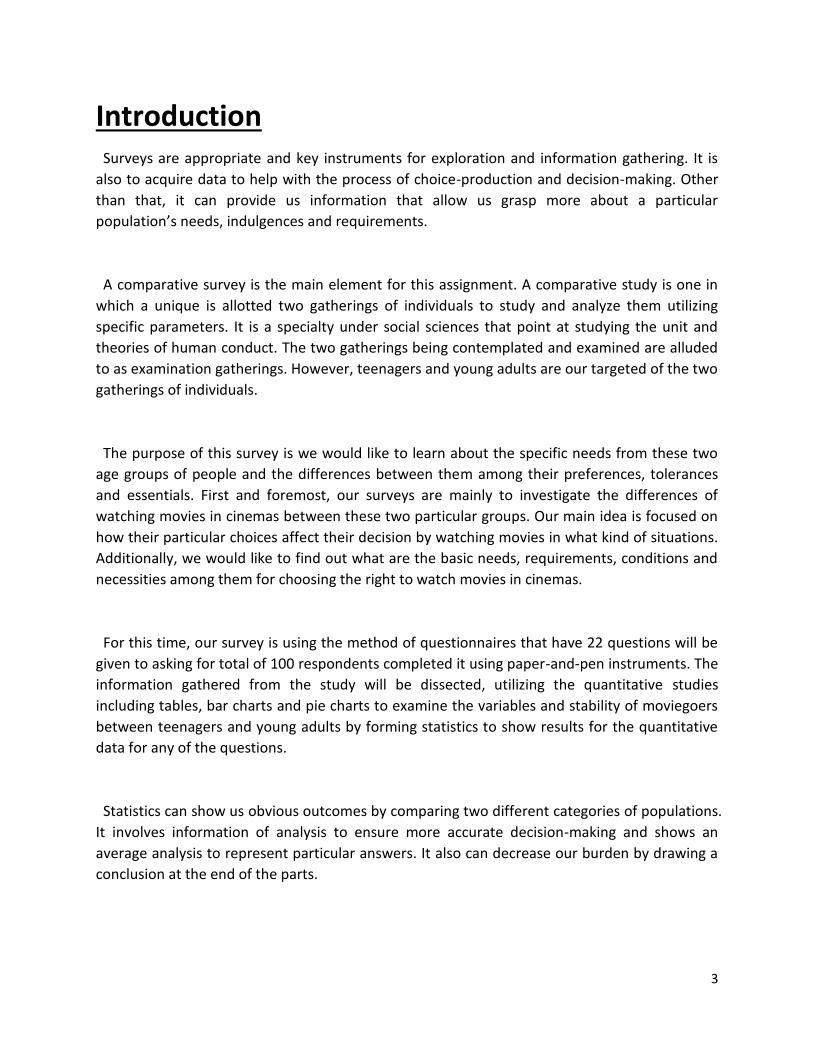
Introduction Surveys are appropriate and key instruments for exploration and information gathering. It is
also to acquire data to help with the process of choice-production and decision-making. Other
than that, it can provide us information that allow us grasp more about a particular
population’s needs, indulgences and requirements.
A comparative survey is the main element for this assignment. A comparative study is one in
which a unique is allotted two gatherings of individuals to study and analyze them utilizing
specific parameters. It is a specialty under social sciences that point at studying the unit and
theories of human conduct. The two gatherings being contemplated and examined are alluded
to as examination gatherings. However, teenagers and young adults are our targeted of the two
gatherings of individuals.
The purpose of this survey is we would like to learn about the specific needs from these two
age groups of people and the differences between them among their preferences, tolerances
and essentials. First and foremost, our surveys are mainly to investigate the differences of
watching movies in cinemas between these two particular groups. Our main idea is focused on
how their particular choices affect their decision by watching movies in what kind of situations.
Additionally, we would like to find out what are the basic needs, requirements, conditions and
necessities among them for choosing the right to watch movies in cinemas.
For this time, our survey is using the method of questionnaires that have 22 questions will be
given to asking for total of 100 respondents completed it using paper-and-pen instruments. The
information gathered from the study will be dissected, utilizing the quantitative studies
including tables, bar charts and pie charts to examine the variables and stability of moviegoers
between teenagers and young adults by forming statistics to show results for the quantitative
data for any of the questions.
Statistics can show us obvious outcomes by comparing two different categories of populations.
It involves information of analysis to ensure more accurate decision-making and shows an
average analysis to represent particular answers. It also can decrease our burden by drawing a
conclusion at the end of the parts.

4
Objectives
The main objective for this survey is to study and compare about the difference of preference
for watching movies in cinemas between teenagers and young adults. We attempt to find out
the range of differences for their needs, choices and essentials of watching movies although
they are just one or two or three years different of their age and prime of life.
First and foremost, we would like to find out what kind of genre of movies that are suited the
particular age group’s taste and favorite. Then, we want to find out what kind of elements
could easily attract them by going to watch a movie in cinemas from its aspects, soundtracks
and reviews. As we all know that there is the bunch of cinemas available in Malaysia such as
GSC, TGV, MBO, we would like find the result shows that which one is the most popular cinema
among their choices and why they choose it.
Other than that, we want to study the average expenses on movies and snacks between
teenagers and young adults. As we all know that mostly teenagers are still students but 50% of
young adults are employees. We want to find out to check whether young adults spend more
than teenagers in this field due to their more monthly allowances or incomes. Then, there are
many showtimes for movies in a day but we want to find out which the best timing for them for
coming out to watch movies in cinemas. We also want to find out in what conditions they feel
the most comfortable while watching movies, who are their movie partners and how many of
them and also how far they willing to travel to watch movies.
Last but not least, we could make an analysis by showing results that could easily be explained
their particular preferences among the age groups and how is the range of differences between
the two. We also can learn how to apply wise theories of statistic in our real life.

5
Methodology
In the beginning, this was not our first thought for the survey. Our idea was discussing car, but the idea
was rejected by Ms. Ann because she said our questions were almost all out of topic. Then, she
suggested us to figure out another brand new idea. After our common thinking and agreement, finally
this new idea had selected by all of us, which is to compare watching movies in cinemas between
teenagers and young adults.
In 9th of May, we conducted our survey forms to the 100 targeted people to fill up which are 50 of
teenagers and another 50 of young adults. We walked through around Taylor’s University Lakeside to
search the peoples that met the requirements who are aged between 18 years old to 23 years old in
order to ask them filled up the surveys
for us. We conducted the survey
forms mainly at Taylor’s Student Life
Centre, Library and outside the library.
Then, we would observe the targeted
person’s condition before we
proceeded to conduct the form. For
example, for those who was sleeping,
carrying a discussion or busy with
studying, we would not disturb them
to disrupt their time by showing our
respect to them.
These are the pictures we took during conducting the survey forms.
Choon Feng
was asking
people to fill
up at Library
Level 5.

6
We almost used up to 2-hours time to finish conducting 100 survey forms to the people. It was tiring
but was fun and we had learnt some skills during this section, especially communicating skill.
On the 9th of May, we started to do our report analysis instantly. At first, we separated the tasks to
each members as to increase our productivity. Lee Kit Hung and Bo Yong Khong were responsible for the
calculations for every questions. Other than that, Lim Chern Yie and Lai Choon Feng were assigned the
role of keying data and describing summary to each results into Microsoft Words. Additionally, our only
computer expert, Gan Jet Foong was given the role of editing poster using Adobe Photoshop.
Lastly, we finally did the assignments in three days.
These are some calculations that were done by Lee Kit Hung and Bo Yong Khong.

7
Questionaire
Inquiry about Watching Movie in Cinemas
Name:
1) What is your gender?
Male Female
2) What is your current age?
18 19 20 21 22 23
3) Which genre of movies do you prefer the most?
Action Comedy Horror Romance Fantasy Others
4) Which aspect of a movie do you consider the most important?
Actor Ratings Storyline Popularity Others
5) What kinds of movies would you prefer them to be based on?
True story Fiction Novel Book
6) What type of endings do you prefer in a movie?
Explicit Implicit Unresolved Long view
7) Which sort of soundtracks do you prefer?
Instrumental Pop songs Film score Source Music
8) How important is the soundtrack to a movie?
Very important, it sets the whole scene.
Somewhat important, but mostly as background.
Not very important, though a good one is nice.
Not important at all.

8
9) Which cinema do you prefer to watch your movies? (You can choose more than one)
GSC TGV MBO Cineplex Others
10) What is the main reason for your cinema choice? (You can choose more than one)
Pricing Meal Environment Service attitude
11) Which types of movie screening would you prefer the most?
Standard 2D 3D IMax
12) Who do you always watch movies with?
Alone Family Friends Lover
13) How many times do you watch movies in cinemas in a month?
0-1 2-3 4-5 6-7
14) How many people would you like to go to cinema with you?
0-3 4-7 8-11 12-15
15) What time do you prefer to watch movies?
11.01am-3pm 3.01pm-7pm 7.01pm-11pm 11.01pm-3am
16) Would you mind sitting in the first three rows at the cinema?
Yes No
17) How much do you think the cost of a ticket should be to be reasonable for you?
RM6-10 RM11-15 RM16-20 RM21-25
18) Which promotion for movie tickets for you is the best?
Movie Day (Wednesday) Buy 1 Free 1 Early Bid Bank’s Promotion
19) Do you usually buy snacks (ex. Popcorn, Chips, Soft Drinks) before going for movies?
Yes No
20) How much would you spend on snacks?
RM0-2.9 RM3-5.9 RM6-8.9 RM9-11.9
21) How much do you spend by watching movies in a month?
RM10-29 RM30-49 RM50-69 RM70-89
22) How far are you willing to travel from your location to watch a movie?
0km-4.9km 5km-9.9km 10km-14.9km 15km-19.9km 20km-24.9km
9
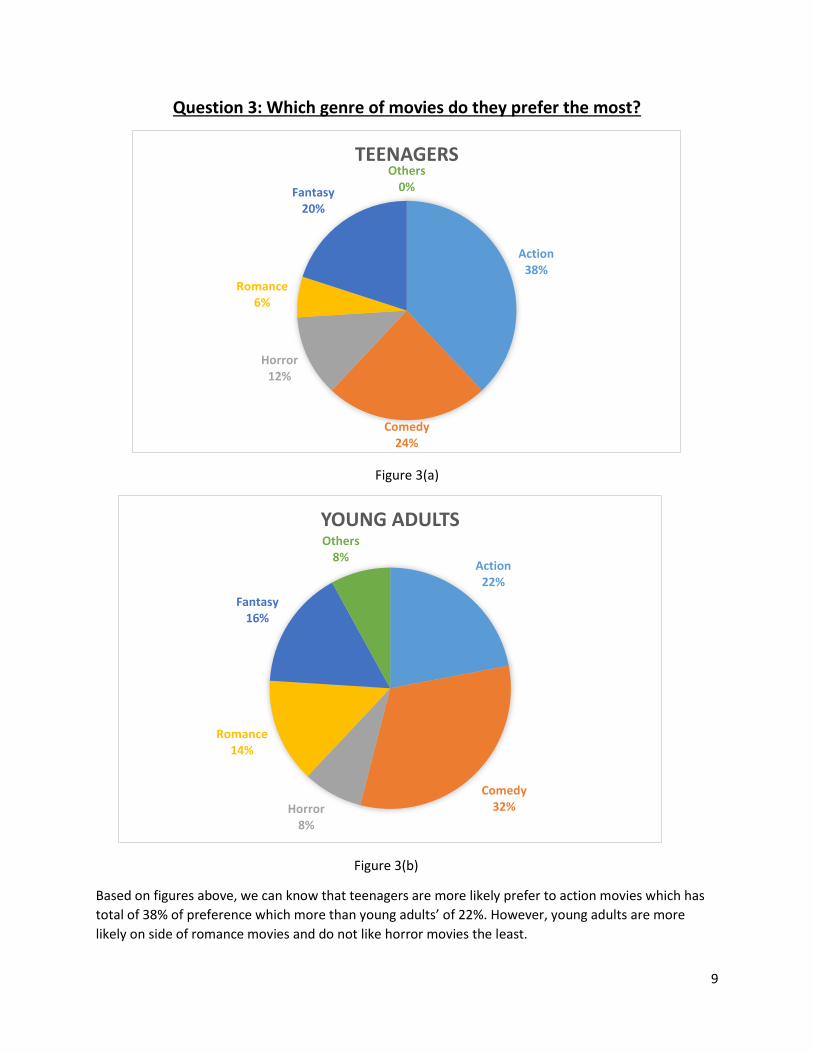
Question 3: Which genre of movies do they prefer the most?
Figure 3(a)
Figure 3(b)
Based on figures above, we can know that teenagers are more likely prefer to action movies which has
total of 38% of preference which more than young adults’ of 22%. However, young adults are more
likely on side of romance movies and do not like horror movies the least.
Action38%
Comedy24%
Horror12%
Romance6%
Fantasy20%
Others0%
TEENAGERS
Action22%
Comedy32%Horror
8%
Romance14%
Fantasy16%
Others8%
YOUNG ADULTS

10
Question 4: Which aspect of a movie do they consider the most important?
Figure 4(a)
Figure 4(b)
As we can see from the figures above, aspect of storyline is still the top choice for either teenagers or
young adults. However, at teenagers’ side, preferences of choosing storyline have totally conquered the
area which has 80% of people had choose it. For young adults, it has total average of 54% people choose
it. This means a good storyline will bring good reviews for the movie rather than its actors, popularity,
rating or any others issues.
Actors8% Rating
4%
Storyline80%
Popularity4%
Others4%
TEENAGERS
Actors12%
Rating16%
Storyline54%
Popularity16%
Others2%
YOUNG ADULTS

11
Question 5: What kinds of movies would they prefer them to be based on?
Figure 5(a)
Figure 5(b)
Figure 5a and 5b show that fiction movie has higher percentage than movie that based on novel, true
story and book. Both teenagers and young adults prefer fiction movie. The pie chart statistics show an
obvious outcome from both age groups of people.
True Story12%
Fiction63%
Novel17%
Book8%
TEENAGERS
True Story11%
Fiction 55%
Novel24%
Book10%
YOUNG ADULTS

12
Question 6: What type of endings do they prefer in a movie?
Figure 6(a)
Figure 6(b)
Figure 6a shows that implicit ending has highest percentage, 44% and long view has lowest percentage,
9%. Figure 6b shows that explicit ending has higher percentage and long view has lowest percentage. In
conclusion, both groups do not like long view.
At last, teenagers prefer more about implicit ending which is ending that based on personal
interpretation. On the other side, young adults prefer explicit ending, which is easily been described as a
happy and sweet ending.
Explicit13%
Implicit44%
Unresolved34%
Long view9%
TEENAGERS
Explicit40%
Implicit30%
Unresolved26%
Long view4%
YOUNG ADULTS

13
Question 7: Which sort of soundtracks do they prefer?
Figure 7(a)
Figure 7(b)
In the case of soundtrack in movies, teenagers enjoy more in the situation which the movies are playing
film score, there has total of 33% people had voted it but only 22% of young adults are choosing film
score. However, majority of young adults have chosen for pop songs, which have total of 36%.
This shows that different level of age groups people have different desire by enjoying types of
soundtracks in movies.
Instrumental11%
Pop songs28%
Film score33%
Source music28%
TEENAGERS
Instrumental34%
Pop songs36%
Film score22%
Source music8%
YOUNG ADULTS

14
Question 8: How important is the soundtrack to a movie?
Figure 8a)
Figure 8b)
Figure 8a) and figure 8b) show that the important of soundtrack to a movie have higher percentage. In
conclusion, both of the teenagers and young adults agreed that movie soundtrack is very important to a
movie.
Very52%
Somewhat44%
Not very4%
Not0%
TEENAGERS
Very68%
Somewhat24%
Not very4%
Not4%
YOUNG ADULTS

15
Question 9: Which cinema do you prefer to watch your movies?
Figure 9a)
Figure 9b)
Figure 9a) and figure 9b) shows that TGV and GSC has the highest percentage. GSC and TGV are more
preferable for teenagers and young adults than MBO, Cineplex and Others.
GSC36%
TGV38%
MBO18%
Cineplex7%
Others1%
TEENAGERS
GSC35%
TGV49%
MBO9%
Cineplex7%
Others0%
YOUNG ADULTS
16
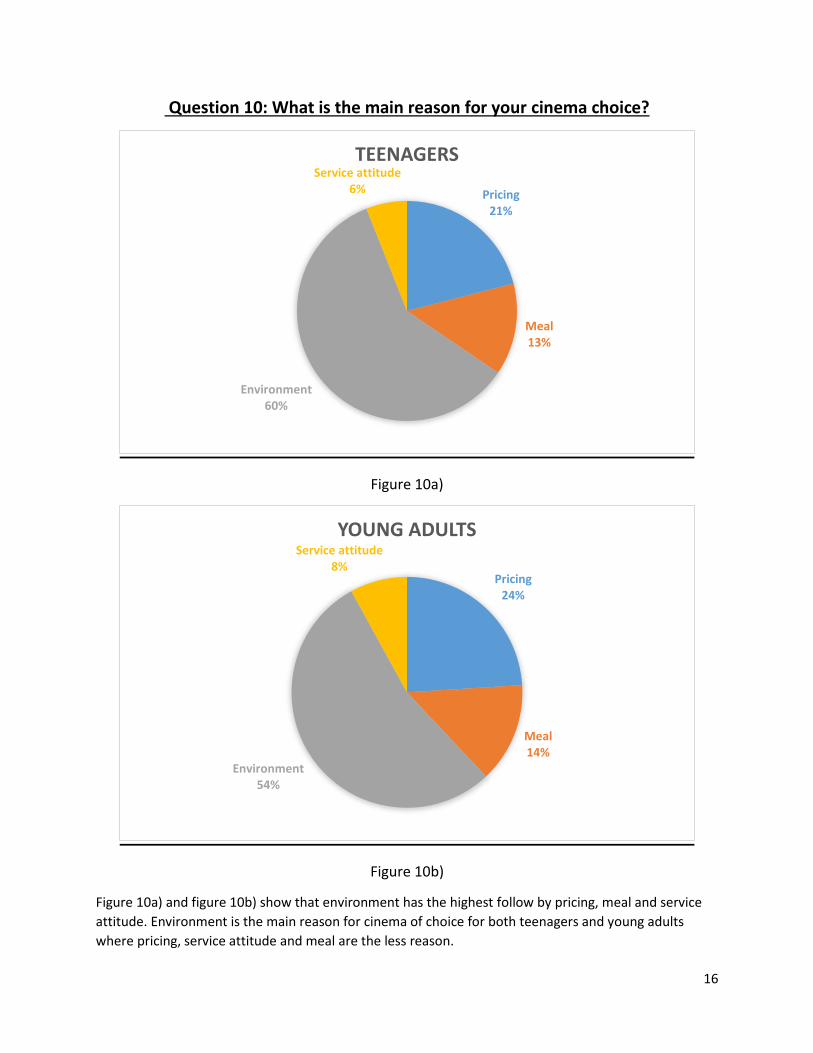
Question 10: What is the main reason for your cinema choice?
Figure 10a)
Figure 10b)
Figure 10a) and figure 10b) show that environment has the highest follow by pricing, meal and service
attitude. Environment is the main reason for cinema of choice for both teenagers and young adults
where pricing, service attitude and meal are the less reason.
Pricing21%
Meal13%
Environment60%
Service attitude6%
TEENAGERS
Pricing24%
Meal14%
Environment54%
Service attitude8%
YOUNG ADULTS

17
Question 11: Which types of movie screening would they prefer the most?
Figure 11(a)
Figure 11(b)
In this modernizing world, technology is gradually growing at different types of area, same as come for
movie screening. Recently, moviegoers can choose what types of movie screening they prefer and think
worth to it the most.
Based on statistics above, the pie charts shows that the standard types are still the most preference
among these two groups which are 32% of teenagers and 50% of young adults. The same results for the
least preference, they do not like 3D the most because of its lowest percentages, only 18% of teenagers
and 12% of young adults.
Standard32%
2D28%
3D18%
Imax22%
TEENAGERS
Standard50%
2D20%
3D12%
Imax18%
YOUNG ADULTS

18
Question 12: Who do they always watch movies with?
Figure 12(a)
Figure 12(b)
The pie charts show that either teenagers or young adults will prefer watch movies with their friends
rather than watching alone, with family or lover. This is because the percentages for watching with
friends are almost covered the ratio. 76% of teenagers and 64% of young adults prefer it. Then, follow
by with family which is 14% of teenagers and 16% of young adults.
Then, 8% of teenagers and 12% of young adults prefer watching with their other half. Everyone
normally does not watch alone in cinema so there are only 2% of teenagers and 8% of young adults
choosing watching alone.
Alone2% Family
14%
Friends76%
Lover8%
TEENAGERS
Alone8%
Family16%
Friend64%
Lover12%
YOUNG ADULTS

19
Question 13: How many times do you watch movies in cinemas in a month?
Young Adults
Teenagers
Mean of young adults = 2.18
Mean of teenagers = 2.22
From these results, the mean of the participants of survey visiting the cinema are about 2 to 3 times per
month. In addition, the mean of teenagers visiting the cinema per month is higher than the mean of
young adults. This shows that teenagers are more prefer to visit the cinema than the young adults.
16
27
6
1
17
25
6
2
0
5
10
15
20
25
30
0-1 2-3 4-5 6-7
Young Adults
Teenagers
Nu
mb
er O
f P
arti
cip
ants
Range Frequency CF x F(x) Fx2
0-1 16 16 0.5 8 4
2-3 27 43 2.5 67.5 168.75
4-5 6 49 4.5 27 121.5
6-7 1 50 6.5 6.5 42.25
Range Frequency CF x F(x) Fx2
0-1 17 17 0.5 8.5 4.25
2-3 25 42 2.5 62.5 156.25
4-5 6 48 4.5 27 121.5
6-7 2 50 6.5 13 84.5
Times

20
Question 14: How many people would you like to go to cinema with you?
Young Adults
Range Frequency CF x F(x) F(x)2
0-3 14 14 1.5 21 31.5
4-7 29 43 5.5 159.5 877.25
8-11 6 49 9.5 57 541.5
12-15 1 50 13.5 13.5 182.25
Teenagers
Range Frequency CF x F(x) F(x)2
0-3 18 18 1.5 27 40.5
4-7 28 46 5.5 154 847
8-11 1 47 9.5 9.5 90.25
12-15 3 50 13.5 4.5 546.75
The analysis from the bar chart and tables above are as below:
From the cumulative frequency, the median class for young adult and teenagers are 4-7 person which
the median for young adults is 5.02 peoples and 3.5 peoples for teenagers.
14
29
6
1
18
28
13
0
5
10
15
20
25
30
35
0-3 4-7 8-11 12-15
Young Adults
Teenagers
Nu
mb
er O
f P
arti
cip
ants
Number OfPeople

21
Question No.15: What time do they prefer to watch movies?
Figure 15(a)
Figure 15(b)
Obviously, the session between evening and night is the best timing for teenagers and young adults
watch movie in cinemas. Total of 50% teenagers and 58% young adults have chosen it. They prefer to
watch a movie before or after dinner time by satisfying their well plan for the night.
In this 21th century, everyone prefers sleep rather than wakes up early in the morning. As the results
show above, both age groups do not like to watch movie in cinemas at the earliest session which is
between 11.01am to 3pm. There are still 12% teenagers prefer it but only 2% for young adults.
Therefore, there is a possibility tells us that young adults need more sleep than teenagers.
11.01am-3pm12%
3.01pm-7pm23%
7.01pm-11pm50%
11.01pm-3am15%
TEENAGERS
11.01am-3pm2%
3.01pm-7pm26%
7.10pm-11pm58%
11.01pm-3am14%
YOUNG ADULTS

22
Question 16: Would you mind sitting in the first three rows at the cinema?
From the bar chart,
Mode of young adults: 28 out of 50 of the young adults (Yes)
Mode of teenagers: 28out of 50 teenagers (No)
From the data shown, we can conclude that teenagers will do not mind to sit on the first three row at
the cinema unless the cinema is full seated. However, young adults may not have the same concepts as
teenager; they are more focused on enjoying the movie times. They think that the money they had
spent should be worth.
28
2222
28
0
5
10
15
20
25
30
Yes No
Young Adults
Teenagers
Nu
mb
er O
f P
arti
cip
ants

23
Question 17: How much do you think the cost of a ticket should be to be
reasonable for you?
Young Adults
Range Frequency CF x F(x) F(x)2
6-10 12 12 8 96 768
11-15 32 44 13 416 5408
16-20 4 48 18 72 1296
21-25 2 50 23 46 1058
Teenagers
Range Frequency CF x F(x) F(x)2
6-10 13 13 8 104 832
11-15 30 43 13 390 5070
16-20 5 48 18 90 320
21-25 2 50 23 46 1058
The analysis above had revealed what would be the reasonable cost of cinema ticket for young adults
and teenagers. From the research, the mean of teenagers (RM12.6) is higher than the young adults
(RM11.6). Majority of the participants prefer to buy low cost tickets between RM6 to RM15 than high
cost tickets which above RM16. We also found out that they save cost on movie ticket so that they can
buy some snacks and enjoy it during the showing time of movie.
12
32
42
13
30
5
2
0
5
10
15
20
25
30
35
6-10 11-15 16-20 21-25
Young Adults
Teenagers
Nu
mb
er
Of
Par
tici
pan
ts
RM

24
Question 18: Which promotion for movie tickets for them is the best?
Figure 18a)
Figure 18b)
Figure 18a) shows that teenagers are more prefer buy 1 free 1 because the percentage is highest. Figure
18b) shows that young adults are prefer buy 1 free 1 and movie day (Wednesday) because the
percentage are the same.
Movie Day (Wednesday)
12%
Buy 1 Free 182%
Early Bid6%
Bank's Promotion0%
TEENAGERS
Movie Day (Wednesday)
46%
Buy 1 Free 146%
Ealry Bid6%
Bank's Promotion2%
YOUNG ADULTS

25
19) Do you usually buy snacks?
This diagram shows the willingness of young adults and teenagers on buying snacks while watching a
movie. 35 out of 50 young adults and 30 out of 50 of and teenagers are preferred to buy snacks and
enjoy their movies. Majority of them think that snacks are parts of the movie.
35
15
30
20
0
5
10
15
20
25
30
35
40
Yes No
Young Adults
Teenagers
Nu
mb
er
Of
Par
tici
pan
ts

26
Question 20: How much would you spend on snacks?
Young Adults
Range Frequency CF x F(x) F(x)2
0-2.9 10 10 1.45 14.5 21.03
3-5.9 15 25 4.45 66.75 297.04
6-8.9 17 42 7.45 126.65 943.54
9-11.9 8 50 10.45 83.6 873.62
Teenagers
Range Frequency CF x F(x) F(x)2
0-2.9 9 9 1.45 13.05 18.92
3-5.9 19 28 4.45 84.55 376.24
6-8.9 12 40 7.45 89.4 666.03
9-11.9 10 50 10.45 104.5 1092.03
Analysis of whether young adults and teenagers are willing to spend money on snack when watching
movie had done. The median for young adults is RM5.95 while for the teenager is RM5.23. The data had
shown teenagers are more willing to spend money on snacks than teenagers. This could be due to most
of the teenagers they still depend on the allowance given by parents while young adults mostly have a
stable income from their permanent jobs.
10
15
17
89
19
12
10
0
2
4
6
8
10
12
14
16
18
20
0-3.9 4-6.9 7-9.9 10-12.9
Young Adults
Teenagers
Nu
mb
er O
f P
arti
cip
ants
RM

27
Question 21: How much do you spend on watching movies in a month?
Young Adults
Range Frequency CF x F(x) F(x)2
10-29 26 26 19.5 507 9886.5
30-49 17 43 49.5 671.5 26524.25
50-69 4 47 59.5 238 14161
70-89 3 50 79.5 238.5 18960.75
Teenagers
Range Frequency CF x F(x) F(x)2
10-29 33 33 19.5 643.5 12548.25
30-49 11 44 39.5 434.5 17162.75
50-69 4 48 59.5 238 14161
70-89 2 50 79.5 159 12640.5
The average of young adults spends on watching movie is RM33.1 whereas the mean for teenagers is
RM29.5. It had showed that the average amount spend on watching movie of young adults is higher
than teenagers. Since young adults are spending more money for watching movie than teenagers, we
can conclude that they prefer watching movie than teenagers.
26
17
43
33
11
42
0
5
10
15
20
25
30
35
10-29 30-29 50-69 70-89
Young Adults
Teenagers
Nu
mb
er O
f P
arti
cip
ants
RM

28
Question 22: How far are you willing to travel from your location to watch a
movie?
Young Adults
Range Frequency CF x F(x) F(x)2
0-4.9 10 10 2.45 24.5 60.025
5-9.9 17 27 7.45 126.65 943.5425
10-14.9 15 42 12.45 186.75 2325.0375
15-19.9 5 47 17.45 87.25 1522.5125
20-24.9 3 50 22.45 67.35 1512.0075
Teenagers
Range Frequency CF x F(x) F(x)2
0-4.9 12 12 2.45 29.4 72.03
5-9.9 17 29 7.45 126.65 943.5425
10-14.9 12 41 12.45 149.4 1860.03
15-19.9 4 45 17.45 69.8 1218.01
20-24.9 5 50 22.45 112.25 2520.0125
From the figure shown above, the mean of the distance which both teenagers and young adults are
willing to travel for a movie are about 5 to 9.9km of which young adults is 9.85km and teenagers is
9.75km. Majority of them do not like to go cinema which far apart from their houses and offices (16km
and above).
10
17
15
5
3
12
17
12
45
0
2
4
6
8
10
12
14
16
18
0-4.9 5-9.9 10-14.9 15-19.9 20-24.9
Young Adults
Teenagers
Nu
mb
er O
f P
arti
cip
ants
KM

29
Calculation
30
31
Conclusion
A standout amongst the most typical entertaiment ever is watching movies in
cinemas. Might the film type be action, comedy, horror, romance or fantasy,
viewing films can break free from our every day exercises, studies, work and
different schedules for no less than two great hours.
Firstly, most of the teenagers prefer to action movies but comedy movies are the
young adults’ favourite. Althought they are having different tastes for the genre
of movies, almost all of them are attracted to the aspects of movies by its
storyline. Furthermore, even the most admirable home theater frameworks
cannot precisely replicate the way films that can make you sense you are in the
piece of the film. Into a well sound experience and large amount of value survey
that silver screens can offer which the cinemas have plenty of types of movie
screening such as Standard, 2D, 3D and Imax. Based on the analysis, Standard is
still the all time favourite for both age groups of people but 3D is not that
preferable for teenagers and young adults. This is because of its inconvinience of
wearing the 3D glasses or moviegoers are easy to feel headache while watching
bunch of effects applied.
Watching a movie with a lot of other people can be a lot of fun. Sure, there will
be instances that some people would inevitably talk or make all sorts of noises
while the movie is still running. Therefore, that is the reason why some are prefer
watching alone rather than with other people. Other than that, there are plenty
of choices for cinema in our country but the result shows out that GSC and TGV
are conquering the choices of the people. This is because they are providing
better services than other cinema such as offering good movie screening of 2D,
3D and Imax. Thus, this is basically why they are the most famous cinema recently.