mathematics portfolio
DESCRIPTION
for EDBE 8P29TRANSCRIPT

Mathematics for Teaching Portfolio
EDBE 8P29
Dylan Magee
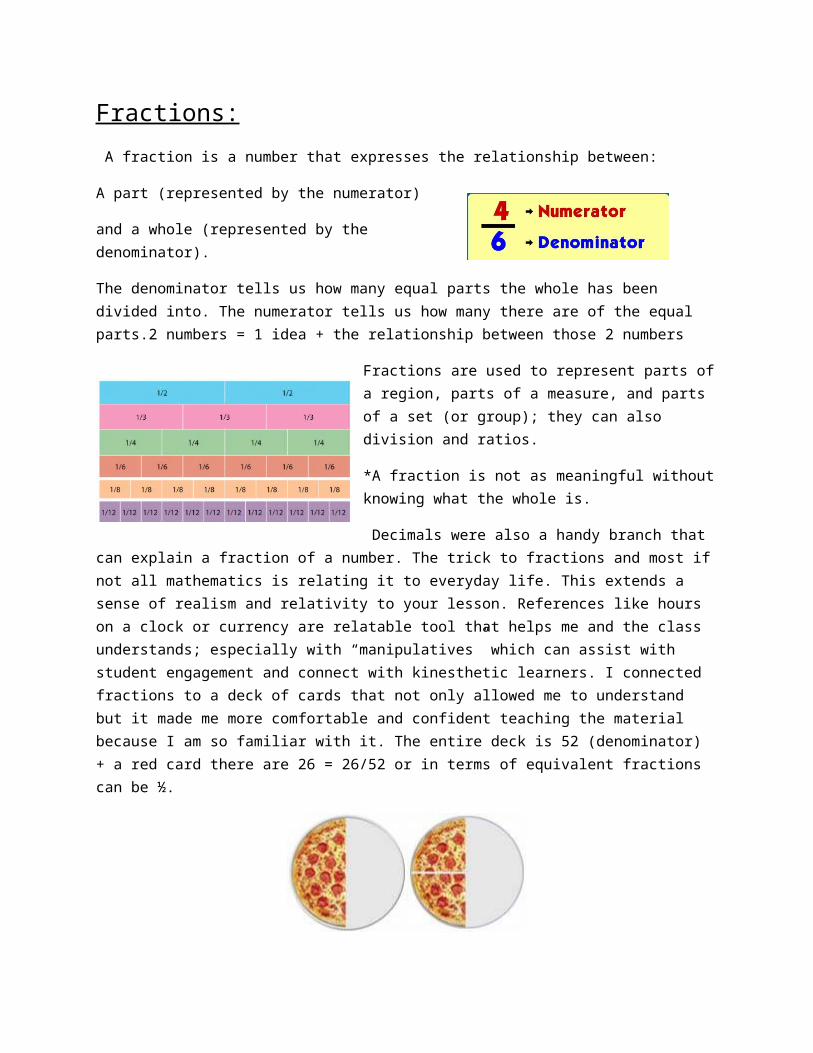
Fractions: A fraction is a number that expresses the relationship between:
A part (represented by the numerator)
and a whole (represented by the denominator).
The denominator tells us how many equal parts the whole has been divided into. The numerator tells us how many there are of the equal parts.2 numbers = 1 idea + the relationship between those 2 numbers
Fractions are used to represent parts of a region, parts of a measure, and parts of a set (or group); they can also division and ratios.
*A fraction is not as meaningful without knowing what the whole is.
Decimals were also a handy branch that can explain a fraction of a number. The trick to fractions and most if not all mathematics is relating it to everyday life. This extends a
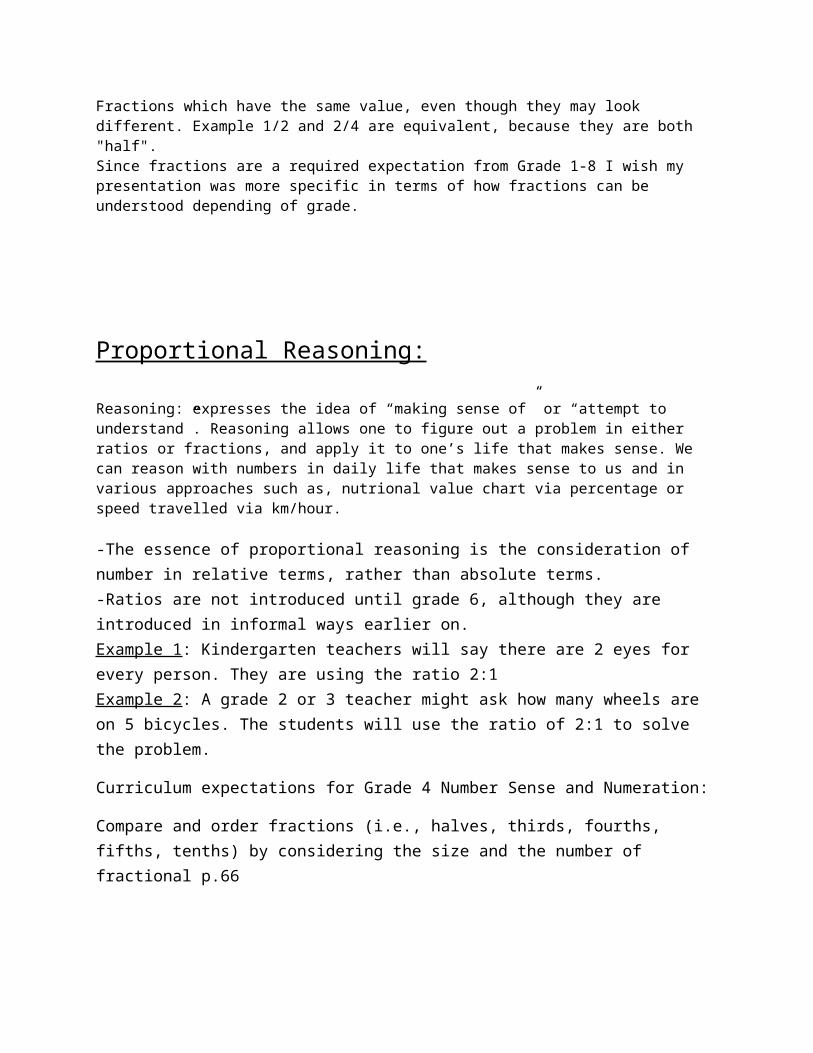
sense of realism and relativity to your lesson. References like hours on a clock or currency are relatable tool that helps me and the class understands; especially with “manipulatives” which can assist with student engagement and connect with kinesthetic learners. I connected fractions to a deck of cards that not only allowed me to understand but it made me more comfortable and confident teaching the material because I am so familiar with it. The entire deck is 52 (denominator) + a red card there are 26 = 26/52 or in terms of equivalent fractions can be ½.
Fractions which have the same value, even though they may look different. Example 1/2 and 2/4 are equivalent, because they are both "half". Since fractions are a required expectation from Grade 1-8 I wish my presentation was more specific in terms of how fractions can be understood depending of grade.
Proportional Reasoning:
Reasoning: expresses the idea of “making sense of” or “attempt to understand”. Reasoning allows one to figure out a problem in either ratios or fractions, and apply it to one’s life that makes sense. We can reason with numbers in daily life that makes sense to us and in various approaches such as, nutrional value chart via percentage or speed travelled via km/hour.
-The essence of proportional reasoning is the consideration of number in relative terms, rather than absolute terms. -Ratios are not introduced until grade 6, although they are introduced in informal ways earlier on. Example 1: Kindergarten teachers will say there are 2 eyes for every person. They are using the ratio 2:1 Example 2: A grade 2 or 3 teacher might ask how many wheels are on 5 bicycles. The students will use the ratio of 2:1 to solve the problem.
Curriculum expectations for Grade 4 Number Sense and Numeration:
Compare and order fractions (i.e., halves, thirds, fourths, fifths, tenths) by considering the size and the number of fractional p.66
Demonstrate an understanding of simple multiplicative relationships involving unit rates, through investigation using concrete materials and drawings p.68
Describe relationships that involve simple whole-number multiplication (e.g.,“If you have 2 marbles and I have 6 marbles, I can say that I have three times the number of marbles you have.”) p.68
Determine and explain, through investigation, the relationship between fractions (i.e., halves, fifths, tenths) and decimals to tenths, using a variety of tools p.68.

Establishing the difference between a fraction and ratio:
Fractions: is a relationship between 2 numbers, the part (numerator) and a whole (denominator).
Ratios: compares any two numbers.
Overall Expectations:
"Demonstrate an understanding of relationships involving percent, ratio and unit rate."
What is a ratio?
A ratio is a way to compare quantities
Example:
Part 1: Pineapples Part 2: Apples
-----------------Total: All the Fruit Together-----------------
Ratio of Pineapples to apples: 2 to 3 , 2:3 , 23
Ratio of Apples to Pineapples: 3 to 2 , 3:2 , 32
Ratio of Pineapples to total amount of fruit: 2 to 5 , 2:5 , 25
Ratio of Apples to total amount of fruit: 3 to 5 , 3:5 , 35

Algebra:
BIG IDEAS: numeric patterns, probability, patterns, consistency, repetition.
Visualize adding, subtracting and multiplying numbers to predict the outcome. To visualize the pattern of numbers or an object growing or shrinking it helps to use fractions and dividing the whole number into parts slowly as a gradual pattern.
Overall Expectations
- Recognize and represent algebraic relationships between a group of numbers- Be able to write an equation representing that relationship
What is Algebra? (Page 620)
Algebra is generalized thinking about numerical relationships and how numbers change. Moving from patterning to algebra is a natural progression. Algebra is essentially associating a relationship rule with a pattern.
Example: Take the pattern 4, 7, 10, 13, 16…
-- Looking at this as a pattern we see the pattern as being adding 3 to each value- Thinking algebraically, we can see it is multiplying its position in the pattern by 3 and adding 1o (3n+1) when n = It’s position in the pattern 3(1)+1 = 4 3(2)+1 = 7
In Algebra it is important to know the difference between variables and constants. Variables are symbols used to represent unknown or changing values used in expressions. Constants are the values in the equation that don’t change.

Algebra is even found in music:

Geometry : When dealing with shapes and spatial relationships it it is crucial to develop to ability to visualize shapes in accordance with geometry. In Chapter 15 of Marian Small’s Making Math Meaningful “seeing is to think” so a major component of geography when understanding prisms and going from 2-D to 3-D objects (nets).
What does it mean to be able to represent a shape?
- By demonstrating that they are able to create or draw a shape, students show that they have visualizations skills and a good grasp of spatial sense.
- Being able to conceptualize a shape and accurately draw it is important for students to understand the relationship between 2-D and 3-D objects.
- A real life example that demonstrates the importance of conceptualizing and representing shapes is an architect who makes blue prints for buildings and needs to understand what those 2-D blue prints will look like when they become 3-D buildings.
Overall Expectations
identify and classify two-dimensional shapes by side and angle properties and compare and sort three-dimensional figure
Specific Expectations
Geometric Propertieso distinguish among polygons, regular polygons, and other two-dimensional shapeso distinguish among prisms, right prisms, pyramids, and other three-dimensional figureso identify and classify acute, right, obtuse, and straight angleso identify triangles (i.e., acute, right, obtuse, scalene, isosceles, equilateral), and classify
them according to angle and side properties
- construct skeletons of three-dimensional figures, using a variety of tools (e.g., straws and modelling clay, toothpicks and marshmallows, Polydrons), and sketch the skeletons (p. 71)
- One term that caught my eye in this chapter is taxonomy, however the only clear definition I seemed to get was from Bloom's Revised Taxonomy: Mathematics. This document describes taxonomy as a classification, grouping, or categorical system that organizes all sectors of math in order for us to think in differently in mathematical problem solving and understand math using several strategies.
- In Geometry when it comes to identifying shapes K-8 students usually begin by exploring 3-D shapes as it is effective way to connect geometry with everyday life. Using Bloom's Taxonomy system seen above we can group together 3-D shapes in relation to comprehension:
- One activity that attracted me was Shape Hunt (Activity 15.3) in Small's Making Math Meaningful because it challenges students find geometric shapes in the classroom, school,
playground and everywhere else in the world. My associate teacher in placement always says when we are doing math is "Math is everywhere!". Yet with 3-D shapes it seemed natural to
dive into polygons from there and transition into sorting and understand the role polygons play

in geometry. This branch off the many factions of math like: polyhedrons, parallelograms, vertex/vertices, angles, quadrilaterals and so on. It is reasonable to assume that a major
component to teaching math is making connection from one unit to many and gather all the chapters of math under one family. In my case it feels like a circus filled with shapes, numbers
and equations that all blend together of all colours and sizes that somehow all come together in perfect harmony.
- Another activity that spoke to is Activity 15.14 which asks students (using van Hiele level to be creative in the arts of drawing in painting in relation to Mondrian and Kandinsky. The exercise may ask the students to include include four different shapes that may represent something from everyday life.
Piet Mondrian, Composition II in Red, Blue and Yellow, 1930. Image.
- Throughout this Chapter I found myself asking myself questions like: what is a polygon? Which I then learned that a polygon is any 2-dimensional shaped formed with straight lines, for example triangles, quadrilaterals, pentagons and hexagons and the name tells you how many sides it has.
Patterning:Overall Expectations:
Describe extend and create a variety of numeric and geometric patterns make predictions related to the patterns, and investigate repeating patterns involving reflections;
Demonstrate and understanding of equality between pairs of expressions, using addition, subtraction and multiplication (73)
Introduction to Patterning:
Core: the shortest part of the pattern that repeats itself

Core
Repeating Patterns are also sometimes described using a letter code ie. AAB
Multi-Attribute Patterns: patterns that contain more than a single attribute ie. color, shape, size etc.
Integers:
Integers start to show up in the Ontario curriculum in Grade 7 and are a part of the Number Sense and Numeration stream. By the end of grade 7 students have the overall expectation to, “represent, compare, and order numbers, including integers,” and also, “demonstrate an understanding of addition and subtraction of fractions and integers, and apply a variety of computational strategies to solve problems involving whole numbers and decimal numbers.” Their specific expectations are to, “represent and order integers, using a variety of tools (e.g., two-colour counters, virtual manipulatives, number lines)” as well as, “add and subtract integers, using a variety of tools (e.g., two-colour counters, virtual manipulatives, number lines).” This activity would ideally be used in grade 7 classrooms, where they are first being introduced to integers and how they can be represented in addition and subtraction.
When adding or subtracting integers with like signs, add and keep the signsWhen adding or subtracting integers with unlike signs, subtract and keep the sign of the higher integers.When subtracting a negative, it turns into a positive and then follows one of the two rules above.
Area + Volume:To find the area of a triangle, multiply the base by the height, and then divide by 2. The division by 2 comes from the fact that a parallelogram can be divided into 2 triangles. For example, in the diagram to the left, the area of each triangle is equal to one-half the area of the parallelogram.
Area is 2-dimensional: it has a length and a width. Area is measured in square units such as square inches, square feet or square meters. To find the area of a rectangle, multiply the length by the width.
Color Pattern: ABC
Shape Pattern: ABB

Using length x width x height formula we can understand a triangle's area, yet to find the volume we multiply the area to the height of the triangle.
Triangle
area = base x height / 2. volume = area of base x height
Square
area = length x width volume = length x width x height
A rectangular prism has three dimensions: length (l), width (w), and height (h). Another way to think about the volume formula is as follows: V = l w h = (l w) h. Since l w is the area of the prism's base, you can think of the volume formula as the area of the base times the height, or V = Bh.
1.
The area of a polygon is the number of square units inside that polygon. Area is 2-dimensional like a carpet or an area rug. A triangle is a three-sided polygon. We will look at several types of triangles in this lesson.
To find the area of a triangle, multiply the base by the height, and then divide by 2. The division by 2 comes from the fact that a parallelogram can be divided into 2 triangles. For example, in the diagram to the left, the area of each triangle is equal to one-half the area of the parallelogram.
Since the area of a parallelogram is , the area of a triangle must be one-half the area of a

parallelogram. Thus, the formula for the area of a triangle is:
or
where is the base, is the height and · means multiply.
The base and height of a triangle must be perpendicular to each other. In each of the examples below, the base is a side of the triangle. However, depending on the triangle, the height may or may not be a side of the triangle. For example, in the right triangle in Example 2, the height is a side of the triangle since it is perpendicular to the base. In the triangles in Examples 1 and 3, the lateral sides are not perpendicular to the base, so a dotted line is drawn to represent the height.
Data Management + Probability:
A bar graph is a diagram in which the numerical values of variables are represented by the height or length of lines or rectangles (bars) of equal width and equal space between them.
What are Mean, Median, and Modes?
Mean = “Average number” or norm Median = The middle value Mode = Most frequent number Range = The difference between the highest and lowest numbers
o Graphs are an easy way to organize data, so it is easy to understandOverall Expectations:
Grade 6: Connect and organize primary data, secondary data and display data using charts and graphs
Grade 7: Compare experimental probabilities with the theoretical probability of two independent events
Specific Expectations:
Collecting and Organizing Data:o Collect data by conducting an experiment/survey
Data Relationships:o Determine through investigation, the effect on a measure (ie. mean, median, mode)
