mathematics data booklet - florida state university · mathematics data booklet spring term 2013...
TRANSCRIPT
MathematicsData Booklet
Spring Term 2013
Quality Enhancement Review
Prepared by the Office of Institutional Research
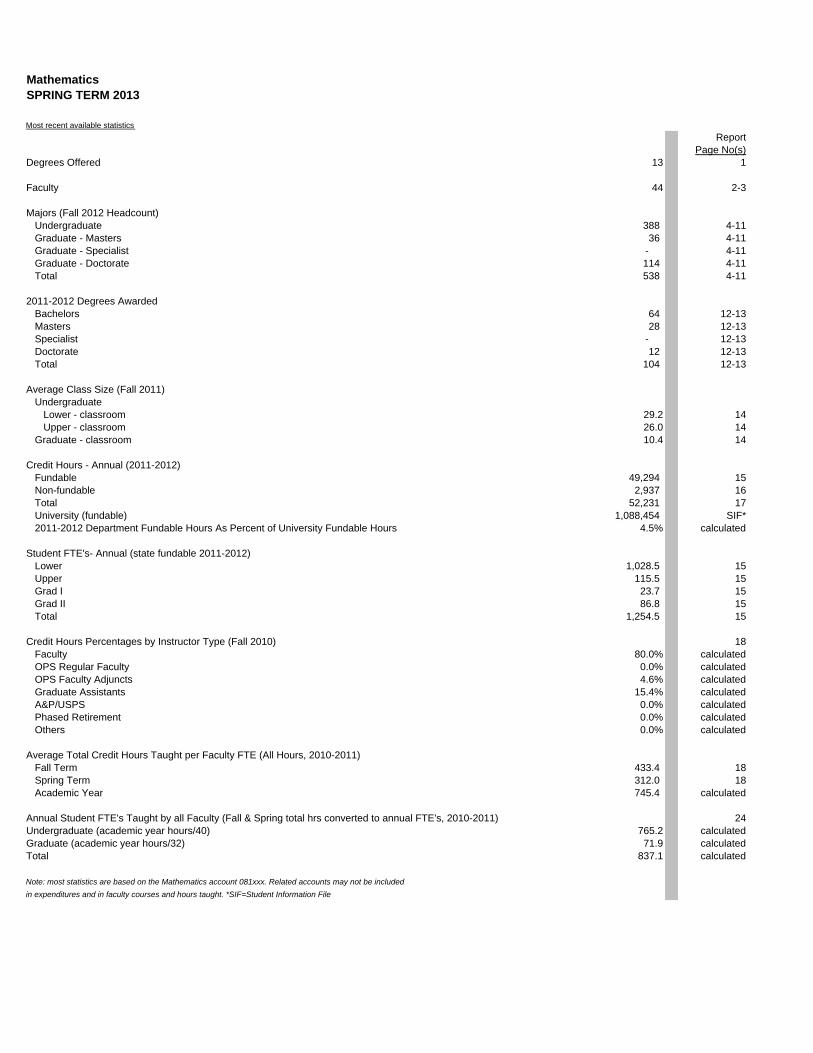
MathematicsSPRING TERM 2013
Most recent available statistics
ReportPage No(s)
Degrees Offered 13 1
Faculty 44 2-3
Majors (Fall 2012 Headcount)Undergraduate 388 4-11Graduate - Masters 36 4-11Graduate - Specialist - 4-11Graduate - Doctorate 114 4-11Total 538 4-11
2011-2012 Degrees AwardedBachelors 64 12-13Masters 28 12-13Specialist - 12-13Doctorate 12 12-13Total 104 12-13
Average Class Size (Fall 2011)Undergraduate
Lower - classroom 29.2 14Upper - classroom 26.0 14
Graduate - classroom 10.4 14
Credit Hours - Annual (2011-2012)Fundable 49,294 15Non-fundable 2,937 16Total 52,231 17University (fundable) 1,088,454 SIF*2011-2012 Department Fundable Hours As Percent of University Fundable Hours 4.5% calculated
Student FTE's- Annual (state fundable 2011-2012)Lower 1,028.5 15Upper 115.5 15Grad I 23.7 15Grad II 86.8 15Total 1,254.5 15
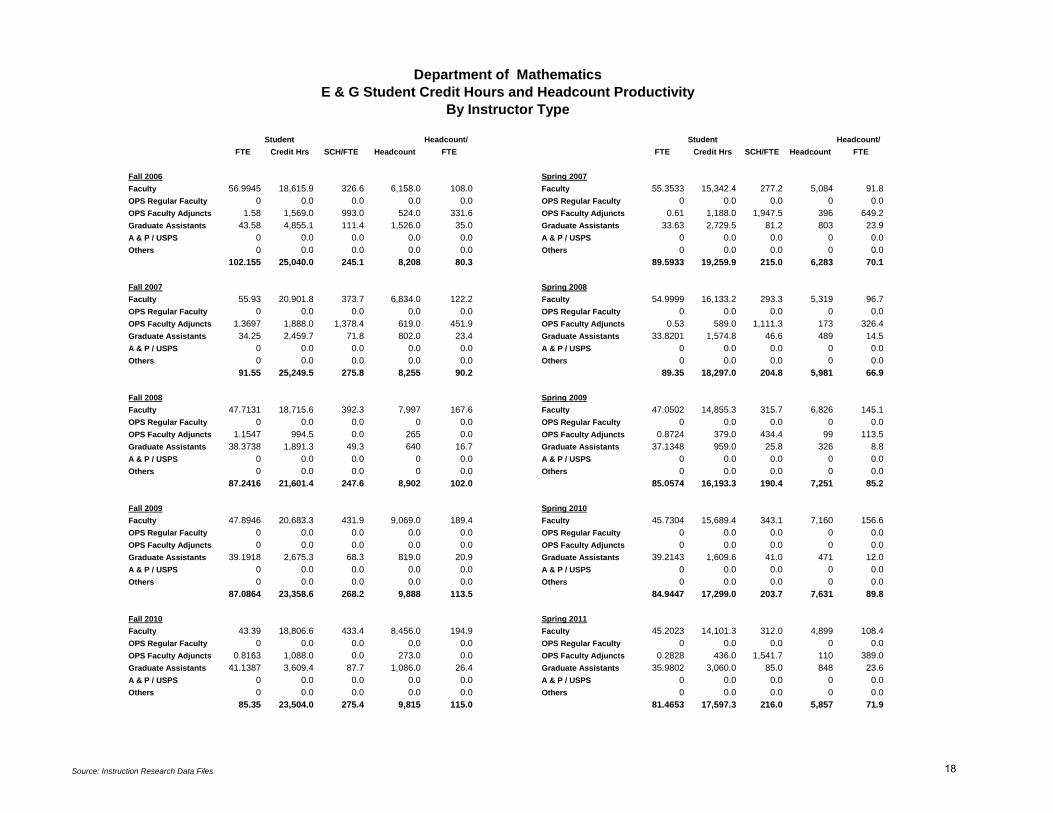
Credit Hours Percentages by Instructor Type (Fall 2010) 18Faculty 80.0% calculatedOPS Regular Faculty 0.0% calculatedOPS Faculty Adjuncts 4.6% calculatedGraduate Assistants 15.4% calculatedA&P/USPS 0.0% calculatedPhased Retirement 0.0% calculatedOthers 0.0% calculated
Average Total Credit Hours Taught per Faculty FTE (All Hours, 2010-2011)Fall Term 433.4 18Spring Term 312.0 18Academic Year 745.4 calculated
Annual Student FTE's Taught by all Faculty (Fall & Spring total hrs converted to annual FTE's, 2010-2011) 24Undergraduate (academic year hours/40) 765.2 calculatedGraduate (academic year hours/32) 71.9 calculatedTotal 837.1 calculated
Note: most statistics are based on the Mathematics account 081xxx. Related accounts may not be included
in expenditures and in faculty courses and hours taught. *SIF=Student Information File
Mathematics Spring Term 2013
Table of Contents
Page Degree Programs ...............................................................................1
The Faculty .........................................................................................2
Enrollment by major ...........................................................................4
Degrees Awarded ........................................................................... 12
Average Class Size ........................................................................ 14
Credit Hours by Semester/Fall & Spring/Annual
Fundable ................................................................................... 15
Non-fundable ............................................................................. 16
Total .......................................................................................... 17
Credit Hours and Courses by Instructor Type ......................................
E&G Detail 2006-07 to 2010-11 ................................................ 18
Faculty Courses and Hours 2006-07 and 2010-11
(Individual Faculty Summary)
2006-07 ..................................................................................... 19
2010-11 ...................................................................................... 22
E&G Budgeted Faculty and Staff Lines .......................................... 25
E&G Expenditures by Summary Object Code ............................... 26
Graduate Admissions ....................................................................... 27
Graduate Student Completion ........................................................... 30

College of Arts and SciencesDepartment of MathematicsDegree Programs
Major Name Major Code CIP Code Degree OfferedMathematics 116810 270101 BachelorsMathematics 116810 270101 MastersMathematics 116810 270101 Doctorate
Major Name Major Code CIP Code Degree OfferedApplied & Computational Mathematics 116811 270101 BachelorsApplied & Computational Mathematics 116811 270101 MastersApplied & Computational Mathematics 116811 270101 Doctorate
Major Name Major Code CIP Code Degree OfferedFinancial Mathematics 116813 270101 MastersFinancial Mathematics 116813 270101 Doctorate
Major Name Major Code CIP Code Degree OfferedBiomathematics 116815 270101 BachelorsBiomathematics 116815 270101 MastersBiomathematics 116815 270101 Doctorate
Major Name Major Code CIP Code Degree OfferedMathematics/FSU-Teach 116816 270101 Bachelors
Major Name Major Code CIP Code Degree OfferedActuarial Science 116820 521304 Bachelors
Source: Degree Program Inventory, FSU and SUS
1
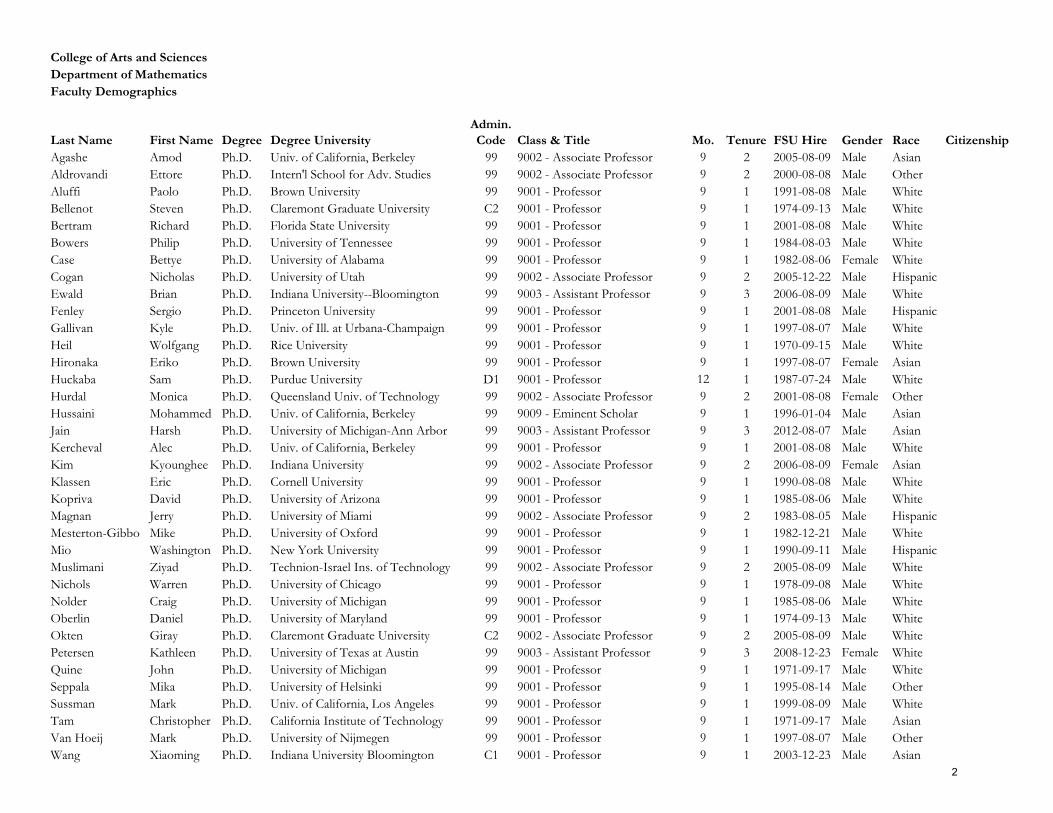
College of Arts and SciencesDepartment of MathematicsFaculty Demographics
Class & Title CitizenshipAgashe Amod Ph.D. Univ. of California, Berkeley 99 9002 - Associate Professor 9 2 2005-08-09 Male AsianAldrovandi Ettore Ph.D. Intern'l School for Adv. Studies 99 9002 - Associate Professor 9 2 2000-08-08 Male OtherAluffi Paolo Ph.D. Brown University 99 9001 - Professor 9 1 1991-08-08 Male WhiteBellenot Steven Ph.D. Claremont Graduate University C2 9001 - Professor 9 1 1974-09-13 Male WhiteBertram Richard Ph.D. Florida State University 99 9001 - Professor 9 1 2001-08-08 Male WhiteBowers Philip Ph.D. University of Tennessee 99 9001 - Professor 9 1 1984-08-03 Male WhiteCase Bettye Ph.D. University of Alabama 99 9001 - Professor 9 1 1982-08-06 Female WhiteCogan Nicholas Ph.D. University of Utah 99 9002 - Associate Professor 9 2 2005-12-22 Male HispanicEwald Brian Ph.D. Indiana University--Bloomington 99 9003 - Assistant Professor 9 3 2006-08-09 Male WhiteFenley Sergio Ph.D. Princeton University 99 9001 - Professor 9 1 2001-08-08 Male HispanicGallivan Kyle Ph.D. Univ. of Ill. at Urbana-Champaign 99 9001 - Professor 9 1 1997-08-07 Male WhiteHeil Wolfgang Ph.D. Rice University 99 9001 - Professor 9 1 1970-09-15 Male WhiteHironaka Eriko Ph.D. Brown University 99 9001 - Professor 9 1 1997-08-07 Female AsianHuckaba Sam Ph.D. Purdue University D1 9001 - Professor 12 1 1987-07-24 Male WhiteHurdal Monica Ph.D. Queensland Univ. of Technology 99 9002 - Associate Professor 9 2 2001-08-08 Female OtherHussaini Mohammed Ph.D. Univ. of California, Berkeley 99 9009 - Eminent Scholar 9 1 1996-01-04 Male AsianJain Harsh Ph.D. University of Michigan-Ann Arbor 99 9003 - Assistant Professor 9 3 2012-08-07 Male AsianKercheval Alec Ph.D. Univ. of California, Berkeley 99 9001 - Professor 9 1 2001-08-08 Male WhiteKim Kyounghee Ph.D. Indiana University 99 9002 - Associate Professor 9 2 2006-08-09 Female AsianKlassen Eric Ph.D. Cornell University 99 9001 - Professor 9 1 1990-08-08 Male WhiteKopriva David Ph.D. University of Arizona 99 9001 - Professor 9 1 1985-08-06 Male WhiteMagnan Jerry Ph.D. University of Miami 99 9002 - Associate Professor 9 2 1983-08-05 Male HispanicMesterton-Gibbo Mike Ph.D. University of Oxford 99 9001 - Professor 9 1 1982-12-21 Male WhiteMio Washington Ph.D. New York University 99 9001 - Professor 9 1 1990-09-11 Male HispanicMuslimani Ziyad Ph.D. Technion-Israel Ins. of Technology 99 9002 - Associate Professor 9 2 2005-08-09 Male WhiteNichols Warren Ph.D. University of Chicago 99 9001 - Professor 9 1 1978-09-08 Male WhiteNolder Craig Ph.D. University of Michigan 99 9001 - Professor 9 1 1985-08-06 Male WhiteOberlin Daniel Ph.D. University of Maryland 99 9001 - Professor 9 1 1974-09-13 Male WhiteOkten Giray Ph.D. Claremont Graduate University C2 9002 - Associate Professor 9 2 2005-08-09 Male WhitePetersen Kathleen Ph.D. University of Texas at Austin 99 9003 - Assistant Professor 9 3 2008-12-23 Female WhiteQuine John Ph.D. University of Michigan 99 9001 - Professor 9 1 1971-09-17 Male WhiteSeppala Mika Ph.D. University of Helsinki 99 9001 - Professor 9 1 1995-08-14 Male OtherSussman Mark Ph.D. Univ. of California, Los Angeles 99 9001 - Professor 9 1 1999-08-09 Male WhiteTam Christopher Ph.D. California Institute of Technology 99 9001 - Professor 9 1 1971-09-17 Male AsianVan Hoeij Mark Ph.D. University of Nijmegen 99 9001 - Professor 9 1 1997-08-07 Male OtherWang Xiaoming Ph.D. Indiana University Bloomington C1 9001 - Professor 9 1 2003-12-23 Male Asian
Gender RaceLast Name First Name Degree Degree University FSU HireTenureMo.Admin. Code
2

College of Arts and SciencesDepartment of MathematicsFaculty Demographics
Class & Title CitizenshipGender RaceLast Name First Name Degree Degree University FSU HireTenureMo.Admin. Code
Dodaro Kenneth MS Rensselaer Polytechnic Institute 99 9181 - Research Associate 3 Male WhiteGrigorian Ishkhan MS Iowa State University 99 9120 - Associate In 3 Male WhiteHarris Angie MS University of Colorado-Boulder 99 9121 - Assistant In 3 Female WhiteKirby Penelope Ph.D. Florida State University N1 9115 - Coordinator 3 Female WhiteKutter Mary Ph.D. Florida State University 99 9120 - Associate In 3 Female WhiteLeNoir Penny Ph.D. North Carolina State University 99 9121 - Assistant In 3 Female WhiteParis Steve Ph.D. Louisiana State University N1 9115 - Coordinator 3 Male WhiteSubramanian Vijay MS Florida State University 99 9121 - Assistant In 3 Male Asian
Administrative Codes: Tenure Codes: Last Updated on October 17, 2012C1 - Chair 1 - TenuredC2 - Associate Chair 2 - Tenure-EarningD1 - Dean 3 - Non-TenuredN1 - Coordinator99 - No Administrative Duties
3
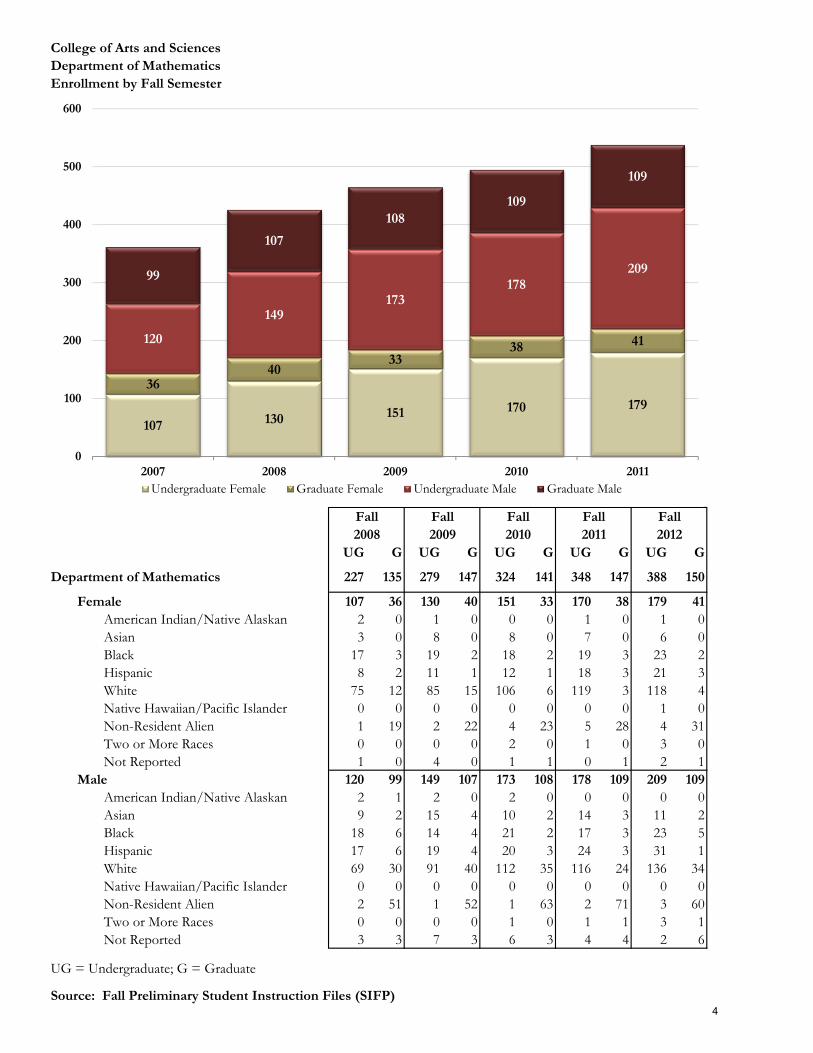
College of Arts and SciencesDepartment of MathematicsEnrollment by Fall Semester
UG G UG G UG G UG G UG G
Department of Mathematics 227 135 279 147 324 141 348 147 388 150
Female 107 36 130 40 151 33 170 38 179 41American Indian/Native Alaskan 2 0 1 0 0 0 1 0 1 0Asian 3 0 8 0 8 0 7 0 6 0Black 17 3 19 2 18 2 19 3 23 2Hispanic 8 2 11 1 12 1 18 3 21 3White 75 12 85 15 106 6 119 3 118 4Native Hawaiian/Pacific Islander 0 0 0 0 0 0 0 0 1 0Non-Resident Alien 1 19 2 22 4 23 5 28 4 31Two or More Races 0 0 0 0 2 0 1 0 3 0Not Reported 1 0 4 0 1 1 0 1 2 1
Male 120 99 149 107 173 108 178 109 209 109American Indian/Native Alaskan 2 1 2 0 2 0 0 0 0 0Asian 9 2 15 4 10 2 14 3 11 2Black 18 6 14 4 21 2 17 3 23 5Hispanic 17 6 19 4 20 3 24 3 31 1White 69 30 91 40 112 35 116 24 136 34Native Hawaiian/Pacific Islander 0 0 0 0 0 0 0 0 0 0Non-Resident Alien 2 51 1 52 1 63 2 71 3 60Two or More Races 0 0 0 0 1 0 1 1 3 1Not Reported 3 3 7 3 6 3 4 4 2 6
UG = Undergraduate; G = Graduate
Source: Fall Preliminary Student Instruction Files (SIFP)
2008 2009 2010 2011 2012Fall Fall Fall Fall Fall
107 130 151 170 179
3640
3338 41120
149173
17820999
107
108109
109
0
100
200
300
400
500
600
2007 2008 2009 2010 2011Undergraduate Female Graduate Female Undergraduate Male Graduate Male
4
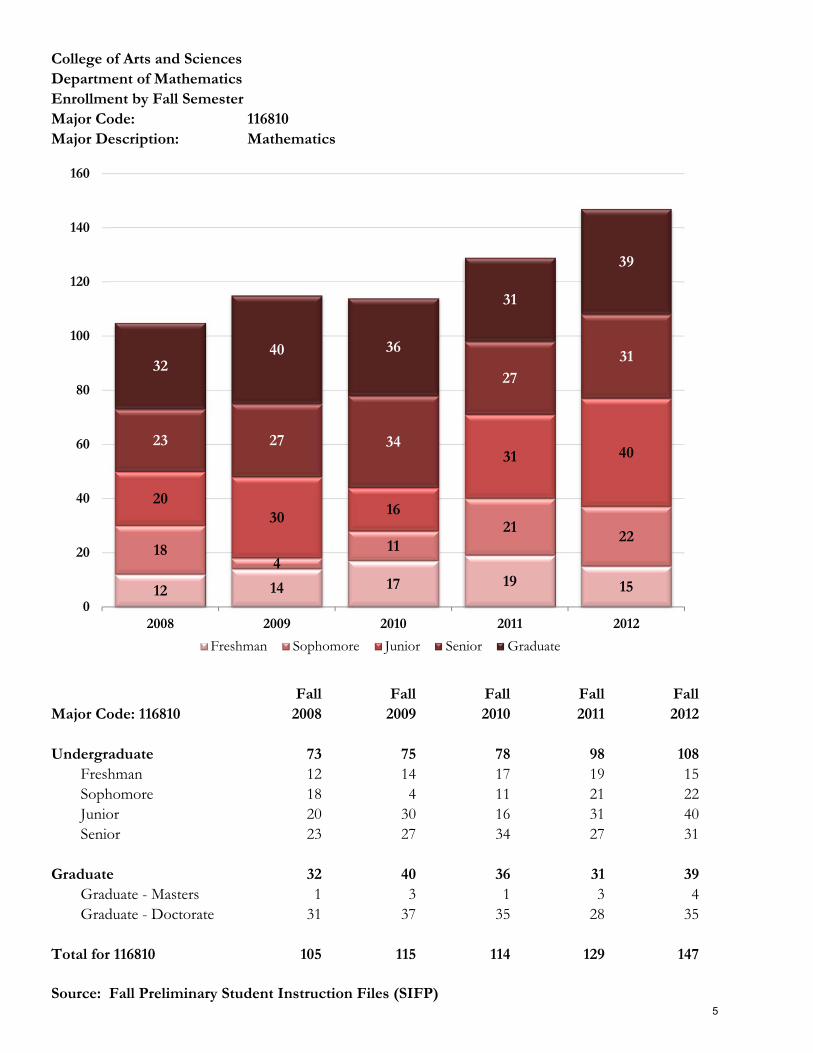
College of Arts and SciencesDepartment of MathematicsEnrollment by Fall SemesterMajor Code: 116810Major Description: Mathematics
Fall Fall Fall Fall FallMajor Code: 116810 2008 2009 2010 2011 2012
Undergraduate 73 75 78 98 108Freshman 12 14 17 19 15Sophomore 18 4 11 21 22Junior 20 30 16 31 40Senior 23 27 34 27 31
Graduate 32 40 36 31 39Graduate - Masters 1 3 1 3 4Graduate - Doctorate 31 37 35 28 35
Total for 116810 105 115 114 129 147
Source: Fall Preliminary Student Instruction Files (SIFP)
12 14 17 19 15
184
1121
22
2030 16
31 4023 27 34
2731
3240 36
31
39
0
20
40
60
80
100
120
140
160
2008 2009 2010 2011 2012
Freshman Sophomore Junior Senior Graduate
5
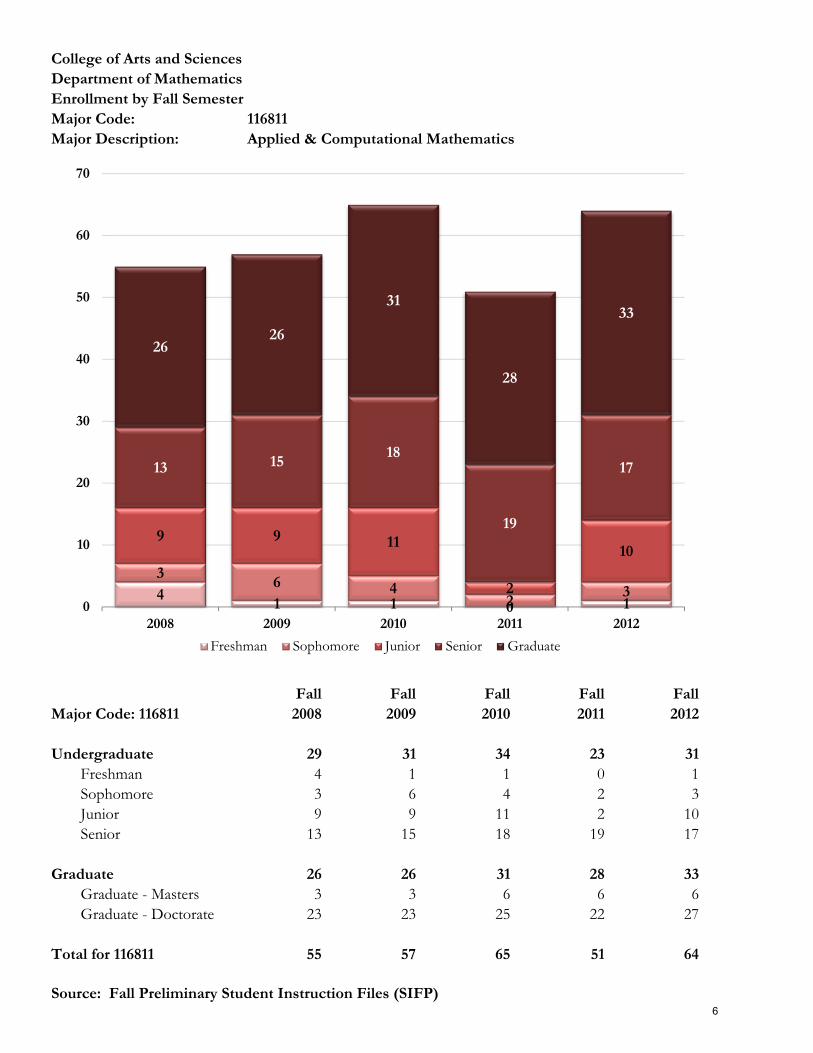
College of Arts and SciencesDepartment of MathematicsEnrollment by Fall SemesterMajor Code: 116811Major Description: Applied & Computational Mathematics
Fall Fall Fall Fall FallMajor Code: 116811 2008 2009 2010 2011 2012
Undergraduate 29 31 34 23 31Freshman 4 1 1 0 1Sophomore 3 6 4 2 3Junior 9 9 11 2 10Senior 13 15 18 19 17
Graduate 26 26 31 28 33Graduate - Masters 3 3 6 6 6Graduate - Doctorate 23 23 25 22 27
Total for 116811 55 57 65 51 64
Source: Fall Preliminary Student Instruction Files (SIFP)
41 1 0 1
36 4
23
9 9 11
2
10
13 1518
19
17
2626
31
28
33
0
10
20
30
40
50
60
70
2008 2009 2010 2011 2012
Freshman Sophomore Junior Senior Graduate
6
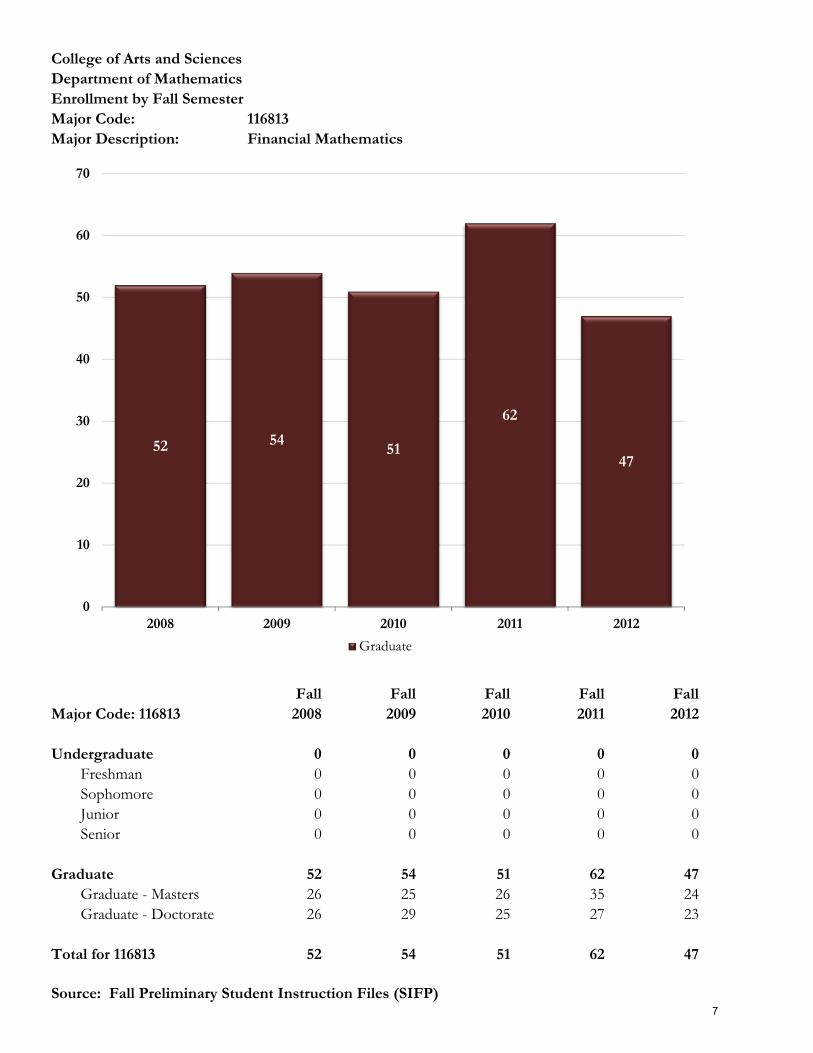
College of Arts and SciencesDepartment of MathematicsEnrollment by Fall SemesterMajor Code: 116813Major Description: Financial Mathematics
Fall Fall Fall Fall FallMajor Code: 116813 2008 2009 2010 2011 2012
Undergraduate 0 0 0 0 0Freshman 0 0 0 0 0Sophomore 0 0 0 0 0Junior 0 0 0 0 0Senior 0 0 0 0 0
Graduate 52 54 51 62 47Graduate - Masters 26 25 26 35 24Graduate - Doctorate 26 29 25 27 23
Total for 116813 52 54 51 62 47
Source: Fall Preliminary Student Instruction Files (SIFP)
52 5451
62
47
0
10
20
30
40
50
60
70
2008 2009 2010 2011 2012
Graduate
7

College of Arts and SciencesDepartment of MathematicsEnrollment by Fall SemesterMajor Code: 116814Major Description: Biomedical Mathematics
Fall Fall Fall Fall FallMajor Code: 116814 2008 2009 2010 2011 2012
Undergraduate 5Freshman 2Sophomore 3JuniorSenior
GraduateGraduate - MastersGraduate - Doctorate
Total for 116814 5
Source: Fall Preliminary Student Instruction Files (SIFP)
2
3
0
1
2
3
4
5
6
2008 2009 2010 2011 2012
Freshman Sophomore Junior Senior Graduate
8
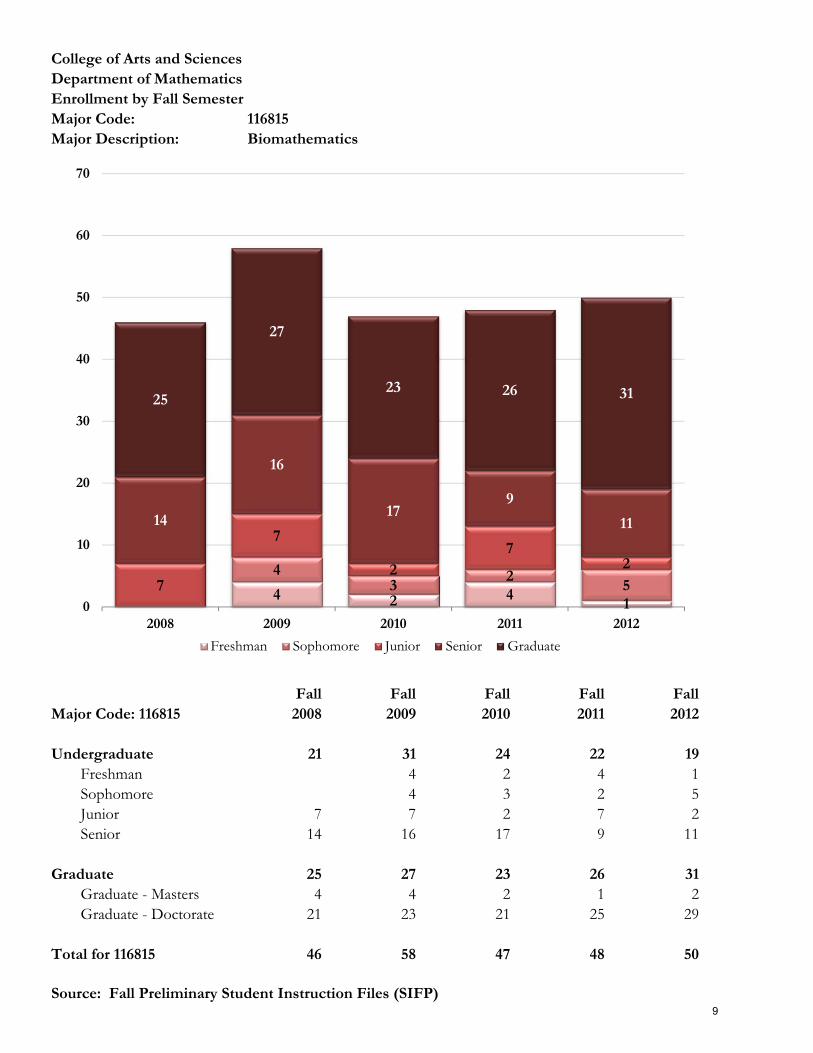
College of Arts and SciencesDepartment of MathematicsEnrollment by Fall SemesterMajor Code: 116815Major Description: Biomathematics
Fall Fall Fall Fall FallMajor Code: 116815 2008 2009 2010 2011 2012
Undergraduate 21 31 24 22 19Freshman 4 2 4 1Sophomore 4 3 2 5Junior 7 7 2 7 2Senior 14 16 17 9 11
Graduate 25 27 23 26 31Graduate - Masters 4 4 2 1 2Graduate - Doctorate 21 23 21 25 29
Total for 116815 46 58 47 48 50
Source: Fall Preliminary Student Instruction Files (SIFP)
4 2 41
43
257
7
27
2
14
16
179
11
25
27
23 26 31
0
10
20
30
40
50
60
70
2008 2009 2010 2011 2012
Freshman Sophomore Junior Senior Graduate
9

College of Arts and SciencesDepartment of MathematicsEnrollment by Fall SemesterMajor Code: 116816Major Description: Mathematics/FSU-Teach
Fall Fall Fall Fall FallMajor Code: 116816 2008 2009 2010 2011 2012
Undergraduate 2 43 69 71 65Freshman 2 13 13 11 8Sophomore 18 19 10 10Junior 7 24 17 14Senior 5 13 33 33
Graduate 0 0 0 0 0Graduate - MastersGraduate - Doctorate
Total for 116816 2 43 69 71 65
Source: Fall Preliminary Student Instruction Files (SIFP)
2
13 13 11 8
18 19
1010
7
24
17
14
5
13
33
33
0
10
20
30
40
50
60
70
80
2008 2009 2010 2011 2012
Freshman Sophomore Junior Senior
10
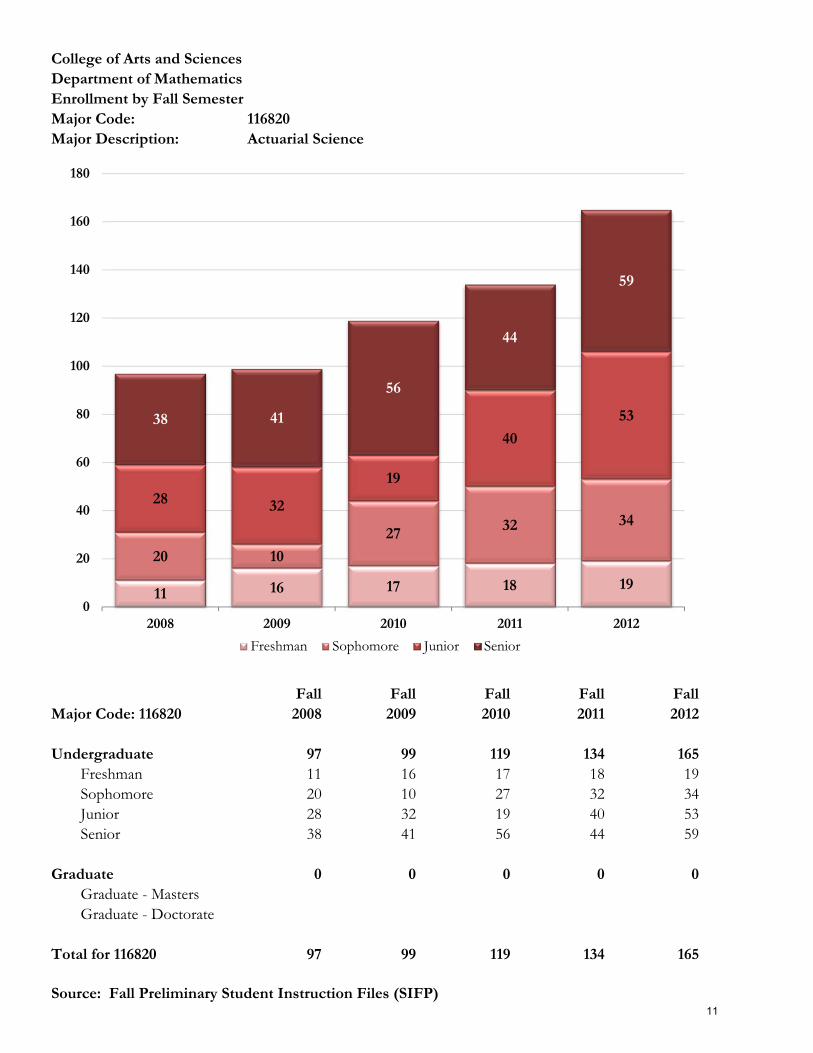
College of Arts and SciencesDepartment of MathematicsEnrollment by Fall SemesterMajor Code: 116820Major Description: Actuarial Science
Fall Fall Fall Fall FallMajor Code: 116820 2008 2009 2010 2011 2012
Undergraduate 97 99 119 134 165Freshman 11 16 17 18 19Sophomore 20 10 27 32 34Junior 28 32 19 40 53Senior 38 41 56 44 59
Graduate 0 0 0 0 0Graduate - MastersGraduate - Doctorate
Total for 116820 97 99 119 134 165
Source: Fall Preliminary Student Instruction Files (SIFP)
11 16 17 18 19
20 10
27 32 3428 32
19
40
5338 41
56
44
59
0
20
40
60
80
100
120
140
160
180
2008 2009 2010 2011 2012
Freshman Sophomore Junior Senior
11

College of Arts and SciencesDepartment of MathematicsDegrees Awarded by SemesterCIP Code: 270101
Bachelors Masters Doctorate Total2007-08 Summer '07 2 13 3 18
Fall '07 6 2 3 11Spring '08 13 8 3 24
2007-08 Total 21 23 9 53
2008-09 Summer '08 4 9 2 15Fall '08 7 2 5 14Spring '09 15 14 0 29
2008-09 Total 26 25 7 58
2009-10 Summer '09 6 15 3 24Fall '09 7 7 3 17Spring '10 13 30 2 45
2009-10 Total 26 52 8 86
2010-11 Summer '10 6 6 5 17Fall '10 10 6 1 17Spring '11 28 29 8 65
2010-11 Total 44 41 14 99
2011-12 Summer '11 3 3 4 10Fall '11 11 12 2 25Spring '12 22 13 6 41
2011-12 Total 36 28 12 76
Source: Final Student Instruction Files (SIF) except spring 2012 (Candidate for Degree file)
21 26 26
4436
2325
52
41
2897
8
14
12
0
20
40
60
80
100
120
2007-08 2008-09 2009-10 2010-11 2011-12
Bachelors Masters Doctorate
12

College of Arts and SciencesDepartment of MathematicsDegrees Awarded by SemesterCIP Code: 521304
Bachelors Masters Doctorate Total2007-08 Summer '07 2 2
Fall '07 7 7Spring '08 9 9
2007-08 Total 18 0 0 18
2008-09 Summer '08 5 5Fall '08 8 8Spring '09 13 13
2008-09 Total 26 0 0 26
2009-10 Summer '09 3 3Fall '09 7 7Spring '10 13 13
2009-10 Total 23 0 0 23
2010-11 Summer '10 3 3Fall '10 7 7Spring '11 12 12
2010-11 Total 22 0 0 22
2011-12 Summer '11 8 8Fall '11 9 9Spring '12 11 11
2011-12 Total 28 0 0 28
Source: Final Student Instruction Files (SIF) except spring 2012 (Candidate for Degree file)
18
2623 22
28
0
5
10
15
20
25
30
2007-08 2008-09 2009-10 2010-11 2011-12
Bachelors
13

College of Arts and SciencesDepartment of MathematicsAverage Class Size
TermCourse Classification Enrolled
Number of Sections
Class Size Enrolled
Number of Sections
Class Size Enrolled
Number of Sections
Class Size
Fall 2007 Lower 7,470 254 29.4 152 5 30.4Upper 568 21 27.0Graduate 334 38 8.8 66 10 6.6Total 8,372 313 26.7 66 10 6.6 152 5 30.4
Fall 2008 Lower 6,101 218 28.0 142 4 35.5Upper 575 24 24.0Graduate 346 34 10.2 81 8 10.1Total 7,022 276 25.4 81 8 10.1 142 4 35.5
Fall 2009 Lower 6,704 245 27.4 155 5 31.0Upper 630 25 25.2Graduate 320 35 9.1 82 12 6.8Total 7,654 305 25.1 82 12 6.8 155 5 31.0
Fall 2010 Lower 6,644 230 28.9 164 5 32.8Upper 639 26 24.6Graduate 303 30 10.1 88 11 8.0Total 7,586 286 26.5 88 11 8.0 164 5 32.8
Fall 2011 Lower 6,868 235 29.2 204 6 34.0Upper 675 26 26.0Graduate 374 36 10.4 95 13 7.3Total 7,917 297 26.7 95 13 7.3 204 6 34.0
Source: Fall Final Student Instruction Files
Class Lecture Discussion Laboratory
0
5
10
15
20
25
30
35
40
Fall 2007 Fall 2008 Fall 2009 Fall 2010 Fall 2011
Class Lecture Discussion Laboratory
14

College of Arts and SciencesDepartment of MathematicsFundable Student Credit Hours and FTE
Fundable SCH Produced Annual Fundable FTE Contribution
Summer 2007 2008 2009 2010 2011 Summer 2007 2008 2009 2010 2011Lower 5,140 4,730 4,750 5,287 5,053 Lower 128.5 118.3 118.8 132.2 126.3Upper 515 662 723 664 839 Upper 12.9 16.6 18.1 16.6 21.0Grad I 243 199 206 37 65 Grad I 7.6 6.2 6.4 1.2 2.0Grad II 404 424 478 652 642 Grad II 12.6 13.3 14.9 20.4 20.1Total 6,302 6,015 6,157 6,640 6,599 Total 161.6 154.3 158.2 170.3 169.4
Fall 2007 2008 2009 2010 2011 Fall 2007 2008 2009 2010 2011Lower 22,418 18,730 20,212 20,507 20,765 Lower 560.5 468.3 505.3 512.7 519.1Upper 1,725 1,769 1,946 1,942 2,062 Upper 43.1 44.2 48.7 48.6 51.6Grad I 546 567 557 281 348 Grad I 17.1 17.7 17.4 8.8 10.9Grad II 609 692 664 955 1,052 Grad II 19.0 21.6 20.8 29.8 32.9Total 25,298 21,758 23,379 23,685 24,227 Total 639.7 551.8 592.1 599.9 614.4
Spring 2008 2009 2010 2011 2012 Spring 2008 2009 2010 2011 2012Lower 15,779 13,491 14,576 15,076 15,321 Lower 394.5 337.3 364.4 376.9 383.0Upper 1,247 1,268 1,575 1,497 1,717 Upper 31.2 31.7 39.4 37.4 42.9Grad I 465 538 503 278 346 Grad I 14.5 16.8 15.7 8.7 10.8Grad II 806 809 707 885 1084 Grad II 25.2 25.3 22.1 27.7 33.9Total 18,297 16,106 17,361 17,736 18,468 Total 465.4 411.1 441.6 450.7 470.6
Annual 2007-08 2008-09 2009-10 2010-11 2011-12 Annual 2007-08 2008-09 2009-10 2010-11 2011-12Lower 43,337 36,951 39,538 40,870 41,139 Lower 1,083.4 923.8 988.5 1,021.8 1,028.5Upper 3,487 3,699 4,244 4,103 4,618 Upper 87.2 92.5 106.1 102.6 115.5Grad I 1,254 1,304 1,266 596 759 Grad I 39.2 40.8 39.6 18.6 23.7Grad II 1,819 1,925 1,849 2,492 2,778 Grad II 56.8 60.2 57.8 77.9 86.8Total 49,897 43,879 46,897 48,061 49,294 Total 1,266.6 1,117.2 1,191.9 1,220.8 1,254.5
Note: Lower and Upper hours are divided by 40 to obtain annual FTE; for all Graduate, hours are divided by 32Source: Final Student Instruction Files (SIF)
1,083.4923.8 988.5 1,021.8 1,028.5
87.2
92.5106.1 102.6 115.5
96.0
100.997.3 96.5 110.5
0
200
400
600
800
1,000
1,200
1,400
2007-08 2008-09 2009-10 2010-11 2011-12
An
nu
al F
un
dab
le F
TE
Lower Upper Graduate
15
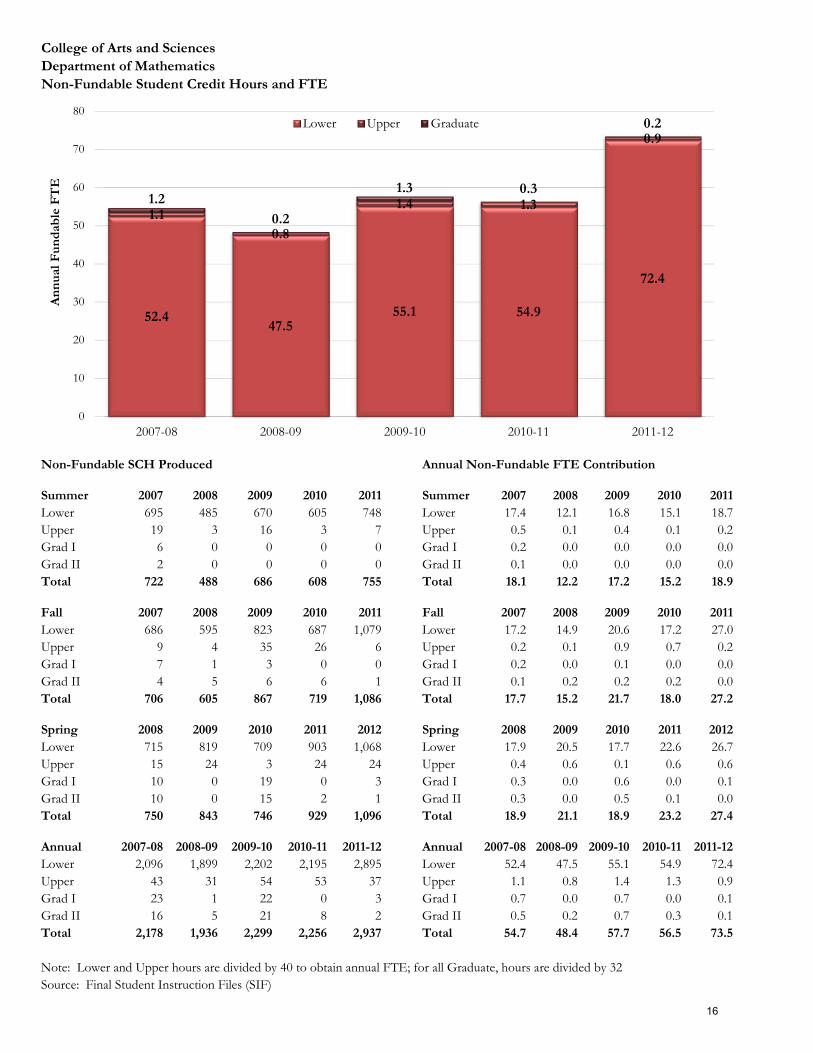
College of Arts and SciencesDepartment of MathematicsNon-Fundable Student Credit Hours and FTE
Non-Fundable SCH Produced Annual Non-Fundable FTE Contribution
Summer 2007 2008 2009 2010 2011 Summer 2007 2008 2009 2010 2011Lower 695 485 670 605 748 Lower 17.4 12.1 16.8 15.1 18.7Upper 19 3 16 3 7 Upper 0.5 0.1 0.4 0.1 0.2Grad I 6 0 0 0 0 Grad I 0.2 0.0 0.0 0.0 0.0Grad II 2 0 0 0 0 Grad II 0.1 0.0 0.0 0.0 0.0Total 722 488 686 608 755 Total 18.1 12.2 17.2 15.2 18.9
Fall 2007 2008 2009 2010 2011 Fall 2007 2008 2009 2010 2011Lower 686 595 823 687 1,079 Lower 17.2 14.9 20.6 17.2 27.0Upper 9 4 35 26 6 Upper 0.2 0.1 0.9 0.7 0.2Grad I 7 1 3 0 0 Grad I 0.2 0.0 0.1 0.0 0.0Grad II 4 5 6 6 1 Grad II 0.1 0.2 0.2 0.2 0.0Total 706 605 867 719 1,086 Total 17.7 15.2 21.7 18.0 27.2
Spring 2008 2009 2010 2011 2012 Spring 2008 2009 2010 2011 2012Lower 715 819 709 903 1,068 Lower 17.9 20.5 17.7 22.6 26.7Upper 15 24 3 24 24 Upper 0.4 0.6 0.1 0.6 0.6Grad I 10 0 19 0 3 Grad I 0.3 0.0 0.6 0.0 0.1Grad II 10 0 15 2 1 Grad II 0.3 0.0 0.5 0.1 0.0Total 750 843 746 929 1,096 Total 18.9 21.1 18.9 23.2 27.4
Annual 2007-08 2008-09 2009-10 2010-11 2011-12 Annual 2007-08 2008-09 2009-10 2010-11 2011-12Lower 2,096 1,899 2,202 2,195 2,895 Lower 52.4 47.5 55.1 54.9 72.4Upper 43 31 54 53 37 Upper 1.1 0.8 1.4 1.3 0.9Grad I 23 1 22 0 3 Grad I 0.7 0.0 0.7 0.0 0.1Grad II 16 5 21 8 2 Grad II 0.5 0.2 0.7 0.3 0.1Total 2,178 1,936 2,299 2,256 2,937 Total 54.7 48.4 57.7 56.5 73.5
Note: Lower and Upper hours are divided by 40 to obtain annual FTE; for all Graduate, hours are divided by 32Source: Final Student Instruction Files (SIF)
52.447.5
55.1 54.9
72.4
1.10.8
1.4 1.3
0.9
1.2
0.2
1.3 0.3
0.2
0
10
20
30
40
50
60
70
80
2007-08 2008-09 2009-10 2010-11 2011-12
An
nu
al F
un
dab
le F
TE
Lower Upper Graduate
16
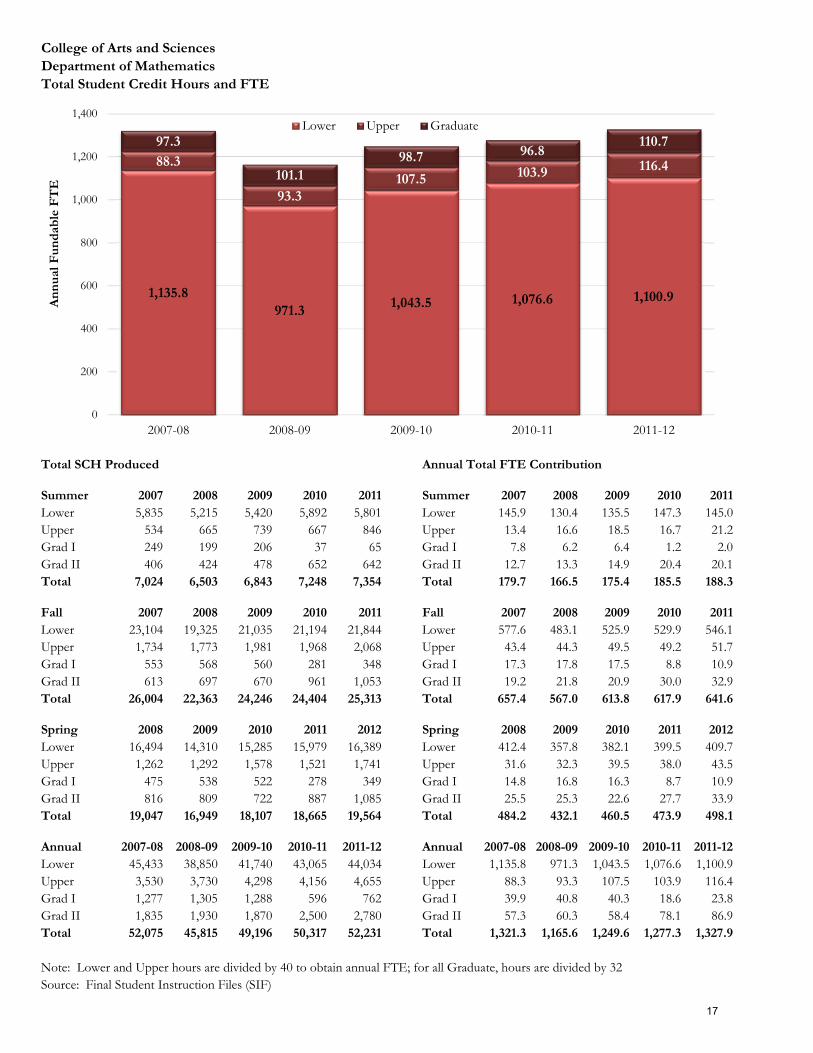
College of Arts and SciencesDepartment of MathematicsTotal Student Credit Hours and FTE
Total SCH Produced Annual Total FTE Contribution
Summer 2007 2008 2009 2010 2011 Summer 2007 2008 2009 2010 2011Lower 5,835 5,215 5,420 5,892 5,801 Lower 145.9 130.4 135.5 147.3 145.0Upper 534 665 739 667 846 Upper 13.4 16.6 18.5 16.7 21.2Grad I 249 199 206 37 65 Grad I 7.8 6.2 6.4 1.2 2.0Grad II 406 424 478 652 642 Grad II 12.7 13.3 14.9 20.4 20.1Total 7,024 6,503 6,843 7,248 7,354 Total 179.7 166.5 175.4 185.5 188.3
Fall 2007 2008 2009 2010 2011 Fall 2007 2008 2009 2010 2011Lower 23,104 19,325 21,035 21,194 21,844 Lower 577.6 483.1 525.9 529.9 546.1Upper 1,734 1,773 1,981 1,968 2,068 Upper 43.4 44.3 49.5 49.2 51.7Grad I 553 568 560 281 348 Grad I 17.3 17.8 17.5 8.8 10.9Grad II 613 697 670 961 1,053 Grad II 19.2 21.8 20.9 30.0 32.9Total 26,004 22,363 24,246 24,404 25,313 Total 657.4 567.0 613.8 617.9 641.6
Spring 2008 2009 2010 2011 2012 Spring 2008 2009 2010 2011 2012Lower 16,494 14,310 15,285 15,979 16,389 Lower 412.4 357.8 382.1 399.5 409.7Upper 1,262 1,292 1,578 1,521 1,741 Upper 31.6 32.3 39.5 38.0 43.5Grad I 475 538 522 278 349 Grad I 14.8 16.8 16.3 8.7 10.9Grad II 816 809 722 887 1,085 Grad II 25.5 25.3 22.6 27.7 33.9Total 19,047 16,949 18,107 18,665 19,564 Total 484.2 432.1 460.5 473.9 498.1
Annual 2007-08 2008-09 2009-10 2010-11 2011-12 Annual 2007-08 2008-09 2009-10 2010-11 2011-12Lower 45,433 38,850 41,740 43,065 44,034 Lower 1,135.8 971.3 1,043.5 1,076.6 1,100.9Upper 3,530 3,730 4,298 4,156 4,655 Upper 88.3 93.3 107.5 103.9 116.4Grad I 1,277 1,305 1,288 596 762 Grad I 39.9 40.8 40.3 18.6 23.8Grad II 1,835 1,930 1,870 2,500 2,780 Grad II 57.3 60.3 58.4 78.1 86.9Total 52,075 45,815 49,196 50,317 52,231 Total 1,321.3 1,165.6 1,249.6 1,277.3 1,327.9
Note: Lower and Upper hours are divided by 40 to obtain annual FTE; for all Graduate, hours are divided by 32Source: Final Student Instruction Files (SIF)
1,135.8971.3 1,043.5 1,076.6 1,100.9
88.3
93.3107.5 103.9 116.4
97.3
101.198.7 96.8
110.7
0
200
400
600
800
1,000
1,200
1,400
2007-08 2008-09 2009-10 2010-11 2011-12
An
nu
al F
un
dab
le F
TE
Lower Upper Graduate
17
Source: Instruction Research Data Files.
Department of MathematicsE & G Student Credit Hours and Headcount Productivity
By Instructor Type
Student Headcount/ Student Headcount/
FTE Credit Hrs SCH/FTE Headcount FTE FTE Credit Hrs SCH/FTE Headcount FTE
Fall 2006 Spring 2007
Faculty 56.9945 18,615.9 326.6 6,158.0 108.0 Faculty 55.3533 15,342.4 277.2 5,084 91.8OPS Regular Faculty 0 0.0 0.0 0.0 0.0 OPS Regular Faculty 0 0.0 0.0 0 0.0OPS Faculty Adjuncts 1.58 1,569.0 993.0 524.0 331.6 OPS Faculty Adjuncts 0.61 1,188.0 1,947.5 396 649.2Graduate Assistants 43.58 4,855.1 111.4 1,526.0 35.0 Graduate Assistants 33.63 2,729.5 81.2 803 23.9A & P / USPS 0 0.0 0.0 0.0 0.0 A & P / USPS 0 0.0 0.0 0 0.0Others 0 0.0 0.0 0.0 0.0 Others 0 0.0 0.0 0 0.0
102.155 25,040.0 245.1 8,208 80.3 89.5933 19,259.9 215.0 6,283 70.1
Fall 2007 Spring 2008
Faculty 55.93 20,901.8 373.7 6,834.0 122.2 Faculty 54.9999 16,133.2 293.3 5,319 96.7OPS Regular Faculty 0 0.0 0.0 0.0 0.0 OPS Regular Faculty 0 0.0 0.0 0 0.0OPS Faculty Adjuncts 1.3697 1,888.0 1,378.4 619.0 451.9 OPS Faculty Adjuncts 0.53 589.0 1,111.3 173 326.4Graduate Assistants 34.25 2,459.7 71.8 802.0 23.4 Graduate Assistants 33.8201 1,574.8 46.6 489 14.5A & P / USPS 0 0.0 0.0 0.0 0.0 A & P / USPS 0 0.0 0.0 0 0.0Others 0 0.0 0.0 0.0 0.0 Others 0 0.0 0.0 0 0.0
91.55 25,249.5 275.8 8,255 90.2 89.35 18,297.0 204.8 5,981 66.9
Fall 2008 Spring 2009
Faculty 47.7131 18,715.6 392.3 7,997 167.6 Faculty 47.0502 14,855.3 315.7 6,826 145.1OPS Regular Faculty 0 0.0 0.0 0 0.0 OPS Regular Faculty 0 0.0 0.0 0 0.0OPS Faculty Adjuncts 1.1547 994.5 0.0 265 0.0 OPS Faculty Adjuncts 0.8724 379.0 434.4 99 113.5Graduate Assistants 38.3738 1,891.3 49.3 640 16.7 Graduate Assistants 37.1348 959.0 25.8 326 8.8A & P / USPS 0 0.0 0.0 0 0.0 A & P / USPS 0 0.0 0.0 0 0.0Others 0 0.0 0.0 0 0.0 Others 0 0.0 0.0 0 0.0
87.2416 21,601.4 247.6 8,902 102.0 85.0574 16,193.3 190.4 7,251 85.2
Fall 2009 Spring 2010
Faculty 47.8946 20,683.3 431.9 9,069.0 189.4 Faculty 45.7304 15,689.4 343.1 7,160 156.6OPS Regular Faculty 0 0.0 0.0 0.0 0.0 OPS Regular Faculty 0 0.0 0.0 0 0.0OPS Faculty Adjuncts 0 0.0 0.0 0.0 0.0 OPS Faculty Adjuncts 0 0.0 0.0 0 0.0Graduate Assistants 39.1918 2,675.3 68.3 819.0 20.9 Graduate Assistants 39.2143 1,609.6 41.0 471 12.0A & P / USPS 0 0.0 0.0 0.0 0.0 A & P / USPS 0 0.0 0.0 0 0.0Others 0 0.0 0.0 0.0 0.0 Others 0 0.0 0.0 0 0.0
87.0864 23,358.6 268.2 9,888 113.5 84.9447 17,299.0 203.7 7,631 89.8
Fall 2010 Spring 2011
Faculty 43.39 18,806.6 433.4 8,456.0 194.9 Faculty 45.2023 14,101.3 312.0 4,899 108.4OPS Regular Faculty 0 0.0 0.0 0.0 0.0 OPS Regular Faculty 0 0.0 0.0 0 0.0OPS Faculty Adjuncts 0.8163 1,088.0 0.0 273.0 0.0 OPS Faculty Adjuncts 0.2828 436.0 1,541.7 110 389.0Graduate Assistants 41.1387 3,609.4 87.7 1,086.0 26.4 Graduate Assistants 35.9802 3,060.0 85.0 848 23.6A & P / USPS 0 0.0 0.0 0.0 0.0 A & P / USPS 0 0.0 0.0 0 0.0Others 0 0.0 0.0 0.0 0.0 Others 0 0.0 0.0 0 0.0
85.35 23,504.0 275.4 9,815 115.0 81.4653 17,597.3 216.0 5,857 71.9
18
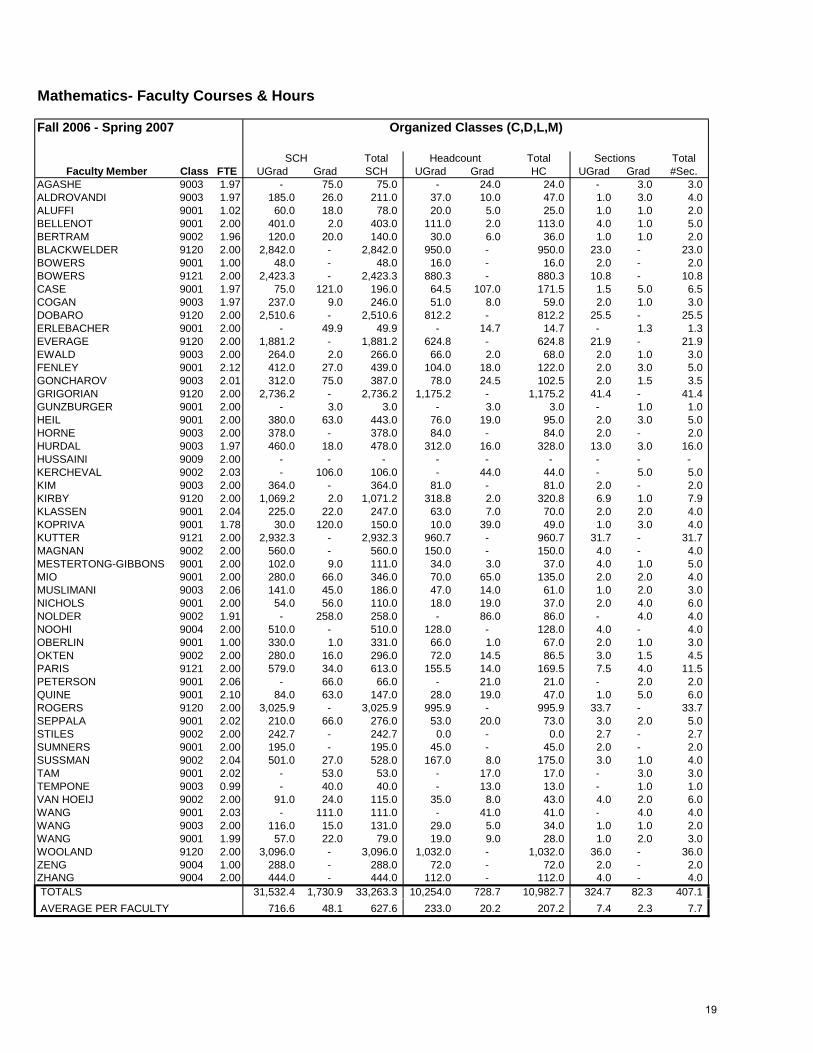
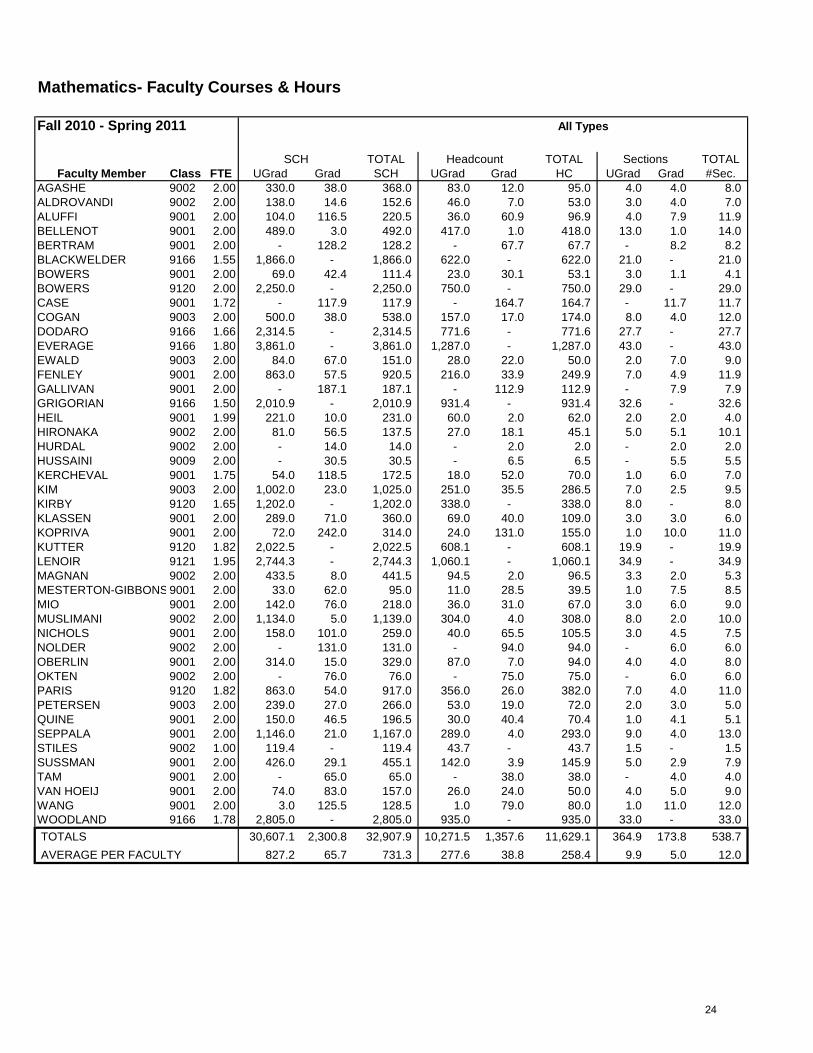
Mathematics- Faculty Courses & Hours
Fall 2006 - Spring 2007 Organized Classes (C,D,L,M)
SCH Total Headcount Total Sections TotalFaculty Member Class FTE UGrad Grad SCH UGrad Grad HC UGrad Grad #Sec.
AGASHE 9003 1.97 - 75.0 75.0 - 24.0 24.0 - 3.0 3.0 ALDROVANDI 9003 1.97 185.0 26.0 211.0 37.0 10.0 47.0 1.0 3.0 4.0 ALUFFI 9001 1.02 60.0 18.0 78.0 20.0 5.0 25.0 1.0 1.0 2.0 BELLENOT 9001 2.00 401.0 2.0 403.0 111.0 2.0 113.0 4.0 1.0 5.0 BERTRAM 9002 1.96 120.0 20.0 140.0 30.0 6.0 36.0 1.0 1.0 2.0 BLACKWELDER 9120 2.00 2,842.0 - 2,842.0 950.0 - 950.0 23.0 - 23.0 BOWERS 9001 1.00 48.0 - 48.0 16.0 - 16.0 2.0 - 2.0 BOWERS 9121 2.00 2,423.3 - 2,423.3 880.3 - 880.3 10.8 - 10.8 CASE 9001 1.97 75.0 121.0 196.0 64.5 107.0 171.5 1.5 5.0 6.5 COGAN 9003 1.97 237.0 9.0 246.0 51.0 8.0 59.0 2.0 1.0 3.0 DOBARO 9120 2.00 2,510.6 - 2,510.6 812.2 - 812.2 25.5 - 25.5 ERLEBACHER 9001 2.00 - 49.9 49.9 - 14.7 14.7 - 1.3 1.3 EVERAGE 9120 2.00 1,881.2 - 1,881.2 624.8 - 624.8 21.9 - 21.9 EWALD 9003 2.00 264.0 2.0 266.0 66.0 2.0 68.0 2.0 1.0 3.0 FENLEY 9001 2.12 412.0 27.0 439.0 104.0 18.0 122.0 2.0 3.0 5.0 GONCHAROV 9003 2.01 312.0 75.0 387.0 78.0 24.5 102.5 2.0 1.5 3.5 GRIGORIAN 9120 2.00 2,736.2 - 2,736.2 1,175.2 - 1,175.2 41.4 - 41.4 GUNZBURGER 9001 2.00 - 3.0 3.0 - 3.0 3.0 - 1.0 1.0 HEIL 9001 2.00 380.0 63.0 443.0 76.0 19.0 95.0 2.0 3.0 5.0 HORNE 9003 2.00 378.0 - 378.0 84.0 - 84.0 2.0 - 2.0 HURDAL 9003 1.97 460.0 18.0 478.0 312.0 16.0 328.0 13.0 3.0 16.0 HUSSAINI 9009 2.00 - - - - - - - - - KERCHEVAL 9002 2.03 - 106.0 106.0 - 44.0 44.0 - 5.0 5.0 KIM 9003 2.00 364.0 - 364.0 81.0 - 81.0 2.0 - 2.0 KIRBY 9120 2.00 1,069.2 2.0 1,071.2 318.8 2.0 320.8 6.9 1.0 7.9 KLASSEN 9001 2.04 225.0 22.0 247.0 63.0 7.0 70.0 2.0 2.0 4.0 KOPRIVA 9001 1.78 30.0 120.0 150.0 10.0 39.0 49.0 1.0 3.0 4.0 KUTTER 9121 2.00 2,932.3 - 2,932.3 960.7 - 960.7 31.7 - 31.7 MAGNAN 9002 2.00 560.0 - 560.0 150.0 - 150.0 4.0 - 4.0 MESTERTONG-GIBBONS 9001 2.00 102.0 9.0 111.0 34.0 3.0 37.0 4.0 1.0 5.0 MIO 9001 2.00 280.0 66.0 346.0 70.0 65.0 135.0 2.0 2.0 4.0 MUSLIMANI 9003 2.06 141.0 45.0 186.0 47.0 14.0 61.0 1.0 2.0 3.0 NICHOLS 9001 2.00 54.0 56.0 110.0 18.0 19.0 37.0 2.0 4.0 6.0 NOLDER 9002 1.91 - 258.0 258.0 - 86.0 86.0 - 4.0 4.0 NOOHI 9004 2.00 510.0 - 510.0 128.0 - 128.0 4.0 - 4.0 OBERLIN 9001 1.00 330.0 1.0 331.0 66.0 1.0 67.0 2.0 1.0 3.0 OKTEN 9002 2.00 280.0 16.0 296.0 72.0 14.5 86.5 3.0 1.5 4.5 PARIS 9121 2.00 579.0 34.0 613.0 155.5 14.0 169.5 7.5 4.0 11.5 PETERSON 9001 2.06 - 66.0 66.0 - 21.0 21.0 - 2.0 2.0 QUINE 9001 2.10 84.0 63.0 147.0 28.0 19.0 47.0 1.0 5.0 6.0 ROGERS 9120 2.00 3,025.9 - 3,025.9 995.9 - 995.9 33.7 - 33.7 SEPPALA 9001 2.02 210.0 66.0 276.0 53.0 20.0 73.0 3.0 2.0 5.0 STILES 9002 2.00 242.7 - 242.7 0.0 - 0.0 2.7 - 2.7 SUMNERS 9001 2.00 195.0 - 195.0 45.0 - 45.0 2.0 - 2.0 SUSSMAN 9002 2.04 501.0 27.0 528.0 167.0 8.0 175.0 3.0 1.0 4.0 TAM 9001 2.02 - 53.0 53.0 - 17.0 17.0 - 3.0 3.0 TEMPONE 9003 0.99 - 40.0 40.0 - 13.0 13.0 - 1.0 1.0 VAN HOEIJ 9002 2.00 91.0 24.0 115.0 35.0 8.0 43.0 4.0 2.0 6.0 WANG 9001 2.03 - 111.0 111.0 - 41.0 41.0 - 4.0 4.0 WANG 9003 2.00 116.0 15.0 131.0 29.0 5.0 34.0 1.0 1.0 2.0 WANG 9001 1.99 57.0 22.0 79.0 19.0 9.0 28.0 1.0 2.0 3.0 WOOLAND 9120 2.00 3,096.0 - 3,096.0 1,032.0 - 1,032.0 36.0 - 36.0 ZENG 9004 1.00 288.0 - 288.0 72.0 - 72.0 2.0 - 2.0 ZHANG 9004 2.00 444.0 - 444.0 112.0 - 112.0 4.0 - 4.0 TOTALS 31,532.4 1,730.9 33,263.3 10,254.0 728.7 10,982.7 324.7 82.3 407.1
AVERAGE PER FACULTY 716.6 48.1 627.6 233.0 20.2 207.2 7.4 2.3 7.7
19
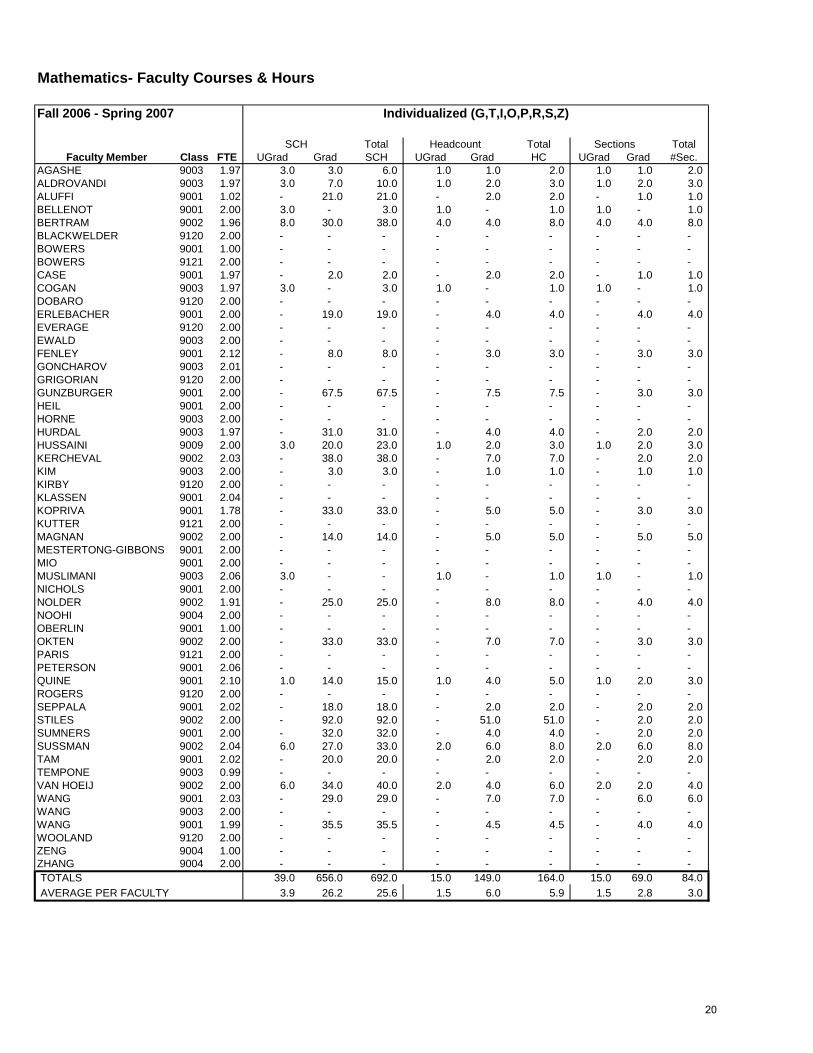
Mathematics- Faculty Courses & Hours
Fall 2006 - Spring 2007 Individualized (G,T,I,O,P,R,S,Z)
SCH Total Headcount Total Sections TotalFaculty Member Class FTE UGrad Grad SCH UGrad Grad HC UGrad Grad #Sec.
AGASHE 9003 1.97 3.0 3.0 6.0 1.0 1.0 2.0 1.0 1.0 2.0 ALDROVANDI 9003 1.97 3.0 7.0 10.0 1.0 2.0 3.0 1.0 2.0 3.0 ALUFFI 9001 1.02 - 21.0 21.0 - 2.0 2.0 - 1.0 1.0 BELLENOT 9001 2.00 3.0 - 3.0 1.0 - 1.0 1.0 - 1.0 BERTRAM 9002 1.96 8.0 30.0 38.0 4.0 4.0 8.0 4.0 4.0 8.0 BLACKWELDER 9120 2.00 - - - - - - - - - BOWERS 9001 1.00 - - - - - - - - - BOWERS 9121 2.00 - - - - - - - - - CASE 9001 1.97 - 2.0 2.0 - 2.0 2.0 - 1.0 1.0 COGAN 9003 1.97 3.0 - 3.0 1.0 - 1.0 1.0 - 1.0 DOBARO 9120 2.00 - - - - - - - - - ERLEBACHER 9001 2.00 - 19.0 19.0 - 4.0 4.0 - 4.0 4.0 EVERAGE 9120 2.00 - - - - - - - - - EWALD 9003 2.00 - - - - - - - - - FENLEY 9001 2.12 - 8.0 8.0 - 3.0 3.0 - 3.0 3.0 GONCHAROV 9003 2.01 - - - - - - - - - GRIGORIAN 9120 2.00 - - - - - - - - - GUNZBURGER 9001 2.00 - 67.5 67.5 - 7.5 7.5 - 3.0 3.0 HEIL 9001 2.00 - - - - - - - - - HORNE 9003 2.00 - - - - - - - - - HURDAL 9003 1.97 - 31.0 31.0 - 4.0 4.0 - 2.0 2.0 HUSSAINI 9009 2.00 3.0 20.0 23.0 1.0 2.0 3.0 1.0 2.0 3.0 KERCHEVAL 9002 2.03 - 38.0 38.0 - 7.0 7.0 - 2.0 2.0 KIM 9003 2.00 - 3.0 3.0 - 1.0 1.0 - 1.0 1.0 KIRBY 9120 2.00 - - - - - - - - - KLASSEN 9001 2.04 - - - - - - - - - KOPRIVA 9001 1.78 - 33.0 33.0 - 5.0 5.0 - 3.0 3.0 KUTTER 9121 2.00 - - - - - - - - - MAGNAN 9002 2.00 - 14.0 14.0 - 5.0 5.0 - 5.0 5.0 MESTERTONG-GIBBONS 9001 2.00 - - - - - - - - - MIO 9001 2.00 - - - - - - - - - MUSLIMANI 9003 2.06 3.0 - - 1.0 - 1.0 1.0 - 1.0 NICHOLS 9001 2.00 - - - - - - - - - NOLDER 9002 1.91 - 25.0 25.0 - 8.0 8.0 - 4.0 4.0 NOOHI 9004 2.00 - - - - - - - - - OBERLIN 9001 1.00 - - - - - - - - - OKTEN 9002 2.00 - 33.0 33.0 - 7.0 7.0 - 3.0 3.0 PARIS 9121 2.00 - - - - - - - - - PETERSON 9001 2.06 - - - - - - - - - QUINE 9001 2.10 1.0 14.0 15.0 1.0 4.0 5.0 1.0 2.0 3.0 ROGERS 9120 2.00 - - - - - - - - - SEPPALA 9001 2.02 - 18.0 18.0 - 2.0 2.0 - 2.0 2.0 STILES 9002 2.00 - 92.0 92.0 - 51.0 51.0 - 2.0 2.0 SUMNERS 9001 2.00 - 32.0 32.0 - 4.0 4.0 - 2.0 2.0 SUSSMAN 9002 2.04 6.0 27.0 33.0 2.0 6.0 8.0 2.0 6.0 8.0 TAM 9001 2.02 - 20.0 20.0 - 2.0 2.0 - 2.0 2.0 TEMPONE 9003 0.99 - - - - - - - - - VAN HOEIJ 9002 2.00 6.0 34.0 40.0 2.0 4.0 6.0 2.0 2.0 4.0 WANG 9001 2.03 - 29.0 29.0 - 7.0 7.0 - 6.0 6.0 WANG 9003 2.00 - - - - - - - - - WANG 9001 1.99 - 35.5 35.5 - 4.5 4.5 - 4.0 4.0 WOOLAND 9120 2.00 - - - - - - - - - ZENG 9004 1.00 - - - - - - - - - ZHANG 9004 2.00 - - - - - - - - - TOTALS 39.0 656.0 692.0 15.0 149.0 164.0 15.0 69.0 84.0
AVERAGE PER FACULTY 3.9 26.2 25.6 1.5 6.0 5.9 1.5 2.8 3.0
20

Mathematics- Faculty Courses & Hours
Fall 2006 - Spring 2007 All Types
SCH TOTAL Headcount TOTAL Sections TOTALFaculty Member Class FTE UGrad Grad SCH UGrad Grad HC UGrad Grad #Sec.
AGASHE 9003 1.97 3.0 78.0 81.0 1.0 25.0 26.0 1.0 4.0 5.0 ALDROVANDI 9003 1.97 188.0 33.0 221.0 38.0 12.0 50.0 2.0 5.0 7.0 ALUFFI 9001 1.02 60.0 39.0 99.0 20.0 7.0 27.0 1.0 2.0 3.0 BELLENOT 9001 2.00 404.0 2.0 406.0 112.0 2.0 114.0 5.0 1.0 6.0 BERTRAM 9002 1.96 128.0 50.0 178.0 34.0 10.0 44.0 5.0 5.0 10.0 BLACKWELDER 9120 2.00 2,842.0 - 2,842.0 950.0 - 950.0 23.0 - 23.0 BOWERS 9001 1.00 48.0 - 48.0 16.0 - 16.0 2.0 - 2.0 BOWERS 9121 2.00 2,423.3 - 2,423.3 880.3 - 880.3 10.8 - 10.8 CASE 9001 1.97 75.0 123.0 198.0 64.5 109.0 173.5 1.5 6.0 7.5 COGAN 9003 1.97 240.0 9.0 249.0 52.0 8.0 60.0 3.0 1.0 4.0 DOBARO 9120 2.00 2,510.6 - 2,510.6 812.2 - 812.2 25.5 - 25.5 ERLEBACHER 9001 2.00 - 68.9 68.9 - 18.7 18.7 - 5.3 5.3 EVERAGE 9120 2.00 1,881.2 - 1,881.2 624.8 - 624.8 21.9 - 21.9 EWALD 9003 2.00 264.0 2.0 266.0 66.0 2.0 68.0 2.0 1.0 3.0 FENLEY 9001 2.12 412.0 35.0 447.0 104.0 21.0 125.0 2.0 6.0 8.0 GONCHAROV 9003 2.01 312.0 75.0 387.0 78.0 24.5 102.5 2.0 1.5 3.5 GRIGORIAN 9120 2.00 2,736.2 - 2,736.2 1,175.2 - 1,175.2 41.4 - 41.4 GUNZBURGER 9001 2.00 - 70.5 70.5 - 10.5 10.5 - 4.0 4.0 HEIL 9001 2.00 380.0 63.0 443.0 76.0 19.0 95.0 2.0 3.0 5.0 HORNE 9003 2.00 378.0 - 378.0 84.0 - 84.0 2.0 - 2.0 HURDAL 9003 1.97 460.0 49.0 509.0 312.0 20.0 332.0 13.0 5.0 18.0 HUSSAINI 9009 2.00 3.0 20.0 23.0 1.0 2.0 3.0 1.0 2.0 3.0 KERCHEVAL 9002 2.03 - 144.0 144.0 - 51.0 51.0 - 7.0 7.0 KIM 9003 2.00 364.0 3.0 367.0 81.0 1.0 82.0 2.0 1.0 3.0 KIRBY 9120 2.00 1,069.2 2.0 1,071.2 318.8 2.0 320.8 6.9 1.0 7.9 KLASSEN 9001 2.04 225.0 22.0 247.0 63.0 7.0 70.0 2.0 2.0 4.0 KOPRIVA 9001 1.78 30.0 153.0 183.0 10.0 44.0 54.0 1.0 6.0 7.0 KUTTER 9121 2.00 2,932.3 - 2,932.3 960.7 - 960.7 31.7 - 31.7 MAGNAN 9002 2.00 560.0 14.0 574.0 150.0 5.0 155.0 4.0 5.0 9.0 MESTERTONG-GIBBONS 9001 2.00 102.0 9.0 111.0 34.0 3.0 37.0 4.0 1.0 5.0 MIO 9001 2.00 280.0 66.0 346.0 70.0 65.0 135.0 2.0 2.0 4.0 MUSLIMANI 9003 2.06 144.0 45.0 189.0 48.0 14.0 62.0 2.0 2.0 4.0 NICHOLS 9001 2.00 54.0 56.0 110.0 18.0 19.0 37.0 2.0 4.0 6.0 NOLDER 9002 1.91 - 283.0 283.0 - 94.0 94.0 - 8.0 8.0 NOOHI 9004 2.00 510.0 - 510.0 128.0 - 128.0 4.0 - 4.0 OBERLIN 9001 1.00 330.0 1.0 331.0 66.0 1.0 67.0 2.0 1.0 3.0 OKTEN 9002 2.00 280.0 49.0 329.0 72.0 21.5 93.5 3.0 4.5 7.5 PARIS 9121 2.00 579.0 34.0 613.0 155.5 14.0 169.5 7.5 4.0 11.5 PETERSON 9001 2.06 - 66.0 66.0 - 21.0 21.0 - 2.0 2.0 QUINE 9001 2.10 85.0 77.0 162.0 29.0 23.0 52.0 2.0 7.0 9.0 ROGERS 9120 2.00 3,025.9 - 3,025.9 995.9 - 995.9 33.7 - 33.7 SEPPALA 9001 2.02 210.0 84.0 294.0 53.0 22.0 75.0 3.0 4.0 7.0 STILES 9002 2.00 242.7 92.0 334.7 0.0 51.0 51.0 2.7 2.0 4.7 SUMNERS 9001 2.00 195.0 32.0 227.0 45.0 4.0 49.0 2.0 2.0 4.0 SUSSMAN 9002 2.04 507.0 54.0 561.0 169.0 14.0 183.0 5.0 7.0 12.0 TAM 9001 2.02 - 73.0 73.0 - 19.0 19.0 - 5.0 5.0 TEMPONE 9003 0.99 - 40.0 40.0 - 13.0 13.0 - 1.0 1.0 VAN HOEIJ 9002 2.00 97.0 58.0 155.0 37.0 12.0 49.0 6.0 4.0 10.0 WANG 9001 2.03 - 140.0 140.0 - 48.0 48.0 - 10.0 10.0 WANG 9003 2.00 116.0 15.0 131.0 29.0 5.0 34.0 1.0 1.0 2.0 WANG 9001 1.99 57.0 57.5 114.5 19.0 13.5 32.5 1.0 6.0 7.0 WOOLAND 9120 2.00 3,096.0 - 3,096.0 1,032.0 - 1,032.0 36.0 - 36.0 ZENG 9004 1.00 288.0 - 288.0 72.0 - 72.0 2.0 - 2.0 ZHANG 9004 2.00 444.0 - 444.0 112.0 - 112.0 4.0 - 4.0
TOTALS 31,571.4 2,386.9 33,958.3 10,269.0 877.7 11,146.7 339.7 151.3 491.1
AVERAGE PER FACULTY 686.3 58.2 628.9 223.2 21.4 206.4 7.4 3.7 9.1
21
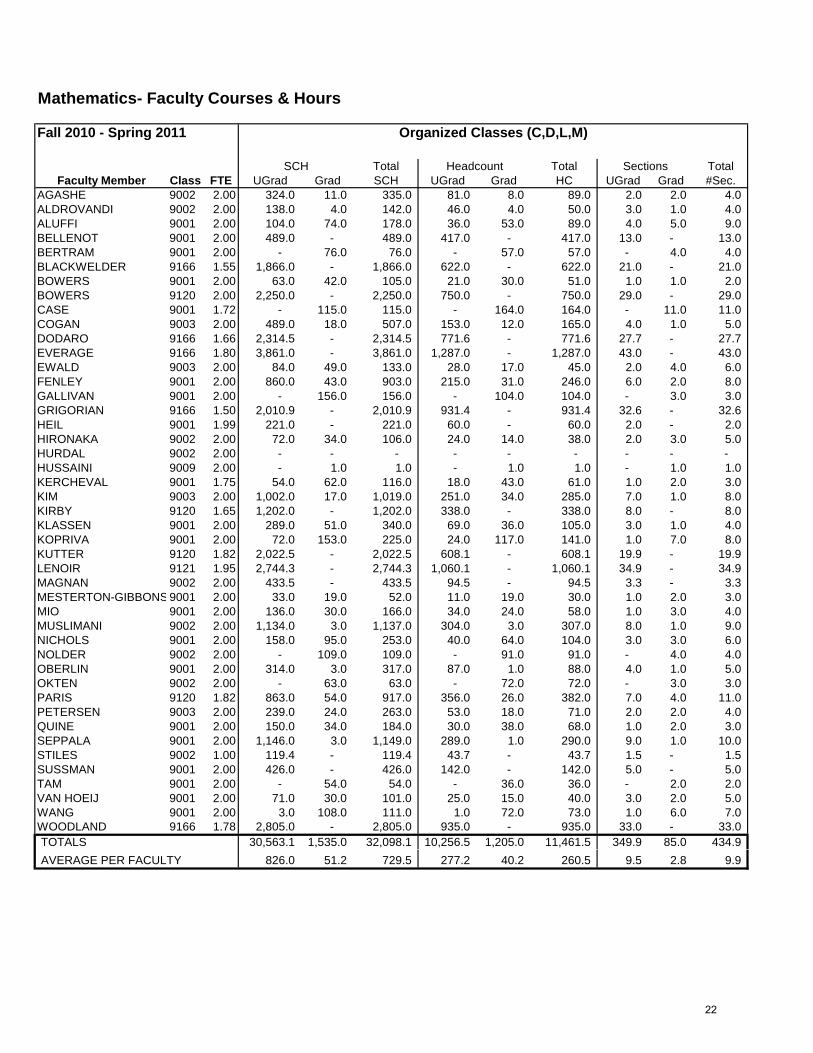
Mathematics- Faculty Courses & Hours
Fall 2010 - Spring 2011 Organized Classes (C,D,L,M)
SCH Total Headcount Total Sections TotalFaculty Member Class FTE UGrad Grad SCH UGrad Grad HC UGrad Grad #Sec.
AGASHE 9002 2.00 324.0 11.0 335.0 81.0 8.0 89.0 2.0 2.0 4.0 ALDROVANDI 9002 2.00 138.0 4.0 142.0 46.0 4.0 50.0 3.0 1.0 4.0 ALUFFI 9001 2.00 104.0 74.0 178.0 36.0 53.0 89.0 4.0 5.0 9.0 BELLENOT 9001 2.00 489.0 - 489.0 417.0 - 417.0 13.0 - 13.0 BERTRAM 9001 2.00 - 76.0 76.0 - 57.0 57.0 - 4.0 4.0 BLACKWELDER 9166 1.55 1,866.0 - 1,866.0 622.0 - 622.0 21.0 - 21.0 BOWERS 9001 2.00 63.0 42.0 105.0 21.0 30.0 51.0 1.0 1.0 2.0 BOWERS 9120 2.00 2,250.0 - 2,250.0 750.0 - 750.0 29.0 - 29.0 CASE 9001 1.72 - 115.0 115.0 - 164.0 164.0 - 11.0 11.0 COGAN 9003 2.00 489.0 18.0 507.0 153.0 12.0 165.0 4.0 1.0 5.0 DODARO 9166 1.66 2,314.5 - 2,314.5 771.6 - 771.6 27.7 - 27.7 EVERAGE 9166 1.80 3,861.0 - 3,861.0 1,287.0 - 1,287.0 43.0 - 43.0 EWALD 9003 2.00 84.0 49.0 133.0 28.0 17.0 45.0 2.0 4.0 6.0 FENLEY 9001 2.00 860.0 43.0 903.0 215.0 31.0 246.0 6.0 2.0 8.0 GALLIVAN 9001 2.00 - 156.0 156.0 - 104.0 104.0 - 3.0 3.0 GRIGORIAN 9166 1.50 2,010.9 - 2,010.9 931.4 - 931.4 32.6 - 32.6 HEIL 9001 1.99 221.0 - 221.0 60.0 - 60.0 2.0 - 2.0 HIRONAKA 9002 2.00 72.0 34.0 106.0 24.0 14.0 38.0 2.0 3.0 5.0 HURDAL 9002 2.00 - - - - - - - - - HUSSAINI 9009 2.00 - 1.0 1.0 - 1.0 1.0 - 1.0 1.0 KERCHEVAL 9001 1.75 54.0 62.0 116.0 18.0 43.0 61.0 1.0 2.0 3.0 KIM 9003 2.00 1,002.0 17.0 1,019.0 251.0 34.0 285.0 7.0 1.0 8.0 KIRBY 9120 1.65 1,202.0 - 1,202.0 338.0 - 338.0 8.0 - 8.0 KLASSEN 9001 2.00 289.0 51.0 340.0 69.0 36.0 105.0 3.0 1.0 4.0 KOPRIVA 9001 2.00 72.0 153.0 225.0 24.0 117.0 141.0 1.0 7.0 8.0 KUTTER 9120 1.82 2,022.5 - 2,022.5 608.1 - 608.1 19.9 - 19.9 LENOIR 9121 1.95 2,744.3 - 2,744.3 1,060.1 - 1,060.1 34.9 - 34.9 MAGNAN 9002 2.00 433.5 - 433.5 94.5 - 94.5 3.3 - 3.3 MESTERTON-GIBBONS 9001 2.00 33.0 19.0 52.0 11.0 19.0 30.0 1.0 2.0 3.0 MIO 9001 2.00 136.0 30.0 166.0 34.0 24.0 58.0 1.0 3.0 4.0 MUSLIMANI 9002 2.00 1,134.0 3.0 1,137.0 304.0 3.0 307.0 8.0 1.0 9.0 NICHOLS 9001 2.00 158.0 95.0 253.0 40.0 64.0 104.0 3.0 3.0 6.0 NOLDER 9002 2.00 - 109.0 109.0 - 91.0 91.0 - 4.0 4.0 OBERLIN 9001 2.00 314.0 3.0 317.0 87.0 1.0 88.0 4.0 1.0 5.0 OKTEN 9002 2.00 - 63.0 63.0 - 72.0 72.0 - 3.0 3.0 PARIS 9120 1.82 863.0 54.0 917.0 356.0 26.0 382.0 7.0 4.0 11.0 PETERSEN 9003 2.00 239.0 24.0 263.0 53.0 18.0 71.0 2.0 2.0 4.0 QUINE 9001 2.00 150.0 34.0 184.0 30.0 38.0 68.0 1.0 2.0 3.0 SEPPALA 9001 2.00 1,146.0 3.0 1,149.0 289.0 1.0 290.0 9.0 1.0 10.0 STILES 9002 1.00 119.4 - 119.4 43.7 - 43.7 1.5 - 1.5 SUSSMAN 9001 2.00 426.0 - 426.0 142.0 - 142.0 5.0 - 5.0 TAM 9001 2.00 - 54.0 54.0 - 36.0 36.0 - 2.0 2.0 VAN HOEIJ 9001 2.00 71.0 30.0 101.0 25.0 15.0 40.0 3.0 2.0 5.0 WANG 9001 2.00 3.0 108.0 111.0 1.0 72.0 73.0 1.0 6.0 7.0 WOODLAND 9166 1.78 2,805.0 - 2,805.0 935.0 - 935.0 33.0 - 33.0 TOTALS 30,563.1 1,535.0 32,098.1 10,256.5 1,205.0 11,461.5 349.9 85.0 434.9
AVERAGE PER FACULTY 826.0 51.2 729.5 277.2 40.2 260.5 9.5 2.8 9.9
22

Mathematics- Faculty Courses & Hours
Fall 2010 - Spring 2011 Individualized (G,T,I,O,P,R,S,Z)
SCH Total Headcount Total Sections TotalFaculty Member Class FTE UGrad Grad SCH UGrad Grad HC UGrad Grad #Sec.
AGASHE 9002 2.00 6.0 27.0 33.0 2.0 4.0 6.0 2.0 2.0 4.0 ALDROVANDI 9002 2.00 - 10.6 10.6 - 3.0 3.0 - 3.0 3.0 ALUFFI 9001 2.00 - 42.5 42.5 - 7.9 7.9 - 2.9 2.9 BELLENOT 9001 2.00 - 3.0 3.0 - 1.0 1.0 - 1.0 1.0 BERTRAM 9001 2.00 - 52.2 52.2 - 10.7 10.7 - 4.2 4.2 BLACKWELDER 9166 1.55 - - - - - - - - - BOWERS 9001 2.00 6.0 0.4 6.4 2.0 0.1 2.1 2.0 0.1 2.1 BOWERS 9120 2.00 - - - - - - - - - CASE 9001 1.72 - 2.9 2.9 - 0.7 0.7 - 0.7 0.7 COGAN 9003 2.00 11.0 20.0 31.0 4.0 5.0 9.0 4.0 3.0 7.0 DODARO 9166 1.66 - - - - - - - - - EVERAGE 9166 1.80 - - - - - - - - - EWALD 9003 2.00 - 18.0 18.0 - 5.0 5.0 - 3.0 3.0 FENLEY 9001 2.00 3.0 14.5 17.5 1.0 2.9 3.9 1.0 2.9 3.9 GALLIVAN 9001 2.00 - 31.1 31.1 - 8.9 8.9 - 4.9 4.9 GRIGORIAN 9166 1.50 - - - - - - - - - HEIL 9001 1.99 - 10.0 10.0 - 2.0 2.0 - 2.0 2.0 HIRONAKA 9002 2.00 9.0 22.5 31.5 3.0 4.1 7.1 3.0 2.1 5.1 HURDAL 9002 2.00 - 14.0 14.0 - 2.0 2.0 - 2.0 2.0 HUSSAINI 9009 2.00 - 29.5 29.5 - 5.5 5.5 - 4.5 4.5 KERCHEVAL 9001 1.75 - 56.5 56.5 - 9.0 9.0 - 4.0 4.0 KIM 9003 2.00 - 6.0 6.0 - 1.5 1.5 - 1.5 1.5 KIRBY 9120 1.65 - - - - - - - - - KLASSEN 9001 2.00 - 20.0 20.0 - 4.0 4.0 - 2.0 2.0 KOPRIVA 9001 2.00 - 89.0 89.0 - 14.0 14.0 - 3.0 3.0 KUTTER 9120 1.82 - - - - - - - - - LENOIR 9121 1.95 - - - - - - - - - MAGNAN 9002 2.00 - 8.0 8.0 - 2.0 2.0 - 2.0 2.0 MESTERTON-GIBBONS 9001 2.00 - 43.0 43.0 - 9.5 9.5 - 5.5 5.5 MIO 9001 2.00 6.0 46.0 52.0 2.0 7.0 9.0 2.0 3.0 5.0 MUSLIMANI 9002 2.00 - 2.0 - - 1.0 1.0 - 1.0 1.0 NICHOLS 9001 2.00 - 6.0 - - 1.5 1.5 - 1.5 1.5 NOLDER 9002 2.00 - 22.0 22.0 - 3.0 3.0 - 2.0 2.0 OBERLIN 9001 2.00 - 12.0 12.0 - 6.0 6.0 - 3.0 3.0 OKTEN 9002 2.00 - 13.0 13.0 - 3.0 - 3.0 3.0 PARIS 9120 1.82 - - - - - - - - PETERSEN 9003 2.00 - 3.0 3.0 - 1.0 - 1.0 1.0 QUINE 9001 2.00 - 12.5 12.5 - 2.4 - 2.1 2.1 SEPPALA 9001 2.00 - 18.0 18.0 - 3.0 - 3.0 3.0 STILES 9002 1.00 - - - - - - - - SUSSMAN 9001 2.00 - 29.1 29.1 - 3.9 - 2.9 2.9 TAM 9001 2.00 - 11.0 11.0 - 2.0 2.0 - 2.0 2.0 VAN HOEIJ 9001 2.00 3.0 53.0 56.0 1.0 9.0 10.0 1.0 3.0 4.0 WANG 9001 2.00 - 17.5 17.5 - 7.0 7.0 - 5.0 5.0 WOODLAND 9166 1.78 - - - - - - - - - TOTALS 44.0 765.8 801.8 15.0 152.6 154.3 15.0 88.8 103.8
AVERAGE PER FACULTY 6.3 22.5 25.1 2.1 4.5 5.3 2.1 2.6 3.1
23
Mathematics- Faculty Courses & Hours
Fall 2010 - Spring 2011 All Types
SCH TOTAL Headcount TOTAL Sections TOTALFaculty Member Class FTE UGrad Grad SCH UGrad Grad HC UGrad Grad #Sec.
AGASHE 9002 2.00 330.0 38.0 368.0 83.0 12.0 95.0 4.0 4.0 8.0 ALDROVANDI 9002 2.00 138.0 14.6 152.6 46.0 7.0 53.0 3.0 4.0 7.0 ALUFFI 9001 2.00 104.0 116.5 220.5 36.0 60.9 96.9 4.0 7.9 11.9 BELLENOT 9001 2.00 489.0 3.0 492.0 417.0 1.0 418.0 13.0 1.0 14.0 BERTRAM 9001 2.00 - 128.2 128.2 - 67.7 67.7 - 8.2 8.2 BLACKWELDER 9166 1.55 1,866.0 - 1,866.0 622.0 - 622.0 21.0 - 21.0 BOWERS 9001 2.00 69.0 42.4 111.4 23.0 30.1 53.1 3.0 1.1 4.1 BOWERS 9120 2.00 2,250.0 - 2,250.0 750.0 - 750.0 29.0 - 29.0 CASE 9001 1.72 - 117.9 117.9 - 164.7 164.7 - 11.7 11.7 COGAN 9003 2.00 500.0 38.0 538.0 157.0 17.0 174.0 8.0 4.0 12.0 DODARO 9166 1.66 2,314.5 - 2,314.5 771.6 - 771.6 27.7 - 27.7 EVERAGE 9166 1.80 3,861.0 - 3,861.0 1,287.0 - 1,287.0 43.0 - 43.0 EWALD 9003 2.00 84.0 67.0 151.0 28.0 22.0 50.0 2.0 7.0 9.0 FENLEY 9001 2.00 863.0 57.5 920.5 216.0 33.9 249.9 7.0 4.9 11.9 GALLIVAN 9001 2.00 - 187.1 187.1 - 112.9 112.9 - 7.9 7.9 GRIGORIAN 9166 1.50 2,010.9 - 2,010.9 931.4 - 931.4 32.6 - 32.6 HEIL 9001 1.99 221.0 10.0 231.0 60.0 2.0 62.0 2.0 2.0 4.0 HIRONAKA 9002 2.00 81.0 56.5 137.5 27.0 18.1 45.1 5.0 5.1 10.1 HURDAL 9002 2.00 - 14.0 14.0 - 2.0 2.0 - 2.0 2.0 HUSSAINI 9009 2.00 - 30.5 30.5 - 6.5 6.5 - 5.5 5.5 KERCHEVAL 9001 1.75 54.0 118.5 172.5 18.0 52.0 70.0 1.0 6.0 7.0 KIM 9003 2.00 1,002.0 23.0 1,025.0 251.0 35.5 286.5 7.0 2.5 9.5 KIRBY 9120 1.65 1,202.0 - 1,202.0 338.0 - 338.0 8.0 - 8.0 KLASSEN 9001 2.00 289.0 71.0 360.0 69.0 40.0 109.0 3.0 3.0 6.0 KOPRIVA 9001 2.00 72.0 242.0 314.0 24.0 131.0 155.0 1.0 10.0 11.0 KUTTER 9120 1.82 2,022.5 - 2,022.5 608.1 - 608.1 19.9 - 19.9 LENOIR 9121 1.95 2,744.3 - 2,744.3 1,060.1 - 1,060.1 34.9 - 34.9 MAGNAN 9002 2.00 433.5 8.0 441.5 94.5 2.0 96.5 3.3 2.0 5.3 MESTERTON-GIBBONS 9001 2.00 33.0 62.0 95.0 11.0 28.5 39.5 1.0 7.5 8.5 MIO 9001 2.00 142.0 76.0 218.0 36.0 31.0 67.0 3.0 6.0 9.0 MUSLIMANI 9002 2.00 1,134.0 5.0 1,139.0 304.0 4.0 308.0 8.0 2.0 10.0 NICHOLS 9001 2.00 158.0 101.0 259.0 40.0 65.5 105.5 3.0 4.5 7.5 NOLDER 9002 2.00 - 131.0 131.0 - 94.0 94.0 - 6.0 6.0 OBERLIN 9001 2.00 314.0 15.0 329.0 87.0 7.0 94.0 4.0 4.0 8.0 OKTEN 9002 2.00 - 76.0 76.0 - 75.0 75.0 - 6.0 6.0 PARIS 9120 1.82 863.0 54.0 917.0 356.0 26.0 382.0 7.0 4.0 11.0 PETERSEN 9003 2.00 239.0 27.0 266.0 53.0 19.0 72.0 2.0 3.0 5.0 QUINE 9001 2.00 150.0 46.5 196.5 30.0 40.4 70.4 1.0 4.1 5.1 SEPPALA 9001 2.00 1,146.0 21.0 1,167.0 289.0 4.0 293.0 9.0 4.0 13.0 STILES 9002 1.00 119.4 - 119.4 43.7 - 43.7 1.5 - 1.5 SUSSMAN 9001 2.00 426.0 29.1 455.1 142.0 3.9 145.9 5.0 2.9 7.9 TAM 9001 2.00 - 65.0 65.0 - 38.0 38.0 - 4.0 4.0 VAN HOEIJ 9001 2.00 74.0 83.0 157.0 26.0 24.0 50.0 4.0 5.0 9.0 WANG 9001 2.00 3.0 125.5 128.5 1.0 79.0 80.0 1.0 11.0 12.0 WOODLAND 9166 1.78 2,805.0 - 2,805.0 935.0 - 935.0 33.0 - 33.0
TOTALS 30,607.1 2,300.8 32,907.9 10,271.5 1,357.6 11,629.1 364.9 173.8 538.7
AVERAGE PER FACULTY 827.2 65.7 731.3 277.6 38.8 258.4 9.9 5.0 12.0
24

Operating Budget E&G Position FTE and Rate TotalsBy Pay Plan, Month Type, Filled/Vacant, and Rank
College of Arts & Sciences
Mathematics
2007-08 2008-09 2009-10 2010-11 2011-12Total All Pay Plans FTE
Person YearsCurret Rate
67.5847.73
$3,612,299
69.1847.89
$3,694,355
65.0345.53
$3,705,498
64.5744.10
$3,609,301
62.1343.00
$3,652,6802007-08 2008-09 2009-10 2010-11 2011-12
Filled 9- & 12-Month Faculty FTEPerson YearsCurrent Rate
45.0035.14
$3,152,609
45.0035.14
$3,183,639
44.0034.39
$3,308,719
41.0032.15
$3,157,045
41.0031.90
$3,243,071Vacant & Reserve Faculty FTE
Person YearsCurrent Rate
2.001.49
$72,259
2.001.49
$114,000
1.000.75
$46,432Summer Faculty FTE
Person YearsCurrent Rate
10.581.09
$87,717
12.181.26
$97,721
11.031.14
$90,308
12.571.20
$102,690
11.131.11
$97,039Filled Support FTE
Person YearsCurrent Rate
10.0010.00
$299,714
10.0010.00
$298,995
10.0010.00
$306,471
10.0010.00
$303,133
9.509.50
$302,720Vacant & Reserve Support FTE
Person YearsCurrent Rate
0.500.50
$9,850
Source:Academic Profile 4.1 with OMNI account
25
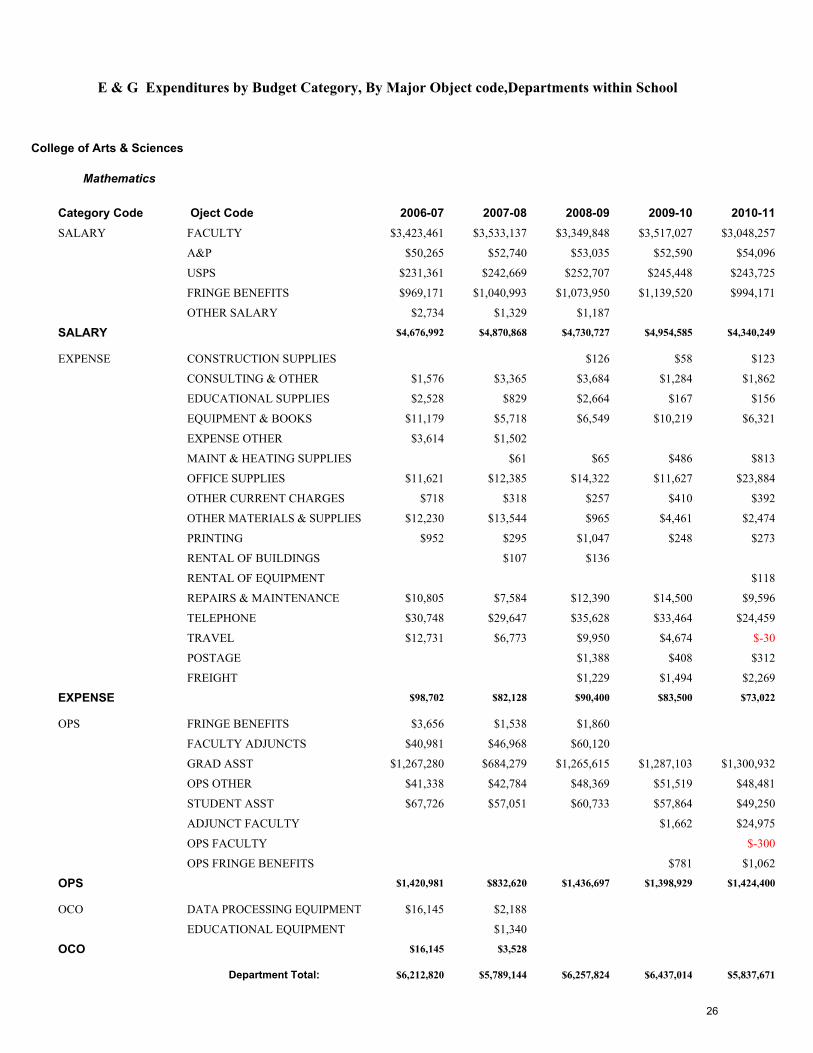
E & G Expenditures by Budget Category, By Major Object code,Departments within School
College of Arts & Sciences
Mathematics
Category Code Oject Code 2006-07 2007-08 2008-09 2009-10 2010-11SALARY FACULTY $3,423,461 $3,533,137 $3,349,848 $3,517,027 $3,048,257
A&P $50,265 $52,740 $53,035 $52,590 $54,096
USPS $231,361 $242,669 $252,707 $245,448 $243,725
FRINGE BENEFITS $969,171 $1,040,993 $1,073,950 $1,139,520 $994,171
OTHER SALARY $2,734 $1,329 $1,187
SALARY $4,676,992 $4,870,868 $4,730,727 $4,954,585 $4,340,249
EXPENSE CONSTRUCTION SUPPLIES $126 $58 $123
CONSULTING & OTHER $1,576 $3,365 $3,684 $1,284 $1,862
EDUCATIONAL SUPPLIES $2,528 $829 $2,664 $167 $156
EQUIPMENT & BOOKS $11,179 $5,718 $6,549 $10,219 $6,321
EXPENSE OTHER $3,614 $1,502
MAINT & HEATING SUPPLIES $61 $65 $486 $813
OFFICE SUPPLIES $11,621 $12,385 $14,322 $11,627 $23,884
OTHER CURRENT CHARGES $718 $318 $257 $410 $392
OTHER MATERIALS & SUPPLIES $12,230 $13,544 $965 $4,461 $2,474
PRINTING $952 $295 $1,047 $248 $273
RENTAL OF BUILDINGS $107 $136
RENTAL OF EQUIPMENT $118
REPAIRS & MAINTENANCE $10,805 $7,584 $12,390 $14,500 $9,596
TELEPHONE $30,748 $29,647 $35,628 $33,464 $24,459
TRAVEL $12,731 $6,773 $9,950 $4,674 $-30
POSTAGE $1,388 $408 $312
FREIGHT $1,229 $1,494 $2,269
EXPENSE $98,702 $82,128 $90,400 $83,500 $73,022
OPS FRINGE BENEFITS $3,656 $1,538 $1,860
FACULTY ADJUNCTS $40,981 $46,968 $60,120
GRAD ASST $1,267,280 $684,279 $1,265,615 $1,287,103 $1,300,932
OPS OTHER $41,338 $42,784 $48,369 $51,519 $48,481
STUDENT ASST $67,726 $57,051 $60,733 $57,864 $49,250
ADJUNCT FACULTY $1,662 $24,975
OPS FACULTY $-300
OPS FRINGE BENEFITS $781 $1,062
OPS $1,420,981 $832,620 $1,436,697 $1,398,929 $1,424,400
OCO DATA PROCESSING EQUIPMENT $16,145 $2,188
EDUCATIONAL EQUIPMENT $1,340
OCO $16,145 $3,528
Department Total: $6,212,820 $5,789,144 $6,257,824 $6,437,014 $5,837,671
26

College of Arts and SciencesDepartment of MathematicsGraduate Admissions
Level Gender Citizenship Ap
plie
d
Acc
epte
d
En
rolle
d
Ap
plie
d
Acc
epte
d
En
rolle
d
Ap
plie
d
Acc
epte
d
En
rolle
d
Ap
plie
d
Acc
epte
d
En
rolle
d
Ap
plie
d
Acc
epte
d
En
rolle
d
Domestic 2 1 0 1 0 0 2 1 0 2 1 0 1 0 0International 0 0 0 1 0 0 3 2 0 2 1 0 2 0 0Domestic 3 2 1 3 1 0 2 2 0 2 0 0 4 3 2International 2 0 0 4 2 1 4 4 0 3 2 2 5 1 0
7 3 1 9 3 1 11 9 0 9 4 2 12 4 2
Domestic 4 2 0 4 3 1 4 1 0 3 2 0 6 4 0International 6 2 0 6 5 2 2 1 0 6 3 1 5 2 1Domestic 12 12 4 10 7 2 20 13 5 6 3 0 20 15 8International 11 4 3 15 8 3 8 4 1 18 7 1 14 2 1
33 20 7 35 23 8 34 19 6 33 15 2 45 23 10
40 23 8 44 26 9 45 28 6 42 19 4 57 27 12
Level Gender Citizenship Ap
plie
d
Acc
epte
d
En
rolle
d
Ap
plie
d
Acc
epte
d
En
rolle
d
Ap
plie
d
Acc
epte
d
En
rolle
d
Ap
plie
d
Acc
epte
d
En
rolle
d
Ap
plie
d
Acc
epte
d
En
rolle
d
Domestic 0 0 0 2 2 1 2 0 0 0 0 0 0 0 0International 2 1 1 2 0 0 0 0 0 2 2 1 2 1 0Domestic 0 0 0 3 2 2 2 1 1 4 2 1 2 2 1International 6 0 0 3 0 0 14 10 3 7 4 2 4 3 2
8 1 1 10 4 3 18 11 4 13 8 4 8 6 3
Domestic 4 3 1 4 2 0 2 1 0 4 3 3 5 3 0International 8 1 0 21 6 1 15 3 1 18 3 2 10 6 4Domestic 4 2 0 5 4 1 5 3 2 8 5 2 10 7 3International 16 6 4 15 3 2 22 9 2 27 4 1 14 3 2
32 12 5 45 15 4 44 16 5 57 15 8 39 19 9
40 13 6 55 19 7 62 27 9 70 23 12 47 25 12
Source: Fall Admissions Files
DoctorateFemale
Male
Doctorate Total
Grand Total
Fall 2011 Fall 2012
Master'sFemale
Male
Fall 2009 Fall 2010
Master's Total
Doctorate Total
Grand Total
116811 - Applied & Computational Mathematics
Fall 2008
Master'sFemale
Male
Master's Total
DoctorateFemale
Male
Fall 2012116810 - Mathematics Fall 2008 Fall 2009 Fall 2010 Fall 2011
27
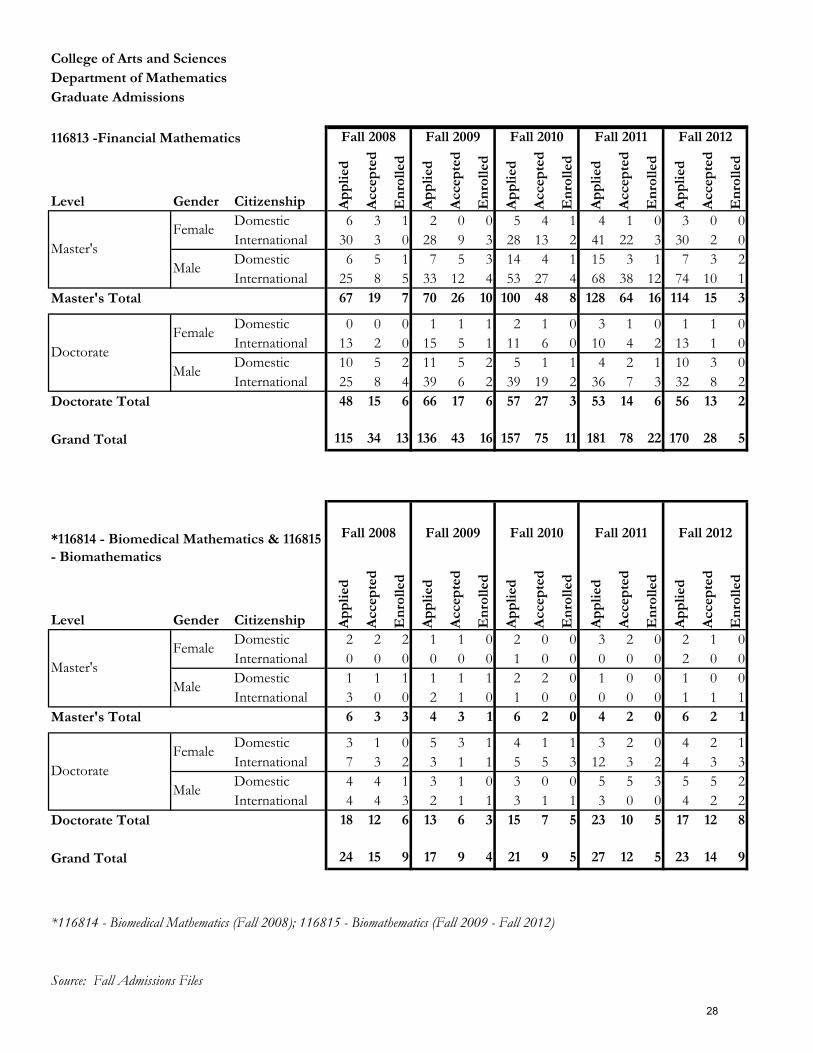
College of Arts and SciencesDepartment of MathematicsGraduate Admissions
Level Gender Citizenship Ap
plie
d
Acc
epte
d
En
rolle
d
Ap
plie
d
Acc
epte
d
En
rolle
d
Ap
plie
d
Acc
epte
d
En
rolle
d
Ap
plie
d
Acc
epte
d
En
rolle
d
Ap
plie
d
Acc
epte
d
En
rolle
d
Domestic 6 3 1 2 0 0 5 4 1 4 1 0 3 0 0International 30 3 0 28 9 3 28 13 2 41 22 3 30 2 0Domestic 6 5 1 7 5 3 14 4 1 15 3 1 7 3 2International 25 8 5 33 12 4 53 27 4 68 38 12 74 10 1
67 19 7 70 26 10 100 48 8 128 64 16 114 15 3
Domestic 0 0 0 1 1 1 2 1 0 3 1 0 1 1 0International 13 2 0 15 5 1 11 6 0 10 4 2 13 1 0Domestic 10 5 2 11 5 2 5 1 1 4 2 1 10 3 0International 25 8 4 39 6 2 39 19 2 36 7 3 32 8 2
48 15 6 66 17 6 57 27 3 53 14 6 56 13 2
115 34 13 136 43 16 157 75 11 181 78 22 170 28 5
Level Gender Citizenship Ap
plie
d
Acc
epte
d
En
rolle
d
Ap
plie
d
Acc
epte
d
En
rolle
d
Ap
plie
d
Acc
epte
d
En
rolle
d
Ap
plie
d
Acc
epte
d
En
rolle
d
Ap
plie
d
Acc
epte
d
En
rolle
d
Domestic 2 2 2 1 1 0 2 0 0 3 2 0 2 1 0International 0 0 0 0 0 0 1 0 0 0 0 0 2 0 0Domestic 1 1 1 1 1 1 2 2 0 1 0 0 1 0 0International 3 0 0 2 1 0 1 0 0 0 0 0 1 1 1
6 3 3 4 3 1 6 2 0 4 2 0 6 2 1
Domestic 3 1 0 5 3 1 4 1 1 3 2 0 4 2 1International 7 3 2 3 1 1 5 5 3 12 3 2 4 3 3Domestic 4 4 1 3 1 0 3 0 0 5 5 3 5 5 2International 4 4 3 2 1 1 3 1 1 3 0 0 4 2 2
18 12 6 13 6 3 15 7 5 23 10 5 17 12 8
24 15 9 17 9 4 21 9 5 27 12 5 23 14 9
Source: Fall Admissions Files
Master's Total
DoctorateFemale
Male
*116814 - Biomedical Mathematics (Fall 2008); 116815 - Biomathematics (Fall 2009 - Fall 2012)
116813 -Financial Mathematics Fall 2008 Fall 2009 Fall 2010 Fall 2011 Fall 2012
*116814 - Biomedical Mathematics & 116815 - Biomathematics
Fall 2008 Fall 2009 Fall 2010 Fall 2011 Fall 2012
Master'sFemale
Male
Grand Total
Master's Total
DoctorateFemale
Male
Doctorate Total
Doctorate Total
Grand Total
Master'sFemale
Male
28
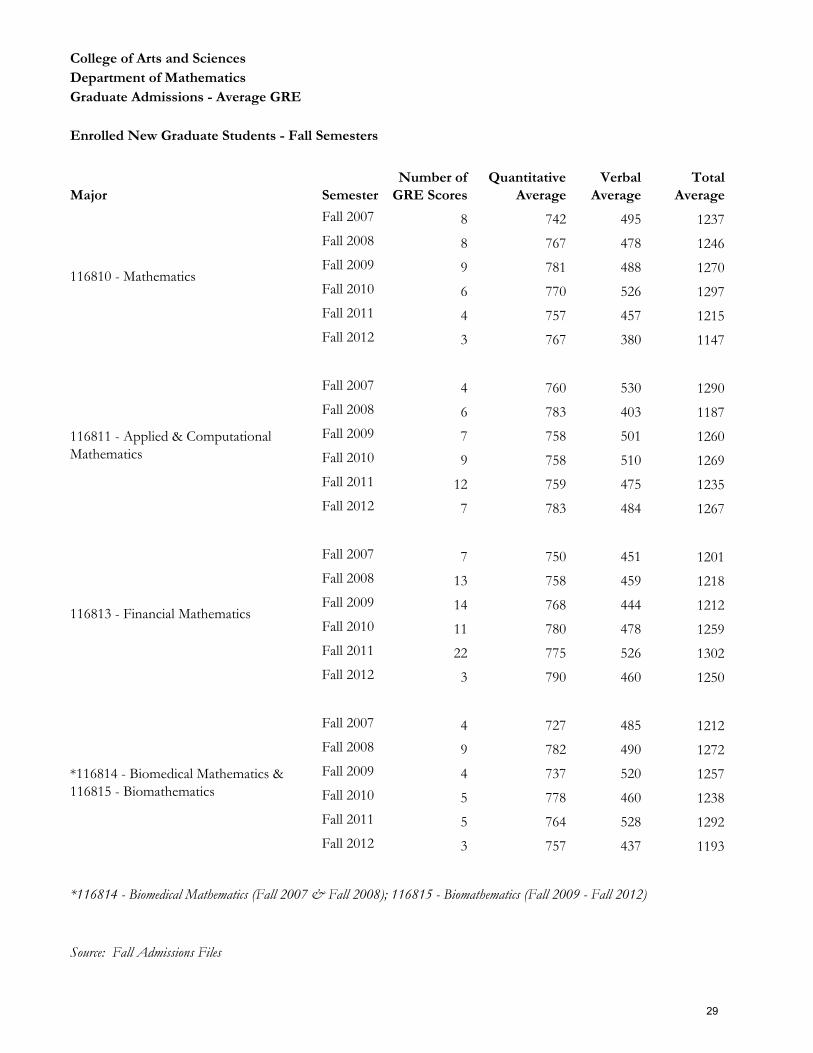
College of Arts and SciencesDepartment of MathematicsGraduate Admissions - Average GRE
Enrolled New Graduate Students - Fall Semesters
Major SemesterNumber of
GRE ScoresQuantitative
AverageVerbal
AverageTotal
Average
Fall 2007 8 742 495 1237
Fall 2008 8 767 478 1246
Fall 2009 9 781 488 1270
Fall 2010 6 770 526 1297
Fall 2011 4 757 457 1215
Fall 2012 3 767 380 1147
Fall 2007 4 760 530 1290
Fall 2008 6 783 403 1187
Fall 2009 7 758 501 1260
Fall 2010 9 758 510 1269
Fall 2011 12 759 475 1235
Fall 2012 7 783 484 1267
Fall 2007 7 750 451 1201
Fall 2008 13 758 459 1218
Fall 2009 14 768 444 1212
Fall 2010 11 780 478 1259
Fall 2011 22 775 526 1302
Fall 2012 3 790 460 1250
Fall 2007 4 727 485 1212
Fall 2008 9 782 490 1272
Fall 2009 4 737 520 1257
Fall 2010 5 778 460 1238
Fall 2011 5 764 528 1292
Fall 2012 3 757 437 1193
*116814 - Biomedical Mathematics (Fall 2007 & Fall 2008); 116815 - Biomathematics (Fall 2009 - Fall 2012)
Source: Fall Admissions Files
116813 - Financial Mathematics
*116814 - Biomedical Mathematics & 116815 - Biomathematics
116810 - Mathematics
116811 - Applied & Computational Mathematics
29

Program : Mathematics
Number of entering doctoral students
Number of students who left the program without a master's or doctoral degree
Number of students who left the program after receiving a master's degree or specialist
Number of students admitted to doctoral candidacy
3 years or less
4 years
5 years
6 years
7 years
8 years
9 years
10 years or more
Number still enrolled after 10 years
2000-2001 11 3 1 8 1 1 2 1 1 1
2001-2002 7 2 5 4 1
2002-2003 12 2 1 9 1 3 4
2003-2004 19 3 4 13 3 1 3 1 1 3
2004-2005 19 6 3 12 1 4 3 1
2005-2006 16 1 4 12 1 6 3
2006-2007 20 3 2 15 1 2 5
2007-2008 19 6 1 12 1
2008-2009 20 3 13 1
2009-2010 16 1 2 11
2010-2011 18 9
Number of students who entered theprogram between 2000 and 2010
Record the number who within the various time spans listed below completed degree within given number of years after enrolling
30