mathematical modelling of dna replication
TRANSCRIPT

Mathematical Modelling of DNA Replication
D I S S E R TAT I O N
zur Erlangung des akademischen Grades
d o c t o r r e r u m n a t u r a l i u m(Dr. rer. nat.)
im Fach Biophysik
eingereicht an derMathematisch-Naturwissenschaftlichen Fakultät I
der Humboldt-Universität zu Berlin
vonDiplom-Physikerin Anneke Brümmer
20.10.1977 in Hamburg
Präsident der der Humboldt-Universität zu Berlin:Prof. Dr. Dr. h.c. Christoph Markschies
Dekan der Mathematisch-Naturwissenschaftlichen Fakultät I:Prof. Dr. Lutz-Helmut Schön
Gutachter:1. Prof. Dr. Peter Hammerstein2. Prof. Thomas Höfer, PhD3. Prof. Dr. Lilia Alberghina
Tag der mündlichen Prüfung: 08.07.2010
Abstract
Before a cell divides into two daughter cells, its entire genetic material has to be copiedwithout errors and exactly once. In eukaryotic cells, a vast amount of replication originsexists that enable the replication of the DNA to initiate simultaneously from many originsin parallel, thereby contributing to a relatively rapid duplication of the genome. The initi-ation of DNA replication from the replication origins is a tightly controlled process. Themolecular machinery involved in this process in budding yeast has been identified in thepast decades, but questions remain concerning their precise dynamical behavior and inter-actions.
In order to restrict the initiation of DNA replication to once per cell cycle, the activation ofthe origins proceeds in two temporally separated phases, the licensing and the firing phase.A part of the replication machinery, including the presumptive DNA helicase, is assembledat the origins in the first phase, and is completed by loading of DNA polymerases in thesecond phase. The temporal separation of origin licensing and firing is tightly regulated bythe activity of cyclin-dependent kinases (Cdks).
In this work, a mathematical model for DNA replication in budding yeast is provided.Based on a multitude of experimental studies, a molecular interaction network is constructedand translated into balance equations for all molecule complexes assembled at the replica-tion origins, free molecule complexes and all phosphorylation states. Initial protein con-centrations could be taken from measurements. The kinetic parameters of the mathematicalmodel are determined by using an optimization approach. Firstly, the biological function-ality of the system is defined by means of four functional systems properties, the fractionof activated origins, the number of rereplicating origins and the rate of origin activation,measured by its mean time and duration. Secondly, the biological functionality of the entiresystem is maximized as a function of its kinetic parameters.
The parameterized model accounts for the experimentally observed distribution of acti-vation times of early replication origins and at the same time realizes the strict inhibitionof DNA rereplication. Analysis of the kinetics of origin firing revealed that the preventionof DNA rereplication relies on a time delay between the licensing and firing of replicationorigins, which, however, limits the rate of origin activation. The multisite phosphorylationof two target proteins of the S phase cyclin-dependent kinase (S-Cdk), Sld2 and Sld3, is es-sential for creating a robust time delay before the activation of replication origins and at thesame time in contributing to a synchronous initiation of DNA replication at several replica-tion origins. The mathematical model rationalizes experimentally realized deregulations inthe activity of Cdks and quantifies the resulting disorders in the kinetics of origin activation.
Furthermore, the kinetics of origin activation calculated with the mathematical model isutilized to predict the consequences of specific deregulations in the activation of replica-tion origins on the process of DNA replication during S phase, which is quantified by theduration of the DNA synthesis period and the distribution of DNA replicon sizes.
In summary, a consistent model for DNA replication in budding yeast is developed andanalyzed extensively. The connection of the initiation kinetics of DNA replication and itsdynamics during S phase of the cell cycle, allows to comprehensively study the potentialsources of chromosomal rearrangements.
ii

Zusammenfassung
Bevor sich eine Zelle in zwei Tochterzellen teilt, muß ihr genetisches Material fehlerfreiund genau einmal kopiert werden. In eukaryotischen Zellen existieren eine große Anzahlvon Replikationsstartpunkten, die sogenannten Replikationsorigins. Diese ermöglichen es,daß die DNA Replikation von mehreren Origins aus zeitgleich gestartet wird, was zu ei-ner relativ kurzen Verdoppelungzeit, auch von großen Genomen, beiträgt. Die Initiierungder DNA Replikation an den Replikationsorigins ist ein stark kontrollierter Prozess. Diemolekulare Maschinerie, die an diesem Prozess in Hefezellen beteiligt ist, wurde innerhalbder letzten Jahrzehnte identifiziert. Es gibt jedoch offene Fragen bezüglich ihres genauendynamischen Verhaltens und Zusammenwirkens.
Um die Initiierung der DNA Replikation auf exakt einmal pro Zellzyklus zu beschränken,erfolgt die Aktivierung der Replikationsorigins in zwei zeitlich getrennten Phasen, der soge-nannten Lizensierungsphase und der Feuerphase. Ein Teil der Replikationsmaschinerie, ein-schließlich der mutmaßlichen DNA Helikase, wird in der ersten Phase an den Origins zu-sammengestellt, und in der zweiten Phase durch die Bindung der DNA Polymerasen kom-plettiert. Die zeitliche Trennung von Originlizensierungsphase und Originfeuerphase wirddurch die Aktivität von Cyclin-abhängigen Kinasen (Cdk) strikt reguliert.
In dieser Arbeit wird ein mathematisches Modell für die DNA Replikation in Hefezellenpräsentiert. Basierend auf einer Vielzahl von experimentellen Studien, wird ein molekula-res Interaktionsnetzwerk konstruiert, und als ein System von Balancegleichungen für alleMolekülkomplexe an den Replikationsorigins, alle freien Molekülkomplexe und alle Phos-phorylierungszustände mathematisch formuliert. Die Anfangsbedingungen für die Prote-inkonzentrationen wurden experimentellen Messungen entnommen. Die kinetischen Para-meter des mathematische Models werden mit Hilfe eines Optimierungsansatzes bestimmt.Zunächst wird die biologische Funktionalität des Systems mit Hilfe von vier funktionel-len Eigenschaften definiert, der Anteil der aktivierten Origins, der Anzahl der rerepliziertenOrigins, und der Rate der Originaktivierung, welche durch ihren mittleren Zeitpunkt undihre Dauer bestimmt sind. Anschließend wird die biologische Funktionalität des gesamtenSystems als Funktion der kinetischen Parameter maximiert.
Das parameterisierte Modell stimmt mit den experimentell beobachteten Verteilungender Aktivierungszeiten der frühen Replikationsorigins überein und realisiert gleichzeitigdie strikte Inhibierung der DNA Rereplikation. Die Analyse der Originaktivierungskine-tiken verdeutlicht, daß die Verhinderung der DNA Rereplikation auf der zeitlichen Tren-nung der Lizensierung und des Feuerns der Replikationsorigins beruht, welche aber auchdie Geschwindigkeit der Originaktivierung limitiert. Die multiple Phosphorylierung zweierTargetproteine, Sld2 und Sld3, der S Phasen-Cyclin-abhängigen Kinase, S-Cdk, stellt sichals essentiell für die Schaffung eines robusten Zeitverzögerungsmoduls vor der Aktivie-rung der Replikationsorigins heraus und trägt gleichzeitig zu einer möglichst synchronenInitiierung der DNA Replikation an den verschiedenen Replikationsorigins bei. Das mathe-matische Model gibt die experimentell realisierte Deregulierung der Cdk-Aktivität wiederund quantifiziert die resultierende, gestörte Originaktivierungskinetik.
Desweiteren wird die Originaktivierungskinetik, die mit dem mathematischen Modellberechnet werden kann, genutzt, um die Konsequenzen einer spezifischen Deregulierung inder Initiierung der DNA Replikation auf den Prozess der DNA Replikation in der S Phasevorherzusagen. Der DNA Replikationsprozess wird durch die Dauer der DNA Synthese unddie Verteilung der DNA Replikongrößen charakterisiert.
Zusammenfassend wird ein realistisches Modell für die DNA Replikation in Hefezellen

entwickelt und umfangreich analysiert. Die Verbindung der Aktivierungskinetik der Re-plikationsorigins mit der Dynamik der DNA Replikation in der S Phase des Zellzyklus,ermöglicht es potentielle Quellen von chromosomalen Umordnungen umfassend zu unter-suchen.
iv

Contents
1 Introduction 11.1 DNA replication in budding yeast . . . . . . . . . . . . . . . . . . . . . . . . 11.2 Related mathematical models . . . . . . . . . . . . . . . . . . . . . . . . . . . 41.3 Research objectives . . . . . . . . . . . . . . . . . . . . . . . . . . . . . . . . 5
2 Kinetic model for the initiation of DNA replication 72.1 Molecular regulatory network for the initiation of DNA replication . . . . . . . 7
2.1.1 Licensing phase . . . . . . . . . . . . . . . . . . . . . . . . . . . . . . 72.1.2 Intermediate period . . . . . . . . . . . . . . . . . . . . . . . . . . . . 82.1.3 Firing phase . . . . . . . . . . . . . . . . . . . . . . . . . . . . . . . . 92.1.4 Prevention of DNA rereplication . . . . . . . . . . . . . . . . . . . . . 9
2.2 Mathematical model for the formation of replication complexes at the origins . 112.2.1 Variables and initial conditions . . . . . . . . . . . . . . . . . . . . . . 112.2.2 Mathematical equations . . . . . . . . . . . . . . . . . . . . . . . . . 13
2.3 Functional parameterizations of the mathematical model . . . . . . . . . . . . 222.3.1 Definition of functional systems properties . . . . . . . . . . . . . . . 232.3.2 Biochemically allowed parameter ranges . . . . . . . . . . . . . . . . 252.3.3 Determination of functional parameter sets through optimization . . . . 25
3 Analysis of the kinetics of DNA replication initiation 333.1 Origin firing kinetics with functional parameter sets . . . . . . . . . . . . . . . 33
3.1.1 Functional kinetics in the different parameter sets . . . . . . . . . . . . 353.1.2 Dependency on the initial number of early origins . . . . . . . . . . . . 36
3.2 Control of functional systems properties . . . . . . . . . . . . . . . . . . . . . 373.2.1 Control by protein concentrations . . . . . . . . . . . . . . . . . . . . 383.2.2 Control by kinetic parameters . . . . . . . . . . . . . . . . . . . . . . 413.2.3 Control by S-Cdk concentration . . . . . . . . . . . . . . . . . . . . . 433.2.4 Control by multisite phosphorylation of Sld2 and Sic1 . . . . . . . . . 44
3.3 Simulations by the mathematical model . . . . . . . . . . . . . . . . . . . . . 473.3.1 Model simulation under normal conditions . . . . . . . . . . . . . . . 473.3.2 Model simulations of characteristic S-Cdk perturbations . . . . . . . . 47
4 Analysis of the DNA replication dynamics during S phase 534.1 Dynamics of DNA replication in the budding yeast genome . . . . . . . . . . . 534.2 Quantification of the replication dynamics . . . . . . . . . . . . . . . . . . . . 54
4.2.1 Calculation of DNA replicon sizes . . . . . . . . . . . . . . . . . . . . 544.2.2 Properties of DNA replication dynamics . . . . . . . . . . . . . . . . . 56
v

Contents
4.3 Control of the DNA replication dynamics . . . . . . . . . . . . . . . . . . . . 574.3.1 Dependency on the number of activated origins N . . . . . . . . . . . . 584.3.2 Dependency on the duration of origin firing ∆ . . . . . . . . . . . . . . 584.3.3 Dependency on the DNA synthesis rate v . . . . . . . . . . . . . . . . 60
4.4 Simulations of the DNA replication dynamics . . . . . . . . . . . . . . . . . . 624.4.1 Replication dynamics under normal conditions . . . . . . . . . . . . . 624.4.2 Replication dynamics under characteristic S-Cdk deregulations . . . . . 634.4.3 Replication dynamics of early and late firing origins . . . . . . . . . . 65
5 Discussion and Outlook 695.1 Construction of the mathematical model . . . . . . . . . . . . . . . . . . . . . 70
5.1.1 Structure of the molecular interaction network . . . . . . . . . . . . . 705.1.2 Definition of the systems functionality . . . . . . . . . . . . . . . . . . 715.1.3 Optimization of the systems functionality . . . . . . . . . . . . . . . . 72
5.2 Biological insight from the mathematical model . . . . . . . . . . . . . . . . . 745.2.1 Limitations and correlations of the functional systems properties . . . . 745.2.2 Importance of multisite phosphorylation in creating a time delay . . . . 755.2.3 Consequences on the DNA replication dynamics during S phase . . . . 76
5.3 Outlook . . . . . . . . . . . . . . . . . . . . . . . . . . . . . . . . . . . . . . 78
Abbreviations 81
vi

1 Introduction
1.1 DNA replication in budding yeast
The proliferation of a cell population is driven by the cell cycles of the individual cells, which,while growing, duplicate all their components and divide into two daughter cells.The eukaryotic cell cycle is divided into four phases, the mitotic phase (M phase), the synthesisphase (S phase) and two gap phases in between (G1 phase and G2 phase). After the exit fromthe previous mitosis, the new cell cycle starts with the G1 phase, in which the cell increases insize and prepares for the upcoming DNA replication, occurring during the S phase. After thecompleted DNA synthesis, in the G2 phase, the cell gets ready for the forthcoming separation ofsister chromatids, which are then segregated to the two daughter cells at the cell division duringthe M phase. All phase transitions during the cell cycle are tightly controlled by the activity ofcyclin dependent kinases (Cdks), whose concentration is low during G1 phase and rises from Sto M phase (Figure 1.1).
M G1
G2 S
CdkDNA replicationbuddingpolarized growth
cell division
mitosis growth factorsnutrients
pheromonesstress
spindle damage
circadian clockstressDNA damage
Figure 1.1: The progression of the cell cycle is regulated by the activity of Cdks (white dashedlines; activating (arrows) and inhibiting (bar) regulation). The different phases ofthe cell cycle are also influenced by other cellular and external signals (black dashedlines; arrows: activating and bars: inhibiting) and specific processes in the duplica-tion of the cell are initiated (black arrows). Figure redrawn from [18].
The replication of the genome is a critical process in the duplication of cells. The geneticmaterial has to be copied without errors and exactly once per cell cycle. In bacteria, DNA repli-cation is initiated from a single origin, whereas eukaryotes use hundreds to thousands of origins
1

1 Introduction
in parallel to accelerate the doubling of the long genomes [90]. In the genome of budding yeast,Saccharomyces Cerevisiae, more than 500 likely autonomously replicating sequences (ARSs)are identified [60], which serve as potential origins for DNA replication. Not all origins are ac-tivated in every cell cycle, so that the composition as well as the quantity of origins, from whichDNA replication is finally initiated in a cell cycle, varies. While the potential origins are presentin great excess in fission yeast and are consequently activated with low efficiency in a cell cycle[87], the efficiency of origin activation in budding yeast is generally higher, but still the factorsthat determine the different efficiencies of the origins are not fully understood [67, 90].
The ARSs are marked with an origin recognition complex (ORC) throughout the cell cycle(Figure 1.2), which provides a platform for the assembly of the replication complex (RC). Theformation of the RCs at the replication origins proceeds in a defined sequence of binding andphosphorylation events occurring in two consecutive phases, origin licensing and firing, whichstarts in the G1 phase and ends with the onset of DNA synthesis in S phase [22].
During the licensing phase, the putative DNA helicase, Mcm2-7, is loaded to the replicationorigins in an inactive form, building the pre-replication complexes (pre-RCs). The activation ofthe G1 phase cyclin-dependent kinase G1-Cdk, which consists of the regulatory cyclins Cln1or Cln2 and the enzymatically active kinase Cdc28, leads to the inhibition of origin licensing.Simultaneously, G1-Cdk triggers the activation of another, S phase cyclin-dependent kinase, S-Cdk, composed of the regulatory cyclins Clb5 or Clb6 and the kinase Cdc28. S-Cdk togetherwith another kinase, Ddk (consisting of the regulatory subunit Dbf4 and the kinase subunit Cdc7)then, in the firing phase, phosphorylate components of Mcm2-7 that are part of the pre-RCs.This enables the binding of the essential Cdc45 to the origins and the formation of pre-initiationcomplexes (pre-ICs). S-Cdk also phosphorylates other important molecules, Sld2 and Sld3, thatfacilitate the loading of GINS and the DNA polymerase and the formation of the RCs at thereplication origins and, thus, the initiation of DNA synthesis (Figure 1.2).
The temporal separation of the licensing and the firing phase, which is tightly controlled bythe activity of Cdks, ensures that no origin becomes reactivated within the same cell cycle.When the origins are activated by Cdks in the firing phase, licensing is inhibited, by the sameenzymes, preventing the further formation of pre-RCs at the origins and the rereplication ofDNA. But, occasionally, this mechanism causes some origins to be inhibited prematurely, beforebeing licensed and activated once, or some origins that fail to complete their pre-RC, before theinhibition of licensing reactions sets in. These origins remain inactive during S phase and arecalled silent origins [90].
During S phase, the replication machinery containing the DNA helicase and DNA poly-merases starts the synthesis of new DNA bidirectionally from the replication origin, as soonas its RC has formed.The activation of the origins is temporally coordinated, such that a part of the origins, knownas early origins, initiates the replication of more than half of the budding yeast genome (∼ 7-8Mb) in early S phase. Another part of the origins, called late origins, becomes active later in Sphase and completes the duplication of the genome. Early and late origins are licensed at thesame time, while the activation of late origins is temporally delayed [71, 35]. A relationshipprobably exists between the accessibility of the chromatin, containing the origin, and its time ofreplication. However, a correlation with the activity of gene transcription, as observed in otherorganisms, has not been confirmed for budding yeast [28]. The specific biochemical factors
2
1.1 DNA replication in budding yeast
ORC
ORC
ORC
Cdc6Cdt1
Mcm2-7 Mcm2-7
Mcm2-7 Mcm2-7Cdc45
Cdc45
CdkDdk Sld2P
P P PP
P PSld3P P
DNApolymerase
DNApolymerase
GG
II
NN
SS
Dpb11Sld2P
P P PP
P PSld3P P
Pre-RC
Pre-IC
RC
Figure 1.2: The formation of replication complexes (RC) at the replication origins proceeds ina defined sequence. Pre-replication complexes (pre-RC) containing the presumptiveDNA helicase, Mcm2-7, are assembled during the licensing phase and pre-initiationcomplexes (pre-IC) are formed following the activation of S-Cdk. At the same time,S-Cdk phosphorylates Sld2 and Sld3 that finally enable the loading of DNA poly-merases completing the replication complex (RC).
that regulate the differences between early and late activated origins and lead to the temporalregulation of the DNA replication within the S phase, are unknown [90].
A wide difference in the activation times of neighboring replication origins might result inanother fraction of origins that remains inactive during S phase. These origins, which are calleddormant origins [90], become replicated passively by their neighboring replication machinerybefore they would have been activated themselves.
The transition of the G1 to S phase is an important step in the cell cycle that must be tightlycontrolled. Deregulations in the G1/S transition may strongly affect the process of DNA syn-thesis during S phase. The incomplete duplication of the genome causes a loss of the geneticmaterial. DNA rereplication may result in fragmented and partially doubled daughter chromo-
3

1 Introduction
somes and, thus, contribute to the emergence of genomic instability [73, 31]. Indeed, most genesthat are mutated in human cancers are influencing the G1 to S phase transition.
1.2 Related mathematical models
To rationalize the kinetic behavior of a molecular interaction network governing a biologicalprocess, mathematical modeling is very valuable. The identification and analysis of system levelproperties that only emerge from the dynamic interaction of these molecules contribute to aquantitative understanding of the underlying biological process.
Mathematical modeling of the cell cycle regulation has a long tradition and has been success-fully applied to study biological questions. The development of mathematical models startedaround 50 years ago with the quantitative analysis of the influence of cell growth on cell divi-sion, which was experimentally identified by Prescott [66, 18]. Further experimental discoveriesof molecular interactions involved in the control of the cell cycle, contributed to the develop-ment of a variety of models focussed on the molecular regulation of the cell cycle and specifictransitions within the cell cycle.
Deterministic models based on ordinary differential equations (ODEs) have been employedto describe the kinetics of cyclin-dependent kinases and its regulators, such as inhibitors or tran-scription factors, to analyze the cell cycle control in budding yeast [12, 13] and fission yeast [63].A very simplified model was reported generating an oscillating cell cycle in of the eukaryoticcell cycle by using delay differential equations (DDE) [76].
Several kinetic models focused on specific transitions within the cell cycle and have been suc-cessful in quantifying particular molecular control mechanisms. Recently, a positive feedbackmechanism, acting on the level of gene expression of the cyclins Cln1 and Cln2 was proposedto induce a robust and switch-like entry into the G1 phase of the cell cycle [74]. Likewise, theproteolysis of cyclins was shown to be insufficient for the unidirectionality of cell cycle tran-sitions after a longer time period, specifically for the mitotic exit. Instead, the presence of anadditional feedback loop was proposed, which ensures the irreversibility of the mitotic exit inthe long run [51]. Also, the regulation of the G1 to S phase transition was analyzed in a kineticmodel focussing on the impact of the cell size on this transition [6].
Mathematical models were also used to evaluate the DNA replication dynamics during Sphase. Generally, stochastic models are used to describe the DNA replication dynamics ona phenomenological level, mostly without connection to the molecular processes controllingthe activation of the individual origins. A universal model for the dynamics of DNA replica-tion in eukaryotes is reported that bases on experimentally determined origin activation profiles[29, 30]. A stochastic hybrid model for the DNA replication dynamics in fission yeast is pro-posed that couples the discrete transitions between the states of an origin to the continuous move-ment of the replication machinery along the DNA. This model is predicated upon experimentalinformation about the location of each putative origin and its measured activation propensity.To explain the experimentally measured duration of the S phase in fission yeast, the model pro-poses the existence and redistribution of a limiting factor during the activation of replicationorigins [53]. Another model for the DNA replication dynamics in budding yeast uses the acti-
4

1.3 Research objectives
vation times of replication origins and their positions on the chromosomes from measured DNAreplication profiles to simulate the replication dynamics under normal conditions and of distinctperturbed conditions [75]. A few models exist that apply methods from theoretical statisticalphysics to the DNA replication dynamics [55, 40, 39].
Finally, mathematical models have also been reported for other dynamic processes on theDNA molecule in eukaryotic cells, like the assembly of the molecular machinery performingnucleotide excision repair (NER) of single strand breaks in mammalian DNA [65, 52] or theinitiation of single-gene transcription in human cells, which includes a molecular complex for-mation on the DNA and specific structural rearrangements of the DNA strand that finally lead totranscriptional cycles on the cell population level [19].
1.3 Research objectives
A full cell cycle in budding yeast takes around 2 hours [21]. Within this short time period, thecomplete genome has to be replicated, separated into two identical copies, and distributed tomother and daughter cells. The duplication of the genome would proceed most efficiently, if allreplication origins are initiated simultaneously and the DNA is replicated bidirectionally fromall origins in parallel. However, a temporal distribution of activation times of replication originsis observed [67, 88], with differences between early and late origins as well as variations evenamong the early origins. The reasons for these characteristic variations are unclear, althoughsome factors, such as an effect of the chromatin environment of the late replication origin havebeen observed [24].
A variety of experimental studies have focussed on the molecular processes leading to theinitiation of DNA replication in budding yeast, but up to now a quantitative understanding of themolecular network that leads to the activation of replication origins is lacking.
In Chapter 2 of this work, a molecular network model for the initiation of DNA replicationis constructed and translated into a mathematical model to elucidate the regulatory mechanismsby which a large number of origins is activated near-simultaneous, while exhibiting the phys-iologically required functionality. The molecular interaction network governing the initiationof DNA replication is constructed making use of the large amount of experimental studies inbudding yeast. The concentrations of the participating molecules are taken from measured pro-tein expression data [27], while most kinetic parameters describing molecular reactions, suchas binding, dissociation, phosphorylation, dephosphorylation or degradation reactions, have notbeen (and, in many cases, cannot be) determined experimentally. To identify parameter sets thatreproduce a realistic origin activation kinetics, which has indeed been measured [67, 88], thedifferent parameter types are first constrained to biochemically allowed ranges and then opti-mized to generate a functional kinetics of origin activation. The functionality of the kinetics oforigin activation, that is the systems performance, is measured by means of four functional sys-tems properties, the number of activated replication origins, the number of rereplicating origins,and the rate of origin activation, defined by the mean value and the standard deviation of thedistribution of origin activation times.
The derived parametrized mathematical model is used, in Chapter 3, to reproduce and quantify
5

1 Introduction
experimentally realized deregulations in the molecular interaction network, thereby validatingthe mathematical model.
Specific questions addressed by the mathematical model are:
• Are there constraints in the functionality of the kinetics of origin activation that can beidentified by interrelations between functional systems properties?
• Are the individual functional systems properties controlled by specific molecule concen-trations and kinetic rate constants?
• What is the role of the multiple phosphorylation of several molecules components by Cdksin the regulation of DNA replication initiation?
The consequences of a particular kinetics of origin activation on the DNA replication dynam-ics during S phase are addressed in a second mathematical model in Chapter 4. This subsequentmodel uses the simulated kinetics of origin activation and connects it to the dynamics of DNAreplication, allowing to quantify and evaluate the impact of deregulations in the G1 to S phasetransition on the process of DNA synthesis during S phase.
6

2 Kinetic model for the initiation of DNAreplication
In this chapter, a molecular network for the regulation of the initiation of DNA replication in bud-ding yeast is constructed and translated into a mathematical model. The biological functionalityof the molecular regulatory system is defined. Kinetic parameterizations of the mathematicalmodel are generated systematically by maximizing the functionality of the biological system asa function of its kinetic parameters.
2.1 Molecular regulatory network for the initiation of DNAreplication
Based on a vast amount of experimental data, we constructed a molecular network for the reg-ulation of DNA replication initiation in budding yeast (Figure 2.1). The network considers theessential molecules and reactions known to be involved in the assembly of the RC at the earlyorigins. A sequence of reversible binding reactions and directed de-/phosphorylations, denotedas transitions of the origin between the states S0 to S9 (Table 2.1), leads to the final formationof the RC at the origin (in state S9) and the initiation of DNA replication from that origin.
In the following, the reactions of the molecular network (Figure 2.1) are described in detail, inthe order of three temporally consecutive phases: licensing phase, intermediate phase, and firingphase. The reactions involved in mechanisms responsible for the inhibition of DNA rereplica-tion are specified separately.
2.1.1 Licensing phase
During the licensing phase (blue in Figure 2.1), which starts after the exit from mitosis, Mcm2-7proteins, the putative replicative helicase complex, are loaded to the origins in a highly regulatedprocess.
The starting positions for DNA replication, the ARS, are marked with ORCs, which consistof six subunits, Orc1 to Orc6, that stay attached to the DNA throughout the cell cycle [48].The Mcm2-7 complex, which comprises six subunits, Mcm2 to Mcm7, forms a complex withCdt1 (reactions 4 and 5) in the cytoplasm [78]. A nuclear localization signal (NLS) in Mcm2-7leads to the import of the Cdt1-Mcm2-7 complex into the nucleus [49]. Two ATPases, ORCand Cdc6, are already bound to the origins (reaction 1), before Cdt1-Mcm2-7 associates withthese molecules at the DNA (reaction 3). ATP hydrolysis by Cdc6 then allows a tight connec-tion of origin DNA and Mcm2-7 proteins. Subsequently, Cdt1 is released from the origins and
7

2 Kinetic model for the initiation of DNA replication
Table 2.1: The states S0 to S8 represent temporary molecular complexes in the assembly of thereplication complex, state S9 in the kinetic model. Certain molecular complexes arereferred to by synonyms.
State Molecular complex SynonymS0 ORCS1 ORC-Cdc6S2 ORC-Cdc6-Cdt1-Mcm2-7S3 ORC-Mcm2-7 pre-replication complex (pre-RC)S4 ORC-Mcm2-7pS5 ORC-Mcm2-7ppS6 ORC-Mcm2-7pp-Cdc45 pre-initiation complex (pre-IC)S7 ORC-Mcm2-7pp-Cdc45-11-3-2S8 ORC-Mcm2-7pp-Cdc45-11-3-2-GINS/polymeraseS9 ORC-Mcm2-7pp-Cdc45-GINS-polymerase replication complex (RC)
Cdc6 association becomes destabilized (reaction 9). ATP hydrolysis by ORC then completes theMcm2-7 loading reaction [68], leaving tightly bound pre-RCs at the replication origins (stateS3).
2.1.2 Intermediate period
With the activation of the G1-phase cyclin-dependent kinase, G1-Cdk, which occurs after thecompletion of pre-RCs at all replication origins under normal conditions, the next step in theinitiation of DNA replication commences. G1-Cdk causes the inhibition of origin licensing and,at the same time, the activation of the S-phase cyclin-dependent kinase, S-Cdk.
Phosphorylation of Cdc6 by G1-Cdk causes a rapid degradation of Cdc6p (reaction 2) via anSCFCdc4-mediated ubiquitination and proteolysis [23]. Phosphorylation of Mcm2-7 by G1-Cdk(reaction 6) blocks the NLS and causes the activation of an adjacent nuclear export signal (NES)in the Mcm2-7 molecule, which leads to the export of free Mcm2-7 or Mcm2-7 in complex withCdt1 (reaction 8) from the nucleus [49]. Cdt1 is also exported from the nucleus (reaction 7), butit is not clear, whether this process is dependent on a phosphorylation by G1-Cdk [79].
Sic1 is a stoichiometric inhibitor of S-Cdk, that binds to S-Cdk (reaction 12) and inhibits itsactivity during the licensing phase. Sic1 is phosphorylated by G1-Cdk at up to nine serine andthreonine residues in a random sequence (reaction 10). Phosphorylations can be reversed by aphosphatase, presumably Cdc14 [83, 7], that is also assumed to act in a random sequence (reac-tion 11). Any combination of at least six phosphorylations in Sic1 leads to the recognition of theSic1-S-Cdk complex by Cdc4 and an SCF-mediated ubiquitination and subsequent proteolysisof Sic1 (reaction 13) [58, 20]. Degradation of Sic1 then results in a delayed release of activeS-Cdk at late G1 phase.
8

2.1 Molecular regulatory network for the initiation of DNA replication
2.1.3 Firing phase
S-Cdk promotes the final phase in the preparation for DNA replication via phosphorylation ofseveral target proteins.
Two proteins, Sld2 and Sld3, are phosphorylated at multiple residues by S-Cdk before theycan bind to Dpb11 to form the Sld3-Dpb11-Sld2 (11-3-2) complex, which associates with theorigins only transiently and is supposed to catalyze the recruitment of the GINS complex to-gether with DNA polymerases. Sld2 is phosphorylated by S-Cdk randomly at six serine andthreonine residues (reaction 14), causing a conformational change in the protein that exposesthe essential threonine 84 residue for phosphorylation by S-Cdk (reaction 16), being the dock-ing site for the binding to Dpb11 (reaction 18) [54, 77]. Phosphorylation of two residues, oneserine and one threonine, in Sld3 by S-Cdk (reaction 14) is essential for the binding to Dpb11(reaction 19) [89, 81]. Phosphorylations in both proteins can be reversed by a phosphatase, pre-sumably Cdc14 [7], which is also assumed to act in a random sequence (reactions 15 and 17). Itis not clear, whether Sld2p, Sld3p and Dpb11 assemble in a preferred sequence or randomly toform the 11-3-2 complex [80].
Mcm2-7 proteins bound to the origin DNA are phosphorylated by two different kinases. S-Cdk is supposed to act as a priming kinase (reaction 20) [62] for the multiple phosphorylation ofMcm2-7 by Ddk (reaction 21) [72]. This multisite phosphorylation is assumed to be processiveand allows the tight binding of the essential molecule Cdc45 to the origins (reaction 22) [41],forming the pre-IC at the origin. The 11-3-2 complex then binds to the pre-IC (reaction 23) andcatalyzes the final step in the formation of the replication complexes, the loading of the GINScomplex together with the DNA polymerase (reaction 24). The 11-3-2 complex associates onlytransiently with the origins and becomes destabilized (reaction 25) after the completion of theRC. The free 11-3-2 complex is then able to bind to the pre-RC at another origin and againcatalyze the DNA polymerase loading reaction at that origins.
RCs are assumed to become destabilized after the complete synthesis of their respective DNAreplicons and, subsequently, the molecular components of the RC become available for the ini-tiation of further origins (reaction 27). Similarly, origins that have not been inhibited by a phos-phorylation at their ORC (explained in detail in the next section) at the time of RC completionare allowed to re-enter the replication initiation network at state S0 (reaction 27), after termi-nation of the synthesis of their respective DNA replicon. These origins may become licenseda second time and initiate DNA rereplication, as long as licensing molecules are available andORC components remain unphosphorylated.
2.1.4 Prevention of DNA rereplication
Several independent mechanisms prevent the re-initiation of an already fired replication origin[2, 9, 59]. It is not clear, whether these mechanisms are redundant or are needed in combinationto ensure the inhibition of DNA rereplication. The basic principle of all these mechanism is theinhibition of licensing reactions, such that the formation of pre-RCs is no longer possible, oncethe firing phase has started.
Three main mechanisms are considered in the mathematical model that contribute to the tem-
9
2 Kinetic model for the initiation of DNA replication
Figure2.1:T
hem
olecularreactionnetw
orkcom
prisesallessentialreactions
inthe
regulationofthe
initiationofD
NA
replicationatthe
replicationorigins.T
heassem
blyofthe
replicationcom
plex(S9)occurs
viathe
transientmolecularcom
plexes,S0to
S8,andis
groupedin
fourmodules,licensing,S-C
dkactivation,11-3-2
activator,andfiring
module,thatproceed
inthree
temporally
successivephases:
licensingphase
(reactionscolored
inblue),interm
ediateperiod
(reactionscolored
inorange)
andfiring
phase(reactions
coloredin
redand
green).
10

2.2 Mathematical model for the formation of replication complexes at the origins
poral limitation of the licensing phase. Two mechanisms rely on phosphorylation by G1-Cdk,that are the degradation of Cdc6 after phosphorylation by G1-Cdk (reaction 2) [36] and theexport of free Mcm2-7 proteins after phosphorylation by G1-Cdk (reaction 8) [49] that is as-sociated with the export of free Cdt1 from the nucleus (reaction 7). The third mechanism isbased on the distinct temporal regulation of the activity of S-Cdk during the licensing and firingphase. S-Cdk phosphorylates ORC components (reaction 26), presumably Orc6 and Orc2 [59],leading to the inhibition of Cdt1 binding to the origins (reaction 3), probably for sterical reasons[59, 14]. In this way the loading of the putative helicase, Mcm2-7, to the origins (transition fromstate S1 to state S3) becomes impossible. S-Cdk also phosphorylates free Mcm2-7 proteins thatare not attached to the DNA (reaction 6) and contributes to the inhibition of origin licensing byblocking the NLS in Mcm2-7 and inducing its export into to cytosol (reaction 8).
Under normal conditions, the mechanisms preventing DNA rereplication do not interfere withthe preparation for origin firing and the formation of the RCs. Normally, origin licensing is com-pleted at almost all origins before the firing phase starts, and the formation of new pre-RCs atthe origins is already inhibited before the completed RC leaves the origin performing DNA syn-thesis.
2.2 Mathematical model for the formation of replication complexesat the origins
To analyze the initiation of DNA replication in budding yeast a mathematical model is con-structed based on the molecular interaction network depicted in Figure 2.1. The mathematicalmodel is formulated as a system of ODEs neglecting spatial dependencies in the molecule con-centrations. This is supposed to appropriately describe the kinetics of DNA replication initiation,since all considered reactions occur within the limited local environment of the cell nucleus andthe diffusion of molecules is assumed to be fast. A stochastic approach for the kinetics of replica-tion origin initiation is not required, as the molecule numbers are all large enough (ranging from> 100 to several thousand molecules) and fluctuations in the molecule numbers are supposed tohave no effect on the kinetics of origin initiation.
Balance equations are formed for all molecule complexes that are free in the nucleoplasm andassembled at the replication origins and for all phosphorylation states. The rate laws for theelementary reactions, that are binding, dissociation, phosphorylation, dephosphorylation, degra-dation, and nuclear export reactions, are derived assuming mass-action kinetics. The completemathematical model consists of a system of 116 ODEs with 14 initial protein concentrations, 51kinetic rate constants, and a sigmoidal input function for the activation of G1-Cdk.
2.2.1 Variables and initial conditions
The molecule complexes and intermediate phosphorylation states that are considered as variablesin the mathematical model are listed in Table 2.2. The corresponding symbolic abbreviation andthe initial amount of the molecule used in the ODE system is indicated.
11
2 Kinetic model for the initiation of DNA replication
Table 2.2: Variables of the model with corresponding symbols and initial numbers.Variable Symbol Number (Conc.)States of replication originsOrc S0 380 (127 nM)Orc/Cdc6 S1 0Orc/Cdc6/Cdt1/Mcm2-7 S2 0Orc/Mcm2-7 S3 0Orc/Mcm2-7/S-Cdk SCdk 0Orc/Mcm2-7p S4 0Orc/Mcm2-7p/Ddk SDdk 0Orc/Mcm2-7pp S5 0Orc/Mcm2-7pp/Cdc45 S6 0Orc/Mcm2-7pp/Cdc45/11-3-2 S7 0Orc/Mcm2-7pp/Cdc45/11-3-2/GINS/DNA polymerase S8 0Orc/Mcm2-7pp/Cdc45/GINS/DNA polymerase S9 0S-Cdk bound Orc in states i = 0,1,3,4,5,6,7,8,9 Sci 0Phosphorylated Orc in states i = 0,1,3,4,5,6,7,8,9 Spi 0Binding factorsCdc6 F1 700 (233 nM)Cdt1 F2a 2200 (733 nM)Mcm2-7 F2b 2000 (667 nM)Mcm2-7p F2bp 0Cdt1–Mcm2-7 F2 0Cdt1–Mcm2-7p F2p 0Cdc45 F4 1700 (567 nM)GINS/DNA polymerase F5 1500 (500 nM)Multisite phosphorylation of Sic1Free Sic1 with i phosphorylations, i = 0, . . . ,9 Sici Sic0: 800 (267 nM)S-Cdk bound Sic1 with i phos., i = 0, . . . ,9 Zi 0G1-Cdk bound Sic1–S-Cdk with i phos., i = 0, . . . ,8 Zai 0Cdc14 bound Sic1–S-Cdk with i phos., i = 1, . . . ,9 Zbi 0Cdks, Ddk and phosphataseCln1,2–Cdc28 (G1-Cdk) Cln 1500 (500 nM)Clb5,6–Cdc28 (S-Cdk) Cdk 600 (200 nM)Dbf4–Cdc7 (Ddk) Ddk 1600 (533 nM)Phosphatase (Cdc14) Pase 360 (120 nM)Multisite phosphorylation of Sld2 and Sld3Free Sld2 with i phosphorylations, i = 0, . . . ,7 Xi X0: 660 (220 nM)S-Cdk bound Sld2 with i phosphorylations, i = 0, . . . ,6 Xai 0Cdc14 bound Sld2 with i phosphorylations, i = 1, . . . ,7 Xbi 0Free Sld3 with i phosphorylations, i = 0,1,2 Yi Y0: 130 (43 nM)S-Cdk bound Sld3 with i phosphorylations, i = 0,1 Yai 0Cdc14 bound Sld3 with i phosphorylations, i = 1,2 Y bi 0Formation of 11-3-2 complexDpb11 C0 540 (180 nM)Dpb11-Sld2p C1 0Sld3p-Dpb11 C2 0Sld3p-Dpb11-Sld2p C3 0
12

2.2 Mathematical model for the formation of replication complexes at the origins
Most values for the initial molecule numbers are taken from experimental data [27]. Althoughthese numbers were determined in unsynchronized cell populations, they nevertheless provide areasonable approximation for the molecule numbers in a single cell and a realistic estimation forthe relative amounts of the different molecules.
The number of Cdc6 molecules was not determined experimentally and is assumed to bepresent in the nucleus in a medium concentration of ∼700 molecules per cell. The number ofS-Cdk (Clb5,6-Cdc28) molecules is limited by the amount of its regulatory cyclins, Clb5 andClb6, whose number was only measured for Clb5 protein (520 molecules per cell) [27]. Theconcentration of Clb6 was reported to be approximately ten times lower than the concentrationof Clb5 [16], resulting in the estimation of ∼600 S-Cdk molecules per cell in total. The numberof Cdc28 molecules, the catalytic subunit of S-Cdk and G1-Cdk, is not limiting, as approxi-mately 6700 molecules are determined to be present in budding yeast cells [27]. The numberof phosphatase molecules was reported to be higher than 8000 for Cdc14 [27]. A much lowernumber of 360 phosphatase molecules per nucleus is assumed in the mathematical model, sinceCdc14 is known to be sequestered in the nucleolus during most of the cell cycle and to bind to amultitude of other substrates that are not part of this model [7, 8].
The number of early origins in the yeast cell is not precisely known and possibly varies amongcells and cell cycles. In the mathematical model, a number of 190 early replication origins isassumed, which was determined by Lengronne et al. (2001) [46]. Moreover, the formation oftwo replication complexes per origin is required for the bidirectional DNA synthesis, resultingin an effective initial number of 380 origins of replication.
The initial number of molecules is converted into units of molecule concentrations in themathematical model as follows:
[molecule] =# moleculeVnucleus ·NA
,
with the volume of the nucleus, Vnucleus = 5×10⁻¹⁵ liter [38], and the Avogadro constant (num-ber of molecules per mol), NA = 6.022×10²³ mol−1.
2.2.2 Mathematical equations
In the following, the balance equations for all intermediate molecule complexes and phosphory-lation states are specified. The equations are separated into groups of reactions concerning thesame molecule or describing a similar reaction type.
States of the replication origins
The assembly of the RC at the replication origin is described by a sequential transition of theorigin through the states S0 to S9, which each represents a distinct combination of moleculesbound to that origin (Figure 2.1 and Table 2.2).
Binding reactions are assumed to be generally reversible, and are specified by kon and ko f f rateconstants (k1 and k−1,k3 and k−3,k20 and k−20,k21 and k−21,k22 and k−22,k23 and k−23,k24 andk−24). An exception are the dissociation of Cdc6 and Cdt1 (rate constant k9) and the dissociation
13

2 Kinetic model for the initiation of DNA replication
of the 11-3-2 activator complex (rate constant k25), which follow the ATP-consuming, directedloading of the putative helicase, Mcm2-7, and the proposed catalytic replacement of the 11-3-2complex in the course of the loading of the GINS–DNA polymerase complex, respectively.
The sequential phosphorylation of Mcm2-7 proteins in pre-RC by S-Cdk and Ddk (phospho-rylation rate constants α20 and α21) leads to the intermediate complexes between kinase andpre-RC, states SCdk and SDdk, and causes a directed, quasi-irreversible transition between thestates S3 and S5.
When the RC is completed in state S9, the fired origin is allowed to re-enter the DNA replica-tion initiation network at state S0 after a time delay of some minutes, which is specified by therate constant k27.
S0′(t) = +k27S9(t)− k1S0(t)F1(t)+ k−1S1(t)− k26S0(t)Cdk(t)+ k−26Sc0(t)
S1′(t) = k1S0(t)F1(t)− k−1S1(t)− k3S1(t)F2(t)+ k−3S2(t)− k26S1(t)Cdk(t)+ k−26Sc1(t)
S2′(t) = k3S1(t)F2(t)− k−3S2(t)− k9S2(t)
S3′(t) = k9S2(t)− k20S3(t)Cdk(t)+ k−20SCdk(t)− k26S3(t)Cdk(t)+ k−26Sc3(t)
SCdk′(t) = k20S3(t)Cdk(t)− k−20SCdk(t)−α20SCdk(t)
S4′(t) = α20SCdk(t)− k21S4(t)Ddk(t)+ k−21SDdk(t)− k26S4(t)Cdk(t)+ k−26Sc4(t) (2.1)
SDdk′(t) = k21S4(t)Ddk(t)− k−21SDdk(t)−α21SDdk(t)
S5′(t) = α21SDdk(t)− k22S5(t)F4(t)+ k−22S6(t)− k26S5(t)Cdk(t)+ k−26Sc5(t)
S6′(t) = k22S5(t)F4(t)− k−22S6(t)− k23S6(t)C3(t)+ k−23S7(t)− k26S6(t)Cdk(t)+ k−26Sc6(t)
S7′(t) = k23S6(t)C3(t)− k−23S7(t)− k24S7(t)F5(t)+ k−24S8(t)− k26S7(t)Cdk(t)+ k−26Sc7(t)
S8′(t) = k24S7(t)F5(t)− k−24S8(t)− k25S8(t)− k26S8(t)Cdk(t)+ k−26Sc8(t)
S9′(t) = k25S8(t)− k27S9(t)− k26S9(t)Cdk(t)+ k−26Sc9(t)
S-Cdk phosphorylates ORC subunits, presumably Orc6 and Orc2 [59], with the rate constantα26, contributing to prevent DNA rereplication. S-Cdk is assumed to bind to the origins in allstates (rate constants k26 and k−26), except in state S2, in which S-Cdk is supposed to stericallyinterfere with Cdt1 [59, 14]. The kinetics of the transient complexes between S-Cdk and theorigin are given by the balance equations, Sc0,Sc1 and Sc3 to Sc9:
Sci′(t) = k26Si(t)Cdk(t)− k−26Sci(t)−α26Sci(t), i = 0,1,3,4,5,6,7,8,9
The balance equations for the molecule complexes assembled at replication origins that arephosphorylated at ORC subunits, Sp0,Sp1 and Sp3 to Sp9, are:
14

2.2 Mathematical model for the formation of replication complexes at the origins
Sp0′(t) =−k1Sp0(t)F1(t)+ k−1Sp1(t)+α26Sc0(t)
Sp1′(t) = k1Sp0(t)F1(t)− k−1Sp1(t)+α26Sc1(t)
Sp3′(t) = α26Sc3(t)− k20Sp3(t)Cdk(t)+ k−20SpCdk(t)
SpCdk′(t) = k20Sp3(t)Cdk(t)− k−20SpCdk(t)−α20SpCdk(t)
Sp4′(t) = α26Sc4(t)+α20SpCdk(t)− k21Sp4(t)Ddk(t)+ k−21SpDdk(t)
SpDdk′(t) = k21Sp4(t)Ddk(t)− k−21SpDdk(t)−α21SpDdk(t) (2.2)
Sp5′(t) = α26Sc5(t)+α21SpDdk(t)− k22Sp5(t)F4(t)+ k−22Sp6(t)
Sp6′(t) = α26Sc6(t)+ k22Sp5(t)F4(t)− k−22Sp6(t)− k23Sp6(t)C3(t)+ k−23Sp7(t)
Sp7′(t) = α26Sc7(t)+ k23Sp6(t)C3(t)− k−23Sp7(t)− k24Sp7(t)F5(t)+ k−24Sp8(t)
Sp8′(t) = α26Sc8(t)+ k24Sp7(t)F5(t)− k−24Sp8(t)− k25Sp8(t)
Sp9′(t) = α26Sc9(t)+ k25Sp8(t)− k27Sp9(t)
In the phosphorylated origin state Spi all reactions are assumed to occur with the same rateconstant as in the unphosphorylated origin state Si specified in equations (2.1). As alreadymentioned, the binding of the Cdt1–Mcm2-7 complex in state Sp1 is impossible, since the stateSp2 does not exist. The re-entering of completed, phosphorylated RCs, state Sp9, to the initialstate of the origins, Sp0, is also not considered for RCs with phosphorylated ORC subunits,because these origins are inhibited to become licensed again. Due to the absence of state Sp2,and the assumed irreversibility of the ORC phosphorylation by S-Cdk within the simulated timeperiod, the formation of new, phosphorylated pre-RCs is impossible.
Molecules binding in licensing and firing phase
Equations (2.1) and (2.3) describe the binding of different molecules to the replication origins indistinct states: the licensing factors, Cdc6, Cdt1 and Mcm2-7 (F1 to F2p), in states S0 and S1, andthe firing factors, Cdc45, GINS complex and DNA polymerase (F4 and F5), in states S5 to S7.Mcm2-7 molecules, Cdc45, GINS complex and the DNA polymerase (F2b,F4 and F5) remainpart of the RC, whereas the other molecules only associate transiently with the origins. Thebalance equations for the free concentrations of the binding factors, Fi, account for the binding,dissociation, degradation, and nuclear export of these molecules, but neglect protein synthesisas well as new import into the cell nucleus.
15

2 Kinetic model for the initiation of DNA replication
F1′(t) =−k1F1(t)(S0(t)+Sp0(t))+ k−1(S1(t)+Sp1(t))+ k9S2(t)−δ2F1(t) fCln(t)
F2a′(t) =−k4F2a(t)F2b(t)+ k−4F2(t)− k5F2a(t)F2bp(t)+ k−5F2p(t)+ k9S2(t)− k7F2a(t)
F2b′(t) =−k4F2a(t)F2b(t)+ k−4F2(t)−α6F2b(t)( fCln(t)+
Cdk(t)[Clb56]
)+ k27(S9(t)+Sp9(t))
F2bp′(t) = α6F2bp(t)( fCln(t)+
Cdk(t)[Clb56]
)− k5F2a(t)F2bp(t)+ k−5F2p(t)− k8F2bp(t) (2.3)
F2′(t) = k4F2a(t)F2b(t)− k−4F2(t)− k3S1(t)F2(t)+ k−3S2(t)−α6F2(t)( fCln(t)+
Cdk(t)[Clb56]
)
F2p′(t) = α6F2(t)( fCln(t)+
Cdk(t)[Clb56]
)+ k5F2a(t)F2bp(t)− k−5F2p(t)− k8F2p(t)
F4′(t) =−k22F4(t)(S5(t)+Sp5(t))+ k−22(S6(t)+Sp6(t))+ k27(S9(t)+Sp9(t))
F5′(t) =−k24F5(t)(S7(t)+Sp7(t))+ k−24(S8(t)+Sp8(t))+ k27(S9(t)+Sp9(t))
The kinetic parameters for the binding reactions of the molecules to the replication origins instates Si and Spi are specified already in equations (2.1) and (2.3). The G1-Cdk-dependent degra-dation of Cdc6 (F1) is represented in the mathematical model by the rate constant, δ2, multipliedby the time-dependent function for the G1-Cdk activation, fCln(t) (specified later in equation(2.16)). The formation of the complex consisting of Cdt1 (F2a) and Mcm2-7 (F2b) is describedby the rate constants k4 and k−4. The phosphorylation of Mcm2-7 proteins, free or in complexwith Cdt1, by G1-Cdk and S-Cdk is described by the phosphorylation rate constant, α6, mul-tiplied by the activation functions of G1-Cdk and S-Cdk, ( fCln(t)+ Cdk(t)
[Clb56]) (given in equations(2.16) and (2.18)). Phosphorylated Mcm2-7 proteins, Mcm2-7p, are assumed to have a lowerbinding affinity to Cdt1 (rate constants k5 and k−5). Free phosphorylated Mcm2-7p molecules(F2bp) and phosphorylated Cdt1–Mcm2-7p complexes (F2p) are exported from the nucleus withthe same rate constant k8. The nuclear export of free Cdt1 molecules is described by the rateconstant k7.
Multiple phosphorylation of Sld2 and Sld3
Experimental data by Tak et al. (2006) [77] indicated that threonine 84, which is essential forthe binding of Sld2 to Dpb11, is phosphorylated with a time delay of some minutes comparedto other serine and threonine phosphorylations. A conformational change in the Sld2 protein,occurring only after six random serine and threonine phosphorylations in Sld2 by S-Cdk, issupposed to be the reason for the delayed accessibility of threonine 84 for phosphorylation byS-Cdk [77, 80]. Simulation of the phosphorylation kinetics of six randomly phosphorylatedserine and threonine residues leads to identical time courses for these phosphorylations, whichhas indeed been observed experimentally for two different residues (Figure 2.2(a)). Threonine84 is assumed the last residue to be phosphorylated. This causes a delayed formation of fullyphosphorylated Sld2 (Figure 2.2(a)).
For the binding of Sld3 to Dpb11, the phosphorylation of two residues in Sld3 by S-Cdk ap-
16

2.2 Mathematical model for the formation of replication complexes at the origins
200
60
100
Phos
phor
ylat
ion
leve
l (%
)
Time (minutes)
sequential phosphorylationof threonine 84
(b)
20
40
80random phosphorylationof six serine and threonine residues
151050
(a)
Figure 2.2: (a) The phosphorylation kinetics of three different residues in Sld2, measured invitro by Tak et al. (2006) [77], indicate a simultaneous (random) phosphorylationof two serine residues and a delayed (sequential) phosphorylation of threonine 84by S-Cdk. (b) The simulated phosphorylation kinetics of Sld2 can reproduce theexperimentally observed, delayed phosphorylation of threonine 84 after six randomphosphorylations. The time scale of phosphorylations in the simulation and in vivois supposed to be faster than in the in vitro experiment.
pears to be crucial [81, 89], whose order is also assumed to be random.
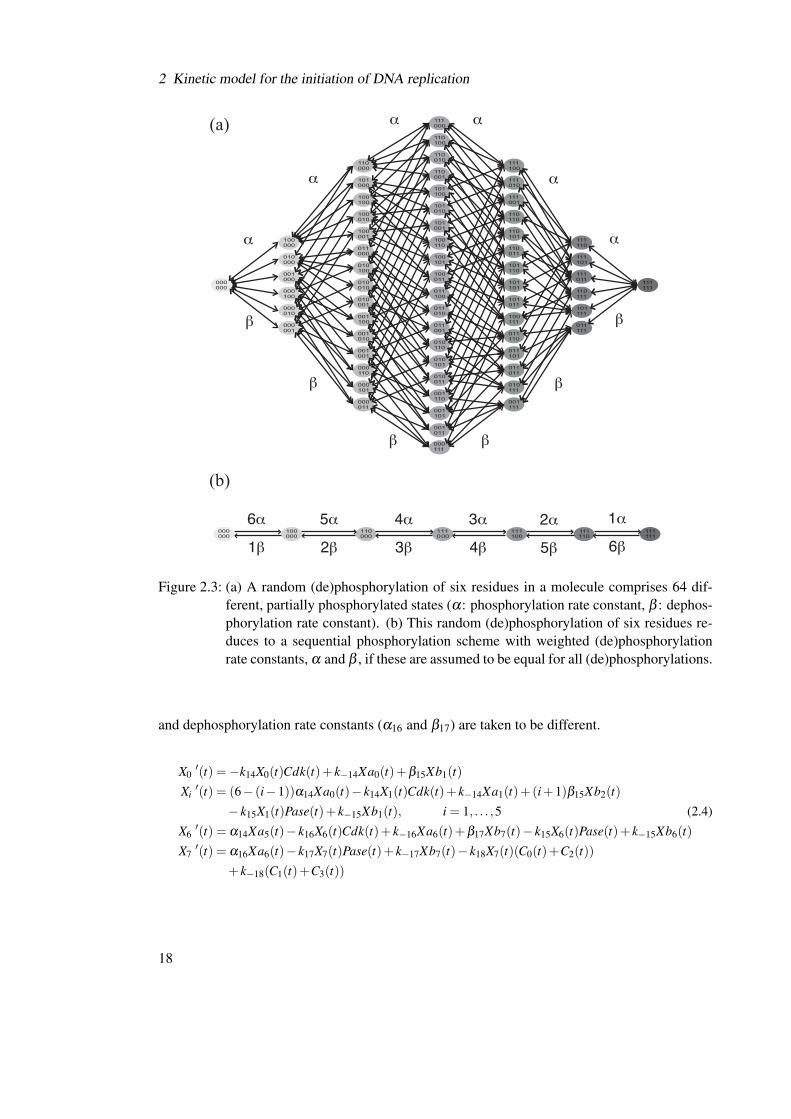
In the mathematical model, the multiple random phosphorylation of Sld2 and Sld3 is simpli-fied with the assumption that the binding and dissociation rate constants describing the complexformation of kinase and substrate, k14 and k−14, as well as the phosphorylation rate constants,α14, are equal for all randomly phosphorylated residues [70]. The same simplification is madefor the multiple random dephosphorylation of Sld2 and Sld3 by the phosphatase, Cdc14, with theequivalent assumption, that the rate constants describing the complex formation of phosphataseand substrate, k15 and k−15, as well as the dephosphorylation rate constants (β15) are equal forall residues becoming dephosphorylated.
The high number of intermediate, partially phosphorylated states in a random phosphoryla-tion scheme (Figure 2.3(a)) reduces to a sequential phosphorylation scheme (Figure 2.3(b)) bygrouping all intermediate states with the same total number of phosphorylated residues togetherin one variable. In this case, the phosphorylation rate constants have to be slightly modified, byweighting them by the total number of phosphorylations that are possible in the next step, whichis equal to the total number of up to then unphosphorylated residues in the molecule. In the caseof a multiple dephosphorylation, the dephosphorylation rate constants have to be weighted bythe number of next possible dephosphorylation steps, which is equal to the number of phospho-rylated residues.Using this simplification, the number of differential equations needed to describe the six randomphosphorylations in Sld2 reduces from 64 to seven differential equations, X0 to X6. The lastsequential phosphorylation of threonine 84 in Sld2, is described by an additional equation, X7.This phosphorylation step is assumed to have the same binding and dissociation rate constantsof kinase, S-Cdk (k16 and k−16), and phosphatase, Cdc14 (k17 and k−17), but the phosphorylation
17
2 Kinetic model for the initiation of DNA replication
111000
110010
110001
101100
101010
101001
100110
100101
100011
011100
011010
011001
010110
010101
010011
001110
001101
001011
000111
111111
010001
001100
001010
001001
000110
000101
000011
010100
011000
100001
100010
100100
101000
110000
111011
111101
111110
110111
101111
011111
010010
101011
100111
011110
011101
011011
010111
001111
101110
110011
110101
110110
111001
111010
111100
101101
001000
010000
100000
000100
000010
000001
000000
110100
000111
111111
110111
000110
100111
000100
000000
6α 5α 4α 3α 2α 1α1β 2β 3β 4β 5β 6β
α
α
α α
α
α
β
β
β β
β
β
(a)
(b)
Figure 2.3: (a) A random (de)phosphorylation of six residues in a molecule comprises 64 dif-ferent, partially phosphorylated states (α: phosphorylation rate constant, β : dephos-phorylation rate constant). (b) This random (de)phosphorylation of six residues re-duces to a sequential phosphorylation scheme with weighted (de)phosphorylationrate constants, α and β , if these are assumed to be equal for all (de)phosphorylations.
and dephosphorylation rate constants (α16 and β17) are taken to be different.
X0′(t) =−k14X0(t)Cdk(t)+ k−14Xa0(t)+β15Xb1(t)
Xi′(t) = (6− (i−1))α14Xa0(t)− k14X1(t)Cdk(t)+ k−14Xa1(t)+(i+1)β15Xb2(t)
− k15X1(t)Pase(t)+ k−15Xb1(t), i = 1, . . . ,5 (2.4)X6′(t) = α14Xa5(t)− k16X6(t)Cdk(t)+ k−16Xa6(t)+β17Xb7(t)− k15X6(t)Pase(t)+ k−15Xb6(t)
X7′(t) = α16Xa6(t)− k17X7(t)Pase(t)+ k−17Xb7(t)− k18X7(t)(C0(t)+C2(t))
+ k−18(C1(t)+C3(t))
18

2.2 Mathematical model for the formation of replication complexes at the origins
To account for the kinetics of the intermediate complexes between kinase, S-Cdk, and sub-strate, Sld2, and between phosphatase, Cdc14, and substrate, Sld2, seven additional balanceequations are needed for each complex, Xa0 to Xa6, and Xb1 to Xb7.
Xai′(t) = k14Xi(t)Cdk(t)− k−14Xai(t)− (6− i)α14Xai(t), i = 0, . . . ,5 (2.5)
Xa6′(t) = k16X6(t)Cdk(t)− k−16Xa6(t)−α16Xa6(t)
Xbi′(t) = k15Xi(t)Pase(t)− k−15Xbi(t)− iβ15Xbi(t), i = 1, . . . ,6 (2.6)
Xb7′(t) = k17X7(t)Pase(t)− k−17Xb7(t)−β17Xb7(t)
The number of differential equations for the multiple phosphorylation of Sld3 by S-Cdk re-duces accordingly from four to three equations, Y0 to Y2.
Y0′(t) =−k14Y0(t)Cdk(t)+ k−14Ya0(t)+β15Y b1(t)
Y1′(t) = 2α14Ya0(t)− k14Y1(t)Cdk(t)+ k−14Ya1(t)+2β15Y b2(t)− k15Y1(t)Pase(t)
+ k−15Y b1(t) (2.7)Y2′(t) = α14Ya1(t)− k15Y2(t)Pase(t)+ k−15Y b2(t)− k19Y2(t)(C0(t)+C1(t))
+ k−19(C2(t)+C3(t))
Two additional balance equations each describe the kinetics of the intermediate complexesbetween S-Cdk and Sld3, Ya0,Ya1, and between Cdc14 and Sld3, Y b1,Y b2.
Yai′(t) = k14Yi(t)Cdk(t)− k−14Yai(t)− (i+1)α14Yai(t), i = 0,1 (2.8)
Y bi′(t) = k15Yi(t)Pase(t)− k−15Y bi(t)−β15Y bi(t), i = 1,2 (2.9)
The binding, dissociation, and (de)phosphorylation rate constants for the reactions with Sld3are taken to be the same as for the multiple random phosphorylation of Sld2.
11-3-2 complex formation
Completely phosphorylated Sld2 and Sld3 bind to Dpb11 and form the 11-3-2 complex (C3).The precise order of this complex assembly is still unclear [80]. We assume a random orderwith two intermediate complexes, Sld2–Dpb11 (C1) and Sld3–Dpb11 (C2). The binding anddissociation rate constants for Sld2 to Dpb11 (k18 and k−18) and Sld3 to Dpb11 (k19 and k−19)are each assumed to be independent of the binding order, as a first or second molecule, to Dbp11.The kinetic parameters for the binding and dissociation of the 11-3-2 activator complex to theorigins (k23 and k−23 and k25) are already specified in the balance equations for the states of theorigins (equations (2.1) and (2.3)).
19

2 Kinetic model for the initiation of DNA replication
C0′(t) =−C0(t)(k18X7(t)+ k19Y2(t))+ k−18C1(t)+ k−19C2(t)
C1′(t) = k18X7(t)C0(t)− k19Y2(t)C1(t)− k−18C1(t)+ k−19C3(t)
C2′(t) = k19Y2(t)C0(t)− k18X7(t)C2(t)− k−19C2(t)+ k−18C3(t) (2.10)
C3′(t) = k19Y2(t)C1(t)+ k18X7(t)C2(t)− k−19C3(t)− k−18C3(t)− k23C3(t)(S6(t)+Sp6(t))
+ k−23(S7(t)+Sp7(t))+ k25(S8(t)+Sp8(t))
Multiple phosphorylation and degradation of the S-Cdk inhibitor, Sic1
The stoichiometric inhibitor of S-Cdk, Sic1, is phosphorylated randomly by G1-Cdk at multipleresidues before it is recognized by the SCFCdc4 complex and degraded via ubiquitin-dependentproteolysis. Subsequently, active S-Cdk becomes free [58, 20]. Sic1 is assumed to bind to S-Cdkwith a very high affinity (rate constants k12 and k−12), which is independent of the phosphory-lation state of Sic1. Nine phosphorylation sites are considered in Sic1 in total, whereas alreadyafter any combination of six up to nine Sic1 phosphorylations by G1-Cdk [58, 20], degradationof Sic1 (rate constant δ13) is rendered possible in the mathematical model.
Sici′(t) =−k12Cdk(t)Sici(t)+ k−12Zi(t), i = 0, . . . ,5 (2.11)
Sici′(t) =−k12Cdk(t)Sici(t)+ k−12Zi(t)−δ13Sici(t), i = 6, . . . ,9
The mathematical description of the multiple random phosphorylation of the Sic1–S-Cdkcomplex is simplified in the model as in the case of Sld2 and Sld3. The rate constants forthe kinase, G1-Cdk, to substrate, Sic1–S-Cdk, binding and dissociation, k10 and k−10, and thephosphorylation rate constants, α10, as well as the rate constants for the phosphatase, Cdc14, tosubstrate, Sic1–S-Cdk, binding and dissociation, k11 and k−11, and the dephosphorylation rateconstants, β11, are taken to be the same for all residues, that become (de)phosphorylated. Inthe case of the nine random phosphorylations in Sic1, the number of phosphorylation states thatneed to be considered in the mathematical model reduces from 29 = 512 to only 10, Z0 to Z9.
Z0′(t) = k12Cdk(t)Sic0(t)− k−12Z0(t)− k10Cln(t) fCln(t)Z0(t)+ k−10Za0(t)+β11Zb1(t)
Zi′(t) = k12Cdk(t)Sici(t)− k−12Zi(t)+(9− (i−1))α10Zai−1(t)− k11Zi(t)Pase(t)
+ k−11Zbi(t)− k10Cln(t) fCln(t)Zi(t)+ k−10Zai(t)+(i+1)β11Zbi+1(t), i = 1, . . . ,8 (2.12)Z9′(t) = k12Cdk(t)Sic9(t)− k−12Z9(t)+α10Za8(t)− k11Z9(t)Pase(t)+ k−11Zb9(t)
Nine differential equations are each needed to describe the intermediate complexes betweenG1-Cdk and Sic1–S-Cdk, Za0 to Za8, and between the phosphatase, Cdc14, and Sic1–S-Cdk,Zb1 to Zb9.
20

2.2 Mathematical model for the formation of replication complexes at the origins
Zai′(t) = k10Cln(t) fCln(t)Zi(t)− k−10Zai(t)− (9− i)α10Zai(t), i = 0, . . . ,8 (2.13)
Zbi′(t) = k11Zi(t)Pase(t)− k−11Zbi(t)− iβ11Zbi(t), i = 1, . . . ,9
Cell cycle-dependent kinases, G1-Cdk and S-Cdk, phosphatase, and Ddk
G1-Cdk becomes active in late G1 phase and is responsible for the termination of the licensingphase and the activation of S-Cdk. In the mathematical model, a sigmoid time-dependent func-tion describes the switch-like activation of G1-Cdk, which is due to the experimentally observedpositive feedback loop in the expression of the G1 phase cyclins, Cln1 and Cln2 [74], the regu-latory subunits of G1-Cdk. More precisely, G1-Cdk is assumed to become active approximately20 minutes after the start of origin licensing (time shift t0 = 1500 seconds) and to reach its maxi-mal activity within around ten minutes (time constant λ = 0.0075 1/second) in the mathematicalmodel.Experimental data of Cln2 synthesis indicate, that G1-Cdk becomes active 20 to 60 minutes afterbirth in daughter cells [74].
fCln(t) =12(1+ tanh(λ (t− t0))) (2.14)
=12(1+ tanh(0.0075(t−1500)))
The balance equation for the free G1-Cdk concentration, Cln(t), considers the complex for-mation with Sic1–S-Cdk and its phosphorylation reaction (equations (2.13) and (2.14)). In theODE system, all kinetic rate constants of reactions involving free G1-Cdk are modified by theactivation function of G1-Cdk, fCln(t) (equation (2.16)).
Cln ′(t) =−k10Cln(t) fCln(t)8
∑i=0
Zi(t)+ k−10
8
∑i=0
Zai(t)+α20(8
∑i=0
(9− i)Zai(t)) (2.15)
(2.16)
The balance equation for the free S-Cdk concentration, Cdk(t), considers the binding reac-tions of S-Cdk to Mcm2-7 proteins, to ORC subunits in the different origin states, and to Sic1,Sld2, and Sld3 in all intermediate phosphorylation states and with the corresponding phospho-rylation reactions. The kinetic parameters of these reactions have already been specified before.
21

2 Kinetic model for the initiation of DNA replication
Cdk ′(t) =−k12Cdk(t)9
∑i=0
Sici(t)+ k−12
9
∑i=0
Zi(t)
− k14Cdk(t)(6
∑i=0
Xi(t)+1
∑i=0
Yi(t))+ k−14(6
∑i=0
Xai(t)+1
∑i=0
Yai(t))
+α14(5
∑i=0
(6− i)Xai(t)+1
∑i=0
(2− i)Yai(t))+α16Xa6(t) (2.17)
− k26Cdk(t)(1
∑i=0
Si(t)+9
∑i=3
Si(t))+ k−26(1
∑i=0
Sci(t)+9
∑i=3
Sci(t))+α26(1
∑i=0
Sci(t)+9
∑i=3
Sci(t))
− k20Cdk(t)(S3(t)+Sp3(t))+ k−20(SCdk(t)+SpCdk(t))+α20(SCdk(t)+SpCdk(t))
The balance equation for the free concentration of the phosphatase, Pase(t), accounts for thebinding reactions of the phosphatase to Sic1, Sld2 and Sld3 in all intermediate phosphorylationstates and with the corresponding dephosphorylation reactions. The kinetic parameters of thesereactions are specified in equations (2.5) to (2.10) and equations (2.13) to (2.15).
Pase ′(t) =−k11Pase(t)9
∑i=1
Zi(t)+ k−11
9
∑i=1
Zbi(t)+β11(9
∑i=1
iZbi(t)) (2.18)
− k15Pase(t)(7
∑i=1
Xi(t)+2
∑i=1
Yi(t))+ k−15(7
∑i=1
Xbi(t)+2
∑i=1
Y bi(t))
+β15(6
∑i=1
iXbi(t)+2
∑i=1
iY bi(t))+β17Xb7(t)
The balance equation for the free Ddk concentration, Ddk(t), considers the binding of Ddk toMcm2-7 proteins and the phosphorylation of the Mcm2-7 molecules. The kinetic parameters ofthese reactions are specified in equations (2.1) and (2.3).
Ddk ′(t) =−k21Ddk(t)(S4(t)+Sp4(t))+ k−21(SDdk(t)+SpDdk(t)) (2.19)+α21(SDdk(t)+SpDdk(t))
2.3 Functional parameterizations of the mathematical model
To parametrize the mathematical model, parameter sets that have the ability to reproduce thefunctionality of the biological system are generated systematically. Firstly, functional propertiescharacterizing the biological system are formulated mathematically allowing to quantify andcompare the systems functionality of different model parameterizations. Secondly, biochem-ically realistic parameter ranges are specified for the various types of kinetic rate constants.
22

2.3 Functional parameterizations of the mathematical model
Finally, random parameter sets are generated within the biochemically allowed ranges and sub-sequently optimized, in order to maximize the systems functionality and to account for the ob-served degree of functionality.
2.3.1 Definition of functional systems properties
The kinetics of origin firing has to fulfill certain conditions in order to be physiologically func-tional. In the mathematical model, the kinetics of origin firing is described by the firing rate,f (t), which gives the number of origins activated per time interval:
f (t) = k25(S8(t)+S8p(t)). (2.20)
f (t) is the principle output of simulating the dynamics of the replication initiation network andcan be compared directly to experimental measurements of activation times of replication ori-gins in the budding yeast genome (see next chapter).
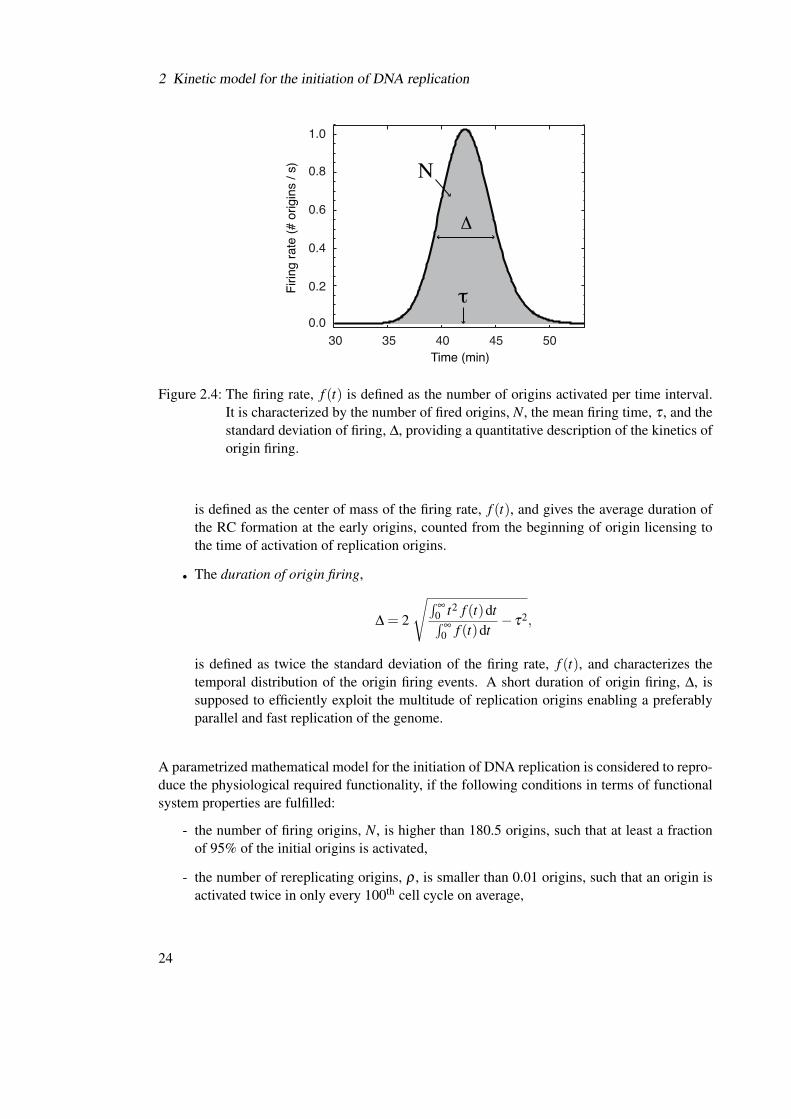
The mathematical formulation of the kinetics of origin firing allows its quantification bymeans of four functional systems properties that are defined through the zeroth, first and secondmomentum of the distribution of origin firing times, f (t), (Figure 2.4):
• The number of firing origins,
N =∞∫
0
f (t) |k27=0 dt,
comprises all origins that are activated in one round of the cell cycle. Reactivated originsthat have already been fired once and thus initiate DNA rereplication are not considered. Ahigh number of activated origins is supposed to be advantageous, since then the multitudeof origins is exploited most efficiently and the duplication of the genome becomes faster.
• The number of rereplicating origins,
ρ =∞∫
0
f (t)dt−N,
is determined as the difference between the total number of origin firing events and thenumber of origins that are fired for the first time, N, in one cell cycle. As the number oforigins is converted into units of concentration in the mathematical model and thus is acontinuous variable, the number of rereplicating origins, ρ , can be determined even if it isbelow one. In this case, ρ has the interpretation of a probability that one origin out of 190origins in total is activated a second time in one cell cycle and causes DNA rereplication.
• The mean time to origin firing,
τ =∫
∞
0 t f (t)dt∫∞
0 f (t)dt,
23
2 Kinetic model for the initiation of DNA replication
30 35 40 45 500.0
0.2
0.4
0.6
0.8
1.0
Time (min)
Firing
rate
(# o
rigins
/ s)
Δ
τ
Ν
Figure 2.4: The firing rate, f (t) is defined as the number of origins activated per time interval.It is characterized by the number of fired origins, N, the mean firing time, τ , and thestandard deviation of firing, ∆, providing a quantitative description of the kinetics oforigin firing.
is defined as the center of mass of the firing rate, f (t), and gives the average duration ofthe RC formation at the early origins, counted from the beginning of origin licensing tothe time of activation of replication origins.
• The duration of origin firing,
∆ = 2
√∫∞
0 t2 f (t)dt∫∞
0 f (t)dt− τ2,
is defined as twice the standard deviation of the firing rate, f (t), and characterizes thetemporal distribution of the origin firing events. A short duration of origin firing, ∆, issupposed to efficiently exploit the multitude of replication origins enabling a preferablyparallel and fast replication of the genome.
A parametrized mathematical model for the initiation of DNA replication is considered to repro-duce the physiological required functionality, if the following conditions in terms of functionalsystem properties are fulfilled:
- the number of firing origins, N, is higher than 180.5 origins, such that at least a fractionof 95% of the initial origins is activated,
- the number of rereplicating origins, ρ , is smaller than 0.01 origins, such that an origin isactivated twice in only every 100th cell cycle on average,
24

2.3 Functional parameterizations of the mathematical model
- the mean time to firing, τ , is below 85 minutes, and
- the duration of firing, ∆, is shorter than 25 minutes.
2.3.2 Biochemically allowed parameter ranges
The kinetic parameters describing the different types of reactions, that are binding, dissociation,phosphorylation and dephosphorylation reactions, are biochemically restricted. In the mathe-matical model, the values of the kinetic parameters are constrained within the following ranges.
Binding rate constant: kx ∈[103, . . . ,5×105
]M−1 s−1
Dissociation rate constant: k−x ∈[kx×10−8, . . . ,kx×10−6
]s−1
Phosphorylation rate constant: αx ∈ [0.01, . . . ,1] s−1
Dephosphorylation rate constant: βx ∈ [0.05, . . . ,5] s−1
Binding rate constants are assumed to be not faster than the diffusion limit for bimolecu-lar reactions [61]. The dissociation constants, KD = k−x/kx, are considered to not be smallerthan 10−8 M, which is reported to be an appropriate bound for the affinity of protein-proteinor protein-DNA interactions [26]. Phosphorylation rate constants are assumed to be in the sec-ond to sub-second range and dephosphorylation reactions are taken to be slightly faster thanphosphorylation reactions [43].
As the reactions have to be rather fast to account for the observed kinetics of origin firing, thekinetic rate constants are considered to be minimally 0.01 to 0.001 times slower than their max-imum biochemically allowed rate, limiting the possible ranges for the kinetic parameter valuesto 2 to 3 orders of magnitude.
2.3.3 Determination of functional parameter sets through optimization
Functional parameter sets are generated by, firstly, assigning the kinetic parameter values of thelicensing and S-Cdk activation modules according to experimental, quantitative and qualitative,observations. In particular, we considered that licensing of early origins was completed beforeS-Cdk became active. The dissociation constant for the binding of Cdc6 to the origins [25] andthe Cdc6 degradation rate constant [23] have been measured, and values for the binding rateconstants of Sic1 and S-Cdk were reported [5, 6]. All other rate constants are chosen withinthe biochemically allowed ranges. Secondly, several parameter sets are generated with fixed,identical kinetic parameters for the licensing and S-Cdk activation modules (Table 2.3), anddifferent, randomly drawn kinetic parameters for the firing and 11-3-2 activator modules (seeFigure 2.1 for the model submodules). The values of all kinetic parameters are constraint withinbiochemically given ranges and are assigned randomly on a logarithmic scale to ensure an equaldistribution of the parameter values, across the orders of magnitudes, in the different parametersets.
25

2 Kinetic model for the initiation of DNA replication
Table 2.3: Fixed values of the kinetic rate constants in the licensing and S-Cdk activation modulein all parameter sets.
Parameter Symbol Value Unit ReferenceLicensing moduleBinding of Cdc6 k1 2×10⁵ (Ms)−1 [25]Dissociation of Cdc6 k−1 0.2 s−1 [25]Degradation of Cdc6 δ2 0.005 s−1 [23]Binding of Cdt1-Mcm2-7 k3 1×10⁵ (Ms)−1
Dissociation of Cdt1-Mcm2-7 k−3 0.05 s−1
Binding of Cdt1 and Mcm2-7 k4 2×10⁵ (Ms)−1
Dissociation of Cdt1 and Mcm2-7 k−4 0.02 s−1
Binding of Cdt1 and Mcm2-7p k5 2×10³ (Ms)−1
Dissociation of Cdt1 and Mcm2-7p k−5 2 s−1
Phosphorylation of (Cdt1-)Mcm2-7 α6 0.002 s−1
Export of Cdt1 k7 0.005 s−1
Export of (Cdt1-)Mcm2-7p k8 0.005 s−1
Dissociation of Cdc6, Cdt1 k9 0.167 s−1
S-Cdk activation moduleBinding of G1-Cdk and S-Cdk-Sic1 k10 5×10⁵ (Ms)−1
Dissociation of G1-Cdk and S-Cdk-Sic1 k−10 5 s−1
Phosphorylation of S-Cdk-Sic1 α10 0.1 s−1
Binding of Cdc14 and S-Cdk-Sic1 k11 5×10⁴ (Ms)−1
Dissociation of Cdc14 and S-Cdk-Sic1 k−11 0.5 s−1
Dephosphorylation of S-Cdk-Sic1 β11 2.5 s−1
Binding of Sic1 and S-Cdk k12 2.5×10⁶ (Ms)−1 [6]Dissociation of Sic1 and S-Cdk k−12 9.2×10⁻³ s−1 [5]Degradation of Sic1(ip), i = 6, . . . ,9 δ13 1 s−1
Simulations with the mathematical model revealed that parameter sets with randomly gener-ated parameter values, although constraint within biochemically reasonable ranges, are generallynot able to reproduce a physiologically functional kinetic behavior. In most cases, the timingof origin firing was by far too slow resulting in an average mean time to origin firing, τ , and aduration of firing, ∆, of longer than 15 hours. In only 9 out of 10000 randomly generated param-eter sets, the kinetics of origin firing was found to be functional, as defined above. However, theaverage functional systems properties of these parameter sets (activated origins N = 185.6 ori-gins, rereplicating origins ρ = 3.9×10⁻⁵ origins, mean time to origin firing τ = 63.9 minutes,and duration of firing ∆ = 19.6 minutes) reveal that the kinetics of origin firing is still not fastenough to account for the experimentally observed distribution of origin firing times (Figure 3.1(b) and (c)).
This indicates a need for a more systematic determination of functional parameter sets, which
26

2.3 Functional parameterizations of the mathematical model
is realized by an optimization of the systems functionality as a function of the kinetic parameters.
Optimization of the systems functionality
All biological systems are subject to natural evolution, in which mutations and selection lead toan optimization of the functional behavior of the system. Hence, the computational optimizationof the functionality of a biological system, in order to determine its kinetic parameters, is anappropriate approach, which has previously been applied in the analysis of metabolic networks,e.g. to determine optimal enzyme concentrations or maximal enzyme activities [34].
The mathematical model for the initiation of DNA replication in budding yeast revealed thatthe kinetics of origin firing generated with random parameter sets was much too slow comparedto the experimental observations. To enhance the functionality of the system, that is to acceleratethe kinetics and the coherence of origin firing, the duration of origin firing, ∆, is chosen as anobjective function in the optimization process, in which it is minimized as a function of thekinetic parameters. As the duration of firing, ∆, and the mean time to firing, τ , are interdependentfunctional systems properties (shown later), the minimization of the duration of firing, ∆, impliesan optimization of the overall timing of origin firing, characterized by ∆ and τ . The timing oforigin firing is supposed to be independent of reactions in the licensing and S-Cdk activationmodules [22, 10]. Hence, only the 23 kinetic parameters of the firing and 11-3-2 activatormodule (out of 51 kinetic parameters in total) are subject to an optimization of the duration oforigin firing, ∆, for a given S-Cdk activation kinetics:
min∆(~p) = min∆({p1, p2, . . . , p23}).
An evolutionary optimization algorithm, which relies on a stochastic optimization approach,is chosen, because these algorithms have demonstrated to work well for complex optimizationproblems [4, 57]. In contrast to deterministic optimization methods, like gradient-based methodsthat use first or second order derivatives and are only good in finding local optima, stochasticoptimization methods are applied to search for global optima in systems with multiple local min-ima or maxima. Moreover, evolutionary optimization algorithms are easy to implement, robustand inherently parallel. Contrariwise, they are computationally rather expensive.The minimization of the duration of firing, ∆, was implemented in Mathematica 7.0 [86]using the function, NMinimize, with the specific method DifferentialEvolution. Thebiochemically allowed ranges for the kinetic parameter values as well as additional requirementsto the systems functionality were integrated as constraints in the algorithm.
Evolutionary optimization algorithm
1. The algorithm starts with a population of m randomly generated parameter sets,
{~p1,~p2, . . . ,~p j, . . . ,~pm},
27

2 Kinetic model for the initiation of DNA replication
where typically m >> n, with n being the number of parameter values to be optimized(here: n = 23 and m = 1000, see Table 2.4).
2. In each iteration, the algorithm generates a new population of m parameter sets maintain-ing the total number of m parameter sets.The jth new parameter set, ~p jnew , is created as follows:
2.a) Three old parameter sets, ~pu, ~pv and ~pw, are randomly selected from the populationof m parameter sets.
2.b) An auxiliary parameter set, ~ps, is formed,
~ps = ~pw + s(~pu−~pv),
where s is a real scaling factor (here: s = 0.6, see Table 2.4).2.c) The jth new parameter set, ~p jnew , is then composed of parameter values, p jnew,i, from
the old, ~p jold , and the auxiliary, ~ps, parameter set:
p jnew,i =
{ps,i with probability η
p jold ,i with probability 1−η, for i = 1, . . . ,23,
where η is a real number between 0 and 1 (here: η = 0.5, see Table 2.4).2.d) The objective function, ∆, is evaluated for both parameter sets, ~p jnew and ~p jold , and the
old parameter set, ~p jold , is replaced by the new parameter set, ~p jnew , in the population,if:
∆(~p jnew) < ∆(~p jold ).
The options of the DifferentialEvolution method and the appropriate values chosenhere are listed in Table 2.4.
Fully optimized parameter sets
Ten parameter sets were generated by minimizing the duration of origin firing, ∆, without limit-ing the total number of iteration steps in the algorithm. The values of the kinetic rate constantsand the resulting functional systems properties differ in these fully optimized parameter sets,indicating that the algorithm has stopped automatically before it has converged to a global op-timal solution. The generation of a fully optimized parameter set took on average 5 days on a2.4 GHz Intel Mac. The shortening of the duration of origin firing during the iterations indicatesthat, usually, a reasonably short duration of origin firing is found already after a few iterationsteps. Thus, to reduce the time spent on the generation of a functional parameter set, the totalnumber of iteration steps was limited in the evolutionary optimization algorithm. This proce-dure is justifiable by the fact that the average functional systems properties obtained with thefully optimized parameter sets (activated origins N = 181.2± 1.6 origins, rereplicating originsρ = 0.004± 0.003 origins, mean time to origin firing τ = 42.8± 1.9 minutes and duration offiring ∆ = 5.9± 1.5 minutes) are generally not improved compared to the functional systems
28

2.3 Functional parameterizations of the mathematical model
Table 2.4: Options and values specified in the parameter optimization algorithm with theDifferentialEvolution method in Mathematica 7.0 [86].
Option Value ExplanationInitialPoints Automatic Set of initial parameter setsSearchPoints (m) 1000 Size of the population used for evolutionRandomSeed 0, . . . ,1000 Starting value for the random number
generatorScalingFactor (s) 0.6 Scale applied to the difference vectorCrossProbability (η) 0.5 Probability to take a parameter from ~ps
Tolerance 0.001 Tolerance for accepting constraint violationsPenaltyFunction d ·104·i Function applied to penalize invalid para-
meter values outside constraints (d =distancefrom allowed value, i =number of iteration)
PostProcess True Whether to post-process using local searchmethods
properties obtained with sufficiently optimized parameter sets. The values of the functional sys-tems properties generated by both types of kinetic parameter sets are in the same range (comparewith Figure 3.2).
Sufficiently optimized parameter sets
For the systematic generation of functional parameter sets, the minimization of the duration oforigin firing, ∆, was stopped after two iteration steps of the evolutionary optimization algorithm,which took on average 10 hours on a 2.4 GHz Intel Mac. Usually, a sufficiently fast parameterset was found already after two iteration steps. The algorithm was ran several times, each witha different random seed for the random number generator. In this way, a population of different,but equally functional parameter sets was obtained that enable to compare the functionality inthe different parameter sets.
A total of 109 functional parameter sets were generated with fixed parameter values for the li-censing and S-Cdk activation modules (Table 2.3) and optimized parameter values for the firingand 11-3-2 activator modules. The median, 1/6- and 5/6-quantile values of the obtained kineticparameters in the different functional parameter sets are summarized in Figure 2.5.The optimized dissociation and binding rate constants for the protein-protein and protein-DNAinteractions attained preferred values in the admissible parameter sets, while the values of thephosphorylation and, in particular, the dephosphorylation rate constants seem to vary consider-ably in the different functional parameter sets. A hierarchy is identifiable in the binding affinitiesof S-Cdk to its substrates. The binding of S-Cdk to Orc subunits turned out to be typically lessaffine than the binding of S-Cdk to Mcm2-7 proteins, which, in turn, is still weaker than theaffinity of S-Cdk to Sld2 and Sld3. In almost all functional parameter sets, the highest affinity is
29
2 Kinetic model for the initiation of DNA replication
detected for the binding of the 11-3-2 activator to the pre-ICs.One parameter set is selected as a reference parameter set from all 109 functional parameter
sets. In the following, it is used in simulations of characteristic perturbations of S-Cdk and ofother experimental situations. The optimized values of the kinetic parameters in the firing and11-3-2 activator module of the reference parameter set are listed in Table 2.5.
30

2.3 Functional parameterizations of the mathematical model
102
104
106
108
0
1
2
3
103
104
105
106
1 2 4 5 12 10 1114
,16
15,1
7 18 19 20 21 26 22 23 24
k1 k2 k4 k5 k12
k10
k11
k14,
k16
k15,
k17
k18
k19
k20
k21
k26
k22
k23
k24
k3 α6 δ7 δ8 δ2
α10 β1
1δ1
3k2
7α
14 β15
α16 β17
α26
α20
α21 k25
Reac
tion
rate
(1/s)
Bind
ing
rate
con
stant
(1/M
s)Bi
ndin
g af
finity
(1/M
)
Reaction number
Binding rate constant
Reaction rate constant
Figure 2.5: The optimization of the systems functionality resulted in distinct values for mostkinetic rate constants. The parameters in the licensing module (colored in blue) andthe S-Cdk activation module (orange) are fixed in all parameter sets. Median valuesand the 1/6- and 5/6-quantile deviations are shown for the kinetic rate constantsof the 11-3-2 activator module (red) and the firing module (green) in all optimizedparameter sets.
31

2 Kinetic model for the initiation of DNA replication
Table 2.5: Optimized values for the kinetic rate constants in the firing and 11-3-2 activator mod-ule listed for the reference parameter set.
Parameter Symbol Value Unit Remarks11-3-2 activator formationBinding of S-Cdk and Sld2/3 k14,k16 6.410×10⁴ (Ms)−1
Dissociation of S-Cdk and Sld2/3 k−14,k−16 0.008 s−1
Phosphorylation of Sld2/3 α14 0.223 s−1
Phosphorylation of Thr84 in Sld2 α16 0.945 s−1
Binding of Cdc14 and Sld2/3 k15,k17 1.146×10³ (Ms)−1
Dissociation of Cdc14 and Sld2/3 k−15,k−17 0.010 s−1
Dephosphorylation of Sld2/3 β15 0.276 s−1
Dephosphorylation of Thr84 in Sld2 β17 0.460 s−1
Binding of Sld2p and Dpb11 k18 5.000×10⁵ (Ms)−1
Dissociation of Sld2p and Dpb11 k−18 0.005 s−1 fixedBinding of Sld3p and Dpb11 k19 1.709×10⁵ (Ms)−1
Dissociation of Sld3p and Dpb11 k−19 0.005 s−1 fixedFiringBinding of S-Cdk and Mcm2-7 k20 7.310×10⁴ (Ms)−1
Dissociation of S-Cdk and Mcm2-7 k−20 0.008 s−1
Phosphorylation of Mcm2-7 by S-Cdk α20 0.141 s−1
Binding of Ddk and Mcm2-7 k21 2.977×10⁴ (Ms)−1
Dissociation of Ddk and Mcm2-7 k−21 0.015 s−1
Phosphorylation of Mcm2-7 by Ddk α21 0.790 s−1
Binding of Cdc45 k22 1.087×10⁵ (Ms)−1
Dissociation of Cdc45 k−22 0.005 s−1 fixedBinding of Sld3p-Dpb11-Sld2p k23 5.000×10⁵ (Ms)−1
Dissociation of Sld3p-Dpb11-Sld2p k−23 0.005 s−1 fixedBinding of GINS–DNA polymerase k24 3.310×10⁵ (Ms)−1
Dissociation of GINS–DNA polymerase k−24 0.005 s−1 fixedDissociation of 11-3-2 activator k25 0.927 s−1
Binding of S-Cdk and Orc subunits k26 6.325×10³ (Ms)−1
Dissociation of S-Cdk and Orc subunits k−26 0.009 s−1
Phosphorylation of Orc subunits α26 0.676 s−1
Dissociation of Mcm2-7, Cdc45, and k27 0.002 s−1 fixedGINS–DNA polymerase / resettingof origins after replicon completion
32
3 Analysis of the kinetics of DNA replicationinitiation
In this Chapter, the functionality of the mathematical model parameterized with the differentparameter sets is quantified and analyzed in comparison to experimental observations. The de-pendency of the functional systems properties on the kinetic parameters and the initial proteinconcentrations is calculated to estimate how these control the performance of the network interms of rate and coherence of origin activation, number of activated origins, and robustnessagainst DNA rereplication. Finally, characteristic perturbations of the S-Cdk activity, whichwere also studied experimentally, are rationalized using the mathematical model.
3.1 Origin firing kinetics with functional parameter sets
The firing rates, f (t), generated with the mathematical model with different optimized parame-terizations show that in the majority of parameter sets (65%) origin firing starts between 35 to 38minutes after the beginning of origin licensing and is completed in less than 15 minutes (Figure3.1(a)). For some parameter sets, the firing rate reaches values above one origin firing event persecond, implying a very synchronous activation of replication origins. Only a few parametersets (11%) were admitted that take longer than 30 minutes to finish origin firing.
The experimental determination of profiles of DNA replication in the budding yeast genomeare based on DNA microarray technology [50]. Yabuki et al. (2002) [88] monitored the changeof the DNA copy number from one to two during DNA replication using flow cytometry, specif-ically fluorescence activated cell sorting (FACS). The DNA content was determined in 23 sam-ples, collected every 2.5 minutes during S phase of a synchronized cell population that waspreviously released from α-factor, a peptide that is widely used to arrest the cell cycle in G1phase [8]. At the same time, genomic DNA was isolated, enzymatically fragmented into piecesof ∼ 1.5 kb on average, labeled at the 3’ ends, and finally hybridized to high-density oligonu-cleotide microarrays. By this method, the distribution of firing times of∼ 250 replication originswas monitored. The activation times of only the early replicating origins were determined by theaddition of hydroxyurea (HU) to the cell population, which is supposed to block the initiationof late origins (Figure 3.1(b)). The activation of the ∼ 114 early origins was reported to start 17minutes after release from α-factor and to be completed after 14 minutes, which corresponds toa duration of approximately 23 minutes for the activation of a total number of 190 early origins.
Another study by Raghuraman et al. (2001) [67] uses isotopic labeling of DNA to distinguishbetween newly synthesized and previously existing DNA. Two cell cycle blocks, α-factor anda temperature sensitive Cdc7, which is the catalytic subunit of the Ddk kinase, were used to
33

3 Analysis of the kinetics of DNA replication initiation
30 40 50 60 70 80 90 100 1100.0
0.2
0.4
0.6
0.8
1.0
1.2
Time (min)
Firin
g ra
te (#
orig
ins /
s)
(a)
(b) (c)
Figure 3.1: (a) Firing rates, f (t), generated with the 109 optimized parameter sets exhibit somevariations in the functional kinetics of origin firing. (b) Yabuki et al. (2002) [88]determined the firing times of all replication origins (light grey) and of only theearly origins (dark grey). (c) Raghuraman et al. (2001) [67] monitored the time ofreplication of centromeres and telomeres.
synchronize and arrest cells that were grown in heavy medium (13C and 15N) for several gen-erations, before the onset of DNA replication in S phase. The medium was then changed fromheavy to light medium (12C and 14N) and cells were released again from the cell cycle blocks.In this way, all previously existing DNA consists of a heavy DNA double strand, whereas allnewly synthesized DNA comprises one light and one heavy DNA single strand. Potentiallyrereplicated DNA can be identified by one DNA double strand that is only made up of lightnucleotides. At eight time points within one hour during S phase, samples of genomic DNAwere collected. Enzymatically fragmented DNA pieces of∼ 50 bp on average are separated into
34

3.1 Origin firing kinetics with functional parameter sets
two fractions of the different density labels by density-gradient centrifugation. Finally, sampleswere end-labelled and hybridized to oligonucleotide microarrays. In this way, the replicationdynamics in the yeast genome was monitored. Replication of the 32 centromeric regions thatbelong to the early replicating part of each chromosome was observed to start 15 minutes afterthe release from α-factor and was finished within approximately 20 minutes (Figure 3.1(c)).
The kinetics of origin firing simulated with the mathematical model is, in most cases, con-sistent with the experimental observations. In particular, the replication kinetics generated withsome faster parameter sets agrees with the reported replication times of the early replication ori-gins.
3.1.1 Functional kinetics in the different parameter sets
All admissible parameter sets generate a kinetics of origin firing, that account for the requiredfunctionality of the system. The mathematical formulation of the functional systems proper-ties allows to quantify and compare the functionality of the firing kinetics with the differentparameter sets.
The distribution of the values of the functional system properties in the generated parametersets (Figure 3.2) shows that for most parameter sets the number of rereplicating origins, ρ , aswell as the mean time to firing, τ , and the duration of firing, ∆, attain a relatively small valueof ρ < 0.0015 origins, τ < 46 minutes, and ∆ < 8 minutes, respectively. The achieved numberof firing origins, N, is approximately equally distributed between 181 and 185 origins in thegenerated parameter sets. The mean time to firing, τ , as well as the duration of firing, ∆, seemto be bordered towards short times. No parameter sets are generated that exhibit a mean time tofiring, τ , of less than 40 minutes and a duration of firing, ∆, shorter than 4 minutes, although noconstraint for these times was specified in the optimization process.
As the appearance of the firing rates, f (t), suggests (Figure 3.1(a)), a correlation exists be-tween the mean time to firing, τ , and the duration of firing, ∆ (Figure 3.3(a)). "Faster" parametersets that lead to an early initiation of firing at the same time tend to exhibit a short durationof origin firing, ∆, whereas late firing parameter sets also give rise to a temporally spread ini-tiation of origin firing. In particular the faster parameter sets agree with the observed narrowdistribution of firing times of the early origins (Figure 3.1(b)).
Interestingly, a strong non-linear correlation is found for the timing of origin firing, character-ized by τ and ∆, and the probability for the occurrence of DNA rereplication, ρ (Figure 3.3(b),not shown for ∆ and ρ). Parameter sets that result in an early activation of origins and a shortduration of firing tend to exhibit a higher probability for rereplication, ρ , than those parametersets that lead to a later initiation of origin firing. Hence, a rapid progression to and activationof origin firing appears to have negative effects on the proper inhibition of DNA rereplication.Parameter sets can be found, in which origin firing is even faster than 40 minutes, but for allof these the number of rereplicating origins exceeds the assumed limit of ρ = 0.01 origins (notshown).
35

3 Analysis of the kinetics of DNA replication initiation
0 2 4 6 8 100
10
20
30
40
180 182 184 186 188 1900
5
10
15
40 50 60 70 800
10
20
30
5 10 15 200
10
20
30
Mean time to firing, τ (minutes) Duration of firing, Δ (minutes)
Number of firing origins, Ν (#) Number of rereplicating origins, ρ (10-3 #)
Num
ber o
f par
amet
er se
ts (#
)
Num
ber o
f par
amet
er se
ts (#
)N
umbe
r of p
aram
eter
sets
(#)
Num
ber o
f par
amet
er se
ts (#
)
Median = 183.1; (181.2; 184.8) o.Mean = 183.1 ± 1.6 o.
Median = 11; (0.4; 46) x 10-4 originsMean = (21 ± 24) x 10-4 origins
Median = 6.3; (5.3; 14.3) minutesMean = 8.6 ± 4.9 minutes
Median = 44.6; (42.3; 57.2) minutesMean = 48.8 ± 9.3 minutes
Figure 3.2: The values of functional systems properties, N,ρ,τ , and ∆, generated by the opti-mized parameter sets exhibit a distribution. While the number of firing origins, N,is equally distributed between 181 and 185 origins, the distribution of the number ofrereplicating origins, ρ , the mean time to origin firing, τ , and the duration of firing,∆, appears to be log-normal and is better characterized by the median value and the1/6- and 5/6-quantile deviations.
3.1.2 Dependency on the initial number of early origins
The precise number of early origins that fire in one S phase and their composition is not well-defined experimentally, and it may not be the same in every cell and each cell cycle. In themathematical model, we referred to an initial number of 190 early origins, which was identifiedexperimentally by Lengronne et al. (2001) using hydroxyurea (HU) to block the initiation of latefiring origins [46]. Furthermore, we assumed that almost all of these early origins (95%) becomeactive in each cell cycle. The identity of origins is not an object of the mathematical model, thus,the composition of the early origins that finally initiate DNA replication is not necessarily thesame in every cell cycle.
In order to exclude, that the functionality of the replication initiation network is dependent onor biased by the initial number of early origins put into the mathematical model, the functionalsystem properties are calculated for an initial number of early origins varying between 50 to 800
36

3.2 Control of functional systems properties
40 50 60 70 805
10
15
20
Mean time to firing, τ (min)
Dur
atio
n of
firin
g, Δ
(min
)
40 50 60 70 800
2
4
6
8
10
Mean time to firing, τ (min)
Num
ber o
f rer
eplic
atin
g or
igin
s, ρ
(10-
3 #)
(a) (b)
Figure 3.3: (a) A correlation between the mean time to origin firing, τ , and the duration of fir-ing, ∆, is identifiable in the generated parameter sets (correlation coefficient: 0.94).(b) The mean time to firing, τ , and the logarithm of the number of rereplicating ori-gins, ρ , are anti-correlated (correlation coefficient: -0.67). ∆ and ρ exhibit a similarrelationship (correlation coefficient: -0.58; not shown).
origins, simulated with the reference parameter set (Figure 3.4). The ratio between the initialnumber of early origins and the number of origins that are eventually activated and initiate DNAreplication, remains constant. The number of rereplicating origins, ρ , the mean time to firing, τ ,and duration of firing, ∆, also attain roughly the same value within this range of 50 to 800 initialearly origins.
Thus, the functional systems properties do not depend on the initial number of early origins,and would even be fulfilled if the 730 autonomously replicating sequences (ARS) that are up tonow identified as potential replication origins in the budding yeast genome [60] would all andsimultaneously be activated early in the cell cycle.
3.2 Control of functional systems properties
A well-established method to analyze the sensitivity of a system towards the change in a partic-ular parameter value is the calculation of sensitivity coefficients [33]. The sensitivity coefficientgives the relation between the relative change in a systems property in response to the relativechange of a particular parameter value. It is defined as follows:
Cξ
i =∂ lnξ
∂ ln pi=
∂ξ
∂ pi· pi
ξ=
∂ξ
ξ
(∂ pi
pi
)−1
,
where ξ is the systems property to be analyzed (in this case N,ρ,τ and ∆), and pi the variedparameter value (in this case the concentration or kinetic rate constant).A positive sensitivity coefficient implies an increase of the systems property, whereas a nega-tive coefficient describes the decline of the systems property in response to an elevation of a
37

3 Analysis of the kinetics of DNA replication initiation
1
2
5
10
0
200
400
600
0 250 500 75040
42
44
46
48
50
0 250 500 750456789
10
Initial number of early origins (#) Initial number of early origins (#)
Mea
n tim
e to
firin
g, τ
(min
)
Dur
atio
n of
firin
g Δ
(min
)N
umbe
r of r
erep
licat
ing
orig
ins ρ
(10-
3 #)
Num
ber o
f firi
ng
orig
ins Ν
(#)
Figure 3.4: The functional systems properties, N,ρ,τ , and ∆, of the kinetics of origin firing arenot affected by the number of initial early origins considered in the mathematicalmodel, in the range between 50 and 800 initial early origins.
particular parameter value, respectively.
3.2.1 Control by protein concentrations
The protein concentrations in a living cell are subject to natural fluctuations, e.g. gene expres-sion is a stochastic process and cell and nuclear volumes vary from cell to cell and during cellgrowth [42]. To analyze the effect of changes in the protein concentrations on the kinetics oforigin firing, the concentration sensitivity coefficients are calculated for all four functional sys-tems properties (N,ρ,τ and ∆) in response to variations in all 13 initial molecule concentrations(see Table 2.2). The concentration sensitivity coefficients are determined for each generatedparameter set resulting in a set of sensitivity coefficients with different values originating fromeach parameter set. The consideration of all generated, functional parameter sets allows to as-sess the different values obtained for a sensitivity coefficients of a functional systems property.In this way, characteristic controls are identified and distinguished from undefined sensitivitycontributions, which only appear in very few generated parameter sets.
The results for the concentration sensitivity coefficients are summarized in the median and1/6-, 5/6-quantile values of the sensitivity coefficients calculated with all parameter sets (Figure3.5).
The amplitudes of the sensitivity coefficients of the different systems properties reveal that
38

3.2 Control of functional systems properties
-0.10-0.050.000.050.10
-10
0
10
20
-0.4
-0.2
0.0
0.2
-0.4
-0.2
0.0
0.2Number of firing origins Ν
Number of rereplicating origins ρ
Mean time to firing τ Duration of firing Δ
Cdc6
Cdt1
Mcm
2-7
Sld2
Sld3
Dpb
11Cd
c45
GIN
SD
DK
Sic1
G1-
Cdk
S-Cd
kCd
c14
Cdc6
Cdt1
Mcm
2-7
Sld2
Sld3
Dpb
11Cd
c45
GIN
SD
DK
Sic1
G1-
Cdk
S-Cd
kCd
c14
Conc
entra
tion
sens
itivi
ty c
oeffi
cien
t
Figure 3.5: The concentration sensitivity coefficients quantify the dependency of the functionalsystems properties, N,ρ,τ and ∆, on the initial amount of each molecule consideredin the mathematical model. Shown are the median, 1/6-quantile, and 5/6-quantilevalues of the concentration sensitivity coefficients calculated with all optimized pa-rameter sets.
the number of firing origins, N, the mean time to firing, τ , and the duration of firing, ∆, arerobust systems properties, with concentration sensitivity coefficients of maximally 0.5, whilethe number of rereplicating origins, ρ , appears to be a very sensitive property with concentrationsensitivity coefficients of up to around 18.
The number of firing origins, N, is only dependent on the concentrations of the licensingfactors, Cdc6 and Mcm2-7, and on the amount of Sic1 and S-Cdk, that are important for theinhibition of S-Cdk activity at the beginning of the licensing phase. The number of rereplicatingorigins, ρ , is mainly controlled by the amount of Sic1 and S-Cdk molecules that regulate theactivation of S-Cdk, and thereby the initiation of S-Cdk-dependent mechanisms to prevent DNArereplication. Dependencies on the concentration of the licensing factors, Cdc6 and Mcm2-7,the 11-3-2 activator constituents, Sld2, Sld3 and Dpb11 and the enzymes involved in the activa-tion of S-Cdk, that are G1-Cdk and Cdc14, are also identifiable. The mean time to firing, τ , isprimarily influenced by proteins involved in the release of active S-Cdk and the phosphorylationof Sld2 and Sld3, which are Sic1, G1-Cdk, S-Cdk and Cdc14. The duration of origin firing,∆, however, is mainly affected by fluctuations in the concentrations of the 11-3-2 activator con-stituents, Sld2, Dpb11 and, particularly, Sld3, but also the amount of Sic1 and S-Cdk molecules,
39

3 Analysis of the kinetics of DNA replication initiation
0 0.002 0.004 0.006 0.008 0.0100
5
10
15
20
25
30
Number of rereplicating origins, ρ (#)
Risk
for r
erep
licat
ion,
κ
Figure 3.6: The number of rereplicating origins, ρ , and the risk for rereplication, κ , are corre-lated, indicating that parameter sets causing a higher number of rereplicating originssimultaneously carry a higher risk for rereplication.
regulating the release of active S-Cdk, control this property. Interestingly, an increase in the con-centration of Sic1 prolongs the mean time to firing, τ , and, at the same time, causes a shorteningof the duration of firing, ∆.
Summarizing, the activation and the activity of S-Cdk exert a strong control on all functionalsystems properties, as it is involved in both, initiation of DNA replication and inhibition of DNArereplication.
The overall concentration sensitivity coefficient of a parameter set, referred to as the risk forrereplication, κ , is defined as the sum in quadrature (Euclidian norm) of all 13 concentrationsensitivity coefficients for the number of rereplicating origins, Cρ
pi ,
κ =
(13
∑i=1
(Cρ
pi
)2
)1/2
.
Remarkably, a correlation is found for the number of rereplicating origins, ρ , and the risk forrereplication, κ (Figure 3.6). Optimized functional parameter sets that give rise to a relativelyhigh number of rereplicating origins, ρ , that is to a high probability for the occurrence of rerepli-cation, additionally, tend to be most sensitive towards fluctuations in the protein concentrations.And parameter sets that generate a very low number of rereplicating origins are, at the sametime, very robust towards the emergence of rereplication.
40

3.2 Control of functional systems properties
3.2.2 Control by kinetic parameters
To analyze the effect of a particular kinetic parameter on the functionality of the replication ini-tiation network, parameter sensitivity coefficients are calculated for all four functional systemsproperties in response to changes in the 51 kinetic parameters. Although the parameters of thelicensing and S-Cdk activation module are fixed in all admissible parameter sets, variations inthe sensitivity coefficients of these parameters occur between the parameter sets, because thedifferent parameter values in the firing and 11-3-2 activator module modify the sensitivity con-tribution of the fixed parameters in each parameter set.
The sensitivity coefficients are calculated for each optimized parameter set. The results of thesensitivity analysis for all four systems properties in response to changes in the kinetic parame-ters is again summarized in the median and 1/6-, 5/6-quantile values of all sensitivity coefficients(Figure 3.7).
The observations made in the analysis of the concentration sensitivity coefficients are con-firmed by the analysis of the parameter sensitivity coefficients, but latter coefficients addition-ally allow to relate the total control of a molecule to the partial control contributions from thereactions, in which the molecule is involved.
As already identified, the number of rereplicating origins, ρ , appears to be a very sensitivesystems property. Variations in the kinetic rate constants, especially changes of parameters inthe licensing and S-Cdk activation modules, result in parameter sensitivity coefficients of up to6, while the number of firing origins, N, the mean time to firing, τ , and the duration of firing, ∆,are robust systems properties with maximal sensitivity coefficients of around 0.6.
Licensing parameters only play a role in the regulation of the number of firing origins, N, andthe number of rereplicating origins, ρ; both critical systems properties presumably implicated inthe emergence of genomic instability.
In addition to the strong sensitivity to most licensing parameters, the number of firing origins,N, is controlled by reactions determining the inhibition of active S-Cdk during the licensingphase, such as the affinity of the stoichiometric inhibitor Sic1 to S-Cdk, and by reactions causingthe inhibition of DNA (re)licensing, precisely, the binding rate of S-Cdk to Orc molecules lead-ing to the phosphorylation of Orc subunits. The number of rereplicating origins, ρ , is affectedby almost all parameters of the licensing and S-Cdk activator module. The strongest control isexerted by the binding rate of S-Cdk to Sld2 and Sld3, which leads to an increased number ofrereplicating origins, ρ , at a faster reaction rate constant. The binding rate constant of the 11-3-2activator to the origins and the reaction rate constant describing the transition between the firingof an origin and its reentering at the initial origin state, S0, in the licensing module, have a minorinfluence on the number of rereplicating origins, ρ . As presumed in the optimization process,the timing of origin firing, described by the mean time to firing, τ , and the duration of firing, ∆,is independent of kinetic parameters in the licensing module. It is controlled by the reactionsdescribing the release of active S-Cdk from inhibition by Sic1, such as the affinity of Sic1 toS-Cdk and the affinity and phosphorylation rate of G1-Cdk to Sic1. Reactions determining theformation and the association of the 11-3-2 activator complex with the origins, in particular, thebinding rate of S-Cdk to Sld2 and Sld3 and the binding rate of the 11-3-2 activator to the origins,strongly influence the origin firing kinetics, τ and ∆. A higher affinity of Sld2 and Sld3 to Dpb11accelerates the duration of firing, ∆, but hardly influences the mean time to firing, τ .
41

3 Analysis of the kinetics of DNA replication initiation
-0.06
0.00
0.06
-4
0
6
-0.2
0.0
0.1
-0.5
0.00.1
Number of firing origins
Number of rereplicating origins
Mean time to firing
Duration of firing
Para
met
er se
nsiti
vity
coe
ffici
ent
k-12 k10
k-10
α10 k1
1k-
11 β11
d13 k1 k-1 k2 k-2 k3 k4 k-4 k5 k-5
α6 δ7 δ8 δ2
k-18
k-19
α14 β15
α16 β17
k14
k-14 k15
k-15 k18
k19
k26
k-26
α26 k20
k-20
α20 k21
k-21
α21 k22
k23
k24
k25
k-22
k-23
k-24 k27
Reaction rate constant
k12
Figure 3.7: The parameter sensitivity coefficients quantify the dependence of the functional sys-tems properties, N,ρ,τ and ∆, on the values of the kinetic rate constants. Shownare the median, 1/6-quantile, and 5/6-quantile values of the parameter sensitivitycoefficients calculated with all optimized parameter sets.
42

3.2 Control of functional systems properties
3.2.3 Control by S-Cdk concentration
The sensitivity coefficients of both, the protein concentrations and the kinetic parameters, reveala pivotal role for S-Cdk in the regulation of the systems performance. As a kinase, S-Cdk cat-alyzes activating protein phosphorylations of Sld2, Sld3, and Mcm2-7 molecules at the origins,as well as in DNA rereplication inhibiting mechanisms through the phosphorylation of Orc sub-units and free Mcm2-7 molecules. Consequently, the release of active S-Cdk has to be tightlycontrolled by Sic1 to ensure a period of low S-Cdk activity, in which origins are licensed. Theimpact of perturbations in the S-Cdk activation kinetics on the kinetics of origin firing has beenstudied experimentally and is rationalized in the last section of this chapter.
To analyze the dependency of the functional kinetics of origin firing on the initial number ofS-Cdk molecules, the values of the four functional systems properties are calculated for initialS-Cdk concentrations ranging from 100 to 1300 molecules per cell, which corresponds to adecrease of the reference value for the initial number of S-Cdk molecules (600) to one sixthand a roughly doubling of it. The resulting values of the functional systems properties aresummarized in the median values and 1/6-, 5/6-quantile deviations of all generated parametersets (Figure 3.8).
All systems properties are strongly influenced by a change in the S-Cdk concentration. Thenumber of rereplicating origins, ρ , is even varied over several orders of magnitude. The numberof firing origins, N, and the number of rereplicating origins, ρ , would benefit from a low numberof S-Cdk molecules, since, in this case, the number of firing origins,N, is as high as possible and,at the same time, the number of rereplication origins, ρ , is low as requested. A high number ofS-Cdk molecules causes a reduced number of firing origins, N, possibly because of a too stronginhibition of origin (re)licensing through the phosphorylation of Orc subunits by S-Cdk. At thesame time, a high concentration of S-Cdk leads to an increase of the number of rereplicatingorigins, ρ , which could be a side effect of a too fast activation of replication origins, after whichthe mechanisms inhibiting DNA rereplication, such as degradation of Cdc6, export of Mcm2-7 and Cdt1, are not then fully operative. However, for almost all parameter sets, the maximumnumber of rereplicating origins, ρ , stays well below 10 origins and for most optimized parametersets even below one rereplicating origin. The timing of origin firing would be fastest and mostsynchronous for a high concentration of S-Cdk, while at low S-Cdk concentrations, the originfiring would initiate delayed and take much longer. With less than 200 S-Cdk molecules per cell,the mean time to firing, τ , could become even longer than the average duration of a cell cycle inbudding yeast, which takes about two hours [64]. Compared to this, the duration of firing, ∆, isprolonged only moderately at very low S-Cdk concentrations. At concentrations between∼ 200and 700 S-Cdk molecules per cell, the duration of firing, ∆, appears to be almost constant.
According to this analysis, the kinetics of origin firing would be most favorable, that is givingrise to a high number of firing origins, N, a low number of rereplicating origins, ρ , and a reason-ably fast timing of origin firing, τ and ∆, at an intermediate concentration of S-Cdk, as is indeedobserved experimentally [27] and used here in the mathematical model.
43

3 Analysis of the kinetics of DNA replication initiation
10-11
10-8
10-5
0.01
10
120
140
160
180
1
2
3
10
20
30
40
Number of S-Cdk molecules (#) Number of S-Cdk molecules (#)200 400 600 800 1000 1200 200 400 600 800 1000 1200
Num
ber o
f re-
repl
icat
ing
orig
ins ρ
(#)
Mea
n tim
e to
firin
g τ (
hour
s)
Dur
atio
n of
firin
g Δ
(min
)
Num
ber o
f fire
d or
igin
s Ν (#
)
Figure 3.8: The functional systems properties are strongly influences by the initial number of S-Cdk molecules (red line: reference parameter set; black line: median of all optimizedparameter sets; grey area: 1/6- and 5/6-quantile deviations from the median value),but a compromise between rapid and accurate initiation of DNA replication can isfound for a range of medium S-Cdk concentrations, from approximately 200 to 700molecules per cell.
3.2.4 Control by multisite phosphorylation of Sld2 and Sic1
Sic1 and Sld2 are both phosphorylated at multiple residues by G1-Cdk and S-Cdk, respectively,which causes a time delay between the activation of G1-Cdk and S-Cdk, in the case of Sic1, andbetween the activation of S-Cdk and the initiation of origin activation, in the case of Sld2. Atthe same time, random multisite phosphorylation of a substrate contributes to its sharp transitionto the fully phosphorylated state. In the following, the specific function of each time delay isanalyzed by varying the number of random phosphorylation events in Sld2 and Sic1.
In the case of Sld2, the number of random phosphorylations, occurring before the essential,sequential Thr84 phosphorylation, is changed from zero to nine hypothetical random phospho-rylations in Sld2 by S-Cdk (Figure 3.9, left column). In the case of Sic1, the minimum requirednumber of phosphorylations before the recognition and degradation of Sic1 is varied from oneto nine, while the total number of nine random phosphorylations in Sic1 by G1-Cdk remainsconstant (Figure 3.9, right column).
Both, multisite phosphorylation of Sld2 and Sic1, have no influence on the number of firedorigins, N, indicating that this number is already fixed during the licensing phase and indepen-
44

3.2 Control of functional systems properties
0 1 2 3 4 5 6 7 8 9 1 2 3 4 5 6 7 8 9Random phosphorylation
sites in Sld2Random phosphorylations
required for Sic1 degradation
510
15
20
+
+
++ + + + + + +
+
+
+
++ + + + + +
+
+
+
+
++ + + + +
++
++
++
+
+
+
+ + + + + + + ++
+ + + + + + + ++D
urat
ion
offir
ing,
Δ (m
in)
30
40
50
60
++ + + + + + + + +
++
++ + + + + + +
+
+
+
++
++
++
+
+ + + + + + + +++
+ + + ++
++
+
++ + + +
++
+
+
Mea
n tim
e to
firin
g, τ
(min
)
++
++
+ + + + + +
++
++
++
++
+ +
++
++
+
+
+
+
+
+
+ + + + + + + + +
++ + + + +
+ + +
++ + + +
++
+
+10-610-40.01
1
Rere
plic
atin
gor
igin
s, ρ
(#)
184
185+ + + + + + + + + ++ + + + + + + + + ++ + + + + + + + + + + + + + + + + + +
+ + + + + + + + ++ + + + + + + + +
Firin
gor
igin
s, Ν
(#)
Sic1 degradation after 1pSic1 degradation after 6pSic1 degradation after 9p
Sld2 0p random sitesSld2 6p random sitesSld2 9p random sites
Figure 3.9: The dependency of the functional systems properties on the number of random phos-phorylation events in Sld2 and Sic1 by S-Cdk and G1-Cdk, respectively, is realizedby a reduction of the number of random phosphorylations before the threonine 84phosphorylation in Sld2 and by varying the number of random phosphorylationsthat are required for the degradation of Sic1, while maintaining the total number ofrandom phosphorylations in Sic1. The reference parameter set and mathematicalmodels accordingly modified are used to calculate the functional systems properties.
45
3 Analysis of the kinetics of DNA replication initiation
dent of processes outside the licensing phase.The number of rereplicating origins, ρ , on the contrary, is strongly affected by the number of
random phosphorylation events in Sld2 and Sic1. A higher number of phosphorylation eventsin each molecule increases the time delay between origin licensing and firing that is neededfor rereplication inhibiting mechanisms to set in, and thereby reduces the probability for DNArereplication. Variation of the number of phosphorylation sites in Sld2 reveal that between fiveand six random phosphorylations are needed to fulfill the functional requirements of less that0.01 rereplicating origins, ρ , per cell cycle. The same behavior is identifiable, when addition-ally the Sic1 protein is hypothetically degraded not before nine phosphorylations. A prematuredegradation of Sic1 after already one phosphorylation only results in a functional kinetics oforigin firing, when simoultaneously the number of random phosphorylation events in Sld2 areassumed to be more than eight. Variations of the number of phosphorylations necessary forSic1 degradation show that actually only four phosphorylations in Sic1 before its degradationare needed to fulfill the functional requirement of less than 0.01 rereplicating origins, ρ , per cellcycle. A number of less than four phosphorylations required for the degradation of Sic1 wouldonly lead to a functional kinetics of origin firing, if additionally the Cdc4-mediated recognitionof the phosphorylated Sic1 protein is assumed to be slower (not shown), which would be de-scribed by a smaller rate constant for the Sic1 degradation in the mathematical model. The exactvalue for the degradation rate constant of Sic1 has not been determined experimentally.An already low number of rereplicating origins, ρ , caused by a high number of phosphoryla-tion events in Sld2 (nine phosphorylations in Figure 3.9) could be reduced additionally by ahigh number of phosphorylations required for Sic1 degradation, whereas an insufficient Sld2-dependent time delay, due to the absence of the multiple random phosphorylation in Sld2, resultsin a number of around 10 rereplicating origins, ρ , which can not be rescued by a prolonged Sic1-dependent time delay.
The mean time to firing, τ , is prolonged similarly in Sld2 and Sic1, by an increased numberof phosphorylation events. Interestingly, the steepest increase in the mean time to firing, τ , isobserved at a very high number of phosphorylation sites in the case of Sic1 and at a very lownumber of phosphorylation sites in the case of Sld2.
The multisite phosphorylations of Sld2 and Sic1 have opposing effects on the duration of fir-ing, ∆. The duration of firing, ∆, increases strongly with a number of less than four randomphosphorylation events in Sld2. A minimal duration of firing, ∆, is found for a number of ap-proximately five random phosphorylation events in Sld2. This is not very surprising, since thekinetic parameter values were determined by minimizing the duration of firing, ∆, at a givenstructure of the molecular network with six random phosphorylations in Sld2 and one sequentialThr84 phosphorylation. For a higher number of random phosphorylations in Sld2, the durationof firing, ∆, remains approximately constant. The duration of firing, ∆, is almost independentof the multisite phosphorylation of Sic1. Only a number of more than seven random phospho-rylations in Sic1 needed for the degradation of Sic1, could lead to a slightly prolonged durationof firing, ∆. If the random phosphorylation in Sld2 is not existent, the duration of firing, ∆, isincreased considerably and even rises with an additional number of phosphorylations in Sic1.
The analysis of the multiple phosphorylation in Sld2 and Sic1 confirms the importance of bothproteins in creating a time delay. The Sic1-dependent time delay occurs before the activationof S-Cdk, whereas Sld2 creates a time delay before the initiation of origin firing. According to
46

3.3 Simulations by the mathematical model
this analysis, the specific number of random phosphorylation sites in Sld2 appears to be moreimportant for the functional kinetics of origin firing. The random multisite phosphorylation ofSld2 by S-Cdk results in a deferred formation of the 11-3-2 activator complex and with this ina delayed initiation of origin firing. This leads to a temporal separation between the activatingand the inhibiting functions of S-Cdk.
3.3 Simulations by the mathematical model
In the following, the mathematical model is used to simulate the initiation of DNA replicationunder normal conditions and for characteristic perturbations of the regulation of S-Cdk activity,which also has been studied experimentally. The functionality of the replication initiation net-work is quantified by the functional systems properties allowing to identify typical differencesin the firing kinetics under normal and perturbed conditions. The consequences of an impairedkinetics of origin firing on the processes happening in S phase are analyzed in Chapter 4.
3.3.1 Model simulation under normal conditions
The kinetic parameters of the mathematical model were optimized, such that all functional re-quirements are fulfilled under normal conditions. From all 109 optimized parameter sets, oneparameter set was selected as a reference parameter set, which is among the 11% with the short-est duration, ∆, the 20% with the fastest onset of firing, τ , and, at the same time, the 70% withthe lowest probability of rereplication, ρ , and the 16% with the most firing origins, N. Thevalues of the kinetic rate constants of the reference parameter set are listed in Table 2.3 and 2.5.
Under normal conditions, S-Cdk becomes active approximately ten minutes after the activa-tion of G1-Cdk (Figure 3.10(a), upper panel), which is described by a sigmoid function (equation(2.16) in the mathematical model. Pre-RCs, composed of the origins loaded with Mcm2-7 pro-teins, the presumptive helicase, are formed quickly after the beginning of the origin licensing.Upon completion of the licensing phase, pre-ICs that additionally contain the essential Cdc45are formed, first slowly and then faster, after S-Cdk has reached full activity. The assembly ofcomplete RCs and the initiation of DNA replication from the replication origins starts around 38minutes after the beginning of origin licensing and lasts for approximately ten minutes, denotinga very synchronous initiation of replication origins (Figure 3.10(a), lower panel). The values ofthe functional systems properties obtained with the reference parameter set under normal condi-tions are summarized in Figure 3.10(b).
3.3.2 Model simulations of characteristic S-Cdk perturbations
Four different types of perturbations of the S-Cdk activity are considered in the following: (1)a reduced concentration of S-Cdk in the nucleus, (2) a very slow degradation of Sic1 and con-sequently a retarded activation of S-Cdk, (3) the ∆Sic1 mutant, in which S-Cdk is activatedprematurely and at a reduced concentration, and (4) a stable inhibition of S-Cdk activity through
47

3 Analysis of the kinetics of DNA replication initiation
0
100
0 10 20 30 40 50 600
50
100
150
G1-Cdk
S-Cdk
Pre-RCs Pre-ICs RCs
Time (minutes)
Orig
ins (
#)A
ctiv
ity(%
)190
(a)(b)
Functionality ValueFired origins, N 184.9 originsRereplicating o., ρ 0.00228 originsMean firing time, τ 42.40 minutesFiring duration, ∆ 4.99 minutes
Figure 3.10: (a) Simulation of the mathematical model with the reference parameter set undernormal conditions. The activation kinetics of Cdks (upper panel) are identical in allgenerated parameter sets, since the activation of G1-Cdk is simulated by an inputfunction and the kinetic rate constants of the reactions leading to the activation ofS-Cdk are fixed. The formation kinetics of pre-RCs is also fixed, while those of pre-ICs and RCs differs in the generated parameter sets. (b) Values of the functionalsystems properties calculated with the reference parameter set.
a non-degradable Sic1 protein (Figure 3.11(a)-(d), upper panel). The different perturbations ofthe S-Cdk activity are simulated using the mathematical model with the reference parameterset (Figure 3.11(a)-(d), middle panel) and with all optimized parameter sets (Figure 3.11(a)-(d),lower panel). The functional system properties generated by reference parameter set are listed inTable 3.1 and the mean values, standard deviation and median values of all optimized parametersets are presented in Table 3.2.
Reduced number of S-Cdk molecules
The influence of the number of S-Cdk molecules on the functional systems properties was al-ready analyzed (Figure 3.8). Simulations with a concentration of S-Cdk reduced to one third, 200S-Cdk molecules per cell (Figure 3.11(a)), reveal that active S-Cdk is released from inhibition bySic1 almost 20 minutes later than under normal conditions. This results in a retarded formationof pre-ICs and a completion of RCs that is more than 20 minutes delayed. The increased timedelay between origin licensing and firing leads to a very low probability for rereplication, ρ , andat the same time a high number of activated origins, N. However, the mean time to firing, τ , isalmost doubled compared to normal conditions and the duration of firing, ∆, increases consid-erably. The extremely delayed firing of replication origins can be identified in the firing rates ofall optimized parameter sets.
48

3.3 Simulations by the mathematical model
Table 3.1: Functional systems properties calculated with the reference parameter set for char-acteristic perturbations of S-Cdk activity. The corresponding values under normalconditions are specified in Figure 3.10(b).
S-Cdk activity Reduced Retarded Premature InhibitedFiring origins N (#) 187.5 184.9 149.2 184.2Rereplicating origins ρ (#) 6.0×10⁻¹¹ 3.5×10⁻⁴ 3.7 36.6Mean time to firing τ (min) 73.3 52.5 15.5 34.9Firing duration ∆ (min) 8.7 8.0 7.6 53.2
Slowed release of active S-Cdk
The release of active S-Cdk from inhibition by Sic1 can be slowed down, when the Cdc4-mediated recognition or the ubiquitin-mediated degradation of phosphorylated Sic1 is impairedat some step [58]. In the mathematical model, these complex processes that occur just before therelease of active S-Cdk are summarized in the degradation rate of Sic1, δ13. A slowed releaseof active S-Cdk is simulated by a 100-fold reduction of the degradation rate constant of Sic1 to0.01 per second (Figure 3.11(b)). In this case, active S-Cdk is still released after approximately30 minutes as under normal conditions, but at a slower rate, such that the full activity of S-Cdkis only reached after more than three hours. Simulations of this situation reveal that the activa-tion of origins is slightly delayed and the duration of firing, ∆, is prolonged for a few minutes.Due to the small extension of the time delay between origin licensing and firing, the probabil-ity for rereplication, ρ , is decreased slightly compared to normal conditions. The same kineticcharacteristics of a temporally slightly shifted and only marginally desynchronized activation ofreplication origins can be observed in firing rates of all optimized parameter sets.
Premature activity of S-Cdk
The inhibition of S-Cdk activity during the licensing phase is essential for an accurate duplica-tion of the genome and the prevention of genomic instability [45]. In ∆Sic1 cells, lacking thestoichiometric S-Cdk inhibitor, Sic1, S-Cdk is activated prematurely. Moreover, the concen-tration of S-Cdk in the nucleus is assumed to be lower than under normal conditions, due to areduced import rate of S-Cdk into the nucleus, which is supposed to also be mediated by the Sic1protein [69]. In the mathematical model, this situation is realized by changing the initial numberof Sic1 molecules to zero and reducing the initial number of S-Cdk molecules in the nucleus to300, simultaneously (Figure 3.11(c)). Simulations of the ∆Sic1 mutant reveal that a prematureactivity of S-Cdk results in an activation of replication origins that starts already ten minutesafter beginning of the licensing phase and even before the activation of G1-Cdk. The durationof origin firing, ∆, remains reasonably short, but the fraction of firing origins reduces strongly toonly 78.5%. This is probably due to the advanced inhibition of origin (re)licensing through thephosphorylation of Orc subunits by prematurely active S-Cdk. Another fraction of the origins
49

3 Analysis of the kinetics of DNA replication initiation
(1.9%) manages to fire twice and initiates DNA rereplication, which is probably another conse-quence of the advanced activity of S-Cdk that also leads to an accelerated phosphorylation ofSld2 and Sld3 and a rapid formation of RCs at the origins. This opens the possibility for someorigins not then inhibited by phosphorylated Orc subunits to become relicensed, since other li-censing inhibiting mechanisms, mediated by G1-Cdk, are also still not operative. The stronglyaccelerated initiation of origin firing is a characteristic feature in all firing rates calculated withoptimized parameter sets.
In experimental studies by Lengronne & Schwob (2002) [45], the ∆Sic1 mutant phenotypeis characterized by a reduced number of firing origins, an extended S phase, chromosomal re-arrangements, and ensuing double-strand breaks. All these properties together provide a strongevidence for the emergence of genomic instability in ∆Sic1 mutant cells. The mathematicalmodel rationalizes these observations and suggests two reasons, the strongly reduced numberof origins, from which the DNA synthesis is initiated, and the emergence of DNA rereplicationfrom a few origins.
Stable inhibition of S-Cdk activity
When the stoichiometric inhibitor of S-Cdk, Sic1, is stabilized, the concentration of active S-Cdk remains very low throughout G1 and S phase. This situation was experimentally realized bya non-degradable construct of Sic1, Sic1∆NT [89, 81]. At the same time, a preformed constructof the 11-3-2 activator complex was introduced in the cells and the ability to replicate was testedand the amount of rereplication was measured. In the mathematical model, this situation wasmirrored by setting the degradation rate constant of Sic1, δ13, to zero and by changing the initialnumber of 11-3-2 complexes, C3, in the mathematical model from zero to 200 copies (Figure3.11(d)). The simulations reveal that a only very small free concentration of active S-Cdk ofless than 30 molecules, corresponding to approximately 5% of the total S-Cdk concentration, ispresent in the nuclei of these cells. However, this small amount of active S-Cdk is high enoughto phosphorylate Mcm2-7 molecules bound to the origins, which is essential for the formationof pre-ICs. The first origin firing event occurs already a few minutes after the beginning of thelicensing phase, but the activation of further origins is very desynchronized, probably due to thelimited Mcm2-7 phosphorylation rate by S-Cdk. The firing of replication origins persists for al-most 1.5 hours, in which a sizable fraction of origins (19.9%) is activated repeatedly. The firingof origins is only stopped, when rereplication inhibiting mechanisms, apart from the phospho-rylation of Orc subunits by S-Cdk, which is far too slow in this case, are setting in and inhibitfurther relicensing of replication origin. The advanced initiation of DNA replication and theextremely slow and long lasting firing of replication origins is a characteristic of the firing ratesof all optimized parameter sets.
In the experiments, a long lasting and extensive DNA replication period was observed anda considerable amount of DNA rereplication was detected in the cells, but not quantified moreprecisely.
50

3.3 Simulations by the mathematical model
0
100
020
4060
80050100
150
020
4060
800
2040
6080
020
4060
8005010
015
020
0
Tim
e (m
in)
Tim
e (m
in)
Tim
e (m
in)
Tim
e (m
in)
Origins (#)
Origins (#)
Activity (%)
kdC-S fo noitibihni elbatS )d(kdC-S fo reb
mun decudeR )a((c
) P
rem
atur
e ac
tivity
of S
-Cdk
(b) S
low
ed re
leas
e of
act
ive
S-Cd
k
060
120
180
240
060
120
180
240
0.0
0.2
0.4
0.6
060
120
180
240
060
120
180
240
Tim
e (m
in)
Tim
e (m
in)
Tim
e (m
in)
Tim
e (m
in)
Firing rate, f(t) (# origins/s)
G1-
Cdk
S-Cd
k
Pre-
RCs
Pre-
ICs
RCs
Figu
re3.
11:S
imul
atio
nsof
char
acte
rist
icpe
rtur
batio
nsof
S-C
dkac
tivity
(upp
erpa
nel)
.A
fixed
inpu
tfun
ctio
nde
scri
bes
the
activ
ityof
G1-
Cdk
(upp
erpa
nel)
.T
hefo
rmat
ion
rate
ofpr
e-R
Cs
isth
esa
me
for
allg
ener
ated
para
met
erse
tsan
din
alls
imul
atio
ns,
asth
ere
actio
nra
tes
inth
elic
ensi
ngph
ase
are
fixed
and
inde
pend
ent
ofS-
Cdk
activ
ity(m
iddl
epa
nel)
.T
heki
netic
sof
RC
form
atio
nar
esi
mul
ated
with
the
refe
renc
epa
ram
eter
set(
mid
dle
pane
l).
The
firin
gra
tes,
f(t)
,und
erpe
rtur
bed
S-C
dkac
tivity
are
deriv
edfo
rall
gene
rate
dpa
ram
eter
sets
(low
erpa
nel)
.
51

3 Analysis of the kinetics of DNA replication initiation
Table 3.2: Mean values and standard deviations of the functional systems properties for differ-ent deregulations of the S-Cdk activity calculated with all optimized parameter sets(median values in brackets). The corresponding values under normal conditions arespecified in Figure 3.2.
S-Cdk activity Reduced RetardedFiring origins N (#) 182.8 ± 16.4 (187) 182.8 ± 1.6 (183)Rereplicating origins ρ (#) (0.2 ± 0.7 (2.3))×10−10 (1.8 ± 5.7 (0.5))×10−3
Mean time of firing τ (min) 86.1 ± 20.3 (76.5) 61.8 ± 14.5 (55.6)Firing duration ∆ (min) 14.7 ± 8.7 (10.3) 11.9 ± 5.5 (9.1)
S-Cdk activity Premature InhibitedFiring origins N (#) 142.2 ± 7.9 (142) 174.2 ± 20.9 (181)Rereplicating origins ρ (#) 2.0 ± 1.8 (1.8) 26.5 ± 11.8 (29.1)Mean time of firing τ (min) 24.5 ± 15.3 (17.3) 41.8 ± 12.3 (37.5)Firing duration ∆ (min) 12.5 ± 7.4 (8.7) 58.8 ± 13.9 (55.1)
52

4 Analysis of the DNA replication dynamicsduring S phase
In this chapter, the dynamics of DNA replication in S phase is simulated by using the distribu-tion of firing times of the early origins, f (t). Quantitative properties characterizing the DNAreplication dynamics in S phase, such as the duration of DNA synthesis, the distribution of DNAreplicon sizes, the number of silent and the number of dormant origins, are defined and theirdependencies are analyzed.
4.1 Dynamics of DNA replication in the budding yeast genome
In S phase, the whole budding yeast genome is duplicated in a semiconservative way. DNAsynthesis is initiated upon completion of the RC at the replication origin. Two replication ma-chineries, including the presumptive DNA helicases, Mcm2-7, and the DNA polymerases, areprogressing bidirectionally in 3’ and 5’ direction from each firing origin. The DNA is copiedcontinuously by DNA polymerase ε in the leading strand (in 3’ direction), while, in the laggingstrand (in 5’ direction), the synthesis of new DNA proceeds discontinuously by DNA poly-merase δ via the synthesis of a series of small DNA fragments that are around 100 to 200 nu-cleotides in length. These so-called Okazaki fragments are joined by a DNA ligase afterwards.The DNA polymerase is supposed to stop synthesis when encountering another oncoming DNApolymerase [1, 90]. The total piece of DNA that is synthesized by the two DNA polymerasesbelonging to replication machineries that originated from the same origin is called a DNA repli-con [56]. The total amount of DNA that is replicated from a single origin is given by the size ofthe DNA replicon.
In every cell cycle, a fraction of origins, called silent origins, is not licensed and consequentlynot fired. This results in a longer piece of DNA that is synthesized by DNA polymerase startingfrom the neighboring origins. Another fraction of replication origins that is still licensed, butremains inactive during S phase, because of its late firing time compared to its neighboringorigins is called dormant origins. Dormant origins are replicated passively by the replicationmachinery originating from a neighboring origin.
The duplication of the genome proceeds in a temporally coordinated manner. The major partof the DNA is replicated within a short time early in S phase from the early replication origins.If the 190 early replication origins are assumed to be distributed on the DNA according to themeasured mean inter-origin distances of 46 kb [46], the total length of DNA that is replicatedfrom these origins is ∼8.7 Mb, corresponding to a fraction of approximately 70% of the 12.1Mb budding yeast genome [15].
53
4 Analysis of the DNA replication dynamics during S phase
The remaining part of the nuclear genome is synthesized from origins, that only become ac-tive late in S phase. The reasons for the delayed initiation of this part of the origins are unclear.The temporal separation of origin firing is reflected in the replication times of chromosome cen-ters, centromeres, and chromosome ends, telomeres, which are typically replicated very earlyand very late in S phase, respectively (Figure 3.1(c)) [67]. The telomeric regions of the chro-mosomes are usually located in a dense chromatin environment [24] at the periphery of the cellnucleus [35], which might suggest a relationship between the activation time of an origin and itsaccessibility given by the surrounding chromatin state and its nuclear localization.
The model for the DNA replication dynamics in S phase, presented here, focusses on theearly replicating part of the genome that is initiated from the early origins, whose firing kineticsis simulated with the mathematical model from Chapters 2. Possible interferences of the repli-cation dynamics with the chromatin environment are neglected in this model. Furthermore, theprogression rate of the replication fork is assumed to be equal in 3’ and 5’ direction and alsoconstant, disregarding potential blockages and occasional pausing of the replication fork, due toe.g. unrepaired DNA damages.
4.2 Quantification of the replication dynamics
4.2.1 Calculation of DNA replicon sizes
To evaluate the replication dynamics during S phase, the sizes of the DNA replicons originatingfrom all firing origins are calculated. For this, a computational model is constructed that con-siders a number of 190 early replication origins. The origins are positioned on the DNA strandaccording to the distribution of inter-origin distances that was measured by Lengronne et al.(2001) [46]. In this study, the technique of DNA combing in combination with the incorporationof exogenous bromodeoxyuridine (BrdU) into newly synthesized DNA was used to monitor thepositions of the early replicating origins that became active in the presence of HU. in the com-putational model, the activation times of the early origins are taken from the firing rate, f (t),which was calculated with the kinetic model for the initiation of DNA replication presented inChapter 2. DNA replicon sizes are calculated for all firing origins assuming a constant, bidi-rectional DNA synthesis rate of 2.9 kb/min, which was determined experimentally [67]. Thecomputational model accounts for the fraction of silent origins, which results from the action oflicensing inhibitory mechanism in the kinetic model. The fraction of dormant origins is a re-sult of the DNA replication dynamics during S phase (Figure 4.1). The calculation of the DNAreplicon sizes proceeds in the following steps:
1. The positions of the 190 early replication origins, x0(i), are determined by randomly draw-ing distances between the adjacent origins from the measured distribution of inter-origin-distances [46].
2. An integer number of silent origins is determined stochastically according to the fractionof silent origins that was calculated by the kinetic model for the initiation of DNA replica-tion in Chapter 2. The silent replication origins are randomly selected and removed from
54

4.2 Quantification of the replication dynamics
Origin positionon DNA xi-3 xi
Replicon Ri-2 Ri Ri+1
Time
Replicated DNA
UnreplicatedDNA
Firingtime
xi-2
titi+1
Replication speed v
xi+1 xi+3
ti+3
ti-2
ti-3
Ri-3 Ri+3
Dormantorigin
Silentorigin
xi-1
ti-1
xi+2
Figure 4.1: Illustration of the DNA replication dynamics during S phase. Each replicon, R(i),of origin i is dependent on the origin position, xi, the firing time, ti, the replicationspeed, v, and position and firing time of its neighboring origins. Silent and dormantremain inactive during S phase for distinct reasons.
the sequence of the 190 early replication origins. This increases the distance between thetwo origins adjacent to a selected, silent origin. The total number of silent origins wasrequired to be smaller than 5 % (190−N origins) in the kinetic model.
3. Each remaining origin i at position x0(i) is assigned a firing time t0(i), which is drawnrandomly from the distribution of firing times of the early origins, f (t). DNA synthesis isassumed to initiate simultaneously in 3’ and 5’ direction at the firing time t0(i).
4. By comparing the differences in the firing times, ∆t0(i) = t0(i)− t0(i− 1), and the timeneeded to synthesize the piece of DNA, ∆x0(i)/v = (x0(i)− x0(i− 1))/v, between a pairof adjacent replication origins, i and i− 1, with the reported DNA synthesis rate, v =2.9kb/min, [67] dormant origins that are replicated passively from a neighboring replica-tion machinery, are identified as follows:
if v |∆t0(i)|< ∆x0(i) no origin of both is replicated passively,
if v |∆t0(i)| ≥ ∆x0(i)∧∆t0(i) > 0 origin i is replicated passively,
if v |∆t0(i)| ≥ ∆x0(i)∧∆t0(i) < 0 origin i−1 is replicated passively.
The dormant origins are also removed from the remaining sequence of early origins andthe distance between the two origins adjacent to the passive origin is increased accord-ingly.
55

4 Analysis of the DNA replication dynamics during S phase
The identification of passively replicated origins (step 4) is repeated, until no furtherdormant origin is detectable.
5. For all origin i that finally become active, the sizes of the DNA replicons R(i) are calcu-lated as the sum of the DNA pieces replicated in 3’ and 5’ direction from that origin, R3(i)and R5(i), respectively:
R(i) = R3(i)+R5(i)
=12(∆x0(i)+ v∆t0(i))+
12(∆x0(i+1)− v∆t0(i+1))
=12((x0(i+1)− x0(i−1))+ v(t0(i)− t0(i+1)− t0(i−1)))
4.2.2 Properties of DNA replication dynamics
To evaluate the DNA replication dynamics during S phase, characteristic properties are definedthat quantify the DNA synthesis period. The model for the DNA replication dynamics, whichdelivers the distribution of DNA replicon sizes, is strongly dependent on the random choiceof distances between neighboring origins and the random assignment of firing times to theseorigins. Thus, the quantitative properties of the DNA replication dynamics during S phase aredetermined as averages over 1000 calculations, in order to eliminate stochastic variations in thedistribution of DNA replicon sizes. This average can also be interpreted as an average over apopulation of 1000 cells with slightly different origin activation times in each cell.
Four quantitative properties are defined to characterize the DNA replication dynamics of theearly origins during S phase in budding yeast:
• The number of silent originscomprises all origins that remain unlicensed in one round of replication. The numberof silent origins is determined in step 2 of the calculation of DNA replicon sizes and isspecified as the mean value and standard deviation over 1000 simulations of the replicationdynamics.
• The number of dormant originscomprises all origins that are still licensed, but then replicated passively from a neighbor-ing DNA polymerase, before becoming active themselves (Figure 4.1). The number ofdormant origins is determined in step 4 of the calculation of DNA replicon sizes and isspecified as the mean value and standard deviation over 1000 simulations of the replicationdynamics. A low number of dormant origins implies that the DNA synthesis originatesfrom many replication origins in parallel, which contributes to the shortening of the timespent on DNA duplication.
56

4.3 Control of the DNA replication dynamics
• The duration of the S phaseis the time needed for the DNA synthesis from the early origins. It is measured as thetime period between the first origin firing event and the completion time of the last DNAreplicon. The duration of S phase is specified as the mean value and the standard deviationover 1000 simulations of the replication dynamics. A short duration of the S phase isfavorable, as it contributes to a fast progression through the cell cycle leading to a rapidcell proliferation [90].
• The distribution of DNA replicon sizesgives the fraction of DNA that is replicated from every firing origin. The distribution ofDNA replicon sizes is specified as the average replicon size and its standard deviation in1000 calculations of complete sets of DNA replicon sizes. The DNA replicons of the dif-ferent origins should ideally have similar sizes indicating an equal partitioning of the DNAsynthesis among the available replication start sites and the absence of very long repliconsizes that are supposed to increase the risk for dissociation or stalling of the replicationfork [73, 44, 90].
The fraction of finally activated origins in one round of replication, can be interpreted as theoverall origin efficiency,
φ = 1− (# silent origins+ # dormant origins)190
,
in that S phase. The highest overall origin efficiency of φ = 100%, is achieved, when DNAreplication is initiated from all origins.
4.3 Control of the DNA replication dynamics
The early S phase is the time from the activation of the first origin to the completion of thelast DNA replicon replicated from an early origin. The early S phase is characterized by thedistribution of DNA replicon sizes, the average duration of the early S phase and the averagenumber of silent and dormant origins per round of replication. These S phase properties aredependent on the functional systems properties of the kinetics of origin firing that are, in parts,already determined before the activation of the replication origins. Previous analysis has shown,that the number of origins that are not licensed, (190−N), and subsequently remain silent in Sphase becomes already fixed during the licensing phase, while the coherence of origin activation,∆, is decided mostly by the kinetics of the formation of the 11-3-2 activator during the firingphase of the replication initiation network (Figure 2.1). Certainly, the DNA replication dynamicsduring S phase depends on the DNA synthesis rate, v. Variations in this rate may be caused byfluctuations in the availability of nucleotides and the occurrence of unrepaired DNA damagesor other barriers on the unreplicated DNA strand, which lead to a pausing and stalling of thereplication fork. For simplicity, the same constant progression speed of the replication fork, v,from every firing origin was assumed in the model. Measurements of the progression speed of
57

4 Analysis of the DNA replication dynamics during S phase
the replication fork show some differences, e.g. a mean values of 2.9 kb/min and 2.8 kb/minwere reported by Raghuraman et al. (2001) [67] and Yabuki et al. (2002) [88], respectively,while Lengronne et al. (2001) [46] referred to a value of 3.7 kb/min.
In the following section, the dependency of the DNA replication dynamics on the number ofsilent origins, (190−N), the coherence of origin firing, ∆, and the DNA synthesis rate, v, isanalyzed. The distribution of firing times, given by the firing rate, f (t), is calculated with thekinetic model for the initiation of DNA replication of Chapter 2 using the reference parameterset (Table 2.3 and 2.5) with certain modifications that are specified below.
4.3.1 Dependency on the number of activated origins N
The influence of the number of activated origins, N, on the DNA replication dynamics duringthe early S phase is analyzed by varying the number of activated origins, N, without changingthe values of the other functional systems properties. This is realized by a strengthening of reli-censing inhibiting mechanisms, that are the degradation of Cdc6, the export of Mcm2-7 proteinsor the phosphorylation of Orc subunits by S-Cdk. Here, the latter mechanism is chosen to mod-ified. Several model simulations are performed, each with a different binding rate constant ofS-Cdk to Orc proteins (7.3× 10³(Ms)−1 < k26 < 1.2× 10⁶(Ms)−1). This leads to a variationin the inhibition of origin licensing and a changed number of activated origins, N, while theother functional system properties, in particular the duration of origin firing, ∆, are not affected(Figure 4.2(b)).
The number of activated origins, N, has a strong influence on the properties of the early Sphase (Figure 4.2(a)). A bisection of the number of activated origins, N, from 185 to approx-imately 95 origins would almost double the mean DNA replicon size to 90 kb and result in astandard deviation of the length distribution of DNA replicons of up to 140 kb. The durationof the early S phase increases enormously from around 28 minutes, under normal conditions, toapproximately 70 minutes with only 95 activated origins. The number of silent origins increasesaccording to the reduction of the number of activated origins, while the number of dormant ori-gins is hardly influenced. However, a small reduction of the number of activated origins, N, toaround 160 origins would only result in a minor deterioration of the properties of the early Sphase.
This analysis reveals, that the number of firing origins, N, which is fixed already during thelicensing phase, becomes very important during the S phase of the cell cycle, when the genomehas to be duplicated, preferably within a short time period.
4.3.2 Dependency on the duration of origin firing ∆
Different durations of origin firing, ∆, are obtained by varying the binding rate constant of the 11-3-2 activator complex to the origins on the interval 3.8×10⁴ (Ms)−1 < k23 < 9.3×10⁵ (Ms)−1 inthe reference parameter set and simulating the kinetic model for the initiation of origin firing. Aslower binding rate constant of the 11-3-2 activator to pre-ICs at the origins results in a prolongedduration of origin activation, ∆, while the other functional system properties of the kinetics of
58

4.3 Control of the DNA replication dynamics
0
50
100
150
200
0
100
200
300
400
40 60 80 100 120 140 160 180-0.5
0.0
0.5
1.0
1.5
40 60 80 100 120 140 160 1800
50
100
150
Number of activated origins N (#)
Num
ber o
fsil
ent o
rigin
s (#)
Num
ber o
fdo
rman
t orig
ins (
#)
Aver
age
repl
icon
size
(kpb
)
Dur
atio
n of
S p
hase
(min
)
Number of activated origins N (#)
02468
10
40 60 80 100 120 140 160 180Number of activated origins N (#)D
urat
ion
of o
rigin
activ
atio
n Δ
(min
)
(a)
(b)
Figure 4.2: (a) Dependence of the replicon size distribution, the duration of the early S phase,the number of silent and the number of passively replicated origins on the number ofactivated origins, N. All S phase properties are specified by the mean value and thestandard deviation over 1000 simulations. (b) The duration of firing, ∆, is unchangedby the variation in the number of activated origins, N.
59

4 Analysis of the DNA replication dynamics during S phase
origin firing are unaffected. In particular, the number of activate origins, N, remains constant185 (Figure 4.3(b)).
A doubling of the duration of firing, ∆, (from 5 to 10 minutes) only has a small influence onthe properties of the early S phase. The distribution of DNA replicon sizes would almost beunchanged, the average duration of the early S phase would increase slightly (about 10 minutes)and the number of dormant origins would rise to 10 origins per cell cycle on average. A furtherincrease in the duration of firing, ∆, to more than 30 minutes has a strong effect on the propertiesof the early S phase (Figure 4.3(a)). The mean replicon size would be almost doubled (ap-proximately 90 kb) and the standard deviation of the length distribution of DNA replicon sizesreaches values of up to 150 kb. The duration of the early S phase would be extended enormouslyto nearly 2 hours and the number of dormant origins increases to more than 80 origins per cellcycle. However, the number of silent origins is not affected by this variation of the duration oforigin activation, ∆, and remains constant at around 5.5 origins per cell cycle.
Interestingly, the duration of the early S phase and the duration of origin firing, ∆, exhibit anearly linear relationship, with proportionality constant of approximately three, implying that aprolongation of the duration of origin firing, ∆, of one minute causes an extension of the lengthof the early S phase of about three minutes.
4.3.3 Dependency on the DNA synthesis rate v
Different values for the progression rate of the replication fork, v, are reported and probably thisrate varies among cells, cell cycles and even among the different replication forks. Raghuramanet al. (2001) [67] monitored the replication dynamics of the entire yeast genome and determinedthe average progression rate of each replication fork. Progression rates of approximately 480replication forks were obtained, whose values are distributed between 0 and 11 kb/min witha mean value at 2.9 kb/min and a median value at 2.3 kb/min. Lengronne et al. (2001) [46]referred to a progression rate of the replication fork of 3.7 kb/min.
In the model, the progression rate of the replication fork, v, is assumed to be constant duringthe early S phase and to attain the same value for all replication forks. In the model, a meanprogression rate of replication fork, v = 2.9 kb/min measured by Raghuraman et al. (2001) [67]is used in the calculation of DNA replicon sizes, the duration of early S phase and the numberof silent and dormant origins. The effect of changes in the replication fork progression rate, v,on the properties of the early S phase is analyzed systematically on the range 0.5 kb/min ≤ v≤10 kb/min (Figure 4.4).
A minimal duration of the early S phase (below 20 minutes) is obtained at a very high DNAsynthesis rate (v = 10 kb/min), but the mean replicon size and the standard deviation of theDNA replicon size distribution (60 ± 30 kb) would be increased at this high progression rate,v. The number of dormant origins is raised as well to more than 30 origins, but the number ofsilent origins is not influenced by a change in the progression rate of the replication fork, v, asexpected.
A very tiny distribution of replicon sizes around the mean inter-origin-distance of 46 kb with-out the occurrence of dormant origins is obtained at a very slow DNA synthesis rate (v = 0.5kb/min), but the time needed to replicate the fraction of the genome from the early origins will
60

4.3 Control of the DNA replication dynamics
20406080
100120
020406080
100120140
5 10 15 20 25 300
204060
80
5 10 15 20 25 3002468
10
180182184186188190
0
Duration of origin firing, Δ (min)
Num
ber o
fsil
ent o
rigin
s (#)
Num
ber o
fdo
rman
t orig
ins (
#)
Aver
age
repl
icon
size
(kpb
)
Dur
atio
n of
S p
hase
(min
)
Duration of origin firing, Δ (min)
Act
ivat
edor
igin
s N (#
)
5 10 15 20 25 30Duration of origin firing, Δ (min)
(a)
(b)
Figure 4.3: (a) Dependence of the replicon size distribution, the duration of the early S phase,the number of silent and the number of passively replicated origins on the durationof origin activation, ∆. All S phase properties are indicated by the mean value andthe standard deviation over 1000 simulations. (b) The number of activated origins,N, is unchanged by the variation in the duration of firing, ∆.
61

4 Analysis of the DNA replication dynamics during S phase
020406080
100120140
0
20
40
60
80
0 2 4 6 8 100
10
20
30
40
0 2 4 6 8 100
2
4
6
810
Progession speed of thereplication fork v (kb/min)
Num
ber o
fsil
ent o
rigin
s (#)
Num
ber o
fdo
rman
t orig
ins (
#)
Aver
age
repl
icon
size
(kpb
)
Dur
atio
n of
S p
hase
(min
)
Progession speed of thereplication fork v (kb/min)
Figure 4.4: Dependence of the replicon size distribution, the duration of the early S phase, thenumber of silent and the number of passively replicated origins on the progressionspeed of the replication fork v. The distribution of origin firing events are calculatedwith the reference parameter set with a duration of origin activation of ∆ = 4.99minutes and a number of firing origins of N = 184.9. All S phase properties aredenoted as mean values with standard deviations over 1000 simulations of the modelfor the replication dynamics during S phase.
increase to more than 2 hours in this case.In the range of the reported progression rates of the replication forks (roughly between 2 to 4kb/min), the properties of the DNA replication dynamics during the early S phase are practicallynot affected. The biggest variation is observed in the duration of the early S phase, which isalmost 40 minutes at a fork rate of 2 kb/min, while only 25 minutes at 4 kb/min.
4.4 Simulations of the DNA replication dynamics
4.4.1 Replication dynamics under normal conditions
The kinetics of origin firing under normal conditions was simulated in Chapter 3 for the refer-ence parameter set. The model for the DNA replication dynamics in S phase predicts a narrowdistribution of DNA replicon sizes under normal conditions. Most replicon sizes center aroundthe mean inter-origin distance of 46 kb and the probability for the occurrence of replicon sizes
62
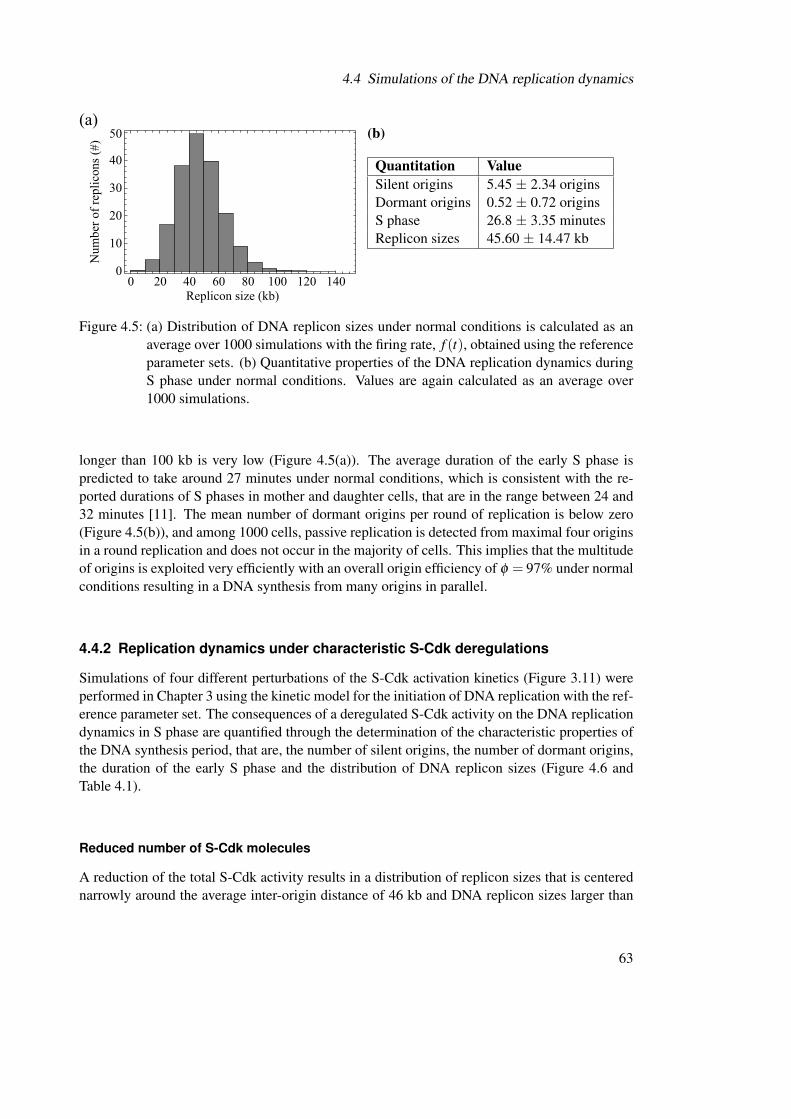
4.4 Simulations of the DNA replication dynamics
0 20 40 60 80 100 120 1400
10
20
30
40
50
Replicon size (kb)
Num
ber o
f rep
licon
s (#)
(a)(b)
Quantitation ValueSilent origins 5.45 ± 2.34 originsDormant origins 0.52 ± 0.72 originsS phase 26.8 ± 3.35 minutesReplicon sizes 45.60 ± 14.47 kb
Figure 4.5: (a) Distribution of DNA replicon sizes under normal conditions is calculated as anaverage over 1000 simulations with the firing rate, f (t), obtained using the referenceparameter sets. (b) Quantitative properties of the DNA replication dynamics duringS phase under normal conditions. Values are again calculated as an average over1000 simulations.
longer than 100 kb is very low (Figure 4.5(a)). The average duration of the early S phase ispredicted to take around 27 minutes under normal conditions, which is consistent with the re-ported durations of S phases in mother and daughter cells, that are in the range between 24 and32 minutes [11]. The mean number of dormant origins per round of replication is below zero(Figure 4.5(b)), and among 1000 cells, passive replication is detected from maximal four originsin a round replication and does not occur in the majority of cells. This implies that the multitudeof origins is exploited very efficiently with an overall origin efficiency of φ = 97% under normalconditions resulting in a DNA synthesis from many origins in parallel.
4.4.2 Replication dynamics under characteristic S-Cdk deregulations
Simulations of four different perturbations of the S-Cdk activation kinetics (Figure 3.11) wereperformed in Chapter 3 using the kinetic model for the initiation of DNA replication with the ref-erence parameter set. The consequences of a deregulated S-Cdk activity on the DNA replicationdynamics in S phase are quantified through the determination of the characteristic properties ofthe DNA synthesis period, that are, the number of silent origins, the number of dormant origins,the duration of the early S phase and the distribution of DNA replicon sizes (Figure 4.6 andTable 4.1).
Reduced number of S-Cdk molecules
A reduction of the total S-Cdk activity results in a distribution of replicon sizes that is centerednarrowly around the average inter-origin distance of 46 kb and DNA replicon sizes larger than
63

4 Analysis of the DNA replication dynamics during S phase
120 kb practically do not occur. Compared to normal conditions, the number of silent originsis halved, but the fraction of dormant origins becomes substantial (∼ 4%). Also the duration ofthe early S phase increases considerably about 8 minutes compared to normal conditions. Theoverall origin efficiency in cells with a reduced S-Cdk activity is only marginally impaired withφ = 95%.
Slowed release of active S-Cdk
A slowed release of active S-Cdk from inhibition by Sic1 causes similar strong changes in theDNA replication dynamics during S phase as in the case of a reduced S-Cdk activity. The overallorigin efficiency is almost the same, with φ = 94%, than in cells with a reduced S-Cdk activity,but here, the number of silent origins remains as high as under normal conditions, whereas thenumber of dormant origins increases about 10 times compared to normal conditions. The result-ing duration of the early S phase and the distribution of DNA replicon sizes is also very similarto the situation of a reduced S-Cdk activity.
Premature activity of S-Cdk
A premature activity of S-Cdk has enormous consequences on the DNA replication dynamics inS phase, which was also observed experimentally in the ∆Sic1 mutant [45]. As predicted by thekinetic model for the initiation of DNA replication, the fraction of silent origins is increased toalmost one fifth of all origins. Consequently, the number of dormant origins remains relativelylow. The duration of S phase prolongs considerably about 20 minutes and the distribution ofDNA replicon sizes is no longer centered around the mean inter-origin distance of 46 kb, butis shifted to around 60 kb. Very long replicon sizes of more than 150 kb may also occur. Theoverall origin efficiency reduces strongly to φ = 77% in the ∆Sic1 mutant.
Stable inhibition of S-Cdk activity
In the situation of a stable inhibition of S-Cdk activity by Sic1 and a preformed 11-3-2 activatorcomplex, which was experimentally realized by Zegerman and Diffley (2007) [89], the DNAreplication dynamics during S phase is entirely disordered. While the number of silent origins isnot changed compared to normal conditions, the number of dormant origins is increased enor-mously, due to the very unsynchronized firing of replication origins. The model predicts thatalmost half of the origins is replicated passively and the average duration of the early S phaseprolongs to more than 100 minutes. The DNA replicon size averages around 90 kb and DNAreplicon sizes longer than 200 kb may occur. The overall origin efficiency of φ = 49% impliesthat only every second origin would be finally activated to initiate DNA replication, in this situ-ation.
64

4.4 Simulations of the DNA replication dynamics
0 50 100 150 200 250 3000
10
20
30
40
0 50 100 150 200 250 300
0 50 100 150 200 250 300 0 50 100 150 200 250 300
Replicon size (kb)
Num
ber o
f rep
licon
s (#)
Replicon size (kb)
Replicon size (kb) Replicon size (kb)
0
10
20
30
40
Num
ber o
f rep
licon
s (#)
Reduced number of S-Cdk Slowed release of active S-Cdk
Premature activity of S-Cdk Stable inhibition of S-Cdk
Figure 4.6: Distribution of replicon sizes caused by the origin firing kinetics calculated with thereference parameter set for different perturbations of S-Cdk activity (shown in Figure3.11). The distribution is determined as an averaged over 1000 calculations.
4.4.3 Replication dynamics of early and late firing origins
The whole budding yeast genome is replicated in a temporally coordinated manner. A majorpart of the genome is duplicated from origins that become active early, while other parts arereplicated from origins that become active late in S phase. The reasons for this separation in lateand early origins are unknown as well as, whether and which biochemical determinants existthat delay firing of late origins. In metazoans, the duration of the S phase is prolonged with thedevelopment from embryonic to somatic cells. Concomitant with this, a decrease is observedin the number of activated origins and an increase in the asynchrony of origin firing, in whichthe activation of early and late origins becomes more and more separated in time [90]. Duringthis development, a modification of the chromatin state occurs, which is accompanied with acompactification of specific regions in the chromatin [47]. Together with the fact that telomericregions, that are also densely packed, always replicate late in S phase, a relationship is suggestedbetween the chromatin state, that is the accessibility of an origin and its replication time [24].
The early and late replicating origins are licensed both at the same time, during the licensing
65

4 Analysis of the DNA replication dynamics during S phase
Table 4.1: Quantification of the DNA replication dynamics during S phase calculated as an aver-aged over 1000 simulations for characteristic S-Cdk perturbations using the referenceparameter set
S-Cdk activity Reduced Retarded Premature InhibitedSilent origins (#) 2.45 ± 1.47 5.56 ± 2.27 40.85 ± 5.53 5.52 ± 2.34Dormant origins (#) 6.97 ± 2.44 5.07 ± 2.10 2.25 ± 1.46 90.87 ± 6.24S phase (min) 34.76 ± 3.56 33.64 ± 3.54 45.64 ± 7.58 102.35 ± 14.17Replicon sizes (kb) 50.15 ± 18.82 48.60 ± 18.16 61.13 ± 27.02 93.45 ± 52.57
phase, and only differ in their time of replication initiation [71]. The fact that DNA rereplica-tion has also been observed from late firing origins [82] confirms the idea that the activationof both, early and late firing origins, is regulated by similar mechanisms, although additionalfactors might be involved in the activation of these origins [85].
The parameter sets that were generated through the optimization of the systems functionalityin Chapter 2 all have identical licensing parameter values but varied firing parameter values thatresulted in the different kinetics of origin firing (Figure 3.1). Most optimized parameter setsexhibited a fast firing kinetics, but a few generated parameter set gave rise to a more slowedinitiation of origin firing.
The different firing rates, f (t), generated by the different optimized parameter sets may alsobe interpreted as the activation kinetics of early and late origins and can be utilized to analyzethe DNA replication dynamics of a complete S phase.
To simulate the firing kinetics of the late origins, a second reference parameter set is selectedfrom the ensemble of optimizes parameter sets. In agreement with experimental observations[88], a representative parameter set is chosen with average initiation time of the late origins thatis around 10 minutes delayed compared to the average activation time of the early origins. If thespacing of replication origins is assumed to be the same for the early and the late firing origins,approximately 80 late firing origins are needed to replicate the remaining part of the genomeof around 3.6 Mb (granted that the whole budding yeast genome consists of 12.2 Mb and thatthe 190 early origins that are distributed with a mean inter-origin-distance of 46 kb [60, 46], arecapable to replicate 8.7 Mb of the genome, on average). The firing rates, f (t), calculated for 190early and 80 late origins are shown in Figure 4.7.
The difference between an early and a late firing origins in terms of kinetic parameter values isnot well-defined. Deviations are identifiable in almost all parameter values of the firing module,which makes the identification of a specific reaction as the reason for the differences in firingtimes of early and late origins impossible.
For the evaluation of the DNA replication dynamics during a complete S phase (Table 4.2),the simplifying assumption is made that the early and late firing origins are totally separatedwithin the genome and that their activation times are independent from each other.
The duration of a total S phase is estimated to take around 40 minutes, which could still be
66

4.4 Simulations of the DNA replication dynamics
35 40 45 50 55 60 65 700.0
0.2
0.4
0.6
0.8
1.0
Time (minutes)
Firin
g ra
te, f(t)
(# o
rigin
s/sec
ond)
190 Early origins with: τ = 42.4 min and Δ = 4.99 min
80 Late origins with:τ = 52.8 min and Δ = 8.47 min
Figure 4.7: One fast and one slow parameter set that both generate a relatively synchronous firingkinetics are selected to describe the kinetics of early and late origin activation.
Table 4.2: Predicted quantitative properties of the DNA replication dynamics during a completeS phase considering both, early and late firing origins.
Quantitative property Early origins Late origins All originsInitial origins (#) 190 80 270Silent origins (#) 5.36 ± 2.30 1.99 ± 1.38 7.07 ± 4.03Dormant origins (#) 0.66 ± 0.78 4.05 ± 1.96 6.66 ± 7.26S phase (minutes) 27.28 ± 3.61 31.56 ± 3.55 40.77 ± 3.44Replicon sizes (kb) 46.72 ± 15.03 47.95 ± 18.94 47.07 ± 16.25
reduced, if the early and late replicating territories are assumed to be mixed, such that the earlyreplicating part of the genome is interspersed with smaller groups of late replicating origins, asis probably the case in each of the chromosomes in budding yeast [67].
67


5 Discussion and Outlook
In this work, a comprehensive mathematical model is provided for the regulation of DNA repli-cation in budding yeast, starting with the formation of RCs at the replication origins and endingafter the completion of DNA synthesis. We considered all measured data reported up to now,and constructed a molecular reaction network based on the identified molecular interactions. Ex-perimentally determined molecule concentrations, albeit in an asynchronous cell population, areused as initial values to simulate the kinetic model. Many kinetic parameters, such as binding,dissociation, (de)phosphorylation, degradation and export rate constants have not been deter-mined experimentally.
To identify these kinetic parameter values computationally, we used an optimization approachto maximize the functionality of the system, that is the rapid and synchronous activation ofreplication origins without rereplication, in dependence of the kinetic parameter values that wereonly allowed to vary within biochemically reasonable ranges.
The systems functionality is defined by means of four functional systems properties, the num-ber of activated origins, the number of rereplicating origins, the mean time to origin firing, andthe duration of firing. These four systems properties quantify the kinetics of origin firing, whichis the output of the mathematical model, in a comprehensive and biologically interpretable way.Contrariwise, the choice of limits of these systems properties that distinguish a still functionalkinetics of origin firing from an already non-functional kinetics is undetermined. No quantitativevalues can be found for these limits in experimental data, which often only comprise qualitativeobservations. We have chosen reasonable limits for the functional system properties, which weused as constraints in the parameter optimization algorithm.
Analysis of the DNA replication initiation network reveals the major controlling moleculesand reactions of each functional systems property. Additionally, correlations between theseproperties are identified. The impact of multiple phosphorylation on the initiation of DNA repli-cation is elucidated by the mathematical model. A specific function is ascribed to the multisitephosphorylation of Sic1 and Sld2 in creating a time delay between G1-Cdk and S-Cdk activity,in the case of Sic1, and between S-Cdk activation and the activation of replication origins, inthe case of Sld2. Moreover, experimentally realized deregulations in the replication initiationnetwork are simulated and quantified using the mathematical model.
Finally, the consequences of a particular kinetics of origin firing on the DNA replicationdynamics during S phase are analyzed in a second mathematical model. For a given progressionrate of the replication fork, the number of activated origins and the duration of origin firing,derived from the kinetic model for the initiation of DNA replication, become very importantduring S phase. Both strongly influence the total time spent on the synthesis of DNA and theprevalence of passive replication.
Using these two mathematical models, one for the kinetics of DNA replication initiation andone for the DNA replication dynamics during S phase, which are both based upon certain sim-
69

5 Discussion and Outlook
plifying assumptions, we are able to analyze the process of DNA replication in budding yeast ina quantitative and comprehensive way.
Specific points concerning the construction of the mathematical model or the biological inter-pretation of the results are discussed in the following.
5.1 Construction of the mathematical model
5.1.1 Structure of the molecular interaction network
The molecular interaction network is constructed on the basis of a multitude of experimentaldata, however, details about certain reactions, such as their temporal order, are still discussed.In the mathematical model, some additional assumptions have been made, while other aspectshave been neglected.
The mathematical model proposes and strongly requires the recycling and a catalytic actionof the 11-3-2 activator complex for its functionality. Without this recycling, the number of11-3-2 activator complexes, which is limited by the experimentally determined amount of Sld3molecules [27], would not be sufficient for the initiation of more than 65 replication origins. Theconstituents of the 11-3-2 activator complex, Sld2, Dpb11 and Sld3, are reported to not be partof the replication complex [10], implying a release of the 11-3-2 activator complex, possiblyafter its catalytic action.
For thermodynamic reasons, a catalytic function of the 11-3-2 activator complex is required,since a catalytic modification of the GINS–DNA polymerase complex at the origins by the 11-3-2 activator complex would explain its dissociation only after the loading of GINS complexand DNA polymerase [3]. Hence, the proposed role of the 11-3-2 activator complex in the firingphase may be similar to those of Cdc6 in the loading of the putative DNA helicase, Mcm2-7, inthe licensing phase [68]. Up to now, a catalytic function of the 11-3-2 activator complex has notbeen identified experimentally.
An alternative binding scheme to the complete formation of the 11-3-2 activator complex inthe nucleoplasm is discussed, in which first Sld3 and Cdc45 bind together to the origins, andthen Sld2 and Dpb11 form a complex in the nucleoplasm, which binds later, completing the11-3-2 activator complex only at the origins [80]. Consequently, the phosphorylation of Sld2by S-Cdk, which is required for the binding to Dpb11, occurs exclusively in the nucleoplasm,whereas Sld3 might be phosphorylated by S-Cdk either at the origins or in the nucleoplasm.As this alternative binding model still comprises a delayed completion of the 11-3-2 activatorcomplex, albeit exclusively at the origins, it would not change the kinetics of origin firing andthe resulting sensitivity coefficients.
Detailed information would be advantageous for the mathematical model, but is still missingfor certain reactions. It is not known, whether Cdt1 needs to be phosphorylated at all by G1-Cdkor S-Cdk in order to be exported from the nucleus. The sequence of binding events of Sld2and Sld3 to Dpb11, forming the 11-3-2 activator complex is discussed [80], and also the precisenumber and sequence of phosphorylation events in Sld2 by S-Cdk is undetermined to a certain
70

5.1 Construction of the mathematical model
extent [54, 77]. In the case of absence of exact information on a reaction, we generally assumedthe simplest possible reaction scheme in the mathematical model.
Some details of reactions that are already confirmed experimentally are not considered orsimplified in the mathematical model. Mcm2-7 proteins, bound to the origins, are likely phos-phorylated at multiple residues by Ddk [72]. As this phosphorylation of Mcm2-7 proteins byDdk is reported to proceed in a processive way, that is, the kinase stays attached to the sub-strate while phosphorylating, we summarized this process in a single phosphorylation, possiblyof longer duration.
Moreover, the binding of Clb5 to Orc6 after origin activation, which is supposed to also con-tribute to the inhibition of origin relicensing once firing is initiated [84], was not considered inthe mathematical model, as this process is still discussed and details about it are still lacking.Additional regulations of Cdc6, which also contribute to the prevention of DNA rereplication,like the regulation of its transcription [36], are also neglected in the mathematical model.Overall, the prevention of DNA rereplication is incorporated realistically in the mathematicalmodel by the three processes that are taken into account, the degradation of Cdc6, the export ofMcm2-7 proteins, and the phosphorylation of Orc subunits by S-Cdk, which all have also beenexamined experimentally [59, 84, 31].
5.1.2 Definition of the systems functionality
The principle output of the mathematical model is the firing rate, f (t), which gives the distri-bution of activation times of the replication origins. The properties of the firing rate are mathe-matically well defined by the zeroth, first, and second moment of the distribution of origin firingtimes, M0,M1, and M2. From this, the definition of four functional systems properties resulted(Table 5.1). Although these functional systems properties have a clear biological interpretation,the specification of functionality criteria, separating functional systems from non-functional sys-tems, is undetermined. Obviously, a high total number of activated origins is beneficial, while alow number of rereplicating origins and a rapid rate of origin firing is advantageous. Since mostexperimental observations reported are more qualitative, we have chosen reasonable values aslimits for the functional systems properties to define the functionality of the system (Table 5.1).
The choice of these limits is reasonable but in a way arbitrary. The total number of earlyorigins was determined by Lengronne et al. (2001) [46] to 190 origins, out of 400 origins intotal. If we start initially with only 190 early origins in our model, the requirement, that almostall origins (∼ 95%) should be activated finally, makes sense, but if we start the model with all∼400 origins, the early activation of only the early origins (∼ 50%) would be appropriate.
The number of rereplicating origins was required to be less than one reinitiated origin in every100th cell cycle for a functional kinetics of origin firing. Unfortunately, there are no experimentaldata available indicating that this is a valid assumption. The experimental techniques are notsensitive enough to detect an amount of rereplication of less than ∼ 1% by now [31, 2], whichwould correspond to ρ of approximately 1-2 origins. Thus, it is totally unclear, if the limit of0.01 rereplicating origins is a good estimate, or if the number of rereplicating origins, in fact, hasto be much lower (e.g. < 10−5) in a functional initiation of DNA replication. Moreover, it is not
71

5 Discussion and Outlook
Table 5.1: Functional systems properties defined by the zeroth, first and seconds moment andthe chosen criteria for functional systems.
Functional systems property Definition Criterion
Total number of firing origins N = M0∗ N > 180 origins
∗: system without rereplicationNumber of rereplicating origins ρ = M0−M0
∗ρ < 0.01 origins
Mean time to firing τ = M1/M0 τ < 85 minutes
Duration of firing ∆ = 2√
M2/M0− (M1/M0)2
∆ < 25 minutes
know, whether and to which extent a very low amount of rereplication, below the detection limit,has negative effects on the viability of budding yeast cells or contributes to genomic instability[31, 2].
The limiting criteria for the timing of origin firing are more straight to define. The durationof an average cell cycle was determined experimentally to take between 90 and 200 minutes[21], though a time period for the initiation of DNA replication of 85 minutes at most seemsreasonable for a functional system. Experimental evidence also exists for the duration of earlyorigin firing [67, 88], which was determined to be in the range of 16 to 20 minutes, justifyingthe chosen maximal limit of 25 minutes.
5.1.3 Optimization of the systems functionality
The determination of functional parameter sets depends on the chosen criteria for the definitionof the functionality of a system. However, the resulting findings concerning kinetic behaviorand control of the DNA replication initiation system would also be valid if other values for thefunctionality criteria would have been taken.
The compromise between rapid origin firing and the accurate prevention of DNA rereplicationis identifiable, even if the constraints for the functional systems properties would have beenchosen differently in the optimization process. In particular, a lower requirement for minimalnumber of activated origins, N, in the parameter optimization process, does not shift the lowerlimit for the mean time to origin firing, τ , below 40 minutes (and the duration of origin firing,∆, below 4 minutes), implying, that this might be a general limit for the rate of origin activation(Figure 5.1(a)).
Functional parameter sets can be generated, in which the limit for the maximum admissiblenumber of rereplicating origins, ρ , which is not defined properly by experimental measurements,is reduced. A variation of this constraint for the number rereplicating origins, ρ , over several
72

5.1 Construction of the mathematical model
40 45 50 55 60
-6-5-4-3-2
Mean time to origin activation, τ (minutes)
Rere
plic
atin
g or
igin
s, ρ
(Log
10 #
)
95 96 97 98Fraction of activated origins (%)
(a) (b)
-6-5-4-3-2-1
Figure 5.1: (a) Parameter sets that are generated using the reference criterion (Table 5.1) for thenumber of activated origins, N, and a varied limit for the maximum allowed numberof rereplicating origins, ρ < {10−5,10−4,10−3,10−2,10−1}, (black dots), as well asparameter sets that are generated using a relaxed constraint for the required frac-tion of activated origins, N > 50%, with the same range of limits for the maximumallowed number of rereplicating origins, ρ , (red dots), both exhibit a correlation be-tween the mean time to origin firing, τ , and the number of rereplicating origins, ρ ,(correlation coefficient for the black dots: -0.561 and for the red dots: -0.528) con-firming that faster parameter sets generally tend to exhibit a higher probability forrereplication, ρ . (b) Changing the constraint for the number of rereplicating origins,ρ < {10−5,10−4,10−3,10−2,10−1}, at a fixed constraint for the fraction of activatedorigins, N < 95%, in the parameter optimization process, implies that the maximalachievable number of activated origins, N, is limited by the maximum admissiblenumber of rereplicating origins, ρ .
orders of magnitude in the optimization process, demonstrates that the maximum achievablenumber of activated origins, N, is reduced in the case of a lower limit for the probability ofrereplication, ρ (Figure 5.1(b)). A lower number of firing origins, N, simultaneously implies ahigher amount of origins that are actively inhibited in becoming licensed.
As the exact limits of the functional systems properties are not known and probably even varyfrom cell to cell, we did not intend to find a single optimal parameter set. Instead, we generateda population of more or less equally functional parameter sets. To analyze the systems behaviorin response to specific perturbations, we always referred to the whole population of functionalparameter sets, which would correspond to the experimental situation in which measurementsare conducted in a cell population.
Analysis of the DNA replication dynamics in S phase revealed, that a short duration of ori-gin firing, ∆, becomes very important during the DNA synthesis process, confirming that the
73

5 Discussion and Outlook
minimization of the duration of origin firing, ∆, as an objective function in the optimizationalgorithm, is a reasonable approach. Additional functionality requirements are incorporated asconstraints for the values of the other functional systems properties in the optimization process.In certain cases, objective function and side constraints are exchangeable in the optimizationprocess, resulting in equivalent parameter sets [34]. An alternative optimization approach wouldhave been, here, to minimize the number of rereplicating origins, ρ as an objective function andto specify a limit for the duration of firing, ∆, as a constraint.
5.2 Biological insight from the mathematical model
5.2.1 Limitations and correlations of the functional systems properties
The analysis of the mathematical model for the initiation of DNA replication in budding yeast re-vealed correlations of the different functional systems properties. While the mean time to originfiring, τ , and the duration of origin firing, ∆, exhibit an almost linear relationship, the logarithmof the number of rereplicating origins, ρ , and the timing of origin firing, τ and ∆, appear to beanti-correlated. The latter finding is interpretable as a trade-off between the accuracy and thevelocity of the initiation of DNA replication at the origins. In experiments by Zegerman & Dif-fley (2007) [89] and Tanaka et al. (2007) [81], in which the activation of replication origins wasaccelerated by the addition of a preformed 11-3-2 activator complex to the cells, a substantialamount of DNA rereplication was detected, but, unfortunately, not quantified more precisely.This observation confirms the theoretical identification of a conflict between the rapid initiationof DNA replication and the reliable inhibition of DNA rereplication.
The regulation of the inhibition of DNA rereplication emerged to be most sensitive towardsfluctuations in the molecule concentrations and the kinetic rate constants. Unfortunately, thisprediction can not be supported experimentally, as the total amount of DNA rereplication isstill very small and in most cases below the detection limit of current experimental methods.However, it is discussed, whether additional DNA rereplication, below the up to now measurableamount, is existing [31].
Due to this restricted experimental data on the occurrence of DNA rereplication, we did notattempt to make statements about the redundancy or necessity of the different mechanisms forthe inhibition of DNA rereplication. A realistic comparison of these different mechanisms isnot possible, as the exact kinetic rate constants for the reactions preventing DNA rereplicationare not available. In the mathematical model, we tuned these kinetic rate constants to accountfor experimentally examined situations, in which specific rereplication inhibiting mechanismsare affected resulting in a substantial amount of DNA rereplication [2, 37]. Certainly, all threemechanisms for the inhibition of DNA rereplication that are considered in the mathematicalmodel, together have the ability to prevent DNA rereplication adequately.
74

5.2 Biological insight from the mathematical model
Activation ofG1-Cdk
Activation ofS-Cdk
Activation oforigins
Time delay by Sic1 Time delay by Sld2
Cdc6 degradationMcm2-7/Cdt1 exportOrc phosphorylationOrigin licensing
Time
Act
ivity
Proc
ess
Figure 5.2: The licensing and firing of replication origins occurs at different times that are tem-porally robustly separated by two time delays. The first is generated by the multiplephosphorylation of Sic1 by G1-Cdk leading to the activation of S-Cdk and the secondtime delay is due to the multisite phosphorylation of Sld2 by S-Cdk finally resultingin the activation of the replication origins. In this way, the reactivation of an alreadyfired origin is inhibited reliably.
5.2.2 Importance of multisite phosphorylation in creating a time delay
Analysis of the mathematical model confirmed the importance of the multiple phosphorylationof Sic1 [20, 58] and Sld2 [54, 77]. By studying in detail the influence of the number of phos-phorylation sites in Sic1 and Sld2 on the kinetics of origin firing, we identified a specific role ofeach multisite phosphorylation (Figure 5.2). Both, multiple phosphorylation of Sic1 and Sld2,provide an essential time delay in the assembly of replication complexes at the origins. The timedelay generated by Sic1 separates the activation of G1-Cdk from the activation of S-Cdk, main-taining a sufficient period of low S-Cdk activity. The multisite phosphorylation of Sld2, on theother hand, creates a time delay at the time of S-Cdk activation, which separates the activationof S-Cdk from the activation of origin firing, ensuring a sufficient time period for the executionof the G1-Cdk-dependent and, in particular, the S-Cdk-dependent mechanisms for the inhibitionof DNA rereplication, before the onset of origin firing. As the S-Cdk-dependent reactions pre-venting DNA rereplication are exclusively executed during the second time delay, when S-Cdkis already fully active (Figure 5.2), the contribution of the multisite phosphorylation of Sld2 tothe overall robustness against DNA rereplication is slightly stronger than the contribution of thetime delay generated by the multisite phosphorylation of Sic1. Indeed, the importance of themultisite phosphorylation of Sic1 has been questioned recently [17, 32].
If the G1-Cdk-dependent mechanisms for the prevention of DNA rereplication are assumed tohave faster kinetic rate constants, the total time delay provided by the multiple phosphorylationof Sic1 and Sld2 could be shortened without impairment of the robustness against DNA rerepli-cation, but probably at the expense of the total number of licensed and subsequently activatedorigins.
The suggested role for multisite phosphorylation in the robust timing and synchronization ofmolecular events may also extend to other cell-cycle regulators.
75
5 Discussion and Outlook
5.2.3 Consequences on the DNA replication dynamics during S phase
The mathematical model for the DNA replication dynamics during S phase is also based uponcertain simplifications. All early origins are assumed to be localized in a single connected clus-ter, neglecting the partitioning of the genome into 16 chromosomes in budding yeast and thedistribution of the origins onto these chromosomes. The fork progression rates are taken to beequal for all replication forks and stalling of the replication machinery is generally not consid-ered in the model. Experimental observations indicated that the progression rates of the indi-vidual replication forks actually vary [67]. Despite of these simplifying assumptions, the modelallows capable predictions about the DNA replication dynamics during S phase and realisticestimations about its sensitivities towards specific factors.
While the impact of the replication fork progression rate and of the number of activated originson the DNA replication dynamics is quite obvious, an effect of the duration of origin firing ismore difficult to assess. A short mean time to firing, τ , and a minimized duration of originfiring, ∆, together, ensure a rapid progression through the process of genome duplication, whichconsists of the initiation of DNA replication at the origins and the synthesis of DNA. Thus, theduration of the DNA synthesis period is an important property of the S phase.
In the kinetic model for the initiation of DNA replication, licensing of replication origins canbe inhibited through diverse mechanisms that thereby prevent DNA rereplication. There is nopossibility to suppress the firing of an already licensed origin in the kinetic model, such thatthe number of licensed origins is always identical to the number of firing origins. The modelfor the DNA replication dynamics in S phase realizes a situation, in which a licensed originfinally is not activated due to a passive replication by a neighboring replication machinery. Thepassive replication of origins is reported to cause a transient pausing of the replication fork atthe passively replicated origin [90] and a lengthening of the DNA replicons replicated by theneighboring replication machineries, but it is not clear, whether this bears an increased risk forthe stalling of the replication fork. The overall origin efficiency, which is affected by both, thenumber of unlicensed (silent) origins and the number of passively replicated (dormant) origins,is another important property of the S phase.
Certainly, the length of the DNA replicons is also an important property of the S phase. LongDNA replicons probably exhibit several disadvantages, like an increased fragility for the accu-mulation of tensions in the DNA double helix and for stalling of the replication fork, whichmight activate certain checkpoint responses [73].
All important properties of the DNA replication dynamics in S phase are shown to be depen-dent on the number of activated origins, N, as well as on the duration of origin firing, ∆, whichbecome fixed in the licensing and firing phase, respectively.
In summary, the strongest influence on the properties of the S phase is exerted by the numberof activated origins, N, on the duration of DNA synthesis and on the average DNA repliconsize, while the overall origin efficiency is only moderately affected (Table 5.2). A change in theduration of origin activation, ∆, mostly influences the duration of S phase and slightly effectsthe average replicon size and the overall origin efficiency. Generally, the number of activatedorigins, N, and the duration of origin firing, ∆, have opposing effects on the properties of the S
76
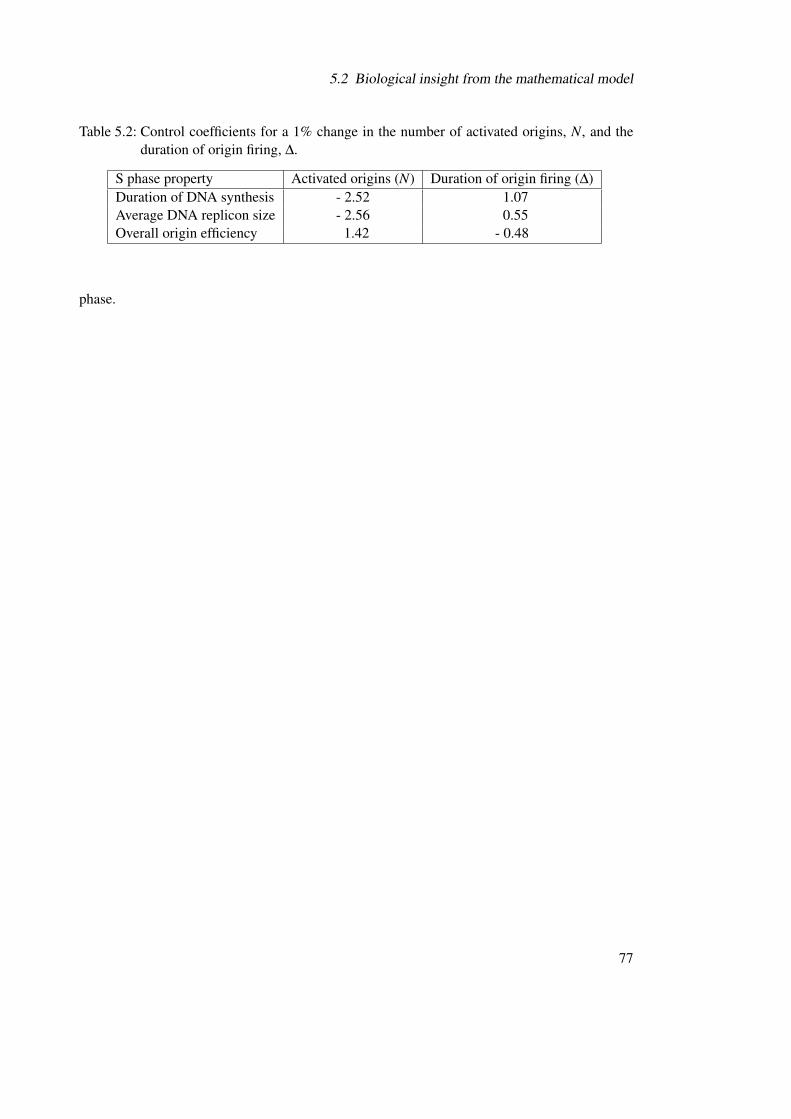
5.2 Biological insight from the mathematical model
Table 5.2: Control coefficients for a 1% change in the number of activated origins, N, and theduration of origin firing, ∆.
S phase property Activated origins (N) Duration of origin firing (∆)Duration of DNA synthesis - 2.52 1.07Average DNA replicon size - 2.56 0.55Overall origin efficiency 1.42 - 0.48
phase.
77

5 Discussion and Outlook
5.3 Outlook
Two mathematical models are developed in this work to describe the process of genome du-plication in budding yeast, from the licensing of replication origins to the completion of DNAsynthesis. The models may be improved and extended in several directions.
The present mathematical models would greatly benefit from more experimental data, suchas phosphorylation kinetics of network components or binding affinities. Quantitative and moresensitive measurements of the amount of DNA rereplication would render the predictions of thekinetic model even more realistic. Possibly, this would also enable statements on the redundancyof the mechanisms preventing DNA rereplication and estimations of the impact of a specificmechanism on the accurate inhibition of DNA rereplication.
The parameter optimization approach could also be applied to the kinetic parameters of thelicensing and S-Cdk activation modules, to analyze the kinetics of the licensing phase in moredetail. This might confirm the identified interrelations of the functional systems properties and,potentially, uncover further correlations. Possibly, this would also provide some new insight intothe choice of limits of the functional systems properties, which have to specified in the optimiza-tion algorithm.
The theoretically predicted role of the multisite phosphorylation of Sld2 by S-Cdk, in provid-ing a time delay for the separation of S-Cdk activation and origin activation could also be testedexperimentally.We would propose to introduce an Sld2 mutant that is rendered constitutively active by substi-tuting threonine 84 with aspartic acid, or to introduce a preformed 11-3-2 activator complex,such as the construct that is used in experiments by Tanaka et al. (2007) [81] and Zegerman& Diffley (2007) [89], into budding yeast cells with a normal S-Cdk activity and activation fol-lowing the degradation of Sic1. The model predicts a premature initiation of DNA replicationin this situation, leading to a desynchronized activation of replication origins and some amountof DNA rereplication (from around 10 origins), although the S-Cdk-dependent mechanisms thatprevent DNA rereplication are unaffected. Thus, this experiment could potentially clarify, if theobserved considerable amount of DNA rereplication is due to a lack of inhibitory S-Cdk activityin the experiments by Tanaka et al. (2007) [81] and Zegerman & Diffley (2007) [89] or due tothe temporally deregulated initiation of DNA replication. The model would propose the latterreason for the DNA rereplication.
The mathematical model could be extended by incorporating also the late replication originsinto the model. The late firing origins are licensed simultaneously with the early firing origins,but the regulation of their firing is probably influenced by additional not yet fully understoodprocesses (see section 4.5). A complete model, considering the activation of all replicationorigins, could be used to analyze potential dependencies of the activation kinetics of early firingorigins on those of the late firing origins and vice versa.
The DNA replication dynamics during S phase could be improved by the partitioning of theorigins on the 16 chromosomes of the budding yeast genome and by the consideration of the
78
5.3 Outlook
corresponding lengths of each chromosome.A direct combination of both models would allow to utilize the predicted completion times of
the DNA replicons in the kinetic model for the initiation of DNA replication. In this case, the re-lease of the molecular constituents of the RC after completed DNA synthesis, and the reenteringof an already fired origin into the replication initiation network at state S0 in the kinetic modelcould be taken from the model for the DNA replication dynamics during S phase.
Budding yeast is used here as a model organism, since a lot of molecular details on the reg-ulation of the activation of replication origins have been identified experimentally in buddingyeast. This facilitates the construction of a realistic and comprehensive mathematical model forthe initiation of DNA replication.
The basic regulatory mechanism responsible for the synchronous and precise activation ofreplication origins, which has been quantitatively analyzed in this work, could similarly bepresent in higher eukaryotic cell types. Indeed, many proteins of the replication initiation net-work, such as Sld2 or the licensing factors, Cdc6 and Cdt1, are conserved from yeast to highereukaryotes. Mathematical modeling of the initiation of DNA replication in other cell types,could be very helpful to identify these mechanisms and to characterize the initiation of DNAreplication in these cell types.
79


Abbreviations
Table .3: Name descriptions and alias names of molecules mentioned in this work
Molecule Alias Name Description
Cdc6 Cell Division Cycle 6Cdc28 Cdk1 Cell Division Cycle 28Cdc45 Sld4 Cell Division Cycle 45Cdt1 Tah11 Topo-A Hypersensitive 11Clb5,6 CycLin B 5,6Cln1,2 CycLiN 1,2DNA polymerase DNA polymerase ε and δ
Dpb11 DNA Polymerase B (II)GINS Psf1-3 and Sld5 Go, Ichi, Ni and San complex
(japanese for 1,2,3,5)Mcm2-7 MiniChromosome Maintenance 2-7Orc1-6 Origin Recognition Complex 1-6SCF Skp1–Cdc53/Cull–F-box protein complexSld2 Drc1 Synthetically Lethal with Dpb11-1 2Sld3 Synthetically Lethal with Dpb11-1
81

Abbreviations
Table .4: List of abbreviations used in this work
Abbreviation Explanation
ARS Autonomously Replicating RequenceATP AdenosinTriPhosphatBrdU BromodeoxyUridineCdk Cyclin-Dependent KinaseDDE Delay Differential EquationFACS Fluorescence Activated Cell SortingG1, G2 phase Gap phase 1,2HU HydroxyUreaM phase Mitotic phaseNES Nuclear Export SignalNLS Nuclear Localization SignalODE Ordinary Differential EquationORC Origin Recognition Complexpre-IC pre-Initiation Complexpre-RC pre-Replication ComplexRC Replication ComplexS phase Synthesis phase
82
Bibliography
[1] B. Alberts, A. Johnson, J. Lewis, M. Raff, K. Roberts, and P. Walter. Molecular Biology ofthe Cell. Garland Science, New York / Abingdon, 2009.
[2] E. E. Arias and J. C. Walter. Strength in numbers: preventing rereplication via multiplemechanisms in eukaryotic cells. Genes Dev, 21(5):497–518, 2007.
[3] P. Atkins and J. De Paula. Physical Chemistry. Oxford University Press, Oxford, UK, 8thedition, 2006.
[4] G. B. and R. P. Total process optimization in chemical engineering with evolutionaryalgorithms. Computers & Chemical Engeneering, 22(1):S229–S236, 1998.
[5] M. Barberis, L. De Gioia, M. Ruzzene, S. Sarno, P. Coccetti, P. Fantucci, M. Vanoni, andL. Alberghina. The yeast cyclin-dependent kinase inhibitor Sic1 and mammalian p27Kip1are functional homologues with a structurally conserved inhibitory domain. Biochem J,387(Pt 3):639–647, 2005.
[6] M. Barberis, E. Klipp, M. Vanoni, and L. Alberghina. Cell size at S phase initiation: anemergent property of the G1/S network. PLoS Comput Biol, 3(4):e64, 2007.
[7] J. Bloom and F. R. Cross. Novel role for Cdc14 sequestration: Cdc14 dephosphorylatesfactors that promote DNA replication. Mol Cell Biol, 27(3):842–853, 2007.
[8] J. Bloom and F. R. Cross. Multiple levels of cyclin specificity in cell-cycle control. NatRev Mol Cell Biol, 8(2):149–160, 2007.
[9] J. J. Blow and A. Dutta. Preventing re-replication of chromosomal DNA. Nat Rev MolCell Biol, 6(6):476–486, 2005.
[10] M. Botchan. Cell biology: a switch for S phase. Nature, 445(7125):272–274, 2007.
[11] B. J. Brewer, E. Chlebowicz-Sledziewska, and W. L. Fangman. Cell cycle phases in theunequal mother/daughter cell cycles of Saccharomyces cerevisiae. Mol Cell Biol, 4(11):2529–2531, 1984.
[12] K. C. Chen, A. Csikasz-Nagy, B. Gyorffy, J. Val, B. Novak, and J. J. Tyson. Kinetic analysisof a molecular model of the budding yeast cell cycle. Mol Biol Cell, 11(1):369–391, 2000.
[13] K. C. Chen, L. Calzone, A. Csikasz-Nagy, F. R. Cross, B. Novak, and J. J. Tyson. Inte-grative analysis of cell cycle control in budding yeast. Mol Biol Cell, 15(8):3841–3862,2004.
83

Bibliography
[14] S. Chen, M. A. de Vries, and S. P. Bell. Orc6 is required for dynamic recruitment of Cdt1during repeated Mcm2-7 loading. Genes Dev, 21(22):2897–2907, 2007.
[15] K. R. Christie, S. Weng, R. Balakrishnan, M. C. Costanzo, K. Dolinski, S. S. Dwight, S. R.Engel, B. Feierbach, D. G. Fisk, J. E. Hirschman, E. L. Hong, L. Issel-Tarver, R. Nash,A. Sethuraman, B. Starr, C. L. Theesfeld, R. Andrada, G. Binkley, Q. Dong, C. Lane,M. Schroeder, D. Botstein, and J. M. Cherry. Saccharomyces Genome Database (SGD)provides tools to identify and analyze sequences from Saccharomyces cerevisiae and re-lated sequences from other organisms. Nucleic Acids Res, 32(Database issue):D311–4,2004.
[16] F. R. Cross, V. Archambault, M. Miller, and M. Klovstad. Testing a mathematical modelof the yeast cell cycle. Mol Biol Cell, 13(1):52–70, 2002.
[17] F. R. Cross, L. Schroeder, and J. M. Bean. Phosphorylation of the Sic1 inhibitor of B-typecyclins in Saccharomyces cerevisiae is not essential but contributes to cell cycle robustness.Genetics, 176(3):1541–1555, 2007.
[18] A. Csikasz-Nagy. Computational systems biology of the cell cycle. Brief Bioinform, 10(4):424–434, 2009.
[19] T. Degenhardt, K. N. Rybakova, A. Tomaszewska, M. J. Mone, H. V. Westerhoff, F. J.Bruggeman, and C. Carlberg. Population-level transcription cycles derive from stochastictiming of single-cell transcription. Cell, 138(3):489–501, 2009.
[20] R. J. Deshaies and J. E. J. Ferrell. Multisite phosphorylation and the countdown to S phase.Cell, 107(7):819–822, 2001.
[21] S. Di Talia, J. M. Skotheim, J. M. Bean, E. D. Siggia, and F. R. Cross. The effects ofmolecular noise and size control on variability in the budding yeast cell cycle. Nature, 448(7156):947–951, 2007.
[22] J. F. X. Diffley. Regulation of early events in chromosome replication. Curr Biol, 14(18):R778–86, 2004.
[23] L. S. Drury, G. Perkins, and J. F. Diffley. The cyclin-dependent kinase Cdc28p regulatesdistinct modes of Cdc6p proteolysis during the budding yeast cell cycle. Curr Biol, 10(5):231–240, 2000.
[24] W. L. Fangman and B. J. Brewer. A question of time: replication origins of eukaryoticchromosomes. Cell, 71(3):363–366, 1992.
[25] L. Feng, B. Wang, B. Driscoll, and A. Jong. Identification and characterization of Sac-charomyces cerevisiae Cdc6 DNA-binding properties. Mol Biol Cell, 11(5):1673–1685,2000.
[26] R. R. Gabdoulline and R. C. Wade. Biomolecular diffusional association. Curr Opin StructBiol, 12(2):204–213, 2002.
84

Bibliography
[27] S. Ghaemmaghami, W.-K. Huh, K. Bower, R. W. Howson, A. Belle, N. Dephoure, E. K.O’Shea, and J. S. Weissman. Global analysis of protein expression in yeast. Nature, 425(6959):737–741, 2003.
[28] D. M. Gilbert. Nuclear position leaves its mark on replication timing. J Cell Biol, 152(2):F11–5, 2001.
[29] A. Goldar, H. Labit, K. Marheineke, and O. Hyrien. A dynamic stochastic model for DNAreplication initiation in early embryos. PLoS One, 3(8):e2919, 2008.
[30] A. Goldar, M.-C. Marsolier-Kergoat, and O. Hyrien. Universal temporal profile of replica-tion origin activation in eukaryotes. PLoS One, 4(6):e5899, 2009.
[31] B. M. Green, R. J. Morreale, B. Ozaydin, J. L. Derisi, and J. J. Li. Genome-wide map-ping of DNA synthesis in Saccharomyces cerevisiae reveals that mechanisms preventingreinitiation of DNA replication are not redundant. Mol Biol Cell, 17(5):2401–2414, 2006.
[32] B. Hao, S. Oehlmann, M. E. Sowa, J. W. Harper, and N. P. Pavletich. Structure of a Fbw7-Skp1-cyclin E complex: multisite-phosphorylated substrate recognition by SCF ubiquitinligases. Mol Cell, 26(1):131–143, 2007.
[33] R. Heinrich and S. Schuster. The Regulation of Cellular Systems. Chapman & Hall, NewYork, NY, 1996.
[34] R. Heinrich, S. Schuster, and H. G. Holzhutter. Mathematical analysis of enzymic reactionsystems using optimization principles. Eur J Biochem, 201(1):1–21, 1991.
[35] P. Heun, T. Laroche, M. K. Raghuraman, and S. M. Gasser. The positioning and dynamicsof origins of replication in the budding yeast nucleus. J Cell Biol, 152(2):385–400, 2001.
[36] S. Honey and B. Futcher. Roles of the CDK phosphorylation sites of yeast Cdc6 in chro-matin binding and rereplication. Mol Biol Cell, 18(4):1324–1336, 2007.
[37] A. E. Ikui, V. Archambault, B. J. Drapkin, V. Campbell, and F. R. Cross. Cyclin and cyclin-dependent kinase substrate requirements for preventing rereplication reveal the need forconcomitant activation and inhibition. Genetics, 175(3):1011–1022, 2007.
[38] P. Jorgensen, N. P. Edgington, B. L. Schneider, I. Rupes, M. Tyers, and B. Futcher. Thesize of the nucleus increases as yeast cells grow. Mol Biol Cell, 18(9):3523–3532, 2007.
[39] S. Jun and J. Bechhoefer. Nucleation and growth in one dimension. II. Application to DNAreplication kinetics. Phys Rev E Stat Nonlin Soft Matter Phys, 71(1 Pt 1):011909, 2005.
[40] S. Jun, H. Zhang, and J. Bechhoefer. Nucleation and growth in one dimension. I. The gen-eralized Kolmogorov-Johnson-Mehl-Avrami model. Phys Rev E Stat Nonlin Soft MatterPhys, 71(1 Pt 1):011908, 2005.
[41] M. Kanemaki and K. Labib. Distinct roles for Sld3 and GINS during establishment andprogression of eukaryotic DNA replication forks. EMBO J, 25(8):1753–1763, 2006.
85
Bibliography
[42] S. Kar, W. T. Baumann, M. R. Paul, and J. J. Tyson. Exploring the roles of noise in theeukaryotic cell cycle. Proc Natl Acad Sci U S A, 106(16):6471–6476, 2009.
[43] S. Krishnamurthy, E. Smith, D. Krakauer, and W. Fontana. The stochastic behavior of amolecular switching circuit with feedback. Biol Direct, 2:13, 2007.
[44] K. Labib and B. Hodgson. Replication fork barriers: pausing for a break or stalling fortime? EMBO Rep, 8(4):346–353, 2007.
[45] A. Lengronne and E. Schwob. The yeast CDK inhibitor Sic1 prevents genomic instabilityby promoting replication origin licensing in late G(1). Mol Cell, 9(5):1067–1078, 2002.
[46] A. Lengronne, P. Pasero, A. Bensimon, and E. Schwob. Monitoring S phase progressionglobally and locally using BrdU incorporation in TK(+) yeast strains. Nucleic Acids Res,29(7):1433–1442, 2001.
[47] E. Li. Chromatin modification and epigenetic reprogramming in mammalian development.Nat Rev Genet, 3(9):662–673, 2002.
[48] C. Liang and B. Stillman. Persistent initiation of DNA replication and chromatin-boundMCM proteins during the cell cycle in cdc6 mutants. Genes Dev, 11(24):3375–3386, 1997.
[49] M. E. Liku, V. Q. Nguyen, A. W. Rosales, K. Irie, and J. J. Li. CDK phosphorylationof a novel NLS-NES module distributed between two subunits of the Mcm2-7 complexprevents chromosomal rereplication. Mol Biol Cell, 16(10):5026–5039, 2005.
[50] D. J. Lockhart, H. Dong, M. C. Byrne, M. T. Follettie, M. V. Gallo, M. S. Chee,M. Mittmann, C. Wang, M. Kobayashi, H. Horton, and E. L. Brown. Expression mon-itoring by hybridization to high-density oligonucleotide arrays. Nat Biotechnol, 14(13):1675–1680, 1996.
[51] S. Lopez-Aviles, O. Kapuy, B. Novak, and F. Uhlmann. Irreversibility of mitotic exit is theconsequence of systems-level feedback. Nature, 459(7246):592–595, 2009.
[52] M. S. Luijsterburg, G. von Bornstaedt, A. M. Gourdin, A. Z. Politi, M. J. Mone, D. O.Warmerdam, J. Goedhart, W. Vermeulen, R. van Driel, and T. Hofer. Stochastic and re-versible assembly of a multiprotein DNA repair complex ensures accurate target site recog-nition and efficient repair. J Cell Biol, 189(3):445–463, 2010.
[53] J. Lygeros, K. Koutroumpas, S. Dimopoulos, I. Legouras, P. Kouretas, C. Heichinger,P. Nurse, and Z. Lygerou. Stochastic hybrid modeling of DNA replication across a com-plete genome. Proc Natl Acad Sci U S A, 105(34):12295–12300, 2008.
[54] H. Masumoto, S. Muramatsu, Y. Kamimura, and H. Araki. S-Cdk-dependent phosphory-lation of Sld2 essential for chromosomal DNA replication in budding yeast. Nature, 415(6872):651–655, 2002.
86

Bibliography
[55] L. Matsson. DNA replication and cell cycle progression regulated by long range inter-actions between protein complexes bound to DNA. Journal of Biological Physics, 27:329–359, 2001.
[56] M. Mechali. DNA replication origins: from sequence specificity to epigenetics. Nat RevGenet, 2(8):640–645, 2001.
[57] C. G. Moles, P. Mendes, and J. R. Banga. Parameter estimation in biochemical pathways:a comparison of global optimization methods. Genome Res, 13(11):2467–2474, 2003.
[58] P. Nash, X. Tang, S. Orlicky, Q. Chen, F. B. Gertler, M. D. Mendenhall, F. Sicheri, T. Paw-son, and M. Tyers. Multisite phosphorylation of a CDK inhibitor sets a threshold for theonset of DNA replication. Nature, 414(6863):514–521, 2001.
[59] V. Q. Nguyen, C. Co, and J. J. Li. Cyclin-dependent kinases prevent DNA re-replicationthrough multiple mechanisms. Nature, 411(6841):1068–1073, 2001.
[60] C. A. Nieduszynski, S.-i. Hiraga, P. Ak, C. J. Benham, and A. D. Donaldson. OriDB: aDNA replication origin database. Nucleic Acids Res, 35(Database issue):D40–6, 2007.
[61] S. H. Northrup and H. P. Erickson. Kinetics of protein-protein association explained byBrownian dynamics computer simulation. Proc Natl Acad Sci U S A, 89(8):3338–3342,1992.
[62] R. Nougarede, F. Della Seta, P. Zarzov, and E. Schwob. Hierarchy of S-phase-promotingfactors: yeast Dbf4-Cdc7 kinase requires prior S-phase cyclin-dependent kinase activation.Mol Cell Biol, 20(11):3795–3806, 2000.
[63] B. Novak and J. J. Tyson. Modeling the control of DNA replication in fission yeast. ProcNatl Acad Sci U S A, 94(17):9147–9152, 1997.
[64] R. Phillips, J. Kondev, and J. Theriot. Physical Biology of the Cell. Garland Science, 2009.
[65] A. Politi, M. J. Mone, A. B. Houtsmuller, D. Hoogstraten, W. Vermeulen, R. Heinrich, andR. van Driel. Mathematical modeling of nucleotide excision repair reveals efficiency ofsequential assembly strategies. Mol Cell, 19(5):679–690, 2005.
[66] D. M. PRESCOTT. Relation between cell growth and cell division. III. Changes in nuclearvolume and growth rate and prevention of cell division in Amoeba proteus resulting fromcytoplasmic amputations. Exp Cell Res, 11(1):94–98, 1956.
[67] M. K. Raghuraman, E. A. Winzeler, D. Collingwood, S. Hunt, L. Wodicka, A. Conway,D. J. Lockhart, R. W. Davis, B. J. Brewer, and W. L. Fangman. Replication dynamics ofthe yeast genome. Science, 294(5540):115–121, 2001.
[68] J. C. W. Randell, J. L. Bowers, H. K. Rodriguez, and S. P. Bell. Sequential ATP hydrolysisby Cdc6 and ORC directs loading of the Mcm2-7 helicase. Mol Cell, 21(1):29–39, 2006.
87

Bibliography
[69] R. L. Rossi, V. Zinzalla, A. Mastriani, M. Vanoni, and L. Alberghina. Subcellular local-ization of the cyclin dependent kinase inhibitor Sic1 is modulated by the carbon source inbudding yeast. Cell Cycle, 4(12):1798–1807, 2005.
[70] C. Salazar and T. Hofer. Versatile regulation of multisite protein phosphorylation by theorder of phosphate processing and protein-protein interactions. FEBS J, 274(4):1046–1061, 2007.
[71] C. Santocanale and J. F. Diffley. ORC- and Cdc6-dependent complexes at active and in-active chromosomal replication origins in Saccharomyces cerevisiae. EMBO J, 15(23):6671–6679, 1996.
[72] Y.-J. Sheu and B. Stillman. Cdc7-Dbf4 phosphorylates MCM proteins via a docking site-mediated mechanism to promote S phase progression. Mol Cell, 24(1):101–113, 2006.
[73] J. M. Sidorova and L. L. Breeden. Precocious G1/S transitions and genomic instability:the origin connection. Mutat Res, 532(1-2):5–19, 2003.
[74] J. M. Skotheim, S. Di Talia, E. D. Siggia, and F. R. Cross. Positive feedback of G1 cyclinsensures coherent cell cycle entry. Nature, 454(7202):291–296, 2008.
[75] T. W. Spiesser, E. Klipp, and M. Barberis. A model for the spatiotemporal organization ofDNA replication in Saccharomyces cerevisiae. Mol Genet Genomics, 282(1):25–35, 2009.
[76] J. Srividhya and M. S. Gopinathan. A simple time delay model for eukaryotic cell cycle. JTheor Biol, 241(3):617–627, 2006.
[77] Y.-S. Tak, Y. Tanaka, S. Endo, Y. Kamimura, and H. Araki. A CDK-catalysed regulatoryphosphorylation for formation of the DNA replication complex Sld2-Dpb11. EMBO J, 25(9):1987–1996, 2006.
[78] S. Tanaka and J. F. X. Diffley. Deregulated G1-cyclin expression induces genomic insta-bility by preventing efficient pre-RC formation. Genes Dev, 16(20):2639–2649, 2002.
[79] S. Tanaka and J. F. X. Diffley. Interdependent nuclear accumulation of budding yeast Cdt1and Mcm2-7 during G1 phase. Nat Cell Biol, 4(3):198–207, 2002.
[80] S. Tanaka, Y.-S. Tak, and H. Araki. The role of CDK in the initiation step of DNA replica-tion in eukaryotes. Cell Div, 2:16, 2007.
[81] S. Tanaka, T. Umemori, K. Hirai, S. Muramatsu, Y. Kamimura, and H. Araki. CDK-dependent phosphorylation of Sld2 and Sld3 initiates DNA replication in budding yeast.Nature, 445(7125):328–332, 2007.
[82] R. E. Tanny, D. M. MacAlpine, H. G. Blitzblau, and S. P. Bell. Genome-wide analysis ofre-replication reveals inhibitory controls that target multiple stages of replication initiation.Mol Biol Cell, 17(5):2415–2423, 2006.
88

Bibliography
[83] R. Visintin, K. Craig, E. S. Hwang, S. Prinz, M. Tyers, and A. Amon. The phosphataseCdc14 triggers mitotic exit by reversal of Cdk-dependent phosphorylation. Mol Cell, 2(6):709–718, 1998.
[84] G. M. Wilmes, V. Archambault, R. J. Austin, M. D. Jacobson, S. P. Bell, and F. R. Cross.Interaction of the S-phase cyclin Clb5 with an "RXL" docking sequence in the initiatorprotein Orc6 provides an origin-localized replication control switch. Genes Dev, 18(9):981–991, 2004.
[85] E. Wintersberger. Why is there late replication? Chromosoma, 109(5):300–307, 2000.
[86] Wolfram Research, Inc. Mathematica version 7.0, 2009.
[87] P.-Y. J. Wu and P. Nurse. Establishing the program of origin firing during S phase in fissionYeast. Cell, 136(5):852–864, 2009.
[88] N. Yabuki, H. Terashima, and K. Kitada. Mapping of early firing origins on a replicationprofile of budding yeast. Genes Cells, 7(8):781–789, 2002.
[89] P. Zegerman and J. F. X. Diffley. Phosphorylation of Sld2 and Sld3 by cyclin-dependentkinases promotes DNA replication in budding yeast. Nature, 445(7125):281–285, 2007.
[90] P. Zegerman and J. F. X. Diffley. DNA replication as a target of the DNA damage check-point. DNA Repair (Amst), 8(9):1077–1088, 2009.
89


Selbständigkeitserklärung
Hiermit versichere ich, die vorliegende Arbeit selbständig und ausschließlich unter Verwendungder angegebenen Mittel und ohne unerlaubte Hilfen angefertigt zu haben.
Heidelberg, den 09.12.2009 Anneke Brümmer
91