mathematical modeling of silicon single … · summary of actual mathematical model for fz silicon...
TRANSCRIPT

MATHEMATICAL MODELING OF SILICON SINGLE
CRYSTAL INDUSTRIAL GROWTH Dr. Andris Muižnieks, Dr. Andis Rudevičs, Dr. Armands Krauze,
BSc. Vadims Suškovs, BSc. Kirils Surovovs, BSc. Kārlis Janisels
1. Introduction
The acticity was led by associated professor, Dr.-Phys. Andris Muiznieks. In the
activity participated Dr.-Phys. Armands Krauze, Dr.-Chem. Girts Barinovs and
several students of bachelor program in Physics.
In the frame of activity for the mathematical modeling of silicon single crystal growth
by floating zone (FZ) method previously developed system of mathematical models
and program package FZone were developed further. The integrated model of the
argon flow in the FZ equipment was implemented in package FZone which allows for
the first time to consider the interaction between the temperature distribution in the
silicon and argon flow. For the first time the threedimensional (3D) mathematical
model for the calculation of the molten zone shape and the temperature field inside it
was developed and implemented in the package FZone. The package FZSiFOAM for
the 3D calculation of temperature, hydrodynamic and dopant concentration field in
the molten zone was developed further. This package is based on the open source
code library OpenFOAM and is implemented on multiprocessor cluster in LINUX
environment.
The description of the actual model system and program package FZone is given in
the following sections.
2. Summary of actual mathematical model for FZ silicon single crystal growth
The actual calculation scheme of the program complex FZone is shown in Fig. 2.1.
The temperature field in the silicon parts and temperature and velocity fields in the
argon atmosphere is calculated as axis-symmetric. The high frequency (HF)
electromagnetic (EM) field is calculated in three dimensions (3D). Melt free surface
can be modeled as axis-symmetric or in three dimensions because the distribution of
the electromagnetic pressure produced by a high-frequency inductor can be strongly
non-symmetric. The flow, temperature and dopant transport in the molten zone is
calculated in 3D. The calculated three-dimensional temperature field in melt is
azimuthally averaged and used in FZone for phase boundary calculations.

Fig. 2.1. The actual calculation scheme of the program complex FZone
In the case of neglecting convective heat transport in the molten zoneand the
influence of argon flow, a simpler scheme can be used, in which only HF EM field is
considered in 3D or in 2D, see Fig.2.2. Fig.2.2 also shows a corresponding axis-
symmetric calculation example. Shown is the finite element mesh in the feed rod
(polycrystal) and in the single crystal, temperature field in the melt and magnetic field
lines produced by a high-frequency inductor. Fig. 2.3. shows the alculated three-
dimensional distribution of electromagnetic power density induced by a high-
frequency inductor on the free melt and crystal surfaces.
Fig. 2.2. A simpler calculation scheme, in which only HF EM field is considered in
3D or in 2D (left) and an axis-symmetric calculation example

Fig. 2.3. Three-dimensional distribution of electromagnetic power density induced by
a high-frequency inductor on the free melt and crystal surfaces
3. Three-dimensional model for asymmetric free surface influence on the FZ
growth
To obtain a steady state three-dimensional (3D) solution for the FZ zone process, the
following iterative model was developed, see Fig. 3.1. A special program module in
(FZone) carries out high frequency EM field 3D calculations for a given inductor
current. The result is the distribution of the EM pressure on the free surface. Another
program recalculates the form of the free surface, which is influenced by EM
pressure. To obtain a steady-state form of the free surface, the EM and free surface
calculations are repeated iteratively until precision condition is satisfied. After that, a
3D boundary element calculation is run for the temperature distribution in the melt. It
uses the EM heat distribution on the free surface as a part of the absorbed heat. The
calculation results from the 3D BEM program are supplied to a 2D heat transfer
program that models the heat transfer in the whole FZ system and updates the
geometry of it. The procedure is repeated until a solution is found.

Fig. 3.1. General iterative scheme for the 3D calculation of the shape of the molten
zone, 3D calculation of the temperature in the molten zone and coupling with FZone
For modeling the 3D free surface shapes, the method is used, which corresponds to
the method used in licence free program ”Surface Evolver”. This method was
improved by adding the EM pressure influence on the melt shape. For the 3D
calculation of the temperature field in the molten zone, the 3D boundary element
method is used with following boundary conditions: the temperature on the melting
and crystallization interfaces is set constant; on the melt free surface the heat flux
density is set, which is obtained from EM heat sources in the skinlayer and takes into
account the heat radiation.
A calculation example is shown in Fig. 3.2and Fig. 3.3. The calculated system
corresponds to one experimental setup for FZ 4” silicon crystal growth in the Institute
for Crystal Growth in Berlin.
Fig. 3.2. HF inductor with the main slit and additional slits, 3D alculated surface
current lines distribution (left); 3D calculated temperature distribution on the melt free
surface (right)
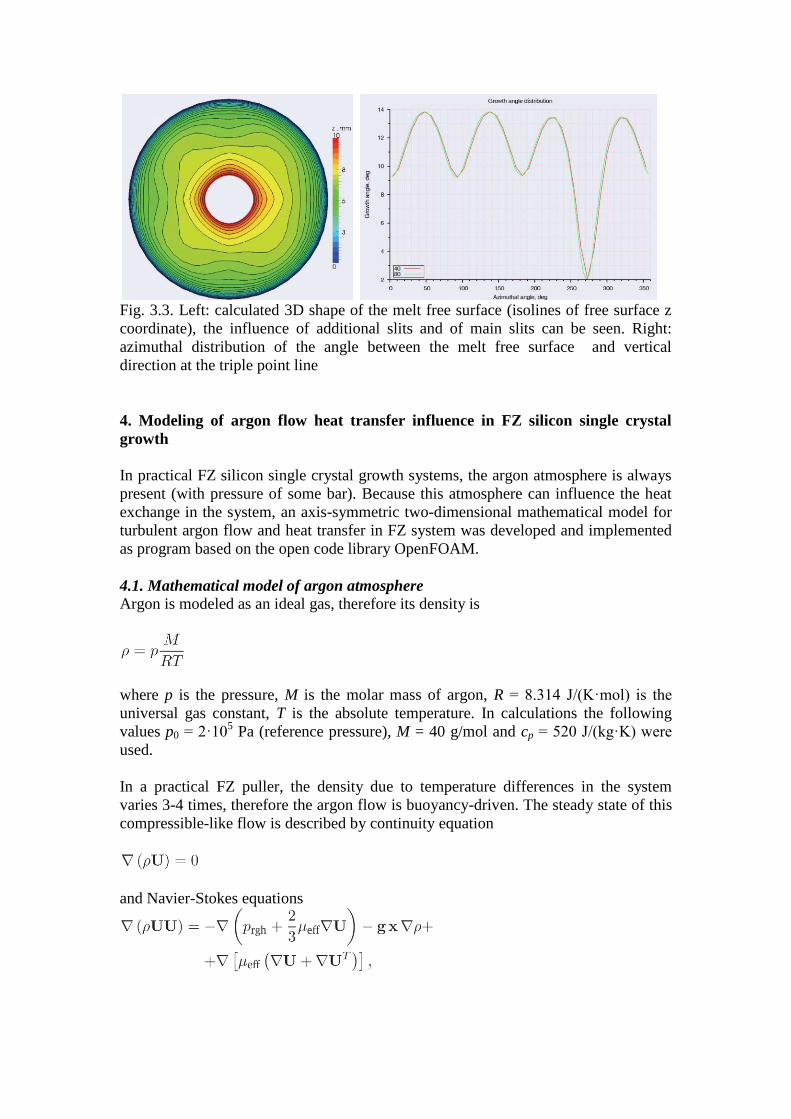
Fig. 3.3. Left: calculated 3D shape of the melt free surface (isolines of free surface z
coordinate), the influence of additional slits and of main slits can be seen. Right:
azimuthal distribution of the angle between the melt free surface and vertical
direction at the triple point line
4. Modeling of argon flow heat transfer influence in FZ silicon single crystal
growth
In practical FZ silicon single crystal growth systems, the argon atmosphere is always
present (with pressure of some bar). Because this atmosphere can influence the heat
exchange in the system, an axis-symmetric two-dimensional mathematical model for
turbulent argon flow and heat transfer in FZ system was developed and implemented
as program based on the open code library OpenFOAM.
4.1. Mathematical model of argon atmosphere
Argon is modeled as an ideal gas, therefore its density is
where p is the pressure, M is the molar mass of argon, R = 8.314 J/(K·mol) is the
universal gas constant, T is the absolute temperature. In calculations the following
values p0 = 2·105 Pa (reference pressure), M = 40 g/mol and cp = 520 J/(kg·K) were
used.
In a practical FZ puller, the density due to temperature differences in the system
varies 3-4 times, therefore the argon flow is buoyancy-driven. The steady state of this
compressible-like flow is described by continuity equation
and Navier-Stokes equations

where U is the velocity, prgh = p – ρg x, µeff = µ + µt is the effective dynamic viscosity
of argon (µ – molecular, µt – turbulent, obtained from turbulence model), g = 9.81
m/s2 is standard gravity, x is spatial position vector. Turbulence is modeled using the
SST k-omega low-Re turbulence model. The dependence of molecular dynamic
viscosity on temperature µ(T) is given by Sutherland’s law (Fig. 4.1).
Energy transfer in the FZ system is calculated using the enthalpy formulation
where h is the enthalpy and αeff = α + αt is the effective thermal diffusivity for
enthalpy (α – molecular, αt – turbulent). Constant specific heat capacity at constant
pressure cp is assumed, therefore h = cp T.
Fig. 4.1. The dependence of molecular dynamic viscosity on temperature µ(T) by
Sutherland’s law.
For the velocity field and enthalpy field the following boundary conditions (BC) are
used: 1) Velocity: no-slip BC at solid walls (Si, inductor and puller wall surfaces);
crystal pulling and rotation is neglected; 2) Temperature: first-type BC at solid walls;
3) Turbulent quantities: standard low-Re model BC at solid walls; 4) Axial symmetry:
wedge BC at front and back planes.
4.2. Calculation algorithm
Because the temperature field in the argon and the temperature field in silicon parts
and in the inductor are coupled, the following calculation algorithm was developed
(see Fig. 4.2):
1) Calculation of the quasi-stationary shape of phase boundaries with the program
FZone;
2) Creation of the geometry for argon flow calculations and mesh generation;
3) Interpolation of the temperature field on the Si surfaces from FZone to the
generated mesh boundary;
4) Calculation of the axisymmetric steady state argon flow using OpenFOAM
standard solver buoyantSimpleFoam;

5) Calculation of the quasi-stationary shape of phase boundaries using FZone with
argon heat flux density (obtained in the previous step using utility wallHeatFlux)
taken into account.
Fig. 4.2. Calculation steps in the used algorithm for the coupling of the temperature
fields in argon atmosphere and in silicon parts and in the inductor
4.3. Calculation example
A typical ICG (Berlin) FZ system with crystal diameter 4" and mono- and polycrystal
lengths 1 m has been considered. FZ puller height is 3 m, radius – 30 cm, the
generated finite element mesh consists of ca. 50,000 cells.
The results of calculation are given in the following figures: in Fig. 4.3 the
temperature and velocity fields in the vicinity of the inductor are shown; in Fig. 4.4
detailed views of temperature and velocity fields at crystal surface, velocity
magnitude, stream function isolines and viscosity ratio µt /µ are given; in Fig. 4.5 the
influence of additional crystal cooling by argon on the quasi-stationary shape of phase
boundaries is shown.
Fig. 4.3. Calculated temperature and velocity fields in the vicinity of the HF inductor.

Fig. 4.5. From left to right: temperature, detailed views of temperature and velocity
fields at crystal surfaces, velocity magnitude, stream function isolines, viscosity ratio
µt /µ.

Fig. 4.5. The influence of additional crystal cooling by argon on the quasi-stationary
shape of phase boundaries. I is inductor current, HC is crystallization interface
deflection.
5. Three dimensional (3D) modeling of melt motion using FZSiFOAM
For the 3D modeling of the melt flow in the molten zone, the previously self
developed calculation program FZSiFOAM (which is based on the program library
OpenFOAM) was further developed. New and more precise boundary conditions
were implemented in the program for the dopant concentration field.
The calculated melt flow and concentration fields for a 4” silicon single crystal
growth system at the Institute for Crystal Growth (Berlin) are presented in the
following figures. Fig. 5.1 illustrates the preparation of the 3D geometry of silicon for
HF EM calculations. Fig. 5.2 shows a calculation setup on a Linux cluster. In Fig. 5.3
a schematic example of computational domain subdivision into 4 parts is given; each
part is solved separately on one processor. Fig. 5.4 shows calculated axis-symmetric
shape of phase boundaries and temperature field in melt. A schematic view of a
typical melt motion pattern in a FZ system is given in Fig. 5.5. In Fig. 5.6 a fragment
of used 3D finite volume mesh for melt domain (left)and a closer look at the boundary
layer at the crystallization interface (right) are shown. Fig. 5.7 shows the calculated
time-averaged temperature field and velocity field on the melt free surface. The
calculated time-averaged velocity field in the inductor main slit plane (top) and
perpendicular to it (bottom) is given in Fig. 5.8. In Fig. 5.9 the calculated
concentration field at the crystallization interface with instantaneous snapshot (left)
and time-averaged field (right) is shown. Fig. 5.10 represents the calculated radial
resistivity profiles.

Fig. 5.1 The preparation of the 3D geometry of silicon for HF EM calculations.
Fig. 5.2. Calculation setup on a Linux cluster.
Fig. 5.3. A schematic example of computational domain subdivision into 4 parts; each
part is solved separately on one processor.

Fig. 5.4. Calculated axis-symmetric shape of phase boundaries and temperature field
in melt.
Fig. 5.5. A schematic view of a typical melt motion pattern in a FZ system.
Fig. 5.6. Fragment of used 3D finite volume mesh for melt domain (left); a closer look
at the boundary layer at the crystallization interface (right).

Fig. 5.7. The calculated time-averaged temperature field and velocity field on the melt
free surface.
Fig. 5.8. The calculated time-averaged velocity field in the inductor main slit plane
(top) and perpendicular to it (bottom).

Fig. 5.9. The calculated concentration field at the crystallization interface; instant-
neous snapshot (left) and time-averaged field (right).
Fig. 5. 10. The calculated radial resistivity profiles in the grown crystal.
The results of activity were reported in the following international conferences as oral
or poster presentations:
1. 5th International Workshop on Crystal Growth Technology, Berlin, Germany,
June 26-30, 2010.
2. 6th
International Scientific Colloquium “Modelling for Material Processing”,
Riga, September 16-17, 2010.
3. “Deutsche Kristallzüchtungstagung 2012”, Freiberg, Germany, March 7-9,
2012.
4. “4th European Conference on Crystal Growth”, Glasgow, Scotland, June 17-
21, 2012.
5. “8.Workshop – Angewandte Simulation in der Kristallzuechtung”, Potsdam,
Germany, November 19-21, 2012.
6. Functional Materials and Nanotechnologies, Riga, April 2012.
Publications

1. A. Krauze, A. Muiznieks, K. Bergfelds, K. Janisels, G. Chikvaidze. Reduction of
silicon crust on the crucible walls in silicon melt purifying processes with electron beam
technology by means of low-frequency traveling magnetic fields.
Magnetohydrodynamics, 2011, Vol. 47, No. 4, 369-383.
2. A. Muiznieks, K. Lacis, A. Rudevics, U. Lacis, A. Sabanskis, M. Plate. Development
of numerical calculation of electromagnetic fields in FZ silicon crystal growth process.
Magnetohydrodynamics, 2010, Vol. 46, No. 4, 475-486.
3. K. Lacis, A. Muiznieks, A. Rudevics, A. Sabanskis. Influence of DC and AC
magnetic fields on melt motion in FZ large Si crystal growth. Magnetohydrodynamics,
2010, Vol. 46, No. 2, 199-218.
4. A. Krauze, N. Jekabsons, A. Muiznieks, A. Sabanskis, U. Lacis. Applicability of
LES turbulence modeling for CZ silicon crystal growth systems with traveling magnetic
field. Journal of Crystal Growth, 2010, Volume 312, Issue 21, 3225-3234.