mathematical modeling and design of layer crystallization
TRANSCRIPT

Mathematical Modeling and Design of Layer Crystallization ina Concentric Annulus With and Without Recirculation
Lifang Zhou, Min Su, Brahim Benyahia, Aniruddh Singh, Paul I. Barton, Bernhardt L. Trout,
Allan S. Myerson, and Richard D. BraatzDept. of Chemical Engineering, Massachusetts Institute of Technology, Cambridge, MA 02139
DOI 10.1002/aic.14049Published online March 1, 2013 in Wiley Online Library (wileyonlinelibrary.com)
A solution layer crystallization process in a concentric annulus is presented that removes the need for filtration. Adynamic model for layer crystallization with and without a recirculation loop is developed in the form of coupledpartial differential equations describing the effects of mass transfer, heat transfer, and crystallization kinetics. Themodel predicts the variation of the temperature, concentration, and dynamic crystal thickness along the pipe length,and the concentration and temperature along the pipe radius. The model predictions are shown to closely track ex-perimental data that were not used in the model’s construction, and also compared to an analytical solution thatcan be used for quickly obtaining rough estimates when there is no recirculation loop. The model can be used tooptimize product yield and crystal layer thickness uniformity, with constraints on the supersaturation to avoid bulknucleation by adjusting cooling temperatures in the core and jacket. VC 2013 American Institute of Chemical Engi-
neers AIChE J, 59: 1308–1321, 2013
Keywords: solution layer crystallization, crystal growth, distributed parameter systems, process modeling, design
Introduction
In pharmaceutical manufacturing, drug product is oftenseparated from a liquid phase by crystallization, washing,filtration, and drying—each of which reduce the overallproduct yield. The crystal habit and size from a crystalli-zation influence the porosity, cake resistance, and compres-sibility in the filter bed.1 Poorly filtering crystals canresult in bottlenecks in the downstream processing and canadd hours or even days to the process time, which cancause significant mother liquor holdup and affect crystalproduct purity or reduce yield due to additional washes.These observations have motivated efforts to design con-tinuous crystallization processes that are reliable for manu-facturing a product that meets purity, yield, shape, andsize requirements, and at the same time ensures efficientdownstream processing.
One way to avoid slurry handling is to constrain crystalgrowth to occur on fixed surfaces so that the amount of solidparticles in the bulk is minimized. Layer crystallization hasbeen characterized as being a process in which coherentcrystal layers grow on cooled surfaces of a speciallydesigned tube or plate heat exchanger.2,3 The crystallineproduct is removed by melting or dissolving crystals afterdraining the residual liquid. A primary advantage of layercrystallization is that there are no issues with regard to theaddition or removal of solids from the process. Layer crys-tallization from melts has been widely applied for the purifi-
cation of organics and inorganics such as sucrose and milk
fat, and in seawater desalination.4–7 Modeling of solid layer
melt crystallization has focused on the temperature and com-
position profiles inside the crystal layer,8–10 and multiple
stages of crystallizers can be designed to meet the required
product purity.11,12 For layer crystallization, the liquid phase
is always at a higher temperature than the solid phase, so
that in melts, the temperature is required to be higher than
the melting point, but layer crystallization from solutions can
be operated at much lower temperatures.13
This article presents a layer crystallization process froma solution in a concentric annulus that avoids the need forwashing, filtration, and drying (see Figure 1). Heterogene-ous nucleation occurs on a wire mesh in a seeding stage,and a solid crystal layer forms around the core cylinder ina growth stage. In this way, crystals are kept inside theannulus and only the mother liquor is flowing through thetube or recirculated through a pump. At the end of thecrystal growth stage, the mother liquor is completelyremoved from the annulus, and pure solvent is fed to dis-solve the crystal layer. This solution form is especiallyuseful during an intermediate crystallization used to cleanup the material before sending to a subsequent liquid-phase chemical reaction. In that case, the produce solventwill be used as a supply to the subsequent reaction. Thisconfiguration replaces washing, filtration, and drying witha much simpler and faster process of dissolution. The sol-vent can be recycled and reused.
Mass transport phenomena in the annulus can have a sig-nificant influence on the crystallization. To fully understandand optimize layer crystallization, both diffusive and convec-tive mass transfer rates are needed. Many past studies on
Correspondence concerning this article should be addressed to Richard D.Braatz at [email protected].
VC 2013 American Institute of Chemical Engineers
1308 AIChE JournalApril 2013 Vol. 59, No. 4

mass transfer in annular reactors have concentrated onobtaining correlations of dimensionless numbers for differentconfigurations and operating conditions.14–20 Another methodis to estimate mass transfer effects of building suitable nu-merical models that allow the prediction of the concentrationfields inside the crystallizer. Melt layer crystallization ofNaCl–H2O solution, which can be stationary or agitatedaround the wall of an internally cooled cylindrical tube, hasbeen simulated by Guardani et al.21 Duran et al.22 carriedout computational fluid dynamics simulations to predict masstransfer with different hydrodynamic models in annular reac-tors, with a constant concentration assumed at the solid–liq-uid surface. These models do not predict the effects ofconvective heat transfer and solid-layer growth on the con-centration distribution in the annulus. Note that heat transfereffects can strongly affect the temperature, which stronglyinfluences the solubility and the supersaturation that drivescrystal growth.
Similar to mass transfer, many researchers have investi-gated correlations for the Nusselt number to characterizeconvective heat transfer for a wide range of annular diameterratios and flow conditions, without providing information onthe temperature field in the annulus. Commonly, heat trans-fer in annuli is classified into three categories: (1) uniformheat flux or temperature at the inside wall and adiabatic atthe outside surface;23–26 (2) uniform heat flux or surfacetemperature at outside and adiabatic at the inside surface25;and (3) constant but different heat fluxes and temperatures atthe outside and inside surfaces.27–29 In this article, the tem-peratures of the inside and outside surfaces of the annulusare different from that of the solution, in which case thethermal asymmetry can lead to a discontinuity of the Nusseltnumber on one surface, depending on the Reynolds numberand fluid inlet temperature.28,29 Viskanta28 provided analyti-cal solutions in terms of series expansions by applying themethod of superposition to solve a Sturm–Liouville equation.Two simpler boundary conditions were combined, whichincluded the case of having a constant temperature of onewall combined with the other wall temperature equal to thefluid inlet temperature, but the solutions were not general.Mitrovic et al.29 investigated the effect of thermal asymme-
try and Reynolds number on the Nusselt number numericallyin fully developed laminar flow in an annulus with uniformbut different inside and outside surface temperatures. Gener-ally, the system is not amenable to the development of sim-ple heat transfer correlations due to the discontinuousNusselt number that can result from thermal asymmetry inthe thermal entrance region.28,29 In our case, the initial tem-perature at inlet and boundary conditions vary over time,and an accurate knowledge of the temperature field is impor-tant for predicting the solubility and the supersaturationneeded to predict growth rates. This article combines heattransfer and mass transfer models to (1) update the nonuni-form boundary temperature at the solid–liquid interface,which is affected by the local thickness of the crystal layer,and (2) calculate the temperature and concentration fields inthe annulus.
A cyclic process of layer crystallization would include theinitial nucleation of a crystal layer, followed by alternatingstages of crystal growth and dissolution. A continuous flowof drug product could be generated by employing multiplecyclic annular crystallizers in parallel. This article focuseson constructing a mathematical model to simulate the layercrystallization process in an annulus with and without arecirculation loop, which is focused on the growth stage asthis is the slowest crystal rate process during cyclic opera-tion. Mass and/or heat transfer models with solid-layergrowth on a cylindrical surface can be employed for manyother applications, such as fouling in heat exchangers,30 bio-films in petroleum pipelines,31 and melt layer crystallizationin a tank.8,32 However, to our knowledge this is the first arti-cle to thoroughly examine heat and mass transfer of a crys-tallization process with solid-layer growth in an annulus withand without recirculation. The numerical results are com-pared to first-order analytical solutions that are derived forthe layer crystallization without recirculation, and to experi-mental values to validate the model for a system withrecirculation.
Mathematical Model
Figure 2 shows a scheme of the arrangement for an inter-nally cooled tube surrounded by a liquid solution, sur-rounded by an external cooled jacket. A cooling fluid iscirculated in the inner core to control the temperature of astainless mesh that supplies nucleation sites and is wrappedon the external wall of the core tube. The outer jacket is cir-culated with another cooling liquid that is at a higher tem-perature to suppress bulk nucleation, so a temperaturegradient is formed in the middle space between inner coreand outer jacket. The supersaturated solution is fed into themiddle space between inner core and the jacket, and nucleiform and grow on the cooled stainless steel mesh. The radiusof the solid–liquid interface, rs, increases at a rate that iscontrolled by the mass transfer rate in the solution and onthe crystal surface.
The growth of the crystal layers moves the position of thesolid–liquid interface, in what is known in the literature as amoving boundary problem. The crystal growth rate is muchslower than changes in the velocity, concentration, or tem-perature fields, so quasi-steady thickness of the crystal layeris assumed.
The following assumptions are made for the mass andheat transfer in the system:
Figure 1. Schematic process flow diagram of the layercrystallization system.
A recirculation loop can be used, as shown, to reduce
mass transfer limitations so as to increase the crystal
growth rate. [Color figure can be viewed in the online
issue, which is available at wileyonlinelibrary.com.]
AIChE Journal April 2013 Vol. 59, No. 4 Published on behalf of the AIChE DOI 10.1002/aic 1309

1. Constant solute diffusion coefficient, and constant ther-mal conductivities and thermal diffusivities of fluid andall solid materials;
2. Quasi-steady thickness of crystal layer (quasi-steadyboundary);
3. Fully developed laminar flow in the annulus;4. Mass and thermal diffusion in the axial direction are
negligible;5. Natural convection and radiation effects are negligible;Assumption 3 is justified as the Reynolds number is much
less than the transition between laminar and turbulent flow(Re << 1000). Assumption 4 is justified because transportdue to convection is much larger than transport due to diffu-sive effects in the axial direction. Assumption 5 is justifiedfrom the dominance of forced over natural convection andthe relatively small range of temperatures.
Mass transfer (liquid phase) model
Under the above assumptions, as well as Fick’s diffusionlaw, the solute mass balance equation is
@C
@t1u rð Þ @C
@z5D
1
r
@
@rr@C
@r
� �; rs � r � r2i; 0 � z � L;
(1)
where C is the solute concentration, D is the molecular diffu-sion coefficient, z is axial distance, r is radial distance, u rð Þ isthe fluid velocity, and L is the total length of the annulus (thesubscripts on r are defined in Figure 2). The velocity field forfully developed laminar flow in an annulus is33
u rð Þ52�u12 r
r2i
� �2
2 12a2
ln a ln rr2i
� �11a21 12a2
ln a
; a5rs
r2i
; (2)
where �u is the average velocity. For layer crystallization inan annulus with recirculation, the solute concentration isdynamically changing, but for a system in quasi-steady state
without recirculation under constant feeding, the accumula-tion rate term @C=@t in Eq. 1 can be ignored.
For a system with recirculation, the solute concentration atthe entrance is the same as that from the exit, and the timedelay is not considered due to the small residence time in therecirculation loop. Two limiting conditions are considered: (1)no mixing occurs outside the annulus, so the concentration dis-tribution at the entrance is the same as that from the exit; (2)solute is fully mixed in radial direction through a peristalticpump, so the entering concentration is uniform and the value isthe same as the average concentration from the exit. For a sys-tem without recirculation, a solution with constant concentra-tion is fed into the annulus. The crystals are assumed to onlygrow on the outer surface of the core tube, where the mass fluxrate is proportional to the growth rate of the crystal layer, sothat the solution has the boundary conditions:
2D@C
@r
���r5rs
52ki Crs2Csatð Þn
2D@C
@r
���r5r2i
50
for an annulus with recirculation: ð3Þ�C r; z; 0ð Þ5C0
C r; 0; tð Þ5C r;L; tð Þor CBðL;tÞfor an annulus without recirculation: C r; z50ð Þ5C0
where ki is the integration rate to form crystal, Crsis the
concentration at the crystal layer surface, Csat is solubility,the exponent n is between 1 and 2, C0 is the initial soluteconcentration entering the annulus, and CB is the bulk-aver-age concentration at distance z, also called the mixing cupconcentration that is defined by
CB z; tð Þ5
ðr2i
rs
C r; z; tð Þu r; tð Þrdr
ðr2i
rs
u r; tð Þrdr
(4)
The solute mass flux j and mass-transfer coefficient kd atthe crystal-solution surface are determined from thedefinitions
Figure 2. Schematic diagram of the annulus systemwith layer crystallization.
Half of the system is shown with a mirror plane of sym-
metry at r 5 0. Red arrows show the direction of heat
flux at the start of the crystal growth. [Color figure can
be viewed in the online issue, which is available at
wileyonlinelibrary.com.]
Figure 3. Solute mass balance for a differentialelement in the axial direction.
[Color figure can be viewed in the online issue, which
is available at wileyonlinelibrary.com.]
1310 DOI 10.1002/aic Published on behalf of the AIChE April 2013 Vol. 59, No. 4 AIChE Journal

jrs52D
@C
@r
���r5rs
(5)
kd5jrs
Crs2CB
(6)
A combination of Eqs. 5 and 6 results in
kd52D
Crs2CB
@C
@r
���r5rs
(7)
The mass-transfer coefficient kd can be useful in character-izing the relative effects of the mass transfer limitation andthe concentration driving force on crystal growth.
Crystal growth (solid phase) model
The following assumptions are made for crystal growth:1. Growth occurs on the crystal surface, with no nuclea-
tion and growth in the bulk liquid;2. The void fraction in the crystal layer is zero.The local growth of the crystal layer is derived by the
mass balance on the solid:
dm
dt5ki Crs
2Csatð ÞnA (8)
where dm=dt is the rate in which solute mass is transportedover the area A52prs. The total crystal mass in a differentialelement Dz in the axial direction can be written as
m5qsp r2s 2r2
m
� Dz (9)
where qs is the density of the solid phase. The local growthrate can be expressed as
G5dddt
5drs
dt5
1
qsA
dm
dt(10)
where d5rs2rmis the thickness of the crystal layer. Equa-tions 3, 8, and 10 can be combined to give
dddt
5ki Crs
2Csatð Þn
qs
5D
qs
@C
@r
���rs
(11)
Heat transfer model
The latent heat of crystallization is assumed to be negligi-ble. The assumption is justified as mass transfer is muchslower than heat transfer in solution layer crystallization (thethermal diffusivity is much larger than the molecular diffusiv-ity). For example, in the particular application considered inthe manuscript, the heat flow associated with the latent heatof crystallization jqj5 qsHfus
Mdddt is less than 0.08% of the heat
flow of the solution in the annulus transferring to the innerwall due to cooling jqj5kl
@T@r , where the enthalpy of fusion
Hfus is 20.62 kJ/mol (this value was obtained by fitting to thevan’t Hoff equation, ln Csat 52Hfus =RT1constant , from sol-ubility data in Ref. 34), the molecular weight of solute Aliski-ren hemifumarate M 5 0.61 kg/mol, and kl is the thermalconductivity of the solution.
With the corresponding assumptions as for the mass balan-ces, the energy balance is
@T
@t1u rð Þ @T
@z5a
1
r
@
@rr@T
@r
� �; rs � r � r2i; 0 � z � L;
(12)
where T is the temperature, a is the thermal diffusivity, andu rð Þ is the fluid velocity. The heat generated during crystalli-zation is assumed to be negligible. Similarly, as for the massbalance (1), the accumulation rate term @T=@t can beneglected for quasi-steady temperature in an annulus withoutrecirculation, and this study considers the two extreme mix-ing conditions for the system with recirculation. The solutionsatisfies the boundary conditions:
2kl
@T
@r
���r5rs
5U1 Tc12Trsð Þ
2kl
@T
@r
���r5r2i
5U2 Tr2i2Tc2ð Þ
for an annulus with recirculation:�T r; z; 0ð Þ5T0
T r; 0; tð Þ5T r; L; tð Þ or TB L; tð Þfor an annulus without recirculation: T r; z50ð Þ5T0
where kl is the thermal conductivity of the solution, Tc1 andTc2 are the temperatures of the cooling liquid in the core cyl-inder and outer jacket, T0 is the temperature of solution atthe inlet, and U1 and U2 are the overall heat-transfer coeffi-cients calculated from
1
U1rs
51
hc1r1i
1ln r1o=r1ið Þ
kg
1ln rm=r1oð Þ
km
1ln rs=rmð Þ
ks
(14)
1
U2r2i
51
hc2r2o
1ln r2o=r2ið Þ
kg
(15)
where kg, km, and ks are the thermal conductivities ofthe glass, stainless steel mesh, and solid crystal, respec-tively, and hc1 and hc2 are the heat-transfer coefficientsof the cooling liquid in the core and the outer jacket,respectively. The derivations of U1 and U2 are in theAppendix. The local heat flux q, heat-transfer coefficienth, and Nusselt number Nu for the solution are deter-mined from the definitions
q52kl
@T
@r(16)
h152q
T2TB
���r5r1i
; h25q
T2TB
���r5rs
(17)
Nu 5hde
k(18)
de5d2i2ds (19)
where de is the equivalent diameter, and TB is the bulk-aver-age fluid temperature, also called the mixing cup tempera-ture. The bulk-average fluid temperature TB is obtained fromthe temperature profile T r; zð Þ by
TB z; tð Þ5
ðr2i
rs
T r; z; tð Þu r; tð Þrdr
ðr2i
rs
u r; tð Þrdr
(20)
AIChE Journal April 2013 Vol. 59, No. 4 Published on behalf of the AIChE DOI 10.1002/aic 1311

For the release of heat to the cooling liquids when Tc1 andTc2 are less than TB in the annulus, the Nusselt numbers atthe inside and outside walls will be both positive using thesedefinitions. Eqs. 16–18 can be solved to give
Nu 152kde
Trs2TB
@T
@r
����r5rs
; Nu 25kde
Tr2i2TB
@T
@r
����r5r2i
(21)
Analytical and Numerical Methods of Solutions ofthe Model Equations
Analytical solution for an annulus without recirculation
Solute mass balance. First-order analytical solutions forthe bulk-average concentration CB and crystal layer thicknesscan be derived with known mass transfer correlations withSherwood number. The mass flux at axial position z is:
ðr2i
rs
C r; z; tð Þu r; tð Þ2prdr5
ðr2i
rs
C r; z; tð Þu r; tð Þrdr
ðr2i
rs
u r; tð Þrdr
ðr2i
rs
u r; tð Þrdr
ðr2i
rs
rdr
3
ðr2i
rs
2prdr5CB z; tð Þ�u z; tð ÞA z; tð Þ (22)
In a control volume of the liquid phase, DV �p r2
2i2r2s
� Dz marked in a red box in Figure 3 and the solute
mass balance is:
CB z; tð Þ�u z; tð ÞA z; tð Þ2CB z1Dz; tð Þ�u z1Dz; tð ÞA z1Dz; tð Þ
2kd
1
Dz
ðz1Dz
z
CB2Cjintð Þ2prsdz
!Dz5
d
dt
ðz1Dz
z
CBAdz
0@
1A
0@
where Cjint is the concentration at the solid–liquid interfaceand A � p r2
2i2r2s
� is the cross-sectional area of the liquid
phase. Substituting A into Eq. 23, dividing by Dz and takingthe limit Dz! 0 yields
2@
@zCB �uð Þp r2
2i2r2s
� 2kd CB2C
��int
� �2prs5
DV
Dz
@CB
@t5p r2
2i2r2s
� @CB
@t
(24)
Dividing Eq. 24 by p r22i2r2
s
� and rearranging the terms
yields
@CB
@t1@
@zCB �uð Þ52kd CB2C
��int
� � 2rs
r22i2r2
s
(25)
The model is simplified by assuming that the thickness dof the crystal layer is small compared to r2i2rm, sors5rm1d � rm. Assuming the velocity �u is constant alongthe axial direction z yields
@CB
@t1�u
@CB
@z52kd CB2C
��int
� � 2rm
r22i2r2
m
(26)
The diffusion layer model (e.g., see Ref. 35) describescrystal growth in terms of two distinct steps: solute diffuses
through the boundary layer and is then incorporated into thecrystal (Figure 4). The rate of crystal mass can be equated tothe diffusion rate through the boundary layer that can bewritten as
dm
dt5kd CB2C
��int
� �A: (27)
In the control volume in Dz,
A52prsDz: (28)
The rate of solute integration into the crystal surface canbe expressed as
dm
dt5ki C
��int
2Csat
� �nA: (29)
If n51, then Eqs. 27 and 29 can be combined to eliminatethe interfacial concentration Cjint that is difficult to measure,yielding
dm
dt5
1
kd
11
ki
� �21
CB2Csatð ÞA (30)
By replacing the consumption term in Eq. 23 with Eq. 30and repeating the derivation, the solute mass balance can bewritten as
@CB
@t1�u
@CB
@z52
1
kd
11
ki
� �21
CB2Csatð Þ 2rm
r22i2r2
m
(31)
Using a similar derivation, setting n52 in Eq. 29 gives
dm
dt5
1
2ki=k2d
112ki
kd
DC2
ffiffiffiffiffiffiffiffiffiffiffiffiffiffiffiffiffiffiffiffi4ki
kd
DC11
r� �A; DC5CB2Csat
(32)
@CB
@t1�u
@CB
@z52
1
2ki=k2d
112ki
kd
DC2
ffiffiffiffiffiffiffiffiffiffiffiffiffiffiffiffiffiffiffiffi4ki
kd
DC11
r� �2rm
r22i2r2
m
(33)
Figure 4. Diffusion layer growth model.34
[Color figure can be viewed in the online issue, which is
available at wileyonlinelibrary.com.]
1312 DOI 10.1002/aic Published on behalf of the AIChE April 2013 Vol. 59, No. 4 AIChE Journal

Equation 31 can be simplified by defining the quantity
K : 521
kd
11
ki
� �212rm
r22i2r2
m
(34)
@CB
@t1�u
@CB
@z5K CB2Csatð Þ (35)
For quasi-steady fluid conditions, the accumulation term iszero but kd, ki, and Csat vary along the axial direction:
�udCB
dz5K zð Þ CB2Csat zð Þð Þ (36)
The analytical solution of this first-order ordinary differen-tial equation is
CB zð Þ5ðz0
2K zð ÞCsat ðzÞ�u
exp
2
ð z
0
K ~zð Þd~z
�u
0BB@
1CCAdz1C0
0BB@
1CCA
3 exp
ðz
0
K ~zð Þd~z
�u
0BB@
1CCA ð37Þ
Growth of the crystal layer. By substituting Eq. 30 intoEq. 10 gives
dddt
51
kd
11
ki
� �21 CB2Csat
qs
(38)
Combining Eq. 37 and 38 gives
dddt
51
kd
11
ki
� �21
3
ðz0
2K zð ÞCsat ðzÞ�u
exp
2
ð z
0
K ~zð Þd~z
�u
0BB@
1CCAdz1C0
0BB@
1CCAexp
ðz
0
K ~zð Þd~z
�u
0BB@
1CCA2Csat
qs
ð39Þ
The analytical solution of the thickness is
d tð Þ5 1
kd
11
ki
� �21
3
ðz0
2K zð ÞCsat ðzÞ�u
exp
2
ð z
0
K ~zð Þd~z
�u
0BB@
1CCAdz1C0
0BB@
1CCAexp
ðz
0
K ~zð Þd~z
�u
0BB@
1CCA2Csat
qs
3t1d0 (40)
Numerical solution for an annulus with and withoutrecirculation
The layer crystallization without recirculation was simu-lated using the pdepe solver in MATLAB
VR
R2011a by tak-ing 101 mesh points in the axial direction z and 101 mesh
points in the radial direction r. The method of lines wasapplied for the system with recirculation, that is, the spatialderivatives in the partial differential equations 1 and 12 werefirst approximated by finite differences. In particular, thefirst-order derivatives in z are replaced by two-point upwinddifferences and the derivatives in r were replaced by centraldifferences. Then the ode15s solver in MATLAB
VR
R2011awas employed to numerically solve the resulting time-de-pendent ordinary differential equations. The numerical solu-tions of the mass balance (1) and energy balance (12) wereobtained by taking 75 mesh points in each direction. Forupdating the moving boundary due to growth of the crystallayer, the time period was discretized into 200 grid cells,with finer time steps at the beginning.
A flow sheet for the numerical algorithm is in Figure 5. Thelower boundary rs in Eqs. 1 and 12 is time dependent, so theboundary moves as the crystal layer grows thicker. For quasi-steady thickness, the solid–liquid interface moves slowly andso can be accurately computed, at each time step, from a first-order temporal discretization of the solute mass balance Eq. 11:
dðz;tÞ5dðz; t2DtÞ1ðt1Dt
t
D
qs
@C
@r
����r5rs
dt (41)
Then the temperature and concentration fields are calcu-lated using the new thickness profile along the length of theannulus, and average thickness of the crystal layer is used toupdate the new velocity profile and new mass and heat trans-fer boundary conditions.
Experimental System and Parameters
A jacketed glass column with inner glass core wrapped ina wire mesh (see Figure 6) was applied for the crystallizationof Aliskiren hemifumarate (99.7% purity, provided byNovartis). The length of the annulus is 0.4 m, the inner ra-dius of core glass tube r1i is 0.0065 m, and the inner radiusof hollow jacketed cylinder r2i is 0.014 m. The thicknessesof the glass layer and stainless steel wire mesh are 2 and �1mm, respectively. A dilute solution of Aliskiren hemifuma-rate (initial concentration of 0.016 g solute/g total) in ethylacetate–ethanol mixture with a mass concentration ratio of95:5 at an initial temperature of 60�C was used as the fluidbetween the core and jacket wall. The cooling liquid in coreand jacket was a mixture of 70% ethylene glycol and 30%water in mass. The cooling temperature in core was 210�C,while the temperature in jacket was 20�C. The core tempera-ture was set lower than the jacket temperature in order toavoid bulk nucleation. The flow rate of cooling liquid was24 L/min, which is much higher than the flow rate of the so-lution (10 mL/min), so the temperature of the glass wall incontact with the cooling liquid can be regarded as constantalong the annulus.* The experiment included two separatesteps: seed generation in stationary solution and crystalgrowth with closed-loop circulation. Supersaturated Aliskirenhemifumarate solution for seed generation was fed into thecolumn and kept stationary for 30 h to create a crystal layer.The thickness of the crystal layer after seeding was 0.1 mmas calculated by mass balance from the measured
*For heat transfer in an annulus without recirculation, the temperature differencebetween the inlet and outlet core and jacket cooling flows is only 0.0225�C and0.0122�C, respectively. For heat transfer in an annulus with recirculation, the temper-ature difference is within 0.0001�C.
AIChE Journal April 2013 Vol. 59, No. 4 Published on behalf of the AIChE DOI 10.1002/aic 1313

concentration. Then the mother liquor for seeding wasdrained and the solution for growth was fed. A peristalticpump was used to produce required driving force for circula-tion in the crystallizer in growth stage. In experiments, sam-ples of solution were drawn at the outlet of the column, andfiltered with 0.22 mm syringe filter (Cole Parmer) to deter-mine the concentration with high-performance liquid chro-matography (Agilent 1200) and hence the yield.
The diffusion coefficient D for Aliskiren hemifumarate isestimated as 1 3 1029 m2/s using the Wilke–Chang method.36
The density of crystal solid is 1200 kg/m3, and the density ofthe ethyl acetate–ethanol mixture (95:5 in mass) is 894 kg/m3.The dynamic viscosity of the solution is 4.52 3 1022 Pa s, andthermal diffusivity of the solution is 7.9 3 1028 m2/s. Thethermal conductivities of glass kg, stainless mesh km, and solu-tion kl are 1.05, 16, and 0.137 W/m K, respectively. Becausethermal conductivities of small-molecule organic solid materi-als are in the range of 0.1273–0.3472 W/m K,37 and the crystalis immersed in the solvent, the thermal conductivity of theAliskiren hemifumarate solid crystal layer is estimated as thesame as the ethyl acetate–ethanol mixture, 0.137 W/m K. Asthe volumetric flow rate of the cooling liquid at 24 L/min isvery high relative to the solution flow rate, T1i and T2o can beassumed equal to Tc1 and Tc2, respectively.
The solubility of Aliskiren hemifumarate in 95:5 ethylacetate:ethanol solvent between 210 and 60�C was fit to theexperimental data in Ref. 34 using a piecewise cubic Her-mite interpolating polynomial. The growth rate expressionG(m/s) fit to experimental data under well-mixed conditionsfor this system in a past study34 is given by
G5dh
dt54:83331026exp 2
2935
R T1273ð Þ
� �Cjint 2Csat
Csat
� �1:08
:
(42)
This expression was fit to data collected over the samerange of supersaturation as in the solution layer crystalliza-
tion simulations. For the analytical solution, the mass-trans-fer coefficient kd was calculated first from its correlationswith the Sherwood number17–20 in Table 1.
The relationship between the average Sherwood numberand local Sherwood number is
Sh 5
ðL0
Shzdz
ðL0
dz
(48)
and the diffusion rate coefficient can be calculated from
kd5ShzD
de
(49)
Results and Discussion
Simulation results for an annulus without recirculation
The quasi-steady Aliskiren hemifumarate concentrationfield in the annulus without recirculation is shown in Figure7. Because the feed temperature (60�C) is much higher thanthe temperature at the solid–liquid interface, dissolutionoccurs near the inlet, resulting in a solute concentration peakin Figure 7. As the solution cools while flowing through theannulus, the growth of crystal layer on the core depletes theconcentration of solute in the solution.
Figure 6. Layer crystallization apparatus used in theexperiments.
[Color figure can be viewed in the online issue, which is
available at wileyonlinelibrary.com.]
Figure 7. Solute concentration field.
[Color figure can be viewed in the online issue, which is
available at wileyonlinelibrary.com.]
Figure 5. Numerical algorithm for solving the coupledpartial differential equations for layercrystallization.
1314 DOI 10.1002/aic Published on behalf of the AIChE April 2013 Vol. 59, No. 4 AIChE Journal

As it can be seen in the Figure 8, local numerically com-puted mass-transfer coefficients are within the ranges of thosecalculated from the correlations in Table 1, especially thosegenerated by fits to data by Ross et al.17 and Ould-Rouiset al.19 The decrease of the local mass-transfer coefficientsalong the axial direction is associated with the reduction of themagnitude of the derivative of the solute concentration withrespect to r at the core (rs50:0096) as seen in Figure 7.
To investigate heat transfer along the axial direction, Nus-selt numbers and the heat flux of the solution for the insidecore and outside jacket are plotted in Figures 9 and 10. Infi-nite Nu number in Figure 9 is caused by its definition: whenTB reaches the outside wall temperature Tw, the driving tem-perature difference Tw2TB used for the definition of h in Eq.17 becomes zero, whereas the actual wall heat flux@T=@rð Þr5r2i
is not zero. This observation28,29 for such sys-tems with a thermal asymmetry limits the usefulness of eval-uating heat flows in terms of plots of the Nusselt number.The heat flux calculated from the numerical solution of tem-perature is more useful for examining the heat transfer alongthe axial direction (Figure 10). Because the initial inlet solu-tion temperature is higher than both the cooling temperaturesin the core and in the jacket, the heat flows from the solutionto the jacket and core in opposite directions first. At theaxial position where the solution is cooled to the temperaturebetween the temperatures of the core and jacket, heat flowsfrom outside to inside, so then the heat flux for each side isnegative. At the end of the annulus, the heat transfer rateQ / qr is the same, which equals to 29:4 W=m for bothsides.
To derive the analytical solution, the exponent n in theintegration rate expression (29) was set to 1, so n 5 1 was
used in the numerical method for comparison. Similar to thecomparison of mass-transfer coefficients, numerical resultsof the solute concentration and crystal layer thickness vs.axial distance in Figure 11 are within the calculated valueswith mass-transfer coefficients from correlations of Rosset al.17 and Ould-Rouis et al.19 A higher mass-transfer coeffi-cient leads to faster depletion of solute concentration, andlarger crystal layer thickness. The numerical method has theadvantage of providing more insight into the analyzed sys-tem by providing the concentration field in the radial direc-tion, which is information that is not provided by theanalytical solution derived from mass transfer correlations.In addition, the numerical solution can be solved whenn 6¼ 1, which is not true for the analytical solution.
Simulation results for an annulus with recirculation
The solute concentration field at time t 5 3 min in theannulus with recirculation is shown in Figure 12 and thedynamic radial concentration profile at the exit in Figure 13.For these simulation results for layer crystallization withrecirculation, the solution in the recirculation loop is uni-formly mixed unless otherwise stated. Concentration gra-dients are initially large, with the solute concentration nearthe core much lower than at the outer jacket wall (see Figure13). These observations indicate that fluid-phase mass trans-fer resistance dominates under these conditions. The integra-tion rate of crystal growth has less effect on the bulk-average concentration profile, as the primary mass transferresistance in the fluid is diffusional.
The temperature field at time t 5 3 min in the annulus isshown in Figure 14, and dynamic radial temperature profilesat the exit in Figure 15. The radial exit temperature reachesa quasi-steady linear profile between the core and jacketwithin 3 min (see Figure 15). The time scale for heat
Table 1. Average Sherwood Number in Annuli with Laminar Flow
Hydrodynamic condition Source Correlation Condition Equation #
Fully developed 17 Sh 51:614 Re Sc ude=Lð Þ1=343
Developing 18 Sh 51:029Sc 1=3Re 0:55 de=Lð Þ0:47244
Developing 19 Sh 50:66Sc 1=3 Re ude=Lð Þ0:52 Z � 4231024 45
Sh 51:56Sc 1=3 Re ude=Lð Þ0:34 Z � 4231024 46
Developing 20 Sh 52:703 Re Sc ude=Lð Þ1=347
Figure 8. Numerical prediction of the local mass trans-fer coefficient vs. axial distance comparedwith values calculated from correlations.
[Color figure can be viewed in the online issue, which is
available at wileyonlinelibrary.com.]
Figure 9. Nusselt numbers vs. axial distance.
[Color figure can be viewed in the online issue, which is
available at wileyonlinelibrary.com.]
AIChE Journal April 2013 Vol. 59, No. 4 Published on behalf of the AIChE DOI 10.1002/aic 1315

conduction is sconduction � d2e=a55:23102s where de5d2i2ds
for the solution in an annulus, and the diffusion time scale issdiffusion � d2
e=D54:13104s. Comparison between the tem-perature and concentration profiles agrees with the time-scaleanalysis that heat transfer is much faster than mass transferin this system, and reaches quasi-steady conditions muchmore quickly. In Figure 15, the solution temperature near thecore and near the exit is higher than the temperature of cool-ing liquid 210�C, and the solution temperature near thejacket is lower than 20�C, due to the thermal resistance ofthe crystal layer, glass, and convection of the coolingliquids.
The shape of the solubility field in Figure 16 has qualita-tive similarities to the temperature field in Figure 14 as thesolubility is higher where the temperature is higher. Becausethe reported solubility curve of Aliskiren hemifumarate ishighly nonlinear,34 this nonlinearity is reflected on the solu-bility field in the radial direction in Figure 17. For fixed val-ues of the axial position, an intermediate peak in the
supersaturation is observed (see Figure 17), which resultsfrom different gradients of the reduction of solute concentra-tion due to the integration of solute at the solid–liquid sur-face close to the core cylinder in Figure 12 and the increasein solubility close to the jacket with higher temperature inFigure 16.
Model validation
To evaluate the predictive capability of the model, simu-lated dynamic bulk-average exit solute concentrations withdifferent assumed mixing conditions for the recirculationloop are compared to experimental values in Figure 18,where all of the parameters in the simulations were takenfrom the references, with no parameters fitted to the experi-mental concentrations in this study. The solute concentrationinitially decreases faster due to a higher driving force for dif-fusion and integration. Increased mixing in the recirculationloop increases the reduction in the solute concentration andresults in a shorter time in depletion of the solute in solution.The experimental values in the first 10 h are between the
Figure 10. Heat flux vs. axial distance.
[Color figure can be viewed in the online issue, which
is available at wileyonlinelibrary.com.]
Figure 11. Numerical predictions of the concentrationand crystal layer thickness vs. axial dis-tance at time t 5 1 min are within the rangesgiven by analytical solutions calculatedfrom correlations.
[Color figure can be viewed in the online issue, which
is available at wileyonlinelibrary.com.]
Figure 12. Solute concentration field at time t 5 3 min,with uniform mixing in the recirculationloop.
[Color figure can be viewed in the online issue, which
is available at wileyonlinelibrary.com.]
Figure 13. Dynamic radial exit concentration profiles,with uniform mixing in the recirculationloop.
[Color figure can be viewed in the online issue, which
is available at wileyonlinelibrary.com.]
1316 DOI 10.1002/aic Published on behalf of the AIChE April 2013 Vol. 59, No. 4 AIChE Journal

simulated concentrations for the two extreme mixing limits,suggesting that the mixing in the recirculation loop in realityis between uniform radial mixing and nonmixing, which isconsistent with expectation from the experimental setup. Af-ter 10 h, the exit solute concentration has dropped from itsinitially high value to almost reach solubility for the quasi-steady temperature, with the remaining low supersaturationresulting in very slow growth of crystal layer and slowdepletion of solute concentration.
The two sets of simulations and experiments as presentedin Figure 18 have different initial solute concentrations(0.016 and 0.020 g solute/g total) and different temperaturevalues for the cooling liquid in the jacket (20 and 30�C),with Set 2 having a higher final concentration than Set 1.The exit solute concentration is very weak function of thejacket cooling temperature, because its value is mostly speci-fied by the solubility on the crystal surface at the end of thecore tube, which depends on the local temperature. Thesomewhat higher exit concentration of Set 2 is associatedwith the higher temperature of the surface of the crystallayer at the exit, which is mainly due to having a larger ther-
mal resistance from a thicker crystal layer resulting from thehigher initial concentration.†
As it can be seen in Figure 18, the predicted concentrationagrees with the experiments; however, the model to someextent overestimates the yield at the end of the two sets ofexperiments. Possible reasons are: (1) the solubility used inthe model is lower than the experimental solubility; (2) thecalculated thermal resistance is smaller than the experimentalthermal resistance due to uncertainty in the thermal conduc-tivity of the crystal layer, or (3) solvent inclusions in thecrystal layer result in a thicker crystal layer with higher ther-mal resistance, thus higher surface temperature on the crystalsurface.
Model predictions for different operating conditions
To study the influence of the temperature Tc1 of the cool-ing liquid in the hollow core cylinder, its value was variedbetween 210 and 5�C. Figure 19 shows the model predic-tions for the crystal yield in the annulus with recirculation.The yield is improved by decreasing the core cooling liquidtemperature, but the effect is not linear. The lowest values ofthe temperature at the surface of the crystal layer are 26.77,22.31, 2.15, and 6.61�C for the Tc1 of 210, 25, 0, and5�C, respectively, with the differences between the two tem-peratures due to the thermal resistance of glass, wire mesh,and crystal layers with different values of thickness. Thenonlinearity of the yield is mostly due to the nonlinearity inthe solubility curve34 from 26.77 to 6.61�C.
Figure 20 shows that higher solution flow rate results in afaster increase of yield if there is mixing in the recirculationloop, but does not significantly affect the yield for this rangeof flow rates when no mixing occurs in the recirculationloop. When there is mixing in the recirculation loop, highersolution flow rate increases the circulation times by reducingthe residence time in each pass of the flow in the annulus,thus accelerating mass transfer in the annulus, and causing afaster increase of the crystal yield.
Figure 21 shows the temporal variation in the crystal layerthickness along the annulus direction with and without mix-ing in the recirculation loop. As expected, the growth rate of
Figure 14. Temperature field at time t 5 3 min, with uni-form mixing in the recirculation loop.
[Color figure can be viewed in the online issue, which
is available at wileyonlinelibrary.com.]
Figure 15. Dynamic radial exit temperature profiles,with uniform mixing in the recirculationloop.
[Color figure can be viewed in the online issue, which
is available at wileyonlinelibrary.com.]
Figure 16. Saturated solute concentration field at t 5 3min, with uniform mixing in the recirculationloop.
[Color figure can be viewed in the online issue, which
is available at wileyonlinelibrary.com.]
†A prerequisite for this and other conclusions is that the solute concentration in thewhole annulus is below the metastable limit; which was true for these experimentalconditions as no crystal solids were observed other than at the crystal layer.
AIChE Journal April 2013 Vol. 59, No. 4 Published on behalf of the AIChE DOI 10.1002/aic 1317

the crystal layer is initially relatively fast, and monotonicallydecreasing with time. No visible difference can be observedfrom the spatially averaged crystal layer thickness at 10 and30 h, which is consistent with the dynamic profiles of the so-lution concentration vs. axial position (Figure 18). The crys-tal layer thickness is much more spatially uniform whenthere is no mixing in the recirculation loop (compare Figures21a, b). For uniform mixing in the recirculation loop, thecrystal layer becomes much thicker close to the inlet than atother positions, which is associated with higher supersatura-tion near the crystal layer near the inlet of the annulus. Thenonmonotonic thickness of the crystal layer is similar to thevariation of growth rate on a flat crystal face and dendriticcrystals in melt crystallization where higher supercoolingleads to faster growth as heat transfer dominates.38,39 Spatial
nonuniformity of the crystal layer thickness increased andthen decreased over time (see Figure 21b), the thicknessnear the inlet decreased between 10 and 30 h. At those
Figure 18. Comparison of the simulated exit concentra-tions for two different mixing conditionswith experimental data vs. time for the totalcrystallization time of 30 h.
The conditions for Set 1 of simulations and experiments
are C050:016 g solute =g total and Tc2 5 20�C and
Set 2 were C050:020 g solute =g total and
Tc2 5 30�C. The other conditions are the same as
described in the Experimental System and Parameters
section. [Color figure can be viewed in the online issue,
which is available at wileyonlinelibrary.com.]
Figure 19. Model predictions for different values of Tc1,with uniform mixing in the recirculationloop.
[Color figure can be viewed in the online issue, which
is available at wileyonlinelibrary.com.]
Figure 20. Temporal variation in the yield for differentvalues of the solution flow rates.
(a) no mixing in the recirculation loop and (b) uniform
mixing in the recirculation loop. [Color figure can be
viewed in the online issue, which is available at
wileyonlinelibrary.com.]
Figure 17. Absolute supersaturation field at t 5 3 min,with uniform mixing in the recirculationloop.
[Color figure can be viewed in the online issue, which
is available at wileyonlinelibrary.com.]
1318 DOI 10.1002/aic Published on behalf of the AIChE April 2013 Vol. 59, No. 4 AIChE Journal
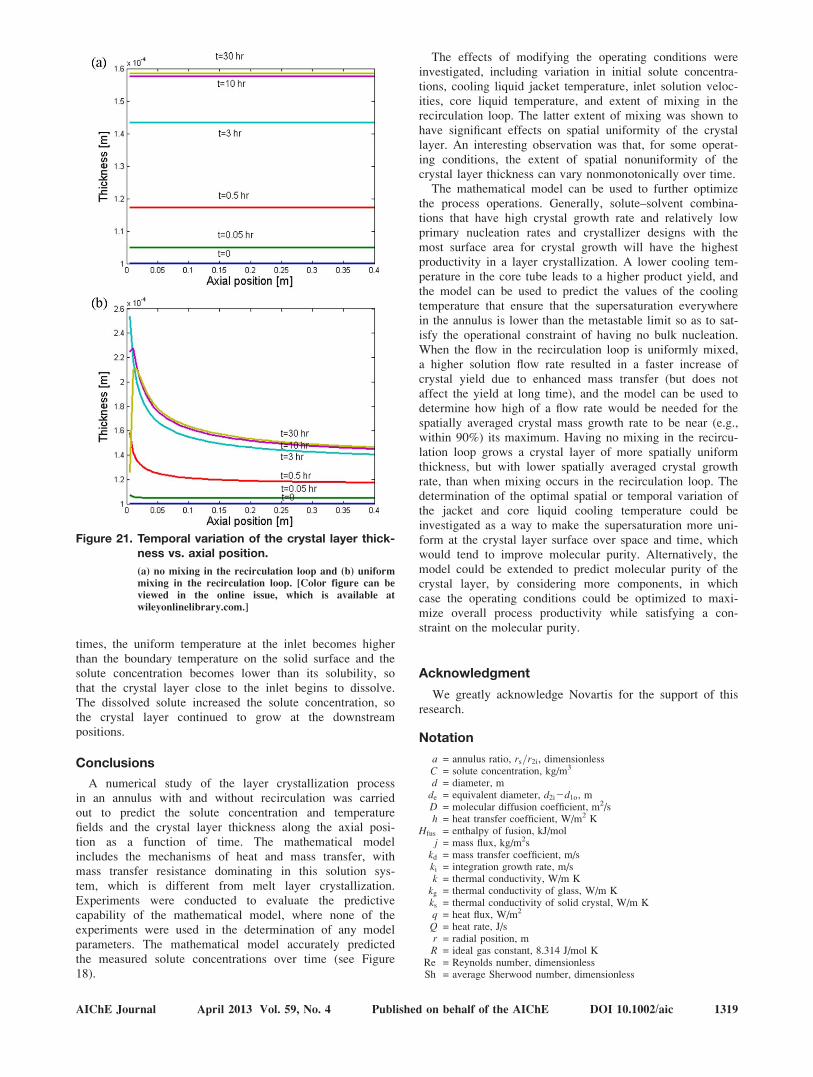
times, the uniform temperature at the inlet becomes higherthan the boundary temperature on the solid surface and thesolute concentration becomes lower than its solubility, sothat the crystal layer close to the inlet begins to dissolve.The dissolved solute increased the solute concentration, sothe crystal layer continued to grow at the downstreampositions.
Conclusions
A numerical study of the layer crystallization processin an annulus with and without recirculation was carriedout to predict the solute concentration and temperaturefields and the crystal layer thickness along the axial posi-tion as a function of time. The mathematical modelincludes the mechanisms of heat and mass transfer, withmass transfer resistance dominating in this solution sys-tem, which is different from melt layer crystallization.Experiments were conducted to evaluate the predictivecapability of the mathematical model, where none of theexperiments were used in the determination of any modelparameters. The mathematical model accurately predictedthe measured solute concentrations over time (see Figure18).
The effects of modifying the operating conditions wereinvestigated, including variation in initial solute concentra-tions, cooling liquid jacket temperature, inlet solution veloc-ities, core liquid temperature, and extent of mixing in therecirculation loop. The latter extent of mixing was shown tohave significant effects on spatial uniformity of the crystallayer. An interesting observation was that, for some operat-ing conditions, the extent of spatial nonuniformity of thecrystal layer thickness can vary nonmonotonically over time.
The mathematical model can be used to further optimizethe process operations. Generally, solute–solvent combina-tions that have high crystal growth rate and relatively lowprimary nucleation rates and crystallizer designs with themost surface area for crystal growth will have the highestproductivity in a layer crystallization. A lower cooling tem-perature in the core tube leads to a higher product yield, andthe model can be used to predict the values of the coolingtemperature that ensure that the supersaturation everywherein the annulus is lower than the metastable limit so as to sat-isfy the operational constraint of having no bulk nucleation.When the flow in the recirculation loop is uniformly mixed,a higher solution flow rate resulted in a faster increase ofcrystal yield due to enhanced mass transfer (but does notaffect the yield at long time), and the model can be used todetermine how high of a flow rate would be needed for thespatially averaged crystal mass growth rate to be near (e.g.,within 90%) its maximum. Having no mixing in the recircu-lation loop grows a crystal layer of more spatially uniformthickness, but with lower spatially averaged crystal growthrate, than when mixing occurs in the recirculation loop. Thedetermination of the optimal spatial or temporal variation ofthe jacket and core liquid cooling temperature could beinvestigated as a way to make the supersaturation more uni-form at the crystal layer surface over space and time, whichwould tend to improve molecular purity. Alternatively, themodel could be extended to predict molecular purity of thecrystal layer, by considering more components, in whichcase the operating conditions could be optimized to maxi-mize overall process productivity while satisfying a con-straint on the molecular purity.
Acknowledgment
We greatly acknowledge Novartis for the support of thisresearch.
Notation
a = annulus ratio, rs=r2i, dimensionlessC = solute concentration, kg/m3
d = diameter, mde = equivalent diameter, d2i2d1o, mD = molecular diffusion coefficient, m2/sh = heat transfer coefficient, W/m2 K
Hfus = enthalpy of fusion, kJ/molj = mass flux, kg/m2s
kd = mass transfer coefficient, m/ski = integration growth rate, m/sk = thermal conductivity, W/m K
kg = thermal conductivity of glass, W/m Kks = thermal conductivity of solid crystal, W/m Kq = heat flux, W/m2
Q = heat rate, J/sr = radial position, mR = ideal gas constant, 8.314 J/mol K
Re = Reynolds number, dimensionlessSh = average Sherwood number, dimensionless
Figure 21. Temporal variation of the crystal layer thick-ness vs. axial position.
(a) no mixing in the recirculation loop and (b) uniform
mixing in the recirculation loop. [Color figure can be
viewed in the online issue, which is available at
wileyonlinelibrary.com.]
AIChE Journal April 2013 Vol. 59, No. 4 Published on behalf of the AIChE DOI 10.1002/aic 1319

Shz = local Sherwood number, dimensionlessT = temperature, �Cu = velocity, m/s�u = average velocity, m/sU = overall heat transfer coefficient, W/m2 Kz = axial position, mZ = non-dimensional axial position, 4z 12að Þ= Re d2ið Þ
Greek letters
a = thermal diffusivity, m2/sd = thickness of crystal layer, ml = dynamic viscosity, Pa sq = density, g/cm3
u = function defined as 12að Þ=a½ � 1=21 a2= 12a2ð Þð Þ½ln 1=að Þ�= 11a2ð Þ= 12a2ð Þð Þln a11½ �
Subscripts
0 = initial condition1 = inner glass layer of an annulus (the glass layer between the cool-
ant in the core tube and solution)2 = middle glass layer of an annulus (the glass layer between the solu-
tion and the coolant in the jacket)3 = outer glass layer of an annulusB = bulk liquid mixing
c1 = cooling liquid in corec2 = cooling liquid in jacketg = glassi = inner sidel = liquid phase
m = stainless steel mesho = outer sides = solid phase
sat = saturation conditionw = at wall
Literature Cited
1. Beck R, H€akkinen A, Malthe-S�renssen D, Andreassen J-P. Theeffect of crystallization conditions, crystal morphology and size onpressure filtration of L-glutamic acid and an aromatic amine. SepPurif Technol. 2009;66(3):549–558.
2. Glade H, Ulrich J. Melt Crystallization: Fundamentals, Equipmentand Applications. Aachen, Germany: Shaker; 2003.
3. Ulrich J, B€ulau HC. 7—Melt crystallization. In: Myerson AS, editor.Handbook of Industrial Crystallization, 2nd ed. Woburn: Butter-worth-Heinemann, 2002:161–179.
4. Parisi M, Chianese A. The crystal layer growth from a well-mixedmelt. Chem Eng Sci. 2001;56(14):4245–4256.
5. Rich A, Mandri Y, Mangin D, Rivoire A, Abderafi S, Bebon C,Semlali N, Klein J-P, Bounahmidi T, Bouhaouss A, Veesler S. Seawater desalination by dynamic layer melt crystallization: parametricstudy of the freezing and sweating steps. J Cryst Growth.2012;342(1):110–116.
6. Flesland O. Freeze concentration by layer crystallization. DryingTechnol. 1995;13(8–9):1713–1739.
7. Peters-Erjawetz S, Ulrich J, Tiedtke M, Hartel R. Milk fat fractiona-tion by solid-layer melt crystallization. J Am Oil Chem Soc.1999;76(5):579–584.
8. Guardani R, Neiro SMS, B€ulau H, Ulrich J. Experimental compari-son and simulation of static and dynamic solid layer melt crystalliza-tion. Chem Eng Sci. 2001;56(7):2371–2379.
9. Fukui K, Maeda K. Direct numerical simulation of solid-layer crys-tallization from binary melt. J Cryst Growth. 2002;235(1–4):633–639.
10. Dai W, Feng Z, Nassar R, Palmer J. A combined analytic and nu-merical method for predicting the solid-layer growth from melt crys-tallization. Numer Heat Transfer, Part A: Appl. 2003;44(6):577–590.
11. Ossipov P. Optimization of heat–mass transfer at continuous solid layercrystallization on a belt. Appl Math Modell. 1999;23(5):419–436.
12. Wallert C, Marquardt W, Leu JT, Strube J. Design and optimizationof layer crystallization processes. In: Luis P, Antonio E, editors. Com-puter Aided Chemical Engineering, Vol. 20. Oxford, UK: Elsevier,2005:871–876.
13. Aumock NM. A Process for Separation by Semi-Continuous Coun-ter-Current Crystallization. Cambridge, MA: Department of Chemi-cal Engineering, Massachusetts Institute of Technology, 2011.
14. Rai BN, Sinha AK, Ghosh UK, Gupta SN, Upadhyay SN. Forcedconvective mass transfer in annuli. Chem Eng Commun.1988;68(1):15–30.
15. Turitto VT. Mass transfer in annuli under conditions of laminarflow. Chem Eng Sci. 1975;30(5–6):503–509.
16. Houzelot J-L, Villermaux J. Mass transfer in annular cylindricalreactors in laminar flow. Chem Eng Sci. 1977;32(12):1465–1470.
17. Ross TK, Wragg AA. Electrochemical mass transfer studies inannuli. Electrochim Acta. 1965;10(11):1093–1106.
18. Mobarak AA, Farag HA, H.Sedahmed G. Mass transfer in smoothand rough annular ducts under developing flow conditions. J ApplElectrochem. 1997;27(2):201–207.
19. Ould-Rouis M, Salem A, Legrand J, Nouar C. Etude num�erique etexp�erimentale des transferts de matiere et de quantit�e de mouvementdans un �ecoulement annulaire laminaire non �etabli. Int J Heat MassTransfer. 1995;38(6):953–967.
20. Ghosh UK, Upadhyay SN. Mass transfer to newtonian and non-new-tonian fluids in short annuli. AIChE J. 1985;31(10):1721–1724.
21. Guardani R, Belline A. Application of mathematical modelling in atwo-component layer crystallisation process. Chem Eng Technol.1997;20(7):495–501.
22. Esteban Duran J, Taghipour F, Mohseni M. CFD modeling of masstransfer in annular reactors. Int J Heat Mass Transfer. 2009;52(23–24):5390–5401.
23. Dirker J, Meyer JP. Heat transfer coefficients in concentric annuli. JHeat Transfer. 2002;124(6):1200–1203.
24. Dirker J, Meyer JP. Convective heat transfer coefficients in concen-tric annuli. Heat Transfer Eng. 2005;26(2):38–44.
25. Batra RL, Sudarsan VR. Laminar flow heat transfer in the entranceregion of concentric annuli for power law fluids. Comput MethodAppl Mech Eng. 1992;95(1):1–16.
26. Hatton AP, Quarmby A. Heat transfer in the thermal entry lengthwith laminar flow in an annulus. Int J Heat Mass Transfer.1962;5(10):973–980.
27. Malon A, Muller T. A short method to compute Nusselt numbers inrectangular and annular channels with any ratio of constant heatrate. J Eng Gas Turbines Power. 2012;134(3):032902.
28. Viskanta R. Heat transfer with laminar flow in a concentric annuluswith prescribed wall temperatures. Appl Sci Res. 1964;12(6):463–476.
29. Mitrovic J, Maletic B. Effect of thermal asymmetry on heat transferin a laminar annular flow. Chem Eng Technol. 2005;28(10):1144–1150.
30. Kirkpatrick JP, McIntire LV, Characklis WG. Mass and heat transferin a circular tube with biofouling. Water Res. 1980;14(2):117–127.
31. Al-Darbi MM, Agha KQ, Islam MR. Estimation of the substrateconcentration profiles in petroleum pipelines containing biofilms. PetSci Technol. 2006;24(11):1249–1265.
32. Chianese A, Santilli N. Modelling of the solid layer growth frommelt crystallization—the integral formulation approach. Chem EngSci. 1998;53(1):107–111.
33. Bird RB, Stewart WE, Lightfoot EN. Transport Phenomena, 2nd ed.New York: John Wiley & Sons; 2007.
34. Quon JL, Zhang H, Alvarez A, Evans J, Myerson AS, Trout BL.Continuous crystallization of Aliskiren hemifumarate. Cryst GrowthDes. 2012;12(6):3066–3044.
35. N�yvlt J. Nucleation and growth rate in mass crystallization. ProgCryst Growth Characterization. 1984;9(3–4):335–370.
36. Wilke CR, Chang P. Correlation of diffusion coefficients in dilutesolutions. AIChE J. 1955;1(2):264–270.
37. Lin Y, Shi Z, Wildfong PLD. Thermal conductivity measurementsfor small molecule organic solid materials using modulated differen-tial scanning calorimetry (MDSC) and data corrections for sampleporosity. J Pharm Biomed Anal. 2010;51(4):979–984.
38. Glicksman M, Schaefer R, Ayers J. Dendritic growth-A test oftheory. Metall Mater Trans A. 1976;7(11):1747–1759.
39. Brown RA. Theory of transport processes in single crystal growthfrom the melt. AIChE J. 1988;34(6):881–911.
40. Bergman TL, Lavine AS, Incropera FP, DeWitt DP. Fundamentalsof Heat and Mass Transfer. Hoboken, NJ: John Wiley & Sons,2011.
1320 DOI 10.1002/aic Published on behalf of the AIChE April 2013 Vol. 59, No. 4 AIChE Journal

Appendix
For the temperature inside and near the core tube, a heattransfer equation can be written for each of the four regions(core tube interior, core tube glass wall, crystal layer, andsolution at solid–liquid interface) as shown in the left redbox in Figure 2. The steady-state heat conduction equationsfor the glass wall, stainless steel mesh, and crystal layer aregiven by40
Q5Qg5kg2pL
ln r1o=r1ið Þ T1i2T1oð Þ; (A1)
Q5Qm5km2pL
ln rm=r1oð Þ T1o2Tmð Þ; (A2)
Q5Qs5ks2pL
ln rs=rmð Þ Tm2Tsð Þ: (A3)
The convection equations for heat transfer at the core tubeinterior and solid–liquid interface are
Q5Qc15hc12pr1iL Tc12T1ið Þ; (A4)
Q5Q15qA52kl2prsL@T
@rjr5rs
: (A5)
Eliminating the temperatures in Eqs. A1 to A4 and solvingfor Q yields
Q1
hc12pr1iL1
ln r1o=r1ið Þkg2pL
1ln rm=r1oð Þ
km2pL1
ln rs=rmð Þks2pL
� �5Tc12Ts:
(A6)
Eliminating the Q in Eqs. A5 and A6 yields
2kl2prsLdT
dr
���r5rs
51
1hc12pr1iL
1ln r1o=r1ið Þ
kg2pL 1ln rm=r1oð Þ
km2pL 1ln rs=rmð Þ
ks2pL
Tc12Tsð Þ:
(A7)
The heat flux is
q52kl
dT
dr
���r5rs
51
1hc12pr1iL
1ln r1o=r1ið Þ
kg2pL 1ln rm=r1oð Þ
km2pL 1ln rs=rmð Þ
ks2pL
� �2prsL
Tc12Tsð Þ: (A8)
Thus,
2kl
@T
@r
���r5rs
5U1 Tc12Tsð Þ1
U1rs
51
hc1r1i
1ln r1o=r1ið Þ
kg
1ln rm=r1oð Þ
km
1ln rs=rmð Þ
ks
(A9)
The derivation of U2 is similar.
Manuscript received Sept. 29, 2012, and revision received Jan. 9, 2013.
AIChE Journal April 2013 Vol. 59, No. 4 Published on behalf of the AIChE DOI 10.1002/aic 1321