mathematical model of adult stem cell regeneration with...
TRANSCRIPT
Mathematical model of adult stem cell regenerationwith cross-talk between genetic andepigenetic regulationJinzhi Leia, Simon A. Levinb,1, and Qing Niec
aZhou Pei-Yuan Center for Applied Mathematics, Ministry of Education Key Laboratory of Bioinformatics, Tsinghua University, Beijing 100084, China;bDepartment of Ecology and Evolutionary Biology, Princeton University, Princeton, NJ 08544; and cDepartment of Mathematics, University of California,Irvine, CA 92697
Contributed by Simon A. Levin, January 7, 2014 (sent for review September 4, 2013)
Adult stem cells, which exist throughout the body, multiply by celldivision to replenish dying cells or to promote regeneration to repairdamaged tissues. To perform these functions during the lifetime oforgans or tissues, stem cells need to maintain their populations ina faithful distribution of their epigenetic states, which are suscepti-ble to stochastic fluctuations during each cell division, unexpectedinjury, and potential genetic mutations that occur during many celldivisions. However, it remains unclear how the three processes ofdifferentiation, proliferation, and apoptosis in regulating stem cellscollectively manage these challenging tasks. Here, without consid-ering molecular details, we propose a genetic optimal control modelfor adult stem cell regeneration that includes the three fundamentalprocesses, along with cell division and adaptation based on differ-ential fitnesses of phenotypes. In the model, stem cells with a distri-bution of epigenetic states are required to maximize expectedperformance after each cell division. We show that heteroge-neous proliferation that depends on the epigenetic states of stemcells can improve the maintenance of stem cell distributions tocreate balanced populations. A control strategy during each celldivision leads to a feedback mechanism involving heterogeneousproliferation that can accelerate regeneration with less fluctuationin the stem cell population. When mutation is allowed, apoptosisevolves to maximize the performance during homeostasis aftermultiple cell divisions. The overall results highlight the importanceof cross-talk between genetic and epigenetic regulation and theperformance objectives during homeostasis in shaping a desirableheterogeneous distribution of stem cells in epigenetic states.
fitness function | optimization | robustness | dynamic programming |systems biology
Adult stem cells are present in most self-renewing tissues, in-cluding skin, intestinal epithelium, and hematopoietic systems.
Stem cells provide regeneration through proliferation, differentia-tion, and apoptosis; therefore, the accumulation of undesirableepigenetic changes, which are independent of the genetic instruc-tions but heritable at each cell division, can lead to the causation orprogression of diseases (1, 2). Epigenetic effects such as the sto-chastic partitioning of the distribution of regulatory moleculesduring cell division may change the capability of the cell to undergodifferentiation or proliferation (3), and the accumulation of DNAerrors (or damages) can result in carcinogenesis (4–6).Many stem cells are heterogeneous in their ability to proliferate,
self-renew, and differentiate, and they can reversibly switch be-tween different subtypes under stress conditions. Specifically, he-matopoietic stem cells (HSCs) (see ref. 7 for a review of HSCheterogeneity) have distinguished subtypes (such as lymphoid de-ficient, balanced, or myeloid deficient) whose distribution dependson their heterogeneity during the differentiation process (7, 8).HSCs can reversibly acquire at least three proliferative states: adormant state in which the cells are maintained in the quiescentstage of the cell cycle, a homeostatic state in which the cells areoccasionally cycling, and an injury-activated state in which the cells
are continuously cycling (9, 10). Each state is likely associated witha unique microenvironment (10, 11). Dormant and homeostaticHSCs are anchored in endosteal niches through interactions witha number of adhesion molecules expressed by both HSCs andniche stromal cells (10, 12). Furthermore, injury-activated HSCsare located near sinusoidal vessels (the perivascular niche). Inresponse to the loss of hematopoietic cells, surviving dormantHSCs located in their niches develop into injury-activated HSCsto undergo self-renewing divisions. In the recovery stage, injury-activated HSCs either differentiate into multipotential pro-genitor cells or migrate to their osteoblastic niches to reestablishthe dormant and homeostatic HSC pools (10, 13).The growth and regeneration of many adult stem cell pools are
tightly controlled with feedback regulation at different levels. Forexample, HSC self-renewal and differentiation are regulated bydirect HSC–niche interactions and cytokines secreted from stro-mal cells through various feedback signals (9–11). Adult intestinalstem cells residing in a niche in the crypt are regulated by theparacrine secretion of growth factors and cytokines from sur-rounding mesenchymal cells (14–16). In addition, the mammalianolfactory epithelium, a self-renewing neural tissue, is regulatedthrough negative feedback signals involving the diffusive mole-cules GDF11 and activin (17).Independent of division modes, symmetric or asymmetric cell
divisions may lead to daughter cells with genetic or epigeneticstates different from the normal states. The enormous functionaldemands and longevity of stem cells suggest that stem cells, par-
Significance
This paper examines how adult stem cells maintain their abilityto carry out a complex set of tasks, including tissue regenerationand replacement of defective cells. To do so, stem cell pop-ulations must coordinate differentiation, proliferation, andcell death (apoptosis) to maintain an appropriate distributionof epigenetic states. Using the tools of applied mathematics,and borrowing from the theory of intergenerational transferof resources, this paper shows how control strategies duringcell division should be chosen to maximize expected perfor-mance, utilizing cross-talk between genetic and epigeneticregulation and performance criteria during homeostasis. Het-erogeneous proliferation, a mixed strategy in which not allcells have the same proliferation probability, is shown to in-crease robustness, and hence long-term performance.
Author contributions: J.L., S.A.L., and Q.N. designed research; J.L. and Q.N. performedresearch; J.L., S.A.L., and Q.N. contributed new reagents/analytic tools; J.L. and Q.N. an-alyzed data; and J.L., S.A.L., and Q.N. wrote the paper.
The authors declare no conflict of interest.
See Commentary on page 3653.1To whom correspondence should be addressed. E-mail: [email protected].
This article contains supporting information online at www.pnas.org/lookup/suppl/doi:10.1073/pnas.1324267111/-/DCSupplemental.
E880–E887 | PNAS | Published online February 5, 2014 www.pnas.org/cgi/doi/10.1073/pnas.1324267111
ticularly the cells from highly regenerative tissues (e.g., epitheliumor blood), may be equipped with effective repair mechanisms toensure genomic integrity over a lifetime (18). Stem cells oftenrespond differently to genetic or epigenetic errors at differentproliferation phases (19). Studies regarding the population re-sponse to DNA damage of HSCs have suggested that the systemselects for the least damaged cells, and the competition betweendifferent cells is controlled by the level of p53 proteins (20, 21).Highly regenerative adult stem cells (e.g., HSCs) need to possesseffective strategies that balance long-term regeneration with pro-tection from mutagenesis (for example, cell proliferation or differ-entiation may be affected by the DNA damage response) (20, 22).Previous modeling studies based on the cell population dynamics
have indicated that feedback regulation to the proliferation is im-portant to maintain the homeostasis of tissue growth (23–25). Theexploration and analysis of models that include transit-amplifyingprogenitor cells and terminally differentiated cells have suggestedthat multiple feedback mechanisms at different lineage stages caninfluence the speed of tissue regeneration for better performance(17, 26–28). These population dynamic models could include agestructure (29), evolution (27, 30), and stochasticity (30, 31); and thesemodels could also be applied to the regulation of cancer (32). Studiesbased on spatial modeling have found that diffusive and regulatorymolecules involved in feedback mechanisms regulating the differ-entiation capabilities of the cells are important in maintaining thestem cell niche and shaping tissue stratification (33, 34).During the tissue self-renewal process driven by adult stem cells,
how do stem cells maintain a desirable distribution of epigeneticstates over their lifetimes despite many perturbations or accidentalchanges? What are the controlling strategies that enable a cell tomaximize its performance at each cell cycle while contributing posi-tively to the entire cell population during tissue growth?Additionally,are these control strategies able to guide genetic evolution to achievehigh tissue performance over a long period?Without considering anymolecular details, we present a dynamic programming model thatincludes stochastic transitions between cell cycles. The model is de-fined by the combination of a performance function at each cell di-vision and a fitness function during tissue homeostasis. We soughtoptimal controlling strategies involving proliferation, differentiationand apoptosis that naturally and collectively emerge from achievingperformance objectives as well as optimizing fitness. The model,which represents stem cells as a distribution of a state variable,emphasizes the cross-talk between genetic evolution and epigeneticstates and their stochastic transitions at each cell cycle. The analysisand computation of themodel suggest the existence of several criticalcontrolling strategies that regulate proliferation and apoptosis andare highlighted by heterogeneous dependence on the epigeneticstates in the feedback regulation.
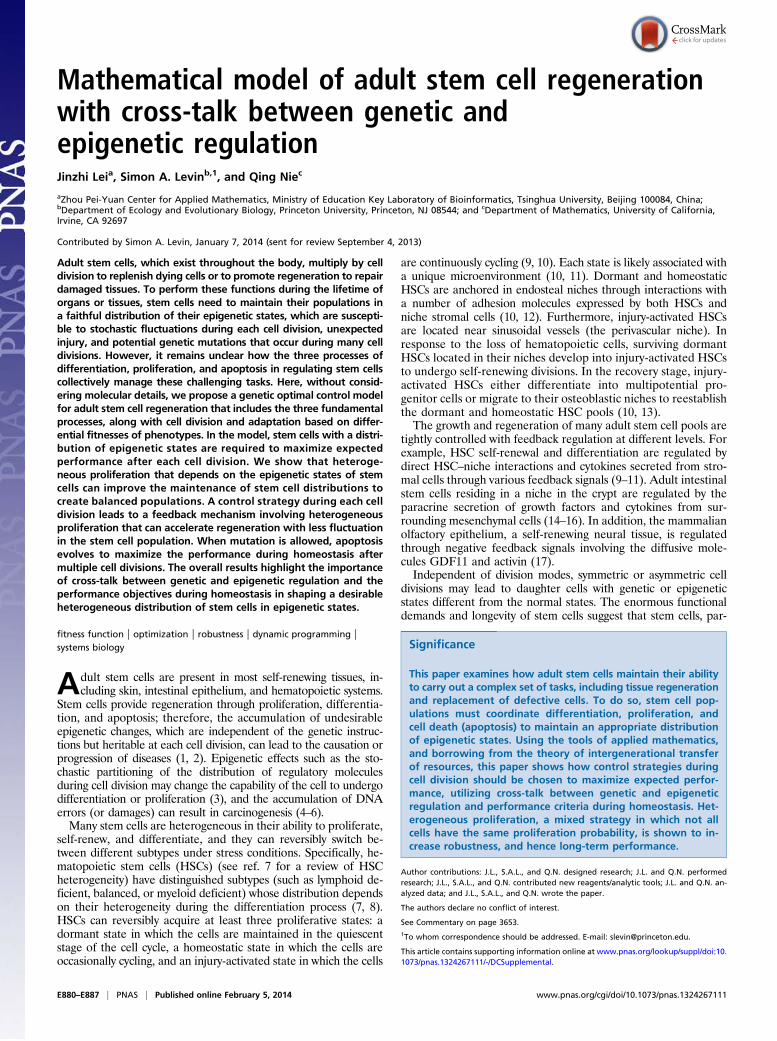
ResultsA Model of Stem-Cell Regeneration with Epigenetic Transition. Themodel is based on the G0 cell cycle model (35, 36) and a dynamicprogramming approach for intergenerational resource transfer(37, 38) together with evolutionary dynamics (39). Stem cells atcell cycling are classified into resting (G0) or proliferating (G1, S,and G2 phases and mitosis) phases (Fig. 1A) (35). During eachcell cycle, a cell in the proliferating phase either undergoes ap-optosis or divides into two daughter cells; however, a cell in theresting phase either irreversibly differentiates into a terminallydifferentiated cell or returns to the proliferating phase. In sometissues, resting phase cells (e.g., HSCs) may undergo a reversibletransition to a quiescent phase with preserved self-renewal,which results in two distinct cell populations.To study the heterogeneity of cell responses, we denote x as
the epigenetic state of a cell, which, for example, can be theexpression levels of one or multiple genes, the number ofnucleosome modifications of a DNA region, or the positionsof DNA methylation. In short, x represents one or several
intrinsic cellular states that may change during cell division.Here, only epigenetic states that are significant for cell differen-tiation, proliferation, or apoptosis are considered. Consequently,the three processes have dependences on the epigenetic state x:δtðxÞ, βtðxÞ, and μtðxÞ, where the subscript t indicates the tth cellcycle (Fig. 1).The distribution density of stem cells during the resting phase,
whose total population is denoted as Nt, with different epigeneticstates x, is characterized by ftðxÞ. ðNt; ftðxÞÞ undergoes a trans-formation from one cell cycle to the next (Fig. 1B):
ðNt; ftðxÞÞ↦�Ntþ1; ftþ1ðxÞ
�: [1]
During each cell cycle, NtRftðxÞδtðxÞdx cells leave the resting
phase due to differentiation, and NtRftðxÞβtðxÞdx cells enter
the proliferating phase. Each cell in the proliferating phase ei-ther undergoes apoptosis with a probability of μtðxÞ or producestwo daughter cells. Hence, the cell population after mitosis is
Ntþ1 ¼ Nt −Nt
ZftðxÞδtðxÞdx−Nt
ZftðxÞβtðxÞdx
þ 2Nt
ZftðxÞβtðxÞð1− μtðxÞÞdx
¼ Nt
�1þ
ZftðxÞ½βtðxÞð1− 2μtðxÞÞ− δtðxÞ�dx
�:
The integrals are taken over all possible epigenetic states. In thisderivation, the reversible transition between the resting phase andthe quiescent phase is regarded as perfectly balanced for anequilibrium, which may occur during homeostasis. In this paper, weonly considered the effect of this transition for regeneration inresponse to a severe loss of differentiated cells (SI Text, section S3).We define the observed proliferation probability as
βt;obs ¼ 1þZ
ftðxÞ½βtðxÞð1− 2μtðxÞÞ− δtðxÞ�dx; [2]
A
B
Fig. 1. Model Illustration. (A) At the tth cell cycle, cells in the resting phaseeither enter the proliferating phase with the probability of βt , or differen-tiate into other cell types with the probability of δt . The proliferating cellsundergo apoptosis with the probability of μt . Resting phase cells occasionallymigrate to the quiescent phase and vice versa under stress. (B) The perfor-mance function QðNt ,ftðxÞÞ quantifies how well the tissue fits to its physio-logical properties. The changes in the tissue state ðNt ,ftðxÞÞ at each cell cycleare determined by the three quantities fβtðxÞ,μtðxÞ,δtðxÞg chosen to maxi-mize the performance at the next cycle to give QðNtþ1,ftþ1ðxÞÞ. An evolu-tionary fitness function at homeostasis, denoted by W, is the limit ofQðNt ,ftðxÞÞ when t→∞.
Lei et al. PNAS | Published online February 5, 2014 | E881
APP
LIED
MATH
EMATICS
SYST
EMSBIOLO
GY
PNASPL
US
SEECO
MMEN
TARY
then
Ntþ1 ¼ Ntβt;obs: [3]
Here βt;obs is the ratio of the cell population numbers betweentwo consecutive cell cycles.To account for stochastic effects during the inheritance of epi-
genetic states that lead to variability of daughter cells in each celldivision (3, 40, 41), we introduced an inheritance probability pðx; yÞ,which represents the probability that a daughter cell of state x comesfrom a mother cell of state y. Therefore,
Rpðx; yÞdx ¼ 1 for any y.
Similarly to the above argument, we obtained (SI Text, section S1)
ftþ1ðxÞ ¼ 1βt;obs
�ftðxÞð1− ðδtðxÞ þ βtðxÞÞÞ
þ2Z
ftð yÞβtð yÞð1− μtð yÞÞpðx; yÞdy�: [4]
Eqs. 3 and 4 define a transformation between two cell cycles.During the tissue homeostasis, Eq. 3 indicates that the ob-
served proliferation satisfies βt;obs→1 as t→∞. Otherwise, eitheruncontrolled growth ðβt;obs > 1Þ or tissue degeneration ðβt;obs < 1Þoccurs. Hence, cell proliferation, differentiation, and apoptosis(i.e., fβtðxÞ; μtðxÞ; δtðxÞg) must be dynamically controlled at eachcell cycle, for example, through signal molecules released fromdownstream cell lineages (17, 32). This dynamic regulation leadsto a limited distribution at homeostasis,
f ðxÞ ¼ limt→∞
ftðxÞ; [5]
which describes the stem cell distribution as a function of epi-genetic states, and is termed “tissue epigenetics” for short.One possible control strategy for this type of growth may follow
evolution akin to natural selection (42). To model this selection, wefirst introduced a tissue performance function Q depending on thepopulation of stem cells through a function φ as well as the distri-bution of epigenetic states x in the tissue through a cell performancefunction χðxÞ, so that the performance at the tth cell cycle is given by
QðNt; ftðxÞÞ ¼ φðNtÞZ
χðxÞftðxÞdx: [6]
The cell performance χðxÞ measures the capability of a cell withgiven epigenetic state x in accomplishing its physiological func-tions (see Fig. 2 as an example). A larger value corresponds tobetter performance.We assumed that two layers of regulation occur between two cell
cycles: one at the epigenetic level that occurs at each cell division,and one at the genetic level that is selected by mutations over a longtime scale of many cell divisions. In particular, the probability ofproliferation βtðxÞ varies at each cell cycle by epigenetic regulation,while the apoptosis probability μtðxÞ ¼ μGðxÞ þ μ̂tðxÞ, in whichμGðxÞ is the average probability at homeostasis and is selectedthrough genetic mutations over a long time scale and μ̂tðxÞ is ran-dom at each cell cycle due to epigenetic modulations. Similarly, thedifferentiation probability takes the form of δtðxÞ ¼ δGðxÞ þ δ̂tðxÞin which δGðxÞ is the average probability at homeostasis and δ̂tðxÞrepresents epigenetic uncertainty. With these mechanisms of regu-lation, the performance Q after cell division depends, through Eqs.2–4, on the proliferation βtðxÞ as well as the stochasticities in apo-ptosis μtðxÞ and differentiation δtðxÞ. Thus, we can write the per-formance function after cell division as (SI Text, section S1)
Q�Ntþ1; ftþ1ðxÞ
� ¼ QðNt; ftðxÞjβtðxÞ; μtðxÞ; δtðxÞÞ: [7]
During each cell cycle, the proliferation βtðxÞ is controlled toachieve maximum tissue performance after cell division in the
face of uncertainties in apoptosis μtðxÞ and differentiationδtðxÞ, which leads to solving the corresponding Bellman con-dition (38, 43–45)
EμtðxÞ;δtðxÞ maxβtðxÞ
QðNt; ftðxÞjβtðxÞ; μtðxÞ; δtðxÞÞ; [8]
where EμtðxÞ;δtðxÞ is the expectation with respect to apoptosis anddifferentiation probabilities during cell division.The evolutionary fitness function is defined as the perfor-
mance at homeostasis after multiple cell divisions (i.e., t→∞;see also Fig. 1B):
W ¼ limt→∞
QðNt; ftðxÞÞ: [9]
While the tissue performance function Q is subject to epigeneticregulation at each cell cycle, the fitness function W is geneticallyregulated and dependent on the apoptosis μGðxÞ and the differ-entiation δGðxÞ. Evolution selects μGðxÞ and δGðxÞ through muta-tions to maximize the fitness W. The overall model defines aprinciple of a control strategy that incorporates cross-talk be-tween genetic and epigenetic regulation in stem cell regenerationand evolution.
Heterogeneous Apoptosis Can Improve the Maintenance of TissueEpigenetics. During growth, the accumulation of stochastic mod-ifications in epigenetic states may produce defective cells that needto be effectively repaired or removed. Here, we show that hetero-geneous apoptosis is advantageous in controlling tissue epigenetics.First, the epigenetic function f ðxÞ, when we take t→∞ in Eqs. 3
and 4 with an assumption of no epigenetic uncertainty in dif-ferentiation and apoptosis, satisfies the following integral equa-tion (SI Text, section S2):
f ðxÞ ¼2Z
f ð yÞβð yÞð1− μGð yÞÞpðx; yÞdyδGðxÞ þ βðxÞ ; [10]
where βðxÞ ¼ limt→∞βtðxÞ satisfiesZf ðxÞ�βðxÞð1− 2μGðxÞÞ− δGðxÞ
dx ¼ 0: [11]
Analysis of a simplified model based on Eqs. 10 and 11 showsthat homogenous apoptosis [i.e., μGðxÞ is independent of x] easilyleads to abnormal or disease conditions for a tissue (SI Text,
0
7
14 A
0
7
14 B
perc
enta
ge o
f cel
ls (
%)
0 100 200 3000
0.3
0.6C
x
0 100 200 3000
0.5
1
(x)
0 1000 2000 3000 40000.95
1
1.05
Cell cycle (t)
Cel
l pop
ulat
ion
(Nt)
D
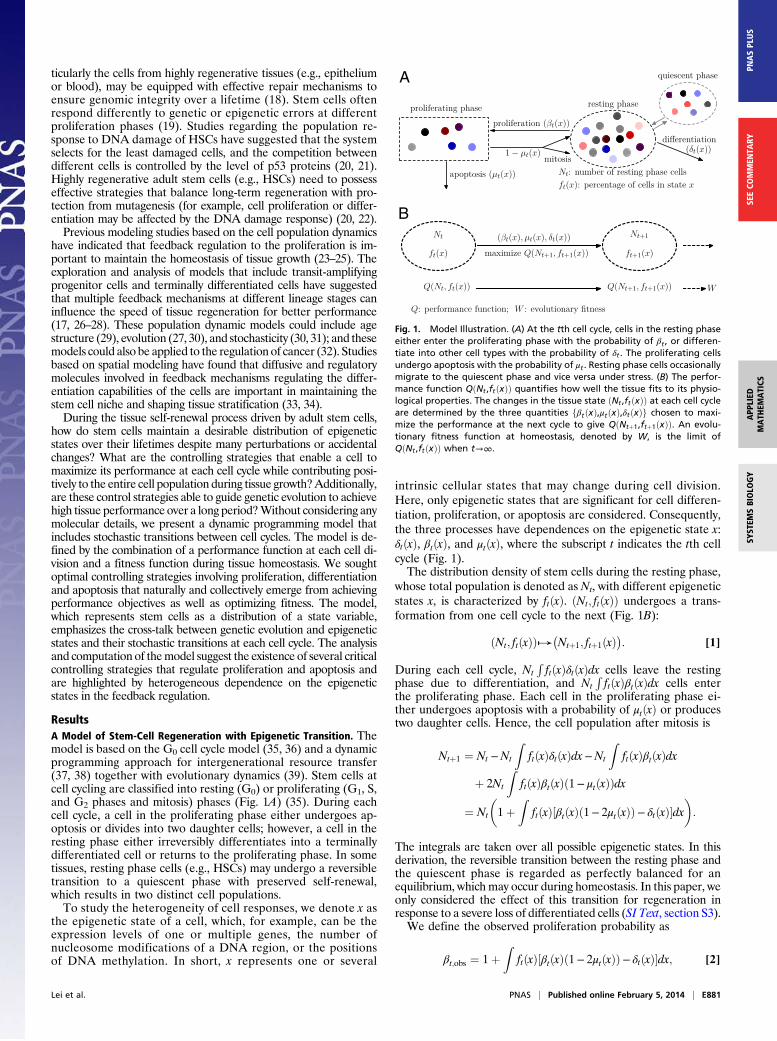
Fig. 2. Distribution of cells at homeostasis under three different combina-tions of the epigenetic regulation. (A) Both βðxÞ and μGðxÞ are independentof x, and δGðxÞ changes with x. (Inset) The performance function χðxÞ isshown. (B) μGðxÞ is independent of x, and βðxÞ and δGðxÞ change with x. (C)Both δGðxÞ and βðxÞ are independent of x, and μGðxÞ changes with x. Shadowregions ðx < 60Þ represent defective states. (D) Time course of Nt under thethree conditions (red, green, and blue for conditions A–C, respectively). (SeeSI Text, section S5 for details on simulations.)
E882 | www.pnas.org/cgi/doi/10.1073/pnas.1324267111 Lei et al.
section S2). This observation is further confirmed by directsimulations of Eqs. 10 and 11 under the condition in which ap-optosis probability μGðxÞ is either dependent on or independentof x (Fig. 2). Whenever the apoptosis μGðxÞ is independent of x,most cells accumulate in low-performance states (Fig. 2 A andB). In contrast, if μGðxÞ is dependent on x so that the cells withlower performance have a greater probability of apoptosis, onlya small number of low-performance cells are present duringhomeostasis (Fig. 2C). These results suggest that heterogeneityin apoptosis can improve the maintenance of acceptable tissueepigenetics during a long lifespan.Furthermore, we find that heterogeneity in the cell perfor-
mance function ðχðxÞÞ is important for successful natural selec-tion of apoptosis strategies, and epigenetic transition during celldivision is helpful for robust tissue epigenetics during homeo-stasis with respect to accidental changes in the tissue lifespan (SIText, section S3). Interestingly, despite apparent differences intissue epigenetics, homogeneous or heterogeneous apoptosisyields similar dynamics in the cell population Nt (Fig. 2D),demonstrating the importance of introducing the function ftðxÞfor epigenetic states into the model. The cell population modelalone may be insufficient to study the control strategies of stemcell regeneration.
An Optimal Control for Proliferation During Each Cell Cycle Dependson Complex Feedback Regulation Involving the Epigenetic States andthe Size of the Total Cell Population. Optimal control at each cellcycle involves identifying the proliferation probability to maxi-mize the performance Q in Eq. 8 after cell division. To study thesystem analytically, we considered two cases based on either ho-mogeneous or heterogeneous proliferation.Homogeneous proliferation (strategy A).When βtðxÞ is independent ofthe epigenetic state x, meaning that all cells in the tissue are alikein their ability to undergo cell cycle reentry, the optimal pro-liferation (strategy A) is governed by ∂Q=∂βt ¼ 0, which yields
Ntβt;obsφ′�Ntβt;obs
�φ�Ntβt;obs
� ¼ At; [12]
where At is a quantity determined by ftðxÞ; δt−1ðxÞ; μt−1ðxÞ (SI Text,section S3). The proliferation βt is obtained from Eq. 12 bysolving βt;obs. In particular, when Nt is near the value Np thatmaximizes the function φ, βt can be approximated by
βt ≈
1Nt
�Np þ AtφðNpÞ
Npφ″ðNpÞ�− 1þ δt
1− 2μt: [13]
Here δt and μt are average probabilities of differentiation andapoptosis, respectively. Examples of tissue dynamics based onstrategy A are shown in SI Text, section S3.A direct consequence of Eq. 13 is that the proliferation βt
decreases with the cell population, resulting in a negative feed-back control. We note that the tissue epigenetics in the next cellgeneration ftþ1ðxÞ depends on the current generation pro-liferation βt through Eq. 4, leading to complex negative feedbackregulation during each cell cycle.Heterogeneous proliferation (strategy B). Next, we considered thecase of cells having two distinct proliferation probabilities. Inthese two distinct states, denoted by x∈Ω1 or x∈Ω2, we assumed
βtðxÞ ¼βt;1; x∈Ω1βt;2; x∈Ω2:
[14]
In addition, we assumed that type I cells, defined as cells withx∈Ω1, are unmodulated at each cell cycle (i.e., βt;1≡ β1;G is genet-ically regulated), and type II cells, defined as cells with x∈Ω2, are
modulated such that βt;2 changes at each cell cycle. Biologically,this assumption corresponds to the situation in which, for exam-ple, certain growth factor receptors are active (or expressed) onlyin type II but not type I cells; however, the receptors are requiredto respond to external signals to control proliferation.The probability βt;2 (strategy B) is determined by ∂Q=∂βt;2 ¼ 0,
which yields an equation for βt;obs similar to Eq. 12. In particular,when N is close to the value Np (SI Text, section S3), one has
βt;2 ≈
1Nt
�Np þ At′φðNpÞ
Npφ″ðNpÞ�− 1− β1;G
�f t;1 − 2μt;1
�þ δt
f t;2 − 2μt;2: [15]
All bar terms are averages over cell epigenetic states, witha subscript 1 for type I cells ðx∈Ω1Þ and a subscript 2 for type IIðx∈Ω2Þ. Similarly to δt and μt in Eq. 13, these average termsincorporate genetic and epigenetic regulation in differentiationand apoptosis. Examples of tissue dynamics based on strategy Bare shown in SI Text, section S3.Eq. 15 shows that βt;2 is a decreasing function of the cell pop-
ulation, resulting in a complex negative feedback regulation withrespect to cell populations and the epigenetic states of the tissuecells. We note that the heterogeneous proliferation probability βt;2for the type II cells also depends on the probability of the type Icells, which suggests that an appropriate selection of the unmodu-lated proliferation β1;G can improve the performance at homeo-stasis in comparison with homogenous cells (SI Text, section S3).Simple feedback via the size of the cell population (strategy C). Optimalcontrols of proliferation based on our model lead to the negativefeedback regulation of proliferation through the cell population.Similar regulatory mechanisms with negative feedback have beenexplicitly introduced in many stem cell population models (17,27, 36, 46) by use of a Hill function (strategy C) such as
βt ¼ β01þ ρðNt=KÞm1þ ðNt=KÞm ; [16]
where β0; ρ;K;m are constants.A major difference between Eqs. 16 and 13 or 15 based on our
model is that the coefficients in Eq. 16 are constants and in-dependent of the tissue epigenetics. Thus, strategy C is a simplefeedback mechanism involving only the cell population; however,both strategies A and B are complex feedback mechanisms in-corporating both cell population and tissue epigenetics. The im-portance of epigenetic states has recently been implicated duringthe stem cell self-renewal and differentiation processes (47, 48).This epigenetic dependence of feedback mechanisms, as shown inthe next section, can improve the robustness in tissue dynamics.
Heterogeneous Proliferation Is Important for the Robustness of Growthwith Respect to Sudden Changes.During the lifespan of an organism,many unexpected alterations to stem cell systems occur at variouslevels, such as the loss of stem cells (e.g., injury or marrow dona-tion) and temporal changes in cell differentiation and apoptosiscapabilities (several studies have reported a 20-fold increase inthe differentiation activity of HSCs under the administration ofG-CSF) (49). In many situations, stem cell tissues recover in a timelymanner after these types of changes. For example, most marrowdonors complete recovery within a few weeks (50, 51) (see alsohttp://bethematch.org), corresponding to ∼10 cell cycles of HSCs(each cell cycle is approximately 1:4− 4:2 d according to ref. 24).Many donors even recover in less than 5 d (51). Therefore,a physiologically reliable control strategy should induce fast ad-aptation and robust recovery against these changes.Here, we studied the three different strategies (A, B, and C) in
response to changes in the stem cell population. Two types ofchanges were studied: a sudden decrease in the cell population
Lei et al. PNAS | Published online February 5, 2014 | E883
APP
LIED
MATH
EMATICS
SYST
EMSBIOLO
GY
PNASPL
US
SEECO
MMEN
TARY
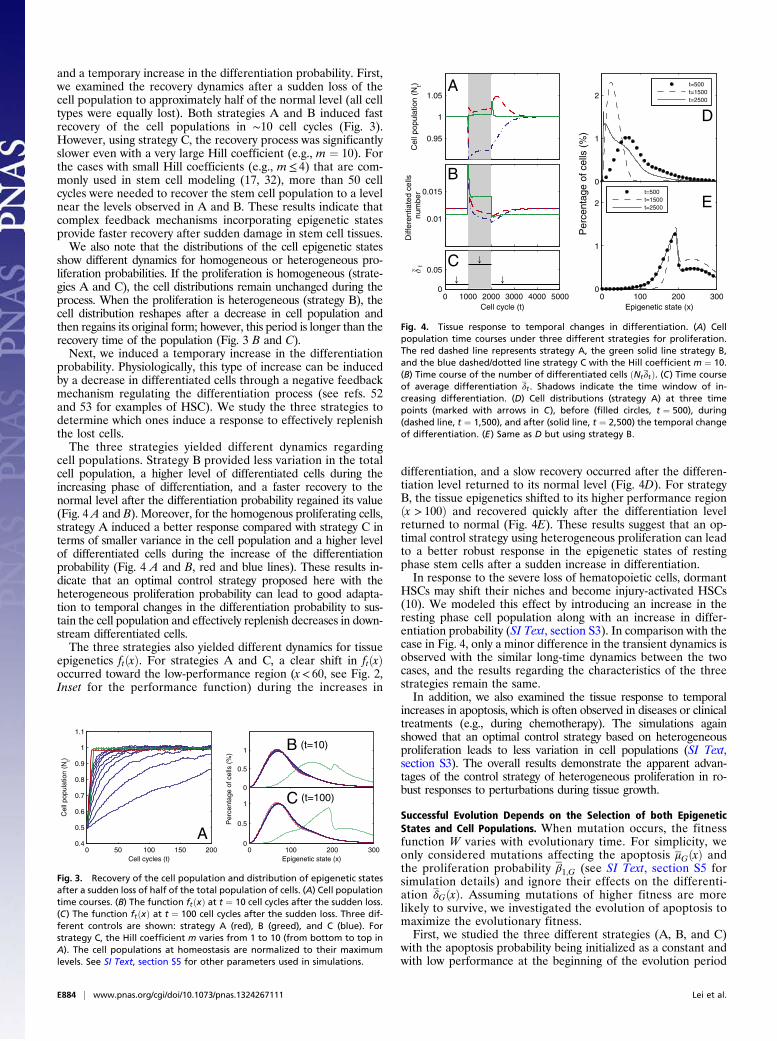
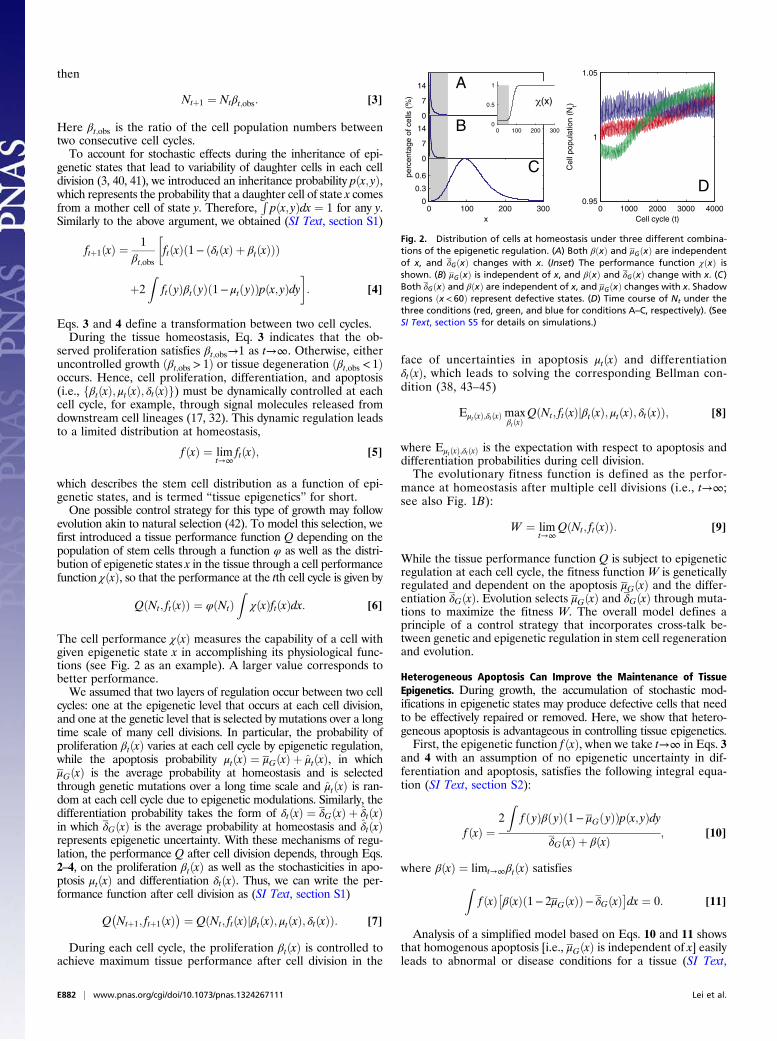
and a temporary increase in the differentiation probability. First,we examined the recovery dynamics after a sudden loss of thecell population to approximately half of the normal level (all celltypes were equally lost). Both strategies A and B induced fastrecovery of the cell populations in ∼10 cell cycles (Fig. 3).However, using strategy C, the recovery process was significantlyslower even with a very large Hill coefficient (e.g., m ¼ 10). Forthe cases with small Hill coefficients (e.g., m≤ 4) that are com-monly used in stem cell modeling (17, 32), more than 50 cellcycles were needed to recover the stem cell population to a levelnear the levels observed in A and B. These results indicate thatcomplex feedback mechanisms incorporating epigenetic statesprovide faster recovery after sudden damage in stem cell tissues.We also note that the distributions of the cell epigenetic states
show different dynamics for homogeneous or heterogeneous pro-liferation probabilities. If the proliferation is homogeneous (strate-gies A and C), the cell distributions remain unchanged during theprocess. When the proliferation is heterogeneous (strategy B), thecell distribution reshapes after a decrease in cell population andthen regains its original form; however, this period is longer than therecovery time of the population (Fig. 3 B and C).Next, we induced a temporary increase in the differentiation
probability. Physiologically, this type of increase can be inducedby a decrease in differentiated cells through a negative feedbackmechanism regulating the differentiation process (see refs. 52and 53 for examples of HSC). We study the three strategies todetermine which ones induce a response to effectively replenishthe lost cells.The three strategies yielded different dynamics regarding
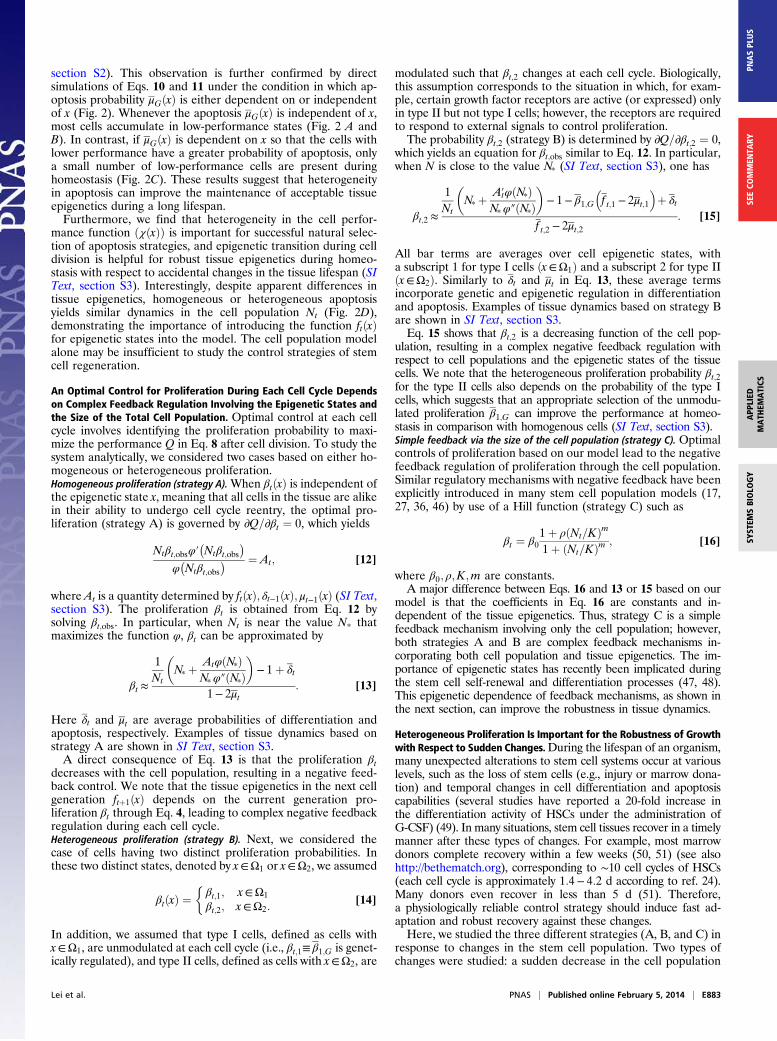
cell populations. Strategy B provided less variation in the totalcell population, a higher level of differentiated cells during theincreasing phase of differentiation, and a faster recovery to thenormal level after the differentiation probability regained its value(Fig. 4 A and B). Moreover, for the homogenous proliferating cells,strategy A induced a better response compared with strategy C interms of smaller variance in the cell population and a higher levelof differentiated cells during the increase of the differentiationprobability (Fig. 4 A and B, red and blue lines). These results in-dicate that an optimal control strategy proposed here with theheterogeneous proliferation probability can lead to good adapta-tion to temporal changes in the differentiation probability to sus-tain the cell population and effectively replenish decreases in down-stream differentiated cells.The three strategies also yielded different dynamics for tissue
epigenetics ftðxÞ. For strategies A and C, a clear shift in ftðxÞoccurred toward the low-performance region (x< 60, see Fig. 2,Inset for the performance function) during the increases in
differentiation, and a slow recovery occurred after the differen-tiation level returned to its normal level (Fig. 4D). For strategyB, the tissue epigenetics shifted to its higher performance regionðx > 100Þ and recovered quickly after the differentiation levelreturned to normal (Fig. 4E). These results suggest that an op-timal control strategy using heterogeneous proliferation can leadto a better robust response in the epigenetic states of restingphase stem cells after a sudden increase in differentiation.In response to the severe loss of hematopoietic cells, dormant
HSCs may shift their niches and become injury-activated HSCs(10). We modeled this effect by introducing an increase in theresting phase cell population along with an increase in differ-entiation probability (SI Text, section S3). In comparison with thecase in Fig. 4, only a minor difference in the transient dynamics isobserved with the similar long-time dynamics between the twocases, and the results regarding the characteristics of the threestrategies remain the same.In addition, we also examined the tissue response to temporal
increases in apoptosis, which is often observed in diseases or clinicaltreatments (e.g., during chemotherapy). The simulations againshowed that an optimal control strategy based on heterogeneousproliferation leads to less variation in cell populations (SI Text,section S3). The overall results demonstrate the apparent advan-tages of the control strategy of heterogeneous proliferation in ro-bust responses to perturbations during tissue growth.
Successful Evolution Depends on the Selection of both EpigeneticStates and Cell Populations. When mutation occurs, the fitnessfunction W varies with evolutionary time. For simplicity, weonly considered mutations affecting the apoptosis μGðxÞ andthe proliferation probability β1;G (see SI Text, section S5 forsimulation details) and ignore their effects on the differenti-ation δGðxÞ. Assuming mutations of higher fitness are morelikely to survive, we investigated the evolution of apoptosis tomaximize the evolutionary fitness.First, we studied the three different strategies (A, B, and C)
with the apoptosis probability being initialized as a constant andwith low performance at the beginning of the evolution period
0 50 100 150 2000.4
0.5
0.6
0.7
0.8
0.9
1
1.1
ACell cycles (t)
Cel
l pop
ulat
ion
(Nt)
0 100 200 3000
0.5
1
Epigenetic state (x)
(t=100)0
0.5
1(t=10)
Per
cent
age
of c
ells
(%
)
B
C
Fig. 3. Recovery of the cell population and distribution of epigenetic statesafter a sudden loss of half of the total population of cells. (A) Cell populationtime courses. (B) The function ftðxÞ at t ¼ 10 cell cycles after the sudden loss.(C) The function ftðxÞ at t ¼ 100 cell cycles after the sudden loss. Three dif-ferent controls are shown: strategy A (red), B (greed), and C (blue). Forstrategy C, the Hill coefficient m varies from 1 to 10 (from bottom to top inA). The cell populations at homeostasis are normalized to their maximumlevels. See SI Text, section S5 for other parameters used in simulations.
0.95
1
1.05
Cel
l pop
ulat
ion
(Nt) A
0.01
0.015
Diff
eren
tiate
d ce
llsnu
mbe
r
B
0 1000 2000 3000 4000 50000
0.05
Cell cycle (t)
C
0
1
2
D
t=500t=1500t=2500
0 100 200 3000
1
2
Epigenetic state (x)
Per
cent
age
of c
ells
(%
)
Et=500t=1500t=2500
Fig. 4. Tissue response to temporal changes in differentiation. (A) Cellpopulation time courses under three different strategies for proliferation.The red dashed line represents strategy A, the green solid line strategy B,and the blue dashed/dotted line strategy C with the Hill coefficient m ¼ 10.(B) Time course of the number of differentiated cells ðNtδtÞ. (C) Time courseof average differentiation δt . Shadows indicate the time window of in-creasing differentiation. (D) Cell distributions (strategy A) at three timepoints (marked with arrows in C), before (filled circles, t ¼ 500), during(dashed line, t ¼ 1,500), and after (solid line, t ¼ 2,500) the temporal changeof differentiation. (E) Same as D but using strategy B.
E884 | www.pnas.org/cgi/doi/10.1073/pnas.1324267111 Lei et al.
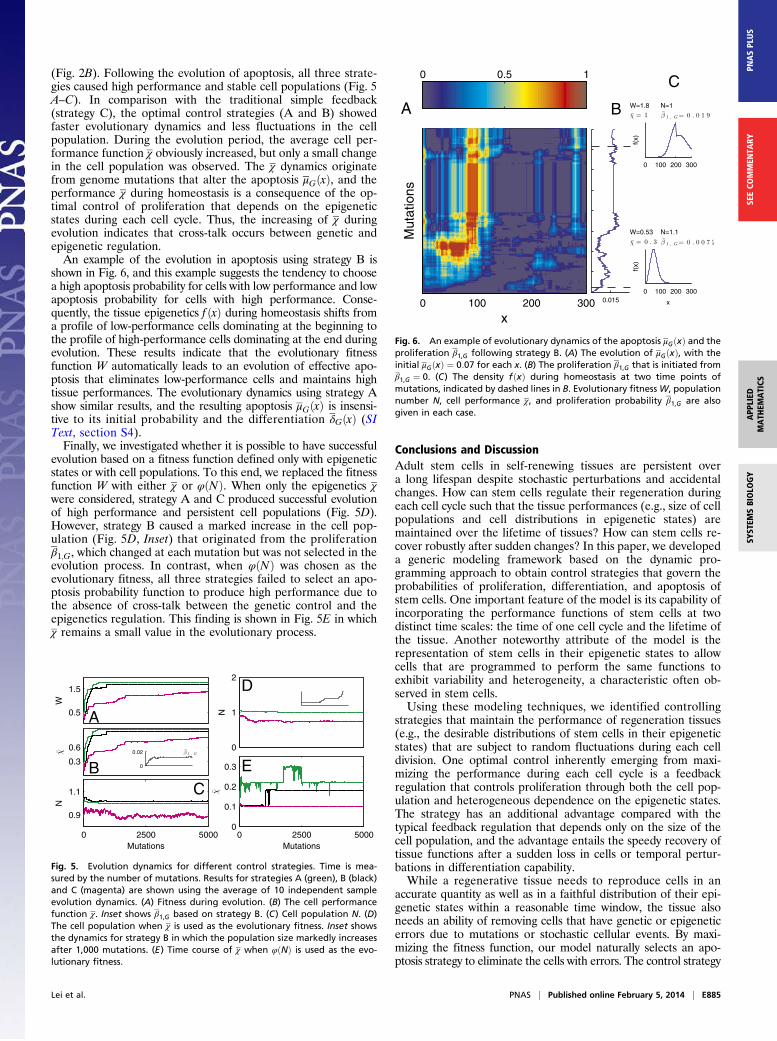
(Fig. 2B). Following the evolution of apoptosis, all three strate-gies caused high performance and stable cell populations (Fig. 5A–C). In comparison with the traditional simple feedback(strategy C), the optimal control strategies (A and B) showedfaster evolutionary dynamics and less fluctuations in the cellpopulation. During the evolution period, the average cell per-formance function χ obviously increased, but only a small changein the cell population was observed. The χ dynamics originatefrom genome mutations that alter the apoptosis μGðxÞ, and theperformance χ during homeostasis is a consequence of the op-timal control of proliferation that depends on the epigeneticstates during each cell cycle. Thus, the increasing of χ duringevolution indicates that cross-talk occurs between genetic andepigenetic regulation.An example of the evolution in apoptosis using strategy B is
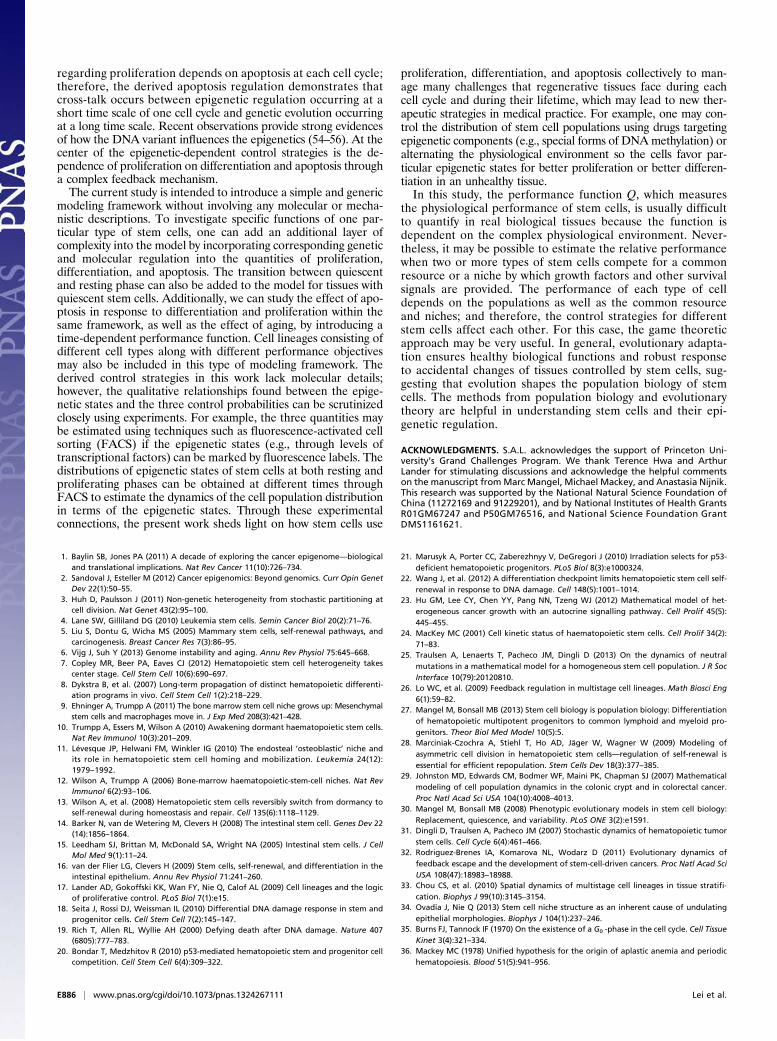
shown in Fig. 6, and this example suggests the tendency to choosea high apoptosis probability for cells with low performance and lowapoptosis probability for cells with high performance. Conse-quently, the tissue epigenetics f ðxÞ during homeostasis shifts froma profile of low-performance cells dominating at the beginning tothe profile of high-performance cells dominating at the end duringevolution. These results indicate that the evolutionary fitnessfunction W automatically leads to an evolution of effective apo-ptosis that eliminates low-performance cells and maintains hightissue performances. The evolutionary dynamics using strategy Ashow similar results, and the resulting apoptosis μGðxÞ is insensi-tive to its initial probability and the differentiation δGðxÞ (SIText, section S4).Finally, we investigated whether it is possible to have successful
evolution based on a fitness function defined only with epigeneticstates or with cell populations. To this end, we replaced the fitnessfunction W with either χ or φðNÞ. When only the epigenetics χwere considered, strategy A and C produced successful evolutionof high performance and persistent cell populations (Fig. 5D).However, strategy B caused a marked increase in the cell pop-ulation (Fig. 5D, Inset) that originated from the proliferationβ1;G, which changed at each mutation but was not selected in theevolution process. In contrast, when φðNÞ was chosen as theevolutionary fitness, all three strategies failed to select an apo-ptosis probability function to produce high performance due tothe absence of cross-talk between the genetic control and theepigenetics regulation. This finding is shown in Fig. 5E in whichχ remains a small value in the evolutionary process.
Conclusions and DiscussionAdult stem cells in self-renewing tissues are persistent overa long lifespan despite stochastic perturbations and accidentalchanges. How can stem cells regulate their regeneration duringeach cell cycle such that the tissue performances (e.g., size of cellpopulations and cell distributions in epigenetic states) aremaintained over the lifetime of tissues? How can stem cells re-cover robustly after sudden changes? In this paper, we developeda generic modeling framework based on the dynamic pro-gramming approach to obtain control strategies that govern theprobabilities of proliferation, differentiation, and apoptosis ofstem cells. One important feature of the model is its capability ofincorporating the performance functions of stem cells at twodistinct time scales: the time of one cell cycle and the lifetime ofthe tissue. Another noteworthy attribute of the model is therepresentation of stem cells in their epigenetic states to allowcells that are programmed to perform the same functions toexhibit variability and heterogeneity, a characteristic often ob-served in stem cells.Using these modeling techniques, we identified controlling
strategies that maintain the performance of regeneration tissues(e.g., the desirable distributions of stem cells in their epigeneticstates) that are subject to random fluctuations during each celldivision. One optimal control inherently emerging from maxi-mizing the performance during each cell cycle is a feedbackregulation that controls proliferation through both the cell pop-ulation and heterogeneous dependence on the epigenetic states.The strategy has an additional advantage compared with thetypical feedback regulation that depends only on the size of thecell population, and the advantage entails the speedy recovery oftissue functions after a sudden loss in cells or temporal pertur-bations in differentiation capability.While a regenerative tissue needs to reproduce cells in an
accurate quantity as well as in a faithful distribution of their epi-genetic states within a reasonable time window, the tissue alsoneeds an ability of removing cells that have genetic or epigeneticerrors due to mutations or stochastic cellular events. By maxi-mizing the fitness function, our model naturally selects an apo-ptosis strategy to eliminate the cells with errors. The control strategy
0.5
1.5
W
A
0.3
0.6
B
0 2500 5000
0.9
1.1
Mutations
N
C
0
0.02
0 2500 50000
0.1
0.2
0.3
Mutations
E0
1
2
N
D
Fig. 5. Evolution dynamics for different control strategies. Time is mea-sured by the number of mutations. Results for strategies A (green), B (black)and C (magenta) are shown using the average of 10 independent sampleevolution dynamics. (A) Fitness during evolution. (B) The cell performancefunction χ. Inset shows β1,G based on strategy B. (C) Cell population N. (D)The cell population when χ is used as the evolutionary fitness. Inset showsthe dynamics for strategy B in which the population size markedly increasesafter 1,000 mutations. (E) Time course of χ when φðNÞ is used as the evo-lutionary fitness.
0 100 200 300
x
Mut
atio
ns
A
0 0.5 1
0 100 200 300
W=0.53 N=1.1
f(x)
x
0 100 200 300
W=1.8 N=1
f(x)
C
0.015
B
Fig. 6. An example of evolutionary dynamics of the apoptosis μGðxÞ and theproliferation β1,G following strategy B. (A) The evolution of μGðxÞ, with theinitial μGðxÞ ¼ 0:07 for each x. (B) The proliferation β1,G that is initiated fromβ1,G ¼ 0. (C) The density fðxÞ during homeostasis at two time points ofmutations, indicated by dashed lines in B. Evolutionary fitnessW, populationnumber N, cell performance χ, and proliferation probability β1,G are alsogiven in each case.
Lei et al. PNAS | Published online February 5, 2014 | E885
APP
LIED
MATH
EMATICS
SYST
EMSBIOLO
GY
PNASPL
US
SEECO
MMEN
TARY
regarding proliferation depends on apoptosis at each cell cycle;therefore, the derived apoptosis regulation demonstrates thatcross-talk occurs between epigenetic regulation occurring at ashort time scale of one cell cycle and genetic evolution occurringat a long time scale. Recent observations provide strong evidencesof how the DNA variant influences the epigenetics (54–56). At thecenter of the epigenetic-dependent control strategies is the de-pendence of proliferation on differentiation and apoptosis througha complex feedback mechanism.The current study is intended to introduce a simple and generic
modeling framework without involving any molecular or mecha-nistic descriptions. To investigate specific functions of one par-ticular type of stem cells, one can add an additional layer ofcomplexity into the model by incorporating corresponding geneticand molecular regulation into the quantities of proliferation,differentiation, and apoptosis. The transition between quiescentand resting phase can also be added to the model for tissues withquiescent stem cells. Additionally, we can study the effect of apo-ptosis in response to differentiation and proliferation within thesame framework, as well as the effect of aging, by introducing atime-dependent performance function. Cell lineages consisting ofdifferent cell types along with different performance objectivesmay also be included in this type of modeling framework. Thederived control strategies in this work lack molecular details;however, the qualitative relationships found between the epige-netic states and the three control probabilities can be scrutinizedclosely using experiments. For example, the three quantities maybe estimated using techniques such as fluorescence-activated cellsorting (FACS) if the epigenetic states (e.g., through levels oftranscriptional factors) can be marked by fluorescence labels. Thedistributions of epigenetic states of stem cells at both resting andproliferating phases can be obtained at different times throughFACS to estimate the dynamics of the cell population distributionin terms of the epigenetic states. Through these experimentalconnections, the present work sheds light on how stem cells use
proliferation, differentiation, and apoptosis collectively to man-age many challenges that regenerative tissues face during eachcell cycle and during their lifetime, which may lead to new ther-apeutic strategies in medical practice. For example, one may con-trol the distribution of stem cell populations using drugs targetingepigenetic components (e.g., special forms of DNAmethylation) oralternating the physiological environment so the cells favor par-ticular epigenetic states for better proliferation or better differen-tiation in an unhealthy tissue.In this study, the performance function Q, which measures
the physiological performance of stem cells, is usually difficultto quantify in real biological tissues because the function isdependent on the complex physiological environment. Never-theless, it may be possible to estimate the relative performancewhen two or more types of stem cells compete for a commonresource or a niche by which growth factors and other survivalsignals are provided. The performance of each type of celldepends on the populations as well as the common resourceand niches; and therefore, the control strategies for differentstem cells affect each other. For this case, the game theoreticapproach may be very useful. In general, evolutionary adapta-tion ensures healthy biological functions and robust responseto accidental changes of tissues controlled by stem cells, sug-gesting that evolution shapes the population biology of stemcells. The methods from population biology and evolutionarytheory are helpful in understanding stem cells and their epi-genetic regulation.
ACKNOWLEDGMENTS. S.A.L. acknowledges the support of Princeton Uni-versity’s Grand Challenges Program. We thank Terence Hwa and ArthurLander for stimulating discussions and acknowledge the helpful commentson the manuscript fromMarc Mangel, Michael Mackey, and Anastasia Nijnik.This research was supported by the National Natural Science Foundation ofChina (11272169 and 91229201), and by National Institutes of Health GrantsR01GM67247 and P50GM76516, and National Science Foundation GrantDMS1161621.
1. Baylin SB, Jones PA (2011) A decade of exploring the cancer epigenome—biologicaland translational implications. Nat Rev Cancer 11(10):726–734.
2. Sandoval J, Esteller M (2012) Cancer epigenomics: Beyond genomics. Curr Opin GenetDev 22(1):50–55.
3. Huh D, Paulsson J (2011) Non-genetic heterogeneity from stochastic partitioning atcell division. Nat Genet 43(2):95–100.
4. Lane SW, Gilliland DG (2010) Leukemia stem cells. Semin Cancer Biol 20(2):71–76.5. Liu S, Dontu G, Wicha MS (2005) Mammary stem cells, self-renewal pathways, and
carcinogenesis. Breast Cancer Res 7(3):86–95.6. Vijg J, Suh Y (2013) Genome instability and aging. Annu Rev Physiol 75:645–668.7. Copley MR, Beer PA, Eaves CJ (2012) Hematopoietic stem cell heterogeneity takes
center stage. Cell Stem Cell 10(6):690–697.8. Dykstra B, et al. (2007) Long-term propagation of distinct hematopoietic differenti-
ation programs in vivo. Cell Stem Cell 1(2):218–229.9. Ehninger A, Trumpp A (2011) The bone marrow stem cell niche grows up: Mesenchymal
stem cells and macrophages move in. J Exp Med 208(3):421–428.10. Trumpp A, Essers M, Wilson A (2010) Awakening dormant haematopoietic stem cells.
Nat Rev Immunol 10(3):201–209.11. Lévesque JP, Helwani FM, Winkler IG (2010) The endosteal ‘osteoblastic’ niche and
its role in hematopoietic stem cell homing and mobilization. Leukemia 24(12):1979–1992.
12. Wilson A, Trumpp A (2006) Bone-marrow haematopoietic-stem-cell niches. Nat RevImmunol 6(2):93–106.
13. Wilson A, et al. (2008) Hematopoietic stem cells reversibly switch from dormancy toself-renewal during homeostasis and repair. Cell 135(6):1118–1129.
14. Barker N, van de Wetering M, Clevers H (2008) The intestinal stem cell. Genes Dev 22(14):1856–1864.
15. Leedham SJ, Brittan M, McDonald SA, Wright NA (2005) Intestinal stem cells. J CellMol Med 9(1):11–24.
16. van der Flier LG, Clevers H (2009) Stem cells, self-renewal, and differentiation in theintestinal epithelium. Annu Rev Physiol 71:241–260.
17. Lander AD, Gokoffski KK, Wan FY, Nie Q, Calof AL (2009) Cell lineages and the logicof proliferative control. PLoS Biol 7(1):e15.
18. Seita J, Rossi DJ, Weissman IL (2010) Differential DNA damage response in stem andprogenitor cells. Cell Stem Cell 7(2):145–147.
19. Rich T, Allen RL, Wyllie AH (2000) Defying death after DNA damage. Nature 407(6805):777–783.
20. Bondar T, Medzhitov R (2010) p53-mediated hematopoietic stem and progenitor cellcompetition. Cell Stem Cell 6(4):309–322.
21. Marusyk A, Porter CC, Zaberezhnyy V, DeGregori J (2010) Irradiation selects for p53-deficient hematopoietic progenitors. PLoS Biol 8(3):e1000324.
22. Wang J, et al. (2012) A differentiation checkpoint limits hematopoietic stem cell self-renewal in response to DNA damage. Cell 148(5):1001–1014.
23. Hu GM, Lee CY, Chen YY, Pang NN, Tzeng WJ (2012) Mathematical model of het-erogeneous cancer growth with an autocrine signalling pathway. Cell Prolif 45(5):445–455.
24. MacKey MC (2001) Cell kinetic status of haematopoietic stem cells. Cell Prolif 34(2):71–83.
25. Traulsen A, Lenaerts T, Pacheco JM, Dingli D (2013) On the dynamics of neutralmutations in a mathematical model for a homogeneous stem cell population. J R SocInterface 10(79):20120810.
26. Lo WC, et al. (2009) Feedback regulation in multistage cell lineages. Math Biosci Eng6(1):59–82.
27. Mangel M, Bonsall MB (2013) Stem cell biology is population biology: Differentiationof hematopoietic multipotent progenitors to common lymphoid and myeloid pro-genitors. Theor Biol Med Model 10(5):5.
28. Marciniak-Czochra A, Stiehl T, Ho AD, Jäger W, Wagner W (2009) Modeling ofasymmetric cell division in hematopoietic stem cells—regulation of self-renewal isessential for efficient repopulation. Stem Cells Dev 18(3):377–385.
29. Johnston MD, Edwards CM, Bodmer WF, Maini PK, Chapman SJ (2007) Mathematicalmodeling of cell population dynamics in the colonic crypt and in colorectal cancer.Proc Natl Acad Sci USA 104(10):4008–4013.
30. Mangel M, Bonsall MB (2008) Phenotypic evolutionary models in stem cell biology:Replacement, quiescence, and variability. PLoS ONE 3(2):e1591.
31. Dingli D, Traulsen A, Pacheco JM (2007) Stochastic dynamics of hematopoietic tumorstem cells. Cell Cycle 6(4):461–466.
32. Rodriguez-Brenes IA, Komarova NL, Wodarz D (2011) Evolutionary dynamics offeedback escape and the development of stem-cell-driven cancers. Proc Natl Acad SciUSA 108(47):18983–18988.
33. Chou CS, et al. (2010) Spatial dynamics of multistage cell lineages in tissue stratifi-cation. Biophys J 99(10):3145–3154.
34. Ovadia J, Nie Q (2013) Stem cell niche structure as an inherent cause of undulatingepithelial morphologies. Biophys J 104(1):237–246.
35. Burns FJ, Tannock IF (1970) On the existence of a G0 -phase in the cell cycle. Cell TissueKinet 3(4):321–334.
36. Mackey MC (1978) Unified hypothesis for the origin of aplastic anemia and periodichematopoiesis. Blood 51(5):941–956.
E886 | www.pnas.org/cgi/doi/10.1073/pnas.1324267111 Lei et al.
37. Arrow KJ, Levin SA (2009) Intergenerational resource transfers with random offspringnumbers. Proc Natl Acad Sci USA 106(33):13702–13706.
38. Mangel M, Ludwig D (1992) Definition and evaluation of the fitness of behavioral anddevelopmental programs. Annu Rev Ecol Syst 23:507–536.
39. Nowak MA (2006) Evolutionary Dynamics: Exploring the Equations of Life (BelknapPress of Harvard Univ Press, Cambridge, MA).
40. Dodd IB, Micheelsen MA, Sneppen K, Thon G (2007) Theoretical analysis of epigeneticcell memory by nucleosome modification. Cell 129(4):813–822.
41. Sennerstam R, Strömberg JO (1986) Cell growth and cell division: Dissociated andrandom initiated? A study performed on embryonal carcinoma cell lines. II. Cell TissueKinet 19(1):71–81.
42. Orr HA (2009) Fitness and its role in evolutionary genetics. Nat Rev Genet 10(8):531–539.
43. Bellmann R (1957) Dynamic Programming (Princeton Univ Press, Princeton), pp 11, 64, 70.44. Houston A, McNamara JM (1999) Models of Adaptive Behaviour (Cambridge Univ
Press, Cambridge, UK).45. Mangel M, Clark CW (1988) Dynamic Modeling in Behavioral Ecology (Princeton Univ
Press, Cambridge, UK).46. Bullough WS (1975) Mitotic control in adult mammalian tissues. Biol Rev Camb Philos
Soc 50(1):99–127.47. Challen GA, et al. (2012) Dnmt3a is essential for hematopoietic stem cell differentiation.
Nat Genet 44(1):23–31.
48. Hu G, et al. (2013) H2A.Z facilitates access of active and repressive complexes tochromatin in embryonic stem cell self-renewal and differentiation. Cell Stem Cell12(2):180–192.
49. Akbarzadeh S, et al. (2002) Tyrosine residues of the granulocyte colony-stimulatingfactor receptor transmit proliferation and differentiation signals in murine bonemarrow cells. Blood 99(3):879–887.
50. Pulsipher MA, et al. (2009) Adverse events among 2408 unrelated donors of periph-eral blood stem cells: Results of a prospective trial from the National Marrow DonorProgram. Blood 113(15):3604–3611.
51. Stroncek DF, et al. (1993) Experiences of the first 493 unrelated marrow donors in theNational Marrow Donor Program. Blood 81(7):1940–1946.
52. Price TH, Chatta GS, Dale DC (1996) Effect of recombinant granulocyte colony-stim-ulating factor on neutrophil kinetics in normal young and elderly humans. Blood88(1):335–340.
53. Silva M, et al. (1996) Erythropoietin can promote erythroid progenitor survival byrepressing apoptosis through Bcl-XL and Bcl-2. Blood 88(5):1576–1582.
54. Kasowski M, et al. (2013) Extensive variation in chromatin states across humans. Sci-ence 342(6159):750–752.
55. Kilpinen H, et al. (2013) Coordinated effects of sequence variation on DNA binding,chromatin structure, and transcription. Science 342(6159):744–747.
56. McVicker G, et al. (2013) Identification of genetic variants that affect histone modificationsin human cells. Science 342(6159):747–749.
Lei et al. PNAS | Published online February 5, 2014 | E887
APP
LIED
MATH
EMATICS
SYST
EMSBIOLO
GY
PNASPL
US
SEECO
MMEN
TARY
Supporting InformationLei et al. 10.1073/pnas.1324267111SI Text
S1. Model DescriptionIntercell Cycle Transformation. Our model describes the dynamicsof resting phase stem cell population Nt, and the distributiondensity of cell epigenetic states ftðxÞ. Here x is a variable repre-senting the epigenetic state of a cell, and subscript t indicates thetth cell cycle. At each cell cycle, cells undergo proliferation [witha probability βtðxÞ], apoptosis [with a probability μtðxÞ], and dif-ferentiation [with a probability δtðxÞ], so that ðNt; ftðxÞÞ changesfrom one cell cycle to the next:
ðNt; ftðxÞÞ↦ðNt+1; ft+1ðxÞÞ: [S1]
During each cell cycle, NtRftðxÞδtðxÞdx cells leave the resting
phase due to differentiation, and NtRftðxÞβtðxÞdx cells enter the
proliferation phase. Each cell in the proliferation phase eithergoes through apoptosis with a probability μtðxÞ or produces twodaughter cells. Here we omit the transitions between resting andquiescent phase. Hence, the cell population after mitosis is
Nt+1 =Nt −Nt
ZftðxÞδtðxÞdx−Nt
ZftðxÞβtðxÞdx
+ 2Nt
ZftðxÞβtðxÞð1− μtðxÞÞdx
=Nt
�1+
ZftðxÞ½ βtðxÞð1− 2μtðxÞÞ− δtðxÞ�dx
�:
The integrals are taken over all possible epigenetic states. Definethe observed proliferation probability as
βt;obs = 1+Z
ftðxÞ½βtðxÞð1− 2μtðxÞÞ− δtðxÞ�dx; [S2]
then
Nt+1 =Ntβt;obs: [S3]
Here βt;obs is the ratio of cell population numbers between twoconsecutive cell cycles.To obtain the transformation of ftðxÞ, we introduce a transition
probability pðx; yÞ, representing the probability that a daughtercell of state x comes from a mother cell of state y. Then
Zpðx; yÞdx= 1 [S4]
for all y.Similarly to the above argument, at each cell cycle, the
number of cells with state x is NtftðxÞ. After a cell division,NtftðxÞðδtðxÞ+ βtðxÞÞ cells with state x are removed from theresting phase due to differentiation and proliferation, and2Nt
Rftð yÞβtð yÞð1− μtð yÞÞpðx; yÞdy cells of state x are produced
after mitosis. Thus, after mitosis, the number of cells withstate x becomes
Nt+1ft+1ðxÞ=NtftðxÞ−NtftðxÞðδtðxÞ+ βtðxÞÞ+ 2Nt
Zftð yÞβtð yÞð1− μtðyÞÞpðx; yÞdy;
which gives
ft+1ðxÞ= 1βt;obs
�ftðxÞð1− ðδtðxÞ+ βtðxÞÞÞ
+ 2Z
ftð yÞβtð yÞð1− μtð yÞÞpðx; yÞdy�: [S5]
Eqs. S2, S3, and S5 together define transformation S1.
Evolutionary Fitness Function. To define an evolutionary fitnessfunction akin to natural selection, we first introduce a tissueperformance function Q, which depends on the cell populationthrough a function φðxÞ and the distribution density ftðxÞ througha cell performance function χðxÞ:
QðNt; ftðxÞÞ=φðNtÞZ
χðxÞftðxÞdx: [S6]
At each cell cycle, ðNt+1; ft+1ðxÞÞ changes according to [S3] and[S5], and depends on the quantities fβtðxÞ; γtðxÞ; δtðxÞg. Thus, givenðNt; ftðxÞÞ, we have
QðNt+1; ft+1ðxÞÞ=φðNt+1ÞZ
χðxÞft+1ðxÞdx
=φ�Ntβt;obs
� ZχðxÞ 1
βt;obs
hftðxÞ
�1−�δtðxÞ+ βtðxÞ
��
+2ftð yÞβtð yÞ�1− μtð yÞ
�pðx; yÞdy
idx
=φ�Ntβt;obs
�βt;obs
� ZχðxÞftðxÞð1− ðδtðxÞ+ βtðxÞÞÞdx
+ 2ZZ
χðxÞftð yÞβtð yÞð1− μtð yÞÞpðx; yÞdxdy�;
where βt;obs is defined by [S2]. Let
QðNt; ftðxÞjβtðxÞ; μtðxÞ; δtðxÞÞ
=φ�Ntβt;obs
�βt;obs
� ZχðxÞftðxÞ
�1−�δtðxÞ+ βtðxÞ
�dx
+ 2ZZ
χðxÞftð yÞβtð yÞ�1− μtð yÞ
�pðx; yÞdxdy
�;
[S7]
then
Q�Nt+1; ft+1ðxÞ
�=Q
�Nt; ftðxÞjβtðxÞ; μtðxÞ; δtðxÞ
; [S8]
which depends on βtðxÞ, μtðxÞ and δtðxÞ.In [S7], the proliferation probability βtðxÞ varies at each
cell cycle by epigenetic regulation; the apoptosis probabilityμtðxÞ= μGðxÞ+ μ̂tðxÞ in which μGðxÞ is the average probability athomeostasis and is selected through genetic mutations and μ̂tðxÞis random at each cell cycle due to epigenetic modulations.Similarly, the differentiation probability takes the form δtðxÞ=δGðxÞ+ δ̂tðxÞ in which δGðxÞ is the average probability at ho-meostasis and δ̂tðxÞ represents the epigenetic uncertainty.At each cell cycle, the proliferation βtðxÞ is controlled to
achieve maximum tissue performance in Q after one cell division
Lei et al. www.pnas.org/cgi/content/short/1324267111 1 of 11
in the face of uncertainties in apoptosis μtðxÞ and differentiationδtðxÞ. This leads to solving the corresponding Bellman conditionfor QðNt+1; ft+1ðxÞÞ:
EμtðxÞ;δtðxÞ maxβtðxÞ
Q�Nt; ftðxÞ
βtðxÞ; μtðxÞ; δtðxÞ; [S9]
where EμtðxÞ;δtðxÞ is the expectation with respect to apoptosis anddifferentiation probabilities during cell division.The procedure of solving [S9] is given below. At each cell cycle,
the expectations of μtðxÞ and δtðxÞ are given as
EμtðxÞ= μt−1ðxÞ; EδtðxÞ= δt−1ðxÞ:
The proliferation rate βtðxÞ is obtained by solving the Bellmancondition:
maxβtðxÞ
EQ�Nt; ftðxÞ
βtðxÞ; μtðxÞ; δtðxÞ
≈ maxβtðxÞ
φ�NtEβt;obs
�Eβt;obs
� ZχðxÞftðxÞ
�1−�δt−1ðxÞ+ βtðxÞ
�dx
+ 2ZZ
χðxÞftð yÞβtð yÞ�1− μt−1ð yÞ
�pðx; yÞdxdy
�;
where Eβt;obs is the expectation of the observed proliferationprobability
Eβt;obs = 1+Z
ftðxÞhβtðxÞ
�1− 2EμtðxÞ
�−EδtðxÞ
idx
= 1+Z
ftðxÞhβtðxÞ
�1− 2μt−1ðxÞ
�− δt−1ðxÞ
idx:
After βtðxÞ is solved by the Bellman condition, stochastic pertur-bations for μtðxÞ and δtðxÞ are introduced, resulting in
μtðxÞ= μGðxÞ+ μ̂tðxÞ; δtðxÞ= δGðxÞ+ δ̂tðxÞ: [S10]
Hence, the observed proliferation probability becomes
βt;obs = 1+Z
ftðxÞhβtðxÞ
�1− 2μtðxÞ
�− δtðxÞ
idx [S11]
with μtðxÞ and δtðxÞ given by [S10]. Consequently, the tissue state�Nt+1; ft+1ðxÞ
�becomes
Nt+1 =Ntβt;obs [S12]
ft+1ðxÞ= 1βt;obs
�ftðxÞ
�1−�δtðxÞ+ βtðxÞ
�
+ 2Z
ftð yÞβtð yÞ�1− μtð yÞ
�pðx; yÞdy
�: [S13]
Given ðμGðxÞ; δGðxÞÞ that are selected through genetic mutationsin long time, [S12] and [S13] define a lifespan dynamics of ðNt; ftðxÞÞ.The evolutionary fitness function is defined as the performance
at homeostasis after many cell divisions (i.e., t→∞):
W = limt→∞
Q�Nt; ftðxÞ
�: [S14]
The fitness W is dependent on the probabilities μGðxÞ and δGðxÞthat are selected through genetic mutations.
S2. Homeostasis StateNonlinear Integral Equations. During the development and matu-ration of an organism,
�Nt; ftðxÞ
�evolves following [S3] and [S5].
At homeostasis,�Nt; ftðxÞ
�approaches an equilibrium state, which
is represented as the limit as t→∞ (it may be more accurate to bereferred to as the average of the limits when there are stochasticfluctuations).Let
�N; f ðxÞ; βðxÞ; μGðxÞ; δGðxÞ
�be averages of the limits�
Nt; ftðxÞ; βtðxÞ; μtðxÞ; δtðxÞ�when t→∞. At homeostasis, the stem
cell population reaches equilibrium and therefore βt;obs → 1 ast→∞, which yields
Zf ðxÞ
�βðxÞ�1− 2μGðxÞ
�− δGðxÞ
�dx= 0: [S15]
Furthermore, from [S5] the homeostasis tissue epigenetics f ðxÞsatisfies integral equation
f ðxÞ= f ðxÞ�1− �δGðxÞ+ βðxÞ��+ 2Z
f ð yÞβð yÞð1− μGð yÞÞpðx; yÞdy;[S16]
or equivalently,
f ðxÞ=2Z
f ðyÞβðyÞ�1− μGðyÞ�pðx; yÞdy
δGðxÞ+ βðxÞ ; [S17]
with a normalization conditionZ
f ðxÞdx= 1: [S18]
Thus, for given functions μGðxÞ, δGðxÞ, and pðx; yÞ, the prolifera-tion βðxÞ and distribution density f ðxÞ are given by nonnegativesolutions of the nonlinear integral Eqs. S15, S17, and S18.The mathematical questions related to the existence and
uniqueness of nonnegative solutions of [S15], [S17], and [S18] areleft for future study. Here, we only investigate a simple case forillustration.
Heterogeneous Apoptosis Can Improve the Maintenance of TissueEpigenetics. We assume all cells are homogeneous in proliferationso that βðxÞ is independent of x. Consequently, [S15] gives
β=
Zf ðxÞδGðxÞdxZ
f ðxÞ�1− 2μGðxÞ�dx; [S19]
and [S17] can be rewritten as a nonlinear integral equation
f ðxÞ=2ZZ
f ð yÞf ðzÞδGðzÞ�1− μGð yÞ
�pðx; yÞdydzZ
f ð yÞ�δGðxÞ
�1− 2μGð yÞ
�+ δGð yÞ
dy
: [S20]
Next we show that if μGðxÞ is independent of x, the tissueepigenetics at homeostasis is abnormal. We consider a specificsituation in which each cell only takes one of the two discreteepigenetic states, with x∈Ω1 implying a defective cell and x∈Ω2
a normal cell. The functions δGðxÞ and pðx; yÞ are given by piece-wise constant functions:
δGðxÞ=�δ1; x∈Ω1δ2; x∈Ω2;
Lei et al. www.pnas.org/cgi/content/short/1324267111 2 of 11
and
pðx; yÞ=�p1ðxÞ; y∈Ω1p2ðxÞ; y∈Ω2;
and let
pi; j =Z
x∈Ωi
pjðxÞdx; ði; j= 1; 2Þ: [S21]
Furthermore, we make the following assumptions to induce nor-mal differentiated cells and reduce defective cells number:
1. Defective cells have smaller differentiation probabilities thannormal cells ðδ1 ≤ δ2Þ.
2. The transition rate from defective to normal cells is smallerthan that of the reverse transition ðp2;1 ≤ p1;2Þ.Denoting
f1 =Z
y∈Ω1
f ðyÞdy; f2 =Z
y∈Ω2
f ðyÞdy; [S22]
and taking x∈Ω1, [S20] becomes [we note μGðyÞ= μ beinga constant]
f ðxÞ= 2ð f1δ1 + f2δ2Þð1− μÞ� f1p1ðxÞ+ f2 p2ðxÞ�
δ1ð1− 2μÞ+ f1δ1 + f2δ2: [S23]
Integrating [S23] over x∈Ω1, we obtain
f1 =2ð f1δ1 + f2δ2Þð1− μÞ� f1p1;1 + f2 p1;2
�δ1ð1− 2μÞ+ f1δ1 + f2δ2
: [S24]
Since f2 = 1− f1, [S24] is an equation of f1 in the form
F1ð f1Þ=F2ð f1Þ; [S25]
where
F1ð f1Þ= f1�δ1ð1− 2μÞ+ δ2 − ðδ2 − δ1Þf1
�;
F2ðf1Þ= 2ð1− μÞ�δ2 − ðδ2 − δ1Þf1��
f1�p1;1 − p1;2
�+ p1;2
�:
We note that both F1ð f1Þ and F2ð f1Þ are quadratic functions off1. There are two roots of F1ð f1Þ= 0
�0 and ð1− 2μÞδ1 + δ2
δ2 − δ1
, and two
roots of F2ð f1Þ= 0�− p12
p11 − p12ð<0Þ and δ2
δ2 − δ1
�< ð1− 2μÞδ1 + δ2
δ2 − δ1
. Then
the equation F1ð f1Þ=F2ð f1Þ has a unique solution f p1 in the in-
terval�0; δ2
δ2 − δ1
(Fig. S1). Here f p1 gives the percentage of de-
fective cells. Furthermore, if F1ðzÞ≤F2ðzÞ then f p1 ≥ z (see Fig. S1for an illustration).Now, from the above two assumptions,
F1
�12
�=12
�ð1− 2μÞδ1 + 1
2ðδ1 + δ2Þ
�
=12ð1− μÞðδ1 + δ2Þ− 1
2�δ2 + μðδ2 − δ1Þ
�
≤12ð1− μÞðδ1 + δ2Þ;
and
F2
�12
�=
12ð1− μÞðδ1 + δ2Þðp11 + p12Þ
≥12ð1− μÞðδ1 + δ2Þðp11 + p21Þ
=12ð1− μÞðδ1 + δ2Þ:
Thus, F1�12
�<F2
�12
�and hence f p1 ≥
12. This result indicates that
more than half of the cells are defective at homeostasis, anabnormal or a disease state for a tissue.
S3. Optimal Control StrategiesThe Problem of Variation. At each cell cycle, the proliferationprobability βtðxÞ is determined by Bellman condition S9. From[S9], the function βtðxÞ is taken so that the expectation ofQ�Nt+1; ft+1ðxÞ
�reaches the maximum, with
�Nt+1; ft+1ðxÞ
�given
by�Nt; ftðxÞ
�through [S2], [S3], and [S5].
First, we show that Bellman condition S9 alone is not sufficientto determine the function βtðxÞ, and thus additional restrictionsare required for a well-posed problem.We assume that in the tissue μtðxÞ and δtðxÞ are known before
the proliferation βtðxÞ is chosen. Define a functional
A½βt�=QðNt+1; ft+1ðxÞÞ=φðNt+1ÞZ
χðxÞft+1ðxÞdx: [S26]
Here Nt+1 and ft+1ðxÞ depend on βt through [S2], [S3], and [S5].If A½βt� attains its local minimum at β0 and ηðxÞ is an arbitraryfunction,
A½ β0� ≤ A�β0 + «η
[S27]
for any small number «. Therefore, the variation of A at βt = β0must vanish,
dA½β0 + «η�d«
«=0
=
"φ′ðNt+1Þ
ZχðxÞft+1ðxÞdx dNt+1
d«
+φðNt+ 1ÞdZ
χðxÞft+ 1ðxÞdxd«
#«=0
= 0:
[S28]
A direct calculation yields
dNt+1
d«
«=0
=Nt
ZηðxÞftðxÞð1− 2μtðxÞÞdx
and
dZ
χðxÞft+1ðxÞdxd«
«=0
=1
βt;obsft+1ðxÞ
�ZηðxÞftðxÞ
�1− 2μtðxÞ
�dx�
+1
βt;obs
×�−ηðxÞftðxÞ+ 2
Zηð yÞftð yÞð1− μtð yÞÞpðx; yÞdy
�:
Lei et al. www.pnas.org/cgi/content/short/1324267111 3 of 11
Here βt;obs and ft+1ðxÞ are given by [S2] and [S5], respectively, butwith βt = β0. Thus, Eq. S28 yields, for an arbitrary function ηðxÞ,
0=φ′ðNt+1ÞNt+1
�Z
χðxÞft+1ðxÞdx��Z
ηðxÞftðxÞ�1− 2μtðxÞ
�dx�
+ 2φðNt+1ÞZ
ηð yÞftð yÞ�1− μtð yÞ
�pðx; yÞdy
+φðNt+1Þft+1ðxÞZ
ηð yÞftð yÞ�1− 2μtðyÞ
�dy
−φðNt+1ÞηðxÞftðxÞ:
[S29]
It is impossible to find a function β0ðxÞ that solves [S29] witharbitrary x and function ηðxÞ.The above argument shows that Bellman condition S9 does not
have a solution for a general function βtðxÞ, and thus additionalconditions are required.For a particular biological system, there are additional restric-
tions to the proliferation.We consider two types of stem cells oftenseen in biological systems, namely either homogeneous or het-erogeneous in their proliferation. For stem cells homogenous intheir proliferation, the function βtðxÞ is independent of x (but maychange with t); for stem cells heterogeneous in proliferation, thefunction βtðxÞ varies with x.
Homogeneous in Proliferation (Strategy A). Formulation of the proliferationprobability. For cells homogeneous in their proliferation, the pro-liferation probability βt is independent of the epigenetic state x. It isimplicitly assumed that cells know the expected apoptosis proba-bility μtðxÞ and the differentiation probability δtðxÞ before deter-mining the proliferation probability βt. For example, a simplestrategy is to assume the expectations of these two probabilitiesequal the current values while determining βt, i.e., assumingEμtðxÞ= μt−1ðxÞ and EδtðxÞ= δt−1ðxÞ.Since βt is a constant, the optimal value is given by
∂QðNt+1; ft+1ðxÞÞ=∂βt = 0, which yields
0=φ′ðNt+1Þ ∂Nt+1
∂βt
ZχðxÞft+1ðxÞ
+φðNt+1ÞZ
χðxÞ ∂ft+1ðxÞ∂βt
dx:
[S30]
Let
μt =Z
ftðxÞμtðxÞdx; δt =Z
ftðxÞδtðxÞdx;
χt =Z
ftðxÞχðxÞdx; dt =Z
ftðxÞχðxÞδtðxÞdx;
σð yÞ=Z
χðxÞpðx; yÞdx; σt =
Zftð yÞð1− μtð yÞÞσð yÞdy
1− μt;
then we have
∂Nt+1
∂βt=Ntð1− 2μtÞ;
∂ft+1ðxÞ∂βt
= −ft+1ðxÞNt+1
∂Nt+1
∂βt+
Nt
Nt+1
×�−ftðxÞ+ 2
ZftðyÞð1− μtðyÞÞpðx; yÞdy
�:
Thus, [S30] becomes
Ntβt;obsφ′�Ntβt;obs
�φ�Ntβt;obs
� =At; [S31]
where
At = 1−σtχt+1
−σt − χt
ð1− 2μtÞχt+1;
χt+1 =χt − dt + βtð2ð1− μtÞσt − χtÞ
βt;obs
and
βt;obs = 1+ βtð1− 2μtÞ− δt: [S32]
The theoretical optimal strategy βt is obtained from a solution of[S31] and [S32]. In addition, we note a biologically acceptableproliferation probability is always nonnegative, and must be lessthan a maximum value βmax that is limited by its biological capabil-ity. Thus, the possible proliferation probability takes values withinthe interval ½0; βmax�. We set the probability βt = 0 if the βt obtainedabove is less than 0, and set βt = βmax if it is larger than βmax.Assume the population performance φðNÞ is maximum at
N =Np, i.e., φ′ðNpÞ= 0 and φ″ðNpÞ< 0. Here Np is by definitionthe fittest cell population of the tissue. In [S31], if At is close to 0,we have approximately
βt;obs ≈1Np
�Np +
AtφðNpÞNpφ″ðNpÞ
�; [S33]
or equivalently,
βt ≈
1Nt
�Np +
AtφðNpÞNpφ″ðNpÞ
�− 1+ δt
1− 2μt: [S34]
Therefore,
Nt+1 ≈Np +AtφðNpÞNpφ″ðNpÞ; [S35]
which yields Nt ≈Np when At is close to 0. Thus, [S34] indicatesa negative feedback when the cell population is close to the valueof the fittest population (Fig. S2A).
Tissue dynamics based on strategy A. Fig. S2 shows numericalsimulations obtained from the above control strategy. Fig. S2Aplots the decreasing dependence of proliferation probability oncell population. Fig. S2B shows the time course of the perfor-mance QðNt; ftðxÞÞ in a simulation of 5,000 cell cycles. Fig. S2Cgives ftðxÞ at the early, intermediate, and later temporal points inthe simulation.
Epigenetic dependences are required for robust development and evolution.In this study, the dependences of δ; μ; χ on the epigenetic state aresignificant in regulation. Here we study the importance of epigeneticdependence in robust development and evolution.From [S3] and [S5], the dynamics of population and average
cell performance ðNt; χtÞ are given by
�Nt
χt
�↦
Ntβt;obs
χt − dt + βtð2ð1− μtÞσt − χtÞβt;obs
375
264 [S36]
Lei et al. www.pnas.org/cgi/content/short/1324267111 4 of 11
Here
βt =βt;obs − 1+ δt
1− 2μt: [S37]
Eqs. S5, S31, S36, and S37 together define a dynamical systemfor ðNt; χtÞ. This dynamical system reaches a statistical equilibriumstate when t→∞. Thus, the expectation Eβt;obs → 1 and the limits
N = limt→∞
ENt; χ = limt→∞
E χt
are well defined. In this case, we have
Nφ′ðNÞφðNÞ = lim
t→∞EAt [S38]
and
χ = limt→∞
E�σt + ð1− 2μtÞ
�σt − dt=δt
� : [S39]
Eqs. S38 and S39 give the population N and average perfor-mance χ at homeostasis.If the performance function χ is independent of the state x
(i.e., χt = σt = χ for any t), we have N =Np and therefore theevolutionary fitness W = χφðNpÞ is independent of the apoptosisprobability μðxÞ. Hence, the apoptosis response fails to evolvebased on the evolutionary fitness W. This result suggests thatvariability in cell performance is necessary for successful naturalselection for apoptosis.When the cell fitness χðxÞ varies with x, [S35] indicates N ≠Np,
i.e., the cell population at homeostasis differs from the value ofthe fittest population, and the difference ΔN = jN −Npj is pro-portional to Δχ = jσ − χj. We note that Δχ measures the differ-ence between the performance of mother cells and theirdaughter cells, and is in turn determined by pðx; yÞ—the variationbetween daughter cells and the mother cell due to epigeneticstate transition in cell division. Simulations show that if thedaughter cells are identical to their mother cells, i.e.,
pðx; yÞ=�1 x= y0 x≠ y;
[S40]
then N =Np, and the tissue epigenetics f ðxÞ at homeostasis isdependent on the initial cell distributions (Fig. S3). We note thatchanges in cell distributions during a lifetime can be induced byaccidental injury. Thus, the above analysis suggest that the tran-sition of epigenetic state in cell division is necessary for a robusttissue epigenetics at homeostasis with respect to accidentalchanges in life span, but can shift the stem cell population awayfrom the value of the fittest population.
Heterogeneous in Proliferation (Strategy B). Formulation of theproliferation probability. For stem cells heterogeneous in pro-liferation, βtðxÞ varies with the epigenetic state x. Here we studya simple situation in which cells take two distinct proliferationprobabilities.We divide all stem cells into two phenotypes by their epigenetic
state x, with x∈Ω1 for type I cells, and x∈Ω2 for type II cells.Proliferation probabilities are the same for cells of the same type:
βtðxÞ=�βt;1; x∈Ω1βt;2; x∈Ω2
: [S41]
Weassume that the proliferation of type II cells is modulated suchthat βt;2 changes at each cell cycle, while the proliferation of type
I cells is unmodulated over the lifetime (βt;1 ≡ β1;G is geneticallyregulated).Based on the above assumptions, the proliferation βt;2, for given
βt;1 ≡ β1;G, μtðxÞ and δtðxÞ, is determined by ∂QðNt+1; ft+1ðxÞÞ=∂βt;2 = 0, i.e.,
χt+1φ′ðNt+1Þ ∂Nt+1
∂βt;2+φðNt+1Þ ∂χt+1∂βt;2
= 0; [S42]
which gives
Nt+1φ′ðNt+1ÞφðNt+1Þ
= 1−2ZΩ2
ftð yÞð1− μtð yÞÞσtð yÞdy−ZΩ2
ftðxÞχðxÞdx
χt+1
ZΩ2
ftðxÞð1− 2μtðxÞÞdx;
[S43]
with Nt+1 =Ntβt;obs.At each cell cycle, the optimal proliferation probability βt;2 is
obtained based on Eq. S43.To solve Eq. S43, we denote
f t;1 =ZΩ1
ftðxÞdx; f t;2 =ZΩ2
ftðxÞdx;
μt;1 =ZΩ1
ftðxÞμtðxÞdx; μt;2 =ZΩ2
ftðxÞμtðxÞdx;
χt;1 =ZΩ1
ftðxÞχðxÞdx; σt;1 =
ZΩ1
ftðxÞð1− μtðxÞÞσðxÞdxft;1 − μt;1
;
χt;2 =ZΩ2
ftðxÞχðxÞdx; σt;2 =
ZΩ2
ftðxÞð1− μtðxÞÞσðxÞdxft;2 − μt;2
:
Then,
βt;obs = 1+ β1;G
�f t;1 − 2μt;1
+ βt;2
�f t;2 − 2μt;2
− δt; [S44]
and
χt+1 =1
βt;obs
ZχðxÞftðxÞð1− δtðxÞ− βtðxÞÞdx
+2
βt;obs
Zf ð yÞβtð yÞð1− μtðyÞÞσð yÞdy
=1
βt;obs
h�χt − d
�t − β1;Gχt;1 − βt;2χt;2
+ 2β1;G�f t;1 − μt;1
�σt;1 + 2βt;2
�f t;2 − μt;2
�σt;2i
=1
βt;obs
�χt − d
�t − β1;G
�χt;1 − 2
�f t;1 − μt;1
�σt;1
h
−βt;2�χt;2 − 2
�f t;2 − μt;2
�σt;2i
: [S45]
Thus, we can rewrite [S43] as
Lei et al. www.pnas.org/cgi/content/short/1324267111 5 of 11
Ntβt;obsφ′�Ntβt;obs
�φ�Ntβt;obs
� =At′ [S46]
with
At′= 1−σt;2χt+1
−ft;2σt;2 − χt;2
χt+1
�ft;2 − 2μt;2
: [S47]
The proliferation βt;2 is obtained from the positive solution ofEqs. S44–S47.Similarly to the previous argument, whenNt ≈Np andAt′≈ 0, we
have
βt;obs ≈1Np
�Np +
At′φðNpÞNpφ″ðNpÞ
�; [S48]
and hence
βt;2 ≈1Nt
�Np +
At′φðNpÞNp φ″ðNpÞ
− 1− β1;G
�f t;1 − 2μt;1
+ δt
f t;2 − 2μt;2: [S49]
Tissue dynamics based on strategy B. Based on the previousarguments, the proliferation probability of type II cells at ho-meostasis, denoted as β2, is dependent on the probability of typeI cells β1;G. Fig. S4A shows the dependences of β2 and the evo-lutionary fitness W on β1;G (varying from 0 to 0.1). Simulationssuggest that the proper value of the unmodulated proliferationprobability β1;G can improve the evolutionary fitness comparedwith the case of homogeneous proliferation (the correspondingevolutionary fitness is shown by the red dashed line in Fig. S4A).We also note that if β1;G is too large (β1;G > 0:08 in the currentsimulation), it is possible to induce uncontrolled growth such thatthe fitness decreases to 0. Fig. S4B shows tissue epigenetics f ðxÞ athomeostasis with β1;G = 0:02 and β1;G = 0:06, respectively. Whenβ1;G = 0:02, the tissue epigenetics has the same profile as in thecase of homogenous proliferation (Fig. S2C), and when β1;G = 0:06(with better fitness), the epigenetic distribution shows apparentshift to the region of better performance (corresponding to theregion of larger x).
Robust recovery after sudden changes.Fig. S5 shows tissue response(cell population, differentiated cell population, and cell dis-tributions) to temporal changes in differentiation. In simulations,the immigration of dormant cells from the quiescent phase to theresting phase is taken into account in a simple way by introducinga sudden increase ð10%Þ of the resting phase cell population atthe time point ðt= 1; 000Þ along with an increase in the differ-entiation probability. We observe a transient rise and fall of cellpopulations in the resting phase due to the addition of resting-phase cells to the model, however, with similar long-time dy-namics shown in Fig. 4. The overall features are found to besimilar to those obtained without considering the effect of thequiescent phase.Fig. S6 shows cell population dynamics, under three different
strategies, when there are temporary changes in the apoptosisprobability. The results indicate that heterogeneity in proliferationinduces less changes in cell populations than the cases of homo-geneous proliferation.
S4. EvolutionThe evolutionary fitness W defined by [S14] is a function of μGðxÞand δGðxÞ. Here we keep δGðxÞ unchanged and study the evolutionof the apoptosis probability μGðxÞ via the fitness function W.Fig. S7 shows a numerical simulation for the evolution of μGðxÞ
when the cells are homogeneous in proliferation. In the simulation,
the apoptosis μGðxÞ starts from a constant function ðμGðxÞ≡ 0:07Þwith a low fitness ðW = 0:18Þ, and automatically evolves to yielda high fitness (W = 1:8) at the end of the simulation. The resultingapoptosis is taken such that cells with lower performance (cells withx< 60) have larger apoptosis probability. Consequently, the tissueepigenetics f ðxÞ at homeostasis shifts from the profile of low-performance cells being dominant to that of high-performance cellsbeing dominant (Fig. S7B). Furthermore, simulations show that theevolution obviously increases the average cell fitness (χ increasesfrom 0.10 to 0.98 in the simulation), but only results in smallchanges in the cell population N. Further simulations show that theresults are robust and insensitive to the choices of initial apoptosisprobability (Fig. S8).We also test our results using different functions for the dif-
ferentiation δGðxÞ (Fig. S9). Simulations suggest that differentdifferentiation probabilities can give the same value of evolu-tionary fitness after a number of mutations, and the resulting apo-ptosis probability and tissue epigenetics at homeostasis are in-sensitive to δGðxÞ.S5. Details for Numerical SimulationsParameter Values and Choices of Functions in the Model. In simu-lating the model, we need to specify the five functions pðx; yÞ,μGðxÞ, δGðxÞ, χðxÞ, and φðNÞ.For simplicity, we assume the epigenetic state can be represented
as a scalar variable x∈ ½0;Xmax�. For example, x can be the ex-pression level of one gene, or the number of nucleosome mod-ifications of a DNA region. In general, x represents an intrinsiccellular state that may change after each cell division. Without lossof generality, the four functions χðxÞ, δGðxÞ, μGðxÞ, and pðx; yÞ arechosen in a consistent way, as seen in Fig. S10. In particular, be-cause x can be transformed into different values by shifting andreflecting its values, without loss of generality, the region of smallvalues of x corresponds to the low value of the performancefunction χðxÞ. Together, we assume the following characteristics ofthe five functions:
i) A cell has low performance (low capability of accomplishingits physiological function) when x< 60, and it has high per-formance when 100< x<Xmax = 300.
ii) Cells defined in the region of 100< x< 140 at resting phasehave larger differentiation probability ðδGðxÞÞ than the othercells.
iii) Cells with 80< x< 160 at the proliferative phase have smallerapoptosis probability ðμGðxÞÞ, as they have larger differentia-tion probability.
iv) The transition probability pðx; yÞ is taken in a form such thatonly local changes in the epigenetic state are allowed in eachcell division.
v) Function φðNÞ is concave with a maximum value at N = 1since we normalize the fittest population to Np = 1.
All simulation codes are written in MATLAB (MathWorks)(available upon request). Those functions, as plotted in Fig. S10,then take the following forms in MATLAB:
χðxÞ= 0:1+ 0:9× gamcdfðx; 40; 2Þ;
δGðxÞ= 0:01+ 0:4×normpdfðx; 120; 20Þ;
μGðxÞ= 0:35− 27×normpdfðx; 120; 40Þ;
φðNÞ= ðcNÞ2e−ðcN − 1Þ2 ; c=� ffiffiffi
5p
+ 1.
2;
and for ðx; yÞ∈ ½0; 300�× ½0; 300�
Lei et al. www.pnas.org/cgi/content/short/1324267111 6 of 11
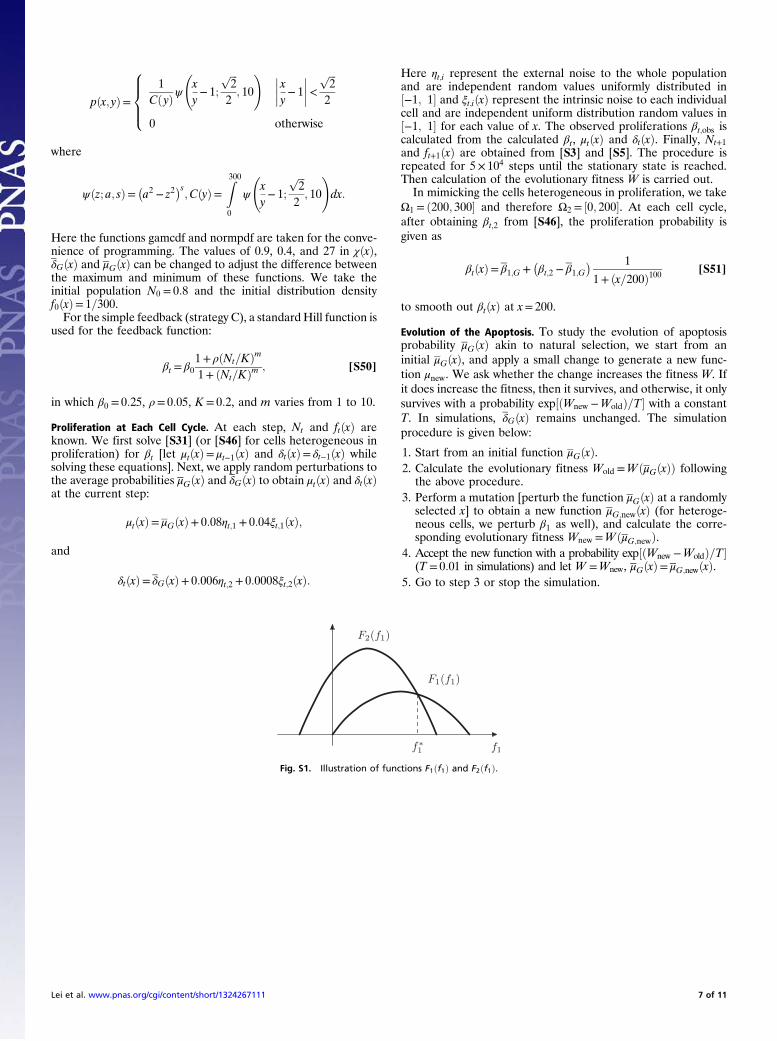
pðx; yÞ=1
Cð yÞψ xy− 1;
ffiffiffi2
p
2; 10
! xy− 1<
ffiffiffi2
p
2
0 otherwise
8>><>>:
where
ψðz; a; sÞ= �a2 − z2�s;CðyÞ=
Z300
0
ψ
xy− 1;
ffiffiffi2
p
2; 10
!dx:
Here the functions gamcdf and normpdf are taken for the conve-nience of programming. The values of 0.9, 0.4, and 27 in χðxÞ,δGðxÞ and μGðxÞ can be changed to adjust the difference betweenthe maximum and minimum of these functions. We take theinitial population N0 = 0:8 and the initial distribution densityf0ðxÞ= 1=300.For the simple feedback (strategy C), a standard Hill function is
used for the feedback function:
βt = β01+ ρðNt=KÞm1+ ðNt=KÞm ; [S50]
in which β0 = 0:25, ρ= 0:05, K = 0:2, and m varies from 1 to 10.
Proliferation at Each Cell Cycle. At each step, Nt and ftðxÞ areknown. We first solve [S31] (or [S46] for cells heterogeneous inproliferation) for βt [let μtðxÞ= μt−1ðxÞ and δtðxÞ= δt−1ðxÞ whilesolving these equations]. Next, we apply random perturbations tothe average probabilities μGðxÞ and δGðxÞ to obtain μtðxÞ and δtðxÞat the current step:
μtðxÞ= μGðxÞ+ 0:08ηt;1 + 0:04ξt;1ðxÞ;
and
δtðxÞ= δGðxÞ+ 0:006ηt;2 + 0:0008ξt;2ðxÞ:
Here ηt;i represent the external noise to the whole populationand are independent random values uniformly distributed in½−1; 1� and ξt;iðxÞ represent the intrinsic noise to each individualcell and are independent uniform distribution random values in½−1; 1� for each value of x. The observed proliferations βt;obs iscalculated from the calculated βt, μtðxÞ and δtðxÞ. Finally, Nt+1and ft+1ðxÞ are obtained from [S3] and [S5]. The procedure isrepeated for 5× 10⁴ steps until the stationary state is reached.Then calculation of the evolutionary fitness W is carried out.In mimicking the cells heterogeneous in proliferation, we take
Ω1 = ð200; 300� and therefore Ω2 = ½0; 200�. At each cell cycle,after obtaining βt;2 from [S46], the proliferation probability isgiven as
βtðxÞ= β1;G +�βt;2 − β1;G
� 1
1+ ðx=200Þ100[S51]
to smooth out βtðxÞ at x= 200.
Evolution of the Apoptosis. To study the evolution of apoptosisprobability μGðxÞ akin to natural selection, we start from aninitial μGðxÞ, and apply a small change to generate a new func-tion μnew. We ask whether the change increases the fitness W. Ifit does increase the fitness, then it survives, and otherwise, it onlysurvives with a probability exp½ðWnew −WoldÞ=T� with a constantT. In simulations, δGðxÞ remains unchanged. The simulationprocedure is given below:
1. Start from an initial function μGðxÞ.2. Calculate the evolutionary fitness Wold =W ðμGðxÞÞ following
the above procedure.3. Perform a mutation [perturb the function μGðxÞ at a randomly
selected x] to obtain a new function μG;newðxÞ (for heteroge-neous cells, we perturb β1 as well), and calculate the corre-sponding evolutionary fitness Wnew =W ðμG;newÞ.
4. Accept the new function with a probability exp½ðWnew −WoldÞ=T�(T = 0:01 in simulations) and let W =Wnew, μGðxÞ= μG;newðxÞ.
5. Go to step 3 or stop the simulation.
Fig. S1. Illustration of functions F1ðf1Þ and F2ðf1Þ.
Lei et al. www.pnas.org/cgi/content/short/1324267111 7 of 11
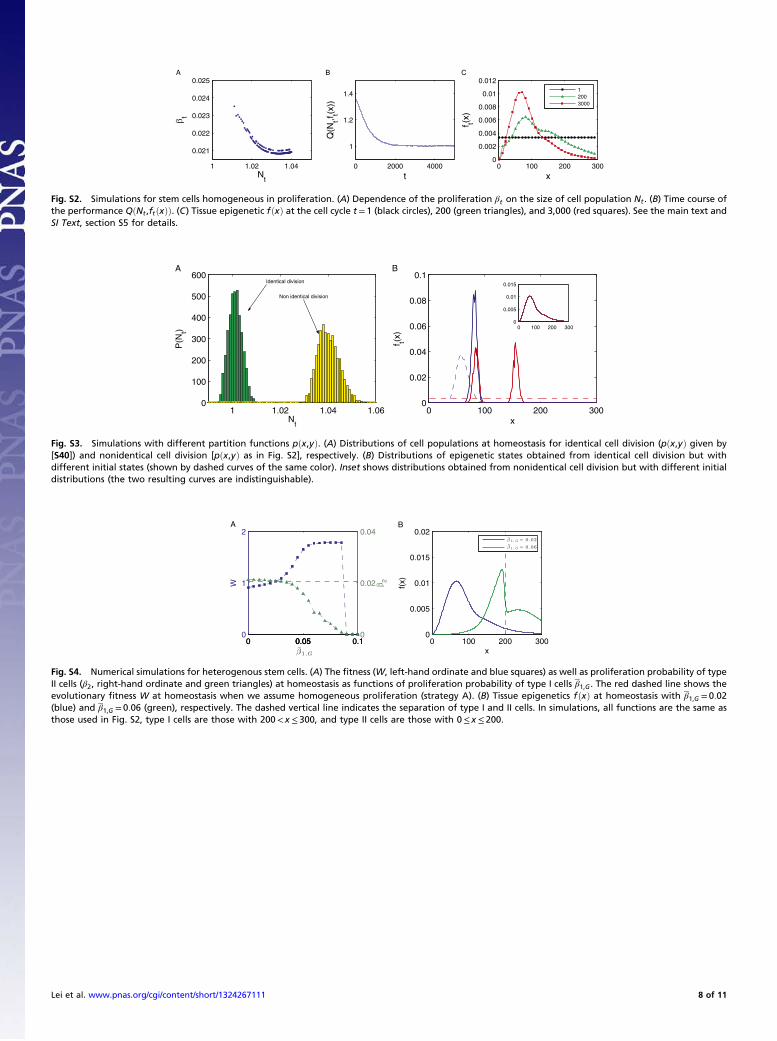
1 1.02 1.04
0.021
0.022
0.023
0.024
0.025
Nt
β t
A
0 2000 4000
1
1.2
1.4
t
Q(N
t,f t(x))
B
0 100 200 3000
0.002
0.004
0.006
0.008
0.01
0.012
x
f t(x)
C
12003000
Fig. S2. Simulations for stem cells homogeneous in proliferation. (A) Dependence of the proliferation βt on the size of cell population Nt . (B) Time course ofthe performance QðNt ,ftðxÞÞ. (C) Tissue epigenetic fðxÞ at the cell cycle t = 1 (black circles), 200 (green triangles), and 3,000 (red squares). See the main text andSI Text, section S5 for details.
1 1.02 1.04 1.060
100
200
300
400
500
600
Nt
P(N
t)
A
0 100 200 3000
0.02
0.04
0.06
0.08
0.1
x
f t(x)
B
0 100 200 3000
0.005
0.01
0.015Identical division
Non identical division
Fig. S3. Simulations with different partition functions pðx,yÞ. (A) Distributions of cell populations at homeostasis for identical cell division (pðx,yÞ given by[S40]) and nonidentical cell division [pðx,yÞ as in Fig. S2], respectively. (B) Distributions of epigenetic states obtained from identical cell division but withdifferent initial states (shown by dashed curves of the same color). Inset shows distributions obtained from nonidentical cell division but with different initialdistributions (the two resulting curves are indistinguishable).
0 0.05 0.10
1
2
W
A
0 0.05 0.10
0.02
0.04
0 100 200 3000
0.005
0.01
0.015
0.02
x
f(x)
B
Fig. S4. Numerical simulations for heterogenous stem cells. (A) The fitness (W, left-hand ordinate and blue squares) as well as proliferation probability of typeII cells (β2, right-hand ordinate and green triangles) at homeostasis as functions of proliferation probability of type I cells β1,G. The red dashed line shows theevolutionary fitness W at homeostasis when we assume homogeneous proliferation (strategy A). (B) Tissue epigenetics fðxÞ at homeostasis with β1,G = 0:02(blue) and β1,G = 0:06 (green), respectively. The dashed vertical line indicates the separation of type I and II cells. In simulations, all functions are the same asthose used in Fig. S2, type I cells are those with 200< x ≤ 300, and type II cells are those with 0≤ x ≤ 200.
Lei et al. www.pnas.org/cgi/content/short/1324267111 8 of 11
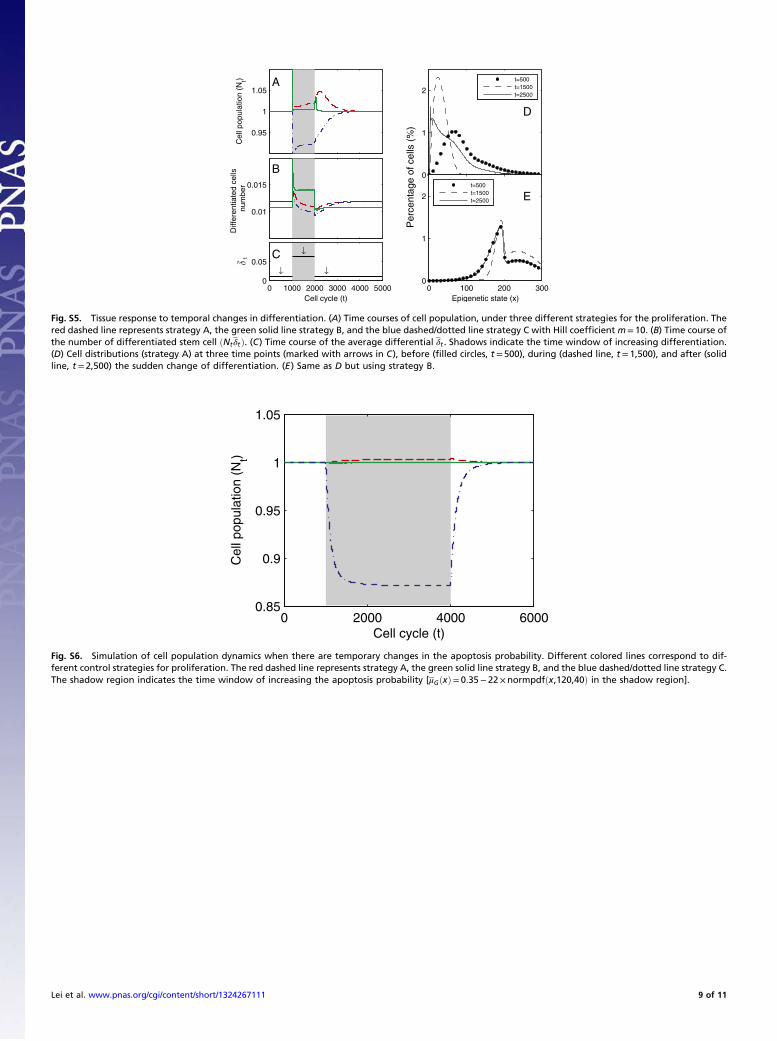
0.95
1
1.05
Cel
l pop
ulat
ion
(Nt) A
0.01
0.015
Diff
eren
tiate
d ce
llsnu
mbe
r
B
0 1000 2000 3000 4000 50000
0.05
Cell cycle (t)
C
0
1
2
D
t=500t=1500t=2500
0 100 200 3000
1
2
Epigenetic state (x)
Per
cent
age
of c
ells
(%
)
Et=500t=1500t=2500
Fig. S5. Tissue response to temporal changes in differentiation. (A) Time courses of cell population, under three different strategies for the proliferation. Thered dashed line represents strategy A, the green solid line strategy B, and the blue dashed/dotted line strategy C with Hill coefficient m= 10. (B) Time course ofthe number of differentiated stem cell ðNtδtÞ. (C) Time course of the average differential δt . Shadows indicate the time window of increasing differentiation.(D) Cell distributions (strategy A) at three time points (marked with arrows in C), before (filled circles, t = 500), during (dashed line, t = 1,500), and after (solidline, t = 2,500) the sudden change of differentiation. (E) Same as D but using strategy B.
0 2000 4000 60000.85
0.9
0.95
1
1.05
Cell cycle (t)
Cel
l pop
ulat
ion
(Nt)
Fig. S6. Simulation of cell population dynamics when there are temporary changes in the apoptosis probability. Different colored lines correspond to dif-ferent control strategies for proliferation. The red dashed line represents strategy A, the green solid line strategy B, and the blue dashed/dotted line strategy C.The shadow region indicates the time window of increasing the apoptosis probability [μGðxÞ= 0:35−22×normpdfðx,120,40Þ in the shadow region].
Lei et al. www.pnas.org/cgi/content/short/1324267111 9 of 11
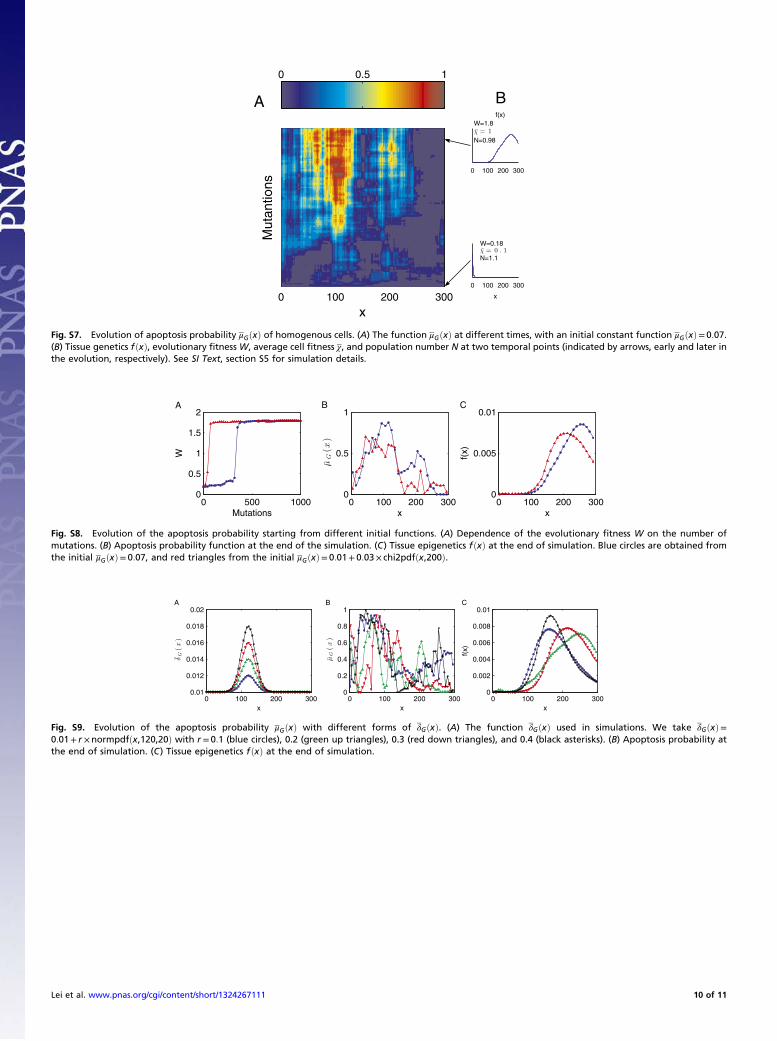
0 100 200 300
x
Mut
antio
ns
A
0 0.5 1
0 100 200 300
x
W=0.18
N=1.1
0 100 200 300
W=1.8
N=0.98
Bf(x)
Fig. S7. Evolution of apoptosis probability μGðxÞ of homogenous cells. (A) The function μGðxÞ at different times, with an initial constant function μGðxÞ= 0:07.(B) Tissue genetics fðxÞ, evolutionary fitness W, average cell fitness χ, and population number N at two temporal points (indicated by arrows, early and later inthe evolution, respectively). See SI Text, section S5 for simulation details.
0 500 10000
0.5
1
1.5
2
Mutations
W
A
0 100 200 3000
0.5
1
x
B
0 100 200 3000
0.005
0.01
x
f(x)
C
Fig. S8. Evolution of the apoptosis probability starting from different initial functions. (A) Dependence of the evolutionary fitness W on the number ofmutations. (B) Apoptosis probability function at the end of the simulation. (C) Tissue epigenetics fðxÞ at the end of simulation. Blue circles are obtained fromthe initial μGðxÞ= 0:07, and red triangles from the initial μGðxÞ= 0:01+ 0:03× chi2pdfðx,200Þ.
0 100 200 3000.01
0.012
0.014
0.016
0.018
0.02
x
A
0 100 200 3000
0.2
0.4
0.6
0.8
1
x
B
0 100 200 3000
0.002
0.004
0.006
0.008
0.01
f(x)
x
C
Fig. S9. Evolution of the apoptosis probability μGðxÞ with different forms of δGðxÞ. (A) The function δGðxÞ used in simulations. We take δGðxÞ=0:01+ r ×normpdfðx,120,20Þ with r = 0:1 (blue circles), 0.2 (green up triangles), 0.3 (red down triangles), and 0.4 (black asterisks). (B) Apoptosis probability atthe end of simulation. (C) Tissue epigenetics fðxÞ at the end of simulation.
Lei et al. www.pnas.org/cgi/content/short/1324267111 10 of 11
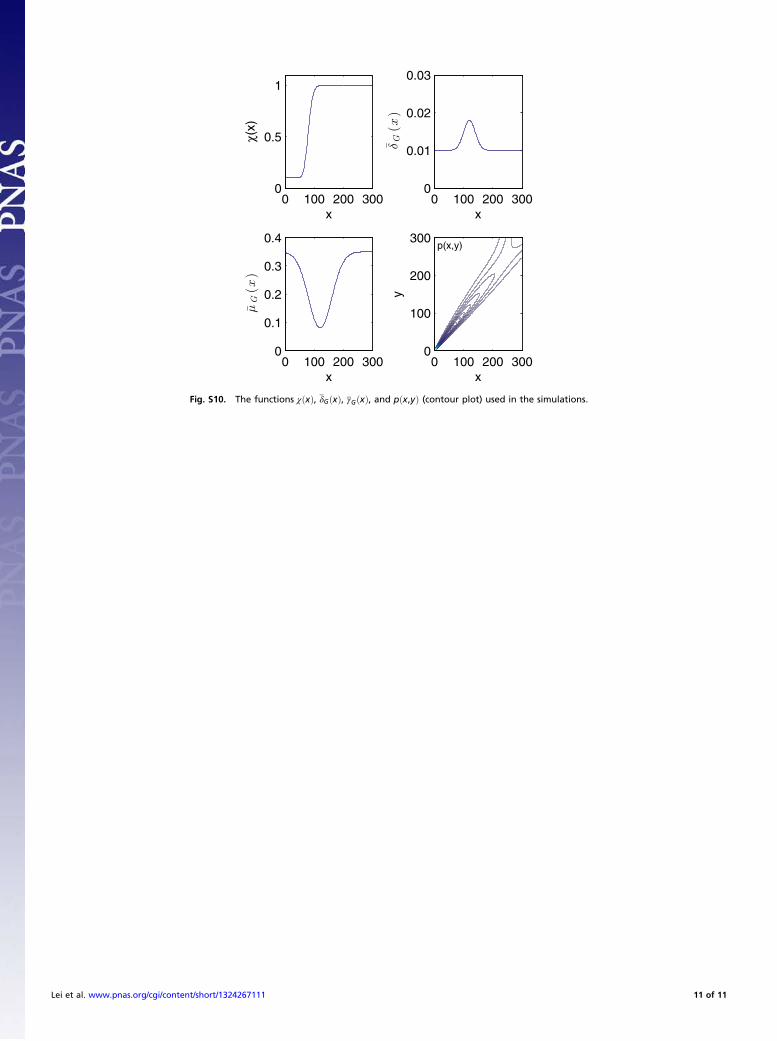
0 100 200 3000
0.5
1
x0 100 200 300
0
0.01
0.02
0.03
x
0 100 200 3000
0.1
0.2
0.3
0.4
x x
y
p(x,y)
0 100 200 3000
100
200
300
Fig. S10. The functions χðxÞ, δGðxÞ, γGðxÞ, and pðx,yÞ (contour plot) used in the simulations.
Lei et al. www.pnas.org/cgi/content/short/1324267111 11 of 11