math remediation for high school freshmen
TRANSCRIPT

University of Central Florida University of Central Florida
STARS STARS
Electronic Theses and Dissertations, 2004-2019
2015
Math Remediation for High School Freshmen Math Remediation for High School Freshmen
Kambiz Borhon University of Central Florida
Part of the Education Commons
Find similar works at: https://stars.library.ucf.edu/etd
University of Central Florida Libraries http://library.ucf.edu
This Doctoral Dissertation (Open Access) is brought to you for free and open access by STARS. It has been accepted
for inclusion in Electronic Theses and Dissertations, 2004-2019 by an authorized administrator of STARS. For more
information, please contact [email protected].
STARS Citation STARS Citation Borhon, Kambiz, "Math Remediation for High School Freshmen" (2015). Electronic Theses and Dissertations, 2004-2019. 1329. https://stars.library.ucf.edu/etd/1329
MATH REMEDIATION FOR HIGH SCHOOL FRESHMEN
by
KAMBIZ BORHON M.A. University of Central Florida, 2011
A dissertation in practice submitted in partial fulfillment of the requirements for the degree of Doctor of Education
in the College of Education and Human Performance at the University of Central Florida
Orlando, Florida
Spring Term 2015
Major Professor: David N. Boote

ii
© 2015 Kambiz Borhon

iii
ABSTRACT
This study is an attempt to address the problem associated with a high
percentage of freshman students, at a private Christian high school in Florida, who
either fail Algebra 1 or pass with a low percentage rate. As a result, these students
either retake Algebra 1 or continue on—being inadequately prepared to successfully
pass Geometry and Algebra 2. This study concentrates on the student background
knowledge of mathematics, which is among the causes associated with this problem,
and proposes remediation. As such, a mathematics remediation course is designed and
implemented for a select number of incoming freshmen. This study includes a
correlational examination to determine a possible correlation between students’
background knowledge of the middle school mathematics and predicts a possible failure
or successful completion of Algebra I in high school. In addition, it purposes a two-stage
evolution plan in order to determine the effectiveness of the design of the remedial
course as well as its effectiveness. Undertaking the design evaluation, this study uses a
mixed-modes design consisting of a qualitative (interview and observation) of a number
of participants and a quantitative examination (survey) of a larger sample. The
correlational study indicates that there is a positive and moderately strong correlation
between students’ background knowledge in (middles school) mathematics and their
grades in Algebra 1. The evaluation concludes that students find the design of the MIP
program helpful and aesthetically appealing; however, its usability did not meet the
evaluation criteria. Furthermore, the MIP Program Manager and teacher are fully
satisfied with its design, content, and components.

iv
In memory of my beloved father

v
ACKNOWLEDGMENTS
I would not have been able to complete my dissertation without the care and
support of several individuals. I am deeply grateful for the guidance of my committee
members, support of the administration at Remnant High School, and help and
encouragement from my family and friends.
During the course of my graduate studies at UCF, I have been fortunate to have
studied with several outstanding professors. Dr. Margaret Miller has always been so
caring and supportive. She was instrumental in my studies with regard to higher
education. I have also been lucky to have studied with Dr. Glenda Gunter whose
classes have always been so informative and fun. She has been the most influential
professor in my studies in Instructional Design and Technology. Dr. David Boote taught
me to study the literature critically, conduct research and examine problems diligently,
and propose and design solutions effectively. He has been truly influential in the
development of my interest in research. I am truly grateful for his help.
I am also grateful to Dr. Thomas Vitale for his overall support during the course
of my doctoral program. I would also like to thank Carolyn Jensen for her care in helping
me with editing my dissertation. Finally, I would like to express my deepest gratitude to
my sister and her husband for their love and support throughout my life.

vi
TABLE OF CONTENTS
LIST OF FIGURES ...............................................................................................ix
LIST OF TABLES ................................................................................................. x
LIST OF ACRONYMS ......................................................................................... xii
CHAPTER ONE: INTRODUCTION ...................................................................... 1
Problem Statement ........................................................................................... 1
Introduction ....................................................................................................... 1
Background ................................................................................................... 1
Organizational Context .................................................................................. 2
History and Conceptualization ....................................................................... 4
Literature Review .......................................................................................... 7
Definitions .................................................................................................... 13
Causes and Factors ........................................................................................ 13
External Factors .......................................................................................... 13
Internal Factors ........................................................................................... 14
Proposed Solution ........................................................................................... 16
Mathematics Remediation ........................................................................... 18
CHAPTER TWO: DESIGN ................................................................................. 20
Mathematics Intervention Program ................................................................. 20
Overview ..................................................................................................... 20

vii
Objectives .................................................................................................... 20
Standards .................................................................................................... 21
Contents ...................................................................................................... 25
Storyboards ................................................................................................. 28
Textbook ...................................................................................................... 41
Procedures .................................................................................................. 42
Program Design .............................................................................................. 45
Theoretical Framework ................................................................................ 47
Design Specifications .................................................................................. 55
Program Completion ................................................................................... 77
CHAPTER THREE: EVALUATION ..................................................................... 80
Correlational Study ......................................................................................... 80
Purpose ....................................................................................................... 80
Methodology ................................................................................................ 80
Results and Discussion ............................................................................... 82
Evaluation Plan ............................................................................................... 83
Design Evaluation ....................................................................................... 83
Program Evaluation ..................................................................................... 90
Limitations ................................................................................................... 93

viii
CHAPTER FOUR: CONCLUSION ..................................................................... 95
Recommendations .......................................................................................... 97
APPENDIX A: DATA ANALYSIS ...................................................................... 101
APPENDIX B: SAMPLE CURRICULUM MODULE .......................................... 137
APPENDIX C: SAMPLE ASSESSMENT .......................................................... 159
APPENDIX D: SAMPLE MODULE ................................................................... 179
APPENDIX E: SAMPLE SYLLABUS ................................................................ 200
REFERENCES ................................................................................................. 207
ix
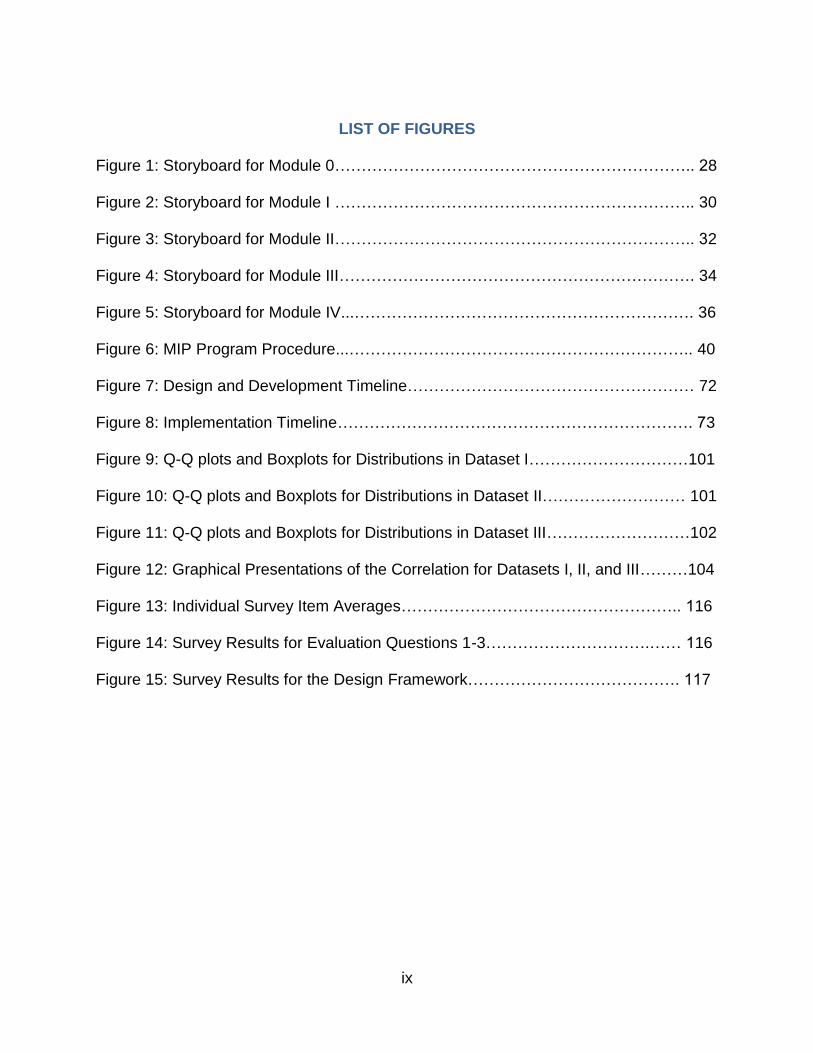
LIST OF FIGURES
Figure 1: Storyboard for Module 0………………………………………………………….. 28
Figure 2: Storyboard for Module I ………………………………………………………….. 30
Figure 3: Storyboard for Module II………………………………………………………….. 32
Figure 4: Storyboard for Module III…………………………………………………………. 34
Figure 5: Storyboard for Module IV...………………………………………………………. 36
Figure 6: MIP Program Procedure...……………………………………………………….. 40
Figure 7: Design and Development Timeline……………………………………………… 72
Figure 8: Implementation Timeline…………………………………………………………. 73
Figure 9: Q-Q plots and Boxplots for Distributions in Dataset I…………………………101
Figure 10: Q-Q plots and Boxplots for Distributions in Dataset II……………………… 101
Figure 11: Q-Q plots and Boxplots for Distributions in Dataset III………………………102
Figure 12: Graphical Presentations of the Correlation for Datasets I, II, and III………104
Figure 13: Individual Survey Item Averages…………………………………………….. 116
Figure 14: Survey Results for Evaluation Questions 1-3………………………….…… 116
Figure 15: Survey Results for the Design Framework…………………………………. 117
x
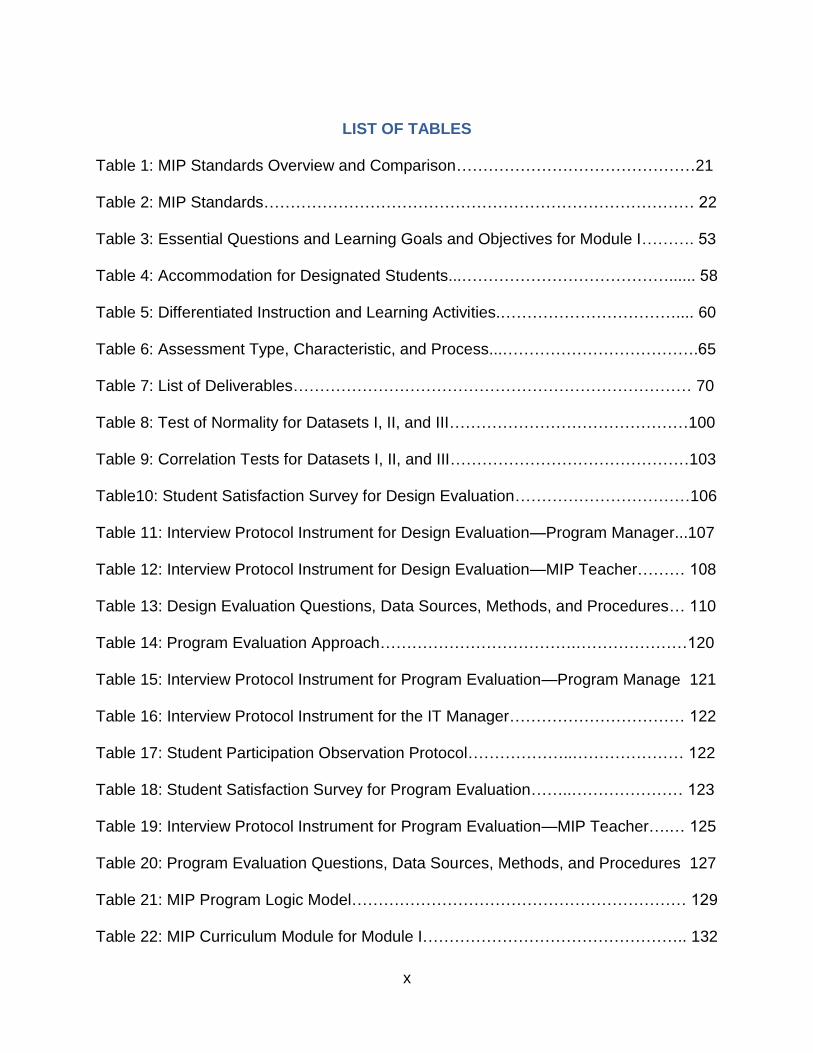
LIST OF TABLES
Table 1: MIP Standards Overview and Comparison………………………………………21
Table 2: MIP Standards……………………………………………………………………… 22
Table 3: Essential Questions and Learning Goals and Objectives for Module I………. 53
Table 4: Accommodation for Designated Students...…………………………………...... 58
Table 5: Differentiated Instruction and Learning Activities.…………………………….... 60
Table 6: Assessment Type, Characteristic, and Process...……………………………….65
Table 7: List of Deliverables………………………………………………………………… 70
Table 8: Test of Normality for Datasets I, II, and III………………………………………100
Table 9: Correlation Tests for Datasets I, II, and III………………………………………103
Table10: Student Satisfaction Survey for Design Evaluation……………………………106
Table 11: Interview Protocol Instrument for Design Evaluation—Program Manager...107
Table 12: Interview Protocol Instrument for Design Evaluation—MIP Teacher……… 108
Table 13: Design Evaluation Questions, Data Sources, Methods, and Procedures… 110
Table 14: Program Evaluation Approach……………………………….…………………120
Table 15: Interview Protocol Instrument for Program Evaluation—Program Manage 121
Table 16: Interview Protocol Instrument for the IT Manager…………………………… 122
Table 17: Student Participation Observation Protocol………………..………………… 122
Table 18: Student Satisfaction Survey for Program Evaluation……..………………… 123
Table 19: Interview Protocol Instrument for Program Evaluation—MIP Teacher….… 125
Table 20: Program Evaluation Questions, Data Sources, Methods, and Procedures 127
Table 21: MIP Program Logic Model……………………………………………………… 129
Table 22: MIP Curriculum Module for Module I………………………………………….. 132

xi
Table 23: Lesson Plan 1 of Module I…………………………………………………….. 138
Table 24: Lesson Plan 2 of Module I…………………………………..………………… 148

xii
LIST OF ACRONYMS
ELL English Language Learner
ESE Exceptional Student Education
ESOL English for Speakers of Other Languages
IEP Individualized Education Program
LEP Limited English Proficiency
MIP Mathematics Intervention Program
SLD Specific Learning Disabilities

1
CHAPTER ONE: INTRODUCTION
Problem Statement
For the past few years, Remnant High School—a private Christian high school in
Florida—has been experiencing that a high percentage of freshman students either fail
or pass Algebra 1 at a low percentage rate.
Introduction
Background
This study is an attempt to address the problem associated with a high
percentage of freshman students at Remnant High School (RHS) who either fail Algebra
1 or pass it at a low percentage rate. As a result, these students either retake Algebra 1
or continue on—being inadequately prepared to successfully pass Geometry and
Algebra 2. The impact of such unpreparedness in mathematics is strongly manifested
when students take Algebra 1, which is a fundamental course in high school
mathematics and beyond. A successful completion of Algebra 1 is essential for
undertaking Geometry and Algebra 2, among others. Among the causes associated
with this problem, this study concentrates on the student background knowledge of
mathematics as a major contributing factor to this problem. In order to address this
problem and maximize the incoming freshman students’ preparedness for Algebra 1,
this study proposes a remediation solution by designing and implementing a
remediation course—Mathematics Intervention Program (MIP)—for a select number of
incoming freshmen.

2
Designing and implementing the MIP program, this study undertakes a two-part
evaluation process: 1) conducting an evaluation of the program design, and 2)
proposing an evaluation of the overall program implementation and its effectiveness.
Such processes include a pre- and post-test design (the mathematics portion of the
ACT Aspire standardized test) to determine the effectives of the MIP program. An
anonymous survey will also be used to collect quantitative data from students who are
placed in the MIP program at RHS. In addition, the quantitative data with respect to prior
freshman students’ Algebra 1 grades and related standardized test scores (ACT
Explore) for the past three years will also be examined to determine the correlation
between the incoming freshman students’ prior Explore scores and their Algebra 1
grades. The related data corresponds to students’ grades/scores prior to the
implementation of the MIP program in Fall 2014.This study will also include a qualitative
examination of selected faculty and administrators.
Organizational Context
As a senior academy, Remnant High School was established in Florida in 1918.
Its mission is declared as to modeling love and service for God, having respect for self
and others, developing intellectual growth, and modeling a Christ-like character. The
organizational structure of RHS is composed of a total of 35 faculty and staff members,
among which there are 15 full- and three part-time teachers. There are about 345
students (grades 9-12) in RHS. The demographic characteristics of the student body
consist of approximately 35 percent white, 30 percent Hispanic, 30 percent black, and

3
five percent Asian and Native American. Moreover, there are about 15 English learners,
and the student population is by far Christian.
The Seventh-day Adventist (hereafter referred as Adventist) educational system
is a denominationally-based school system which was established in the early 1870s,
and is currently the second largest Christian school system in the world. The Adventist
education is a worldwide Christ-centered system with a holistic approach in education.
The global Adventist educational system includes 7, 804 educational institutions, 84,
997 teachers, and over 1.6 million students (ADOE, 2011). The Adventist education
adopted the philosophy that education should be redemptive in nature and that “mental,
physical, social, and spiritual health, intellectual growth, and service to humanity” form
its core values (Circle, 2011, para. 2). As the highest world-wide authority for the
Seventh-day Adventist Church, the General Conference also establishes and maintains
Adventist education policies and oversees its corresponding Pre K-12 and post-
secondary schools. The General Conference is divided into 13 worldwide Divisions
which are subdivided into Unions. Each Union is composed of several Conferences.
One of its major divisions is the North American Division (NAD) which includes the
United States and Canada (NAD, 2013). This study concentrates on one of the schools
(RHS) in the Florida Conference of the Seventh-day Adventist (hereafter referred as the
Conference) which is a member of the Southern Union in NAD. The Office of Education
(OE) in the Conference maintains the educational policies of NAD in Florida, and
oversees 23 elementary schools (grades 1-8), five junior academies (grades 1-9), and
two senior academies (grades 9-12) in Florida (Conference, 2013). The Conference
declares its fundamental mission as “Creating Christian leaders grounded in their love

4
for Jesus and His church” (Conference, 2013). To formalize its curricula and unify
Adventist education, North American Division developed its own standards in the early
2000s. The NAD standards have been compared with state standards and national
organizations for each discipline. Such comparison, in Florida, indicated that NAD
standards are comparable to both Sunshine States Standards as well as the Common
Core.
History and Conceptualization
The problem associated with mathematics achievement is, indeed, a national
concern for an increasing number of students requiring interventions of some sort to
address their achievement gaps. Virtually in every state, students struggle to stay in
grade level and are screened for potential difficulties in reading and mathematics
(Jordan, Kaplan, Locuniak, & Ramineni, 2007), As Balfanz and Byrnes (2006) noted,
the mathematics achievement levels of US students have fallen far behind the desired
levels of achievement and that “many students end middle school ill-prepared to
succeed in a rigorous sequence of college-preparatory mathematics courses in high
school” (p. 144). Particularly, there is a strong indication that mathematics achievement
of American students between fourth and eighth grade fall even more rapidly compared
with the elementary grades (Balfanz & Byrnes, 2006). According to the 2007 Trends in
International Mathematics and Science Study, as Meyen and Greer (2009) emphasize,
“eight countries outperformed the United States in mathematics achievement at the
fourth-grade level, and five countries outperformed the United States at the eighth-
grade level” (p. 1). With respect to mathematics, Geary (as cited in Jordan et al., 2007)

5
notes that students’ weakness in mathematics are often related to “selective cognitive
deficits, inadequate instruction, or a combination of factors” (p. 36). As Carr (2012)
claims, students who develop a “solid conceptual mathematics foundation at the
elementary level” will later succeed in higher-level mathematics courses (p. 269). Given
the situation, many schools implement strategies that are unsupported by research or
data, unrelated to the actual problem, or ineffective—at times, may even adversely
affect the achievement gap.
The problem associated with remediation is initiated at the elementary level,
nurtured in the middle school institutions, and solidified in our secondary school system.
Continue to grow exponentially, this problem has been penetrating in our post-
secondary educational system—generating serious educational, social, and economical
problems in the U.S. especially during the recent decades. The high college remediation
rates, as Howell (2011) observes, may signify a “disconnect between K–12 curricula
and the expectations and requirements of postsecondary study” (p. 296). To manage
these discrepancies, “many states have implemented or are considering K–16
initiatives”—which signifies “aligning secondary and postsecondary curriculum as well
as the curriculum within the elementary and secondary system itself” (Howell, 2011, p.
296). Higher education institutions are finding that ever increasing number of entering
freshman students are unprepared for college-level coursework, particularly in
mathematics (Fine, Duggan, & Braddy, 2009). Perin (2006) asserts that more than half
of community college students need remediation among which up to 80 percent enroll in
at least one remedial course. Furthermore, 75 percent of postsecondary institutions in
the United States, according to the U.S. Department of Education, “offer remedial

6
courses in mathematics and English catering to the 28% of first-time college freshmen
at both two- and four-year postsecondary institutions who lack the skills necessary to
perform college-level work (Parsad & Lewis, as cited in Howell, 2011, p. 296). Most of
these students will be required to successfully complete the so-called remedial courses
prior to taking the corresponding college-level coursework. Fine et al. (2009) observe
that “remediation of incoming college freshman students is a national concern because
remediated students are at higher risk of failing to complete their degrees” (p. 433).
Bahr (2008) estimates “the national direct cost of public postsecondary remedial
programs at 1–2 billion dollars annually, and the total direct and indirect public and
private costs at nearly 17 billion dollars annually” (p. 421). This is a staggering number
that reveals the magnitude of the remediation which I believe is a real burden on our
educational system. Astin, as cited in Handel and Williams (2011), concludes that
remedial education is “the most important educational problem in America today” (p.
29).
Waycaster (2001) insists that the “alternatives to remediation can range from
unemployment and low-wage jobs to welfare participation and incarceration—all of
which are more expensive for [the] society, [and that] a good remediation program can
serve as a cost-effective investment” (p. 404). Given that most of these students are
among the monitories, less affluent families, and those whom English is a second
language (Attewell, Lavin, Domina, & Levey, 2006), remediation would provide
opportunities to rectify race and class disparities to “develop the minimum skills deemed
necessary…to acquire the prerequisite competencies that are crucial for negotiating
college-level coursework” (Bahr, 2008, p. 420). In addition, Waycaster (2001) stresses

7
that “Well over half of minority students who ultimately graduated initially failed
academic skills tests” (p. 890), and that the impact of eliminating remedial courses
would be catastrophic on minority students. All indications point that although
remediation is costly and redundant, it seems necessary.
Literature Review
A number of researchers have focused on the effectiveness of remedial
mathematics courses and their impact on student achievement. Traditionally, most
research with respect to remediation and its effectiveness is concentrated on higher
education—the majority of which have studied (community) college students.
Nonetheless their findings are helpful and to various degrees relevant to remediation at
the secondary level as well.
Bettinger and Long (2009) studied many aspects of college remediation from its
economics to its effectiveness. They explored the impact of remediation on student
interest, “persistence, transfer behavior, and degree completion for similar students
placed in and out of remediation” (p. 752). This study focused specifically on 18- to 20-
year old college undergraduates. The researchers investigated the impact of
remediation on college students’ performance and persistence by using data comprising
over 28,000 students provided by the Ohio Board of Regents (OBR). In addition, they
explored the lack of colleges’ uniform testing policies and remedial placement
procedures. They also examined the possible social and psychological impact of
grouping lower-ability students in remedial courses. With this comprehensive approach
to the study of remediation, the researchers were able to explore the impact of remedial
8
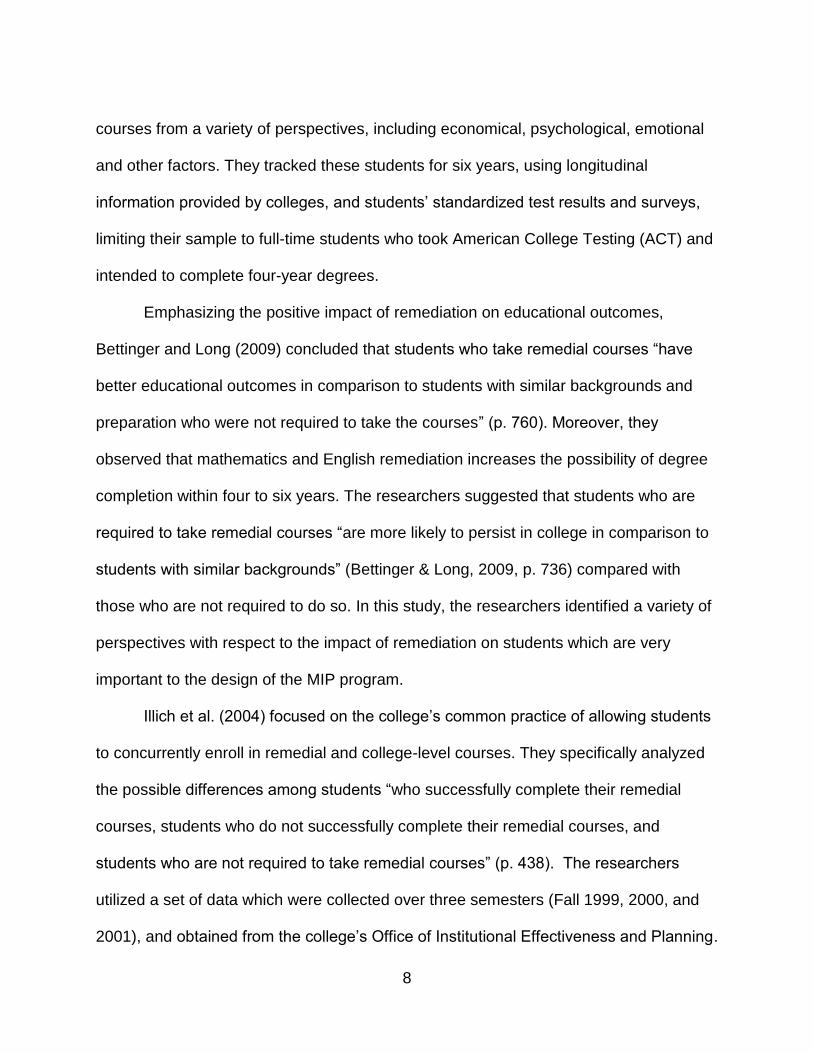
courses from a variety of perspectives, including economical, psychological, emotional
and other factors. They tracked these students for six years, using longitudinal
information provided by colleges, and students’ standardized test results and surveys,
limiting their sample to full-time students who took American College Testing (ACT) and
intended to complete four-year degrees.
Emphasizing the positive impact of remediation on educational outcomes,
Bettinger and Long (2009) concluded that students who take remedial courses “have
better educational outcomes in comparison to students with similar backgrounds and
preparation who were not required to take the courses” (p. 760). Moreover, they
observed that mathematics and English remediation increases the possibility of degree
completion within four to six years. The researchers suggested that students who are
required to take remedial courses “are more likely to persist in college in comparison to
students with similar backgrounds” (Bettinger & Long, 2009, p. 736) compared with
those who are not required to do so. In this study, the researchers identified a variety of
perspectives with respect to the impact of remediation on students which are very
important to the design of the MIP program.
Illich et al. (2004) focused on the college’s common practice of allowing students
to concurrently enroll in remedial and college-level courses. They specifically analyzed
the possible differences among students “who successfully complete their remedial
courses, students who do not successfully complete their remedial courses, and
students who are not required to take remedial courses” (p. 438). The researchers
utilized a set of data which were collected over three semesters (Fall 1999, 2000, and
2001), and obtained from the college’s Office of Institutional Effectiveness and Planning.
9
The population in this study was composed of 12,375 students who enrolled at
McLennan Community College located in Waco, Texas. In addition, the researchers
explored a possible negative impact of instructors “who teach college-level
courses…[but] may have little or no awareness that some of their students may be
concurrently enrolled in remedial courses” (Illich et al., 2004, p. 450). Moreover, they
examined the sufficiency of relying primarily on a “single placement test to determine a
student’s academic preparedness” (p. 452). The researchers concluded that “Students
who successfully complete their remedial courses perform as well as non-
developmental students enrolled in college-level courses [however, those who do not]
under-perform in their college-level courses” (p. 452). In addition, they suggested that
exclusive reliance on a single test in determining students’ academic preparedness is
inadequate. Exploring the impact of these somewhat unique variables on remediation is
helpful to my study, for the majority of MIP students will also enroll in Algebra 1, and the
MIP placement and successful remediation will be determined by relying on a single
standardized test result.
In his longitudinal study, Bahr (2008) examined the relative success or failure of
mathematics remediation by “comparing the long-term academic outcomes…of
students who remediate successfully in mathematics…with those of students who
achieve college-level mathematics skill without the need for remedial assistance” (p.
421). In this research, he analyzed a set of data which addressed 85,894 first-time
college freshmen enrolled in 107 community colleges in California in Fall 1996, and he
tracked their mathematics progress for 6 years. To address the effectiveness of
mathematics remediation, using two complex modeling systems, the researcher

10
presented a “hierarchical multinomial logistic regression” model to measure the long-
term student attainment and a “more complex 10-category nominal” model to measure
the status of students’ “college-level math skill attainment” (Bahr, 2008, p. 442). The
researcher concluded that students who “remediate successfully…exhibit long-term
academic attainment…that is comparable to that of students who achieve college-level
math skill without the need” (p. 446) for remediation. In this regard, he found
mathematics remediation to be highly effective only for those students who remediate
successfully. Bahr’s important study and findings—specifically with respect to the
positive long-term academic outcomes for students who remediate successfully in
mathematics—is particularly helpful for justifying the implementation of the MIP program
at RHS.
A few studies have been conducted with respect to Adventist education, in
general, and non specific to mathematics achievement. Combining “published and
unpublished research to assess the extent to which Adventist schools have
accomplished their goals,” Thayer (2008) asserts that the “Results of more recent
studies should be given more weight in applying results to the current situation” (pp. 3,
6). The most recent and by far comprehensive study on Adventist education was
completed in 2007, the CognitiveGenesis Research Study—components of which have
been used continuously by NAD in its advertising materials. Prior to the
CognitiveGenesis Research Study, few studies have been conducted from mid-1970s to
2006 (Thayer, 2008)—most of which concentrate on few individual Unions as well as
select Adventist schools in NAD. A good portion of these studies measure elements
such as the impact of Adventist education on students’ spiritual outcomes; academic
11
achievements of Adventist youth in public schools; and academic achievement with
respect to number of years of Adventist schooling, school size, and class size among
others (Thayer, 2008).
In an attempt to assess the academic achievement at the elementary and
secondary levels in the Adventist educational system, a comprehensive four-year study,
entitled the CognitiveGenesis Research Study, was conducted starting Fall 2006 to
Spring 2010 at the Center for Research on Adventist Education at La Sierra
University—a post-secondary Adventist educational institution in NAD
(CognitiveGenesis, 2013). The primary focus of this study is to measure achievement in
Adventist schools and how it compares with that of the national norm
(CognitiveGenesis, 2013). To accomplish this task, the researchers assessed various
factors associated with academic performance of elementary and secondary students in
U.S. Adventist schools. To assess students’ achievement—measuring students’ actual
knowledge and skills—the researchers selected the following standardized test
instruments: the Iowa Tests of Basic Skills (ITBS) for elementary and middle school
students and the Iowa Tests for Educational Development (ITED) for high school
students (CognitiveGenesis, 2013). To assess students’ ability, the Cognitive Abilities
Test (CogAT) was used. The ITBS, ITED, and CogAT tests were conducted starting
2006-2007 and ending in the 2009-2010 schoolyear (four years). Furthermore, surveys
from four groups—students, parents, teachers, and school administrators—were
conducted to measure how variables from different groups relate to achievement and
ability (CognitiveGenesis, 2013). The surveys were conducted starting 2006-2007 and
ending in the 2008-2009 schoolyear (three years). Subsequently, the collected data
12
were cleaned, and the final dataset included 51,706 records which were used for
statistical analysis (CognitiveGenesis, 2013). The researchers identified the following
among their findings: 1) The longer students remain in an Adventist school, the higher
their academic achievement will be; 2) Students’ achievements in small Adventist
schools are comparable to students in larger schools; and 3) Median composite
achievement was at the 60th percentile and median composite ability at 55th percentile
over the four years for grades 3-8 (both above the national norm—i.e., above the 50th
percentile of the norm group), and median composite achievement was at the 65th
percentile and median composite ability at 62nd percentile over the four years for grades
9 and 11 (both above the national norm—i.e., above the 50th percentile of the norm
group). Furthermore, in all grade levels, the mean achievement was about a third of a
grade level higher than the predicted value based on ability (CognitiveGenesis, 2013).
This study was conducted in the Adventist schools only in Unites States. Given
that Canada’s Adventist schools were not included, the findings of this study may not be
generalized to NAD or the global Adventist school system in general. (Adventist
schools, education, or school systems—unless specified—are usually defined and
considered as a global term.) Moreover, given that La Sierra University itself is among
the NAD educational institutions and in charge of conducting this research, the findings
of this study might have been more reliable if the data and related findings had also
been analyzed and validated by an independent institution as well.

13
Definitions
Remediation (also known as the preparatory education or developmental
coursework) refers to programs providing reading, writing, and mathematics courses for
students with (related) competencies measured at below their grade levels, or students
who are inadequately prepared entering higher education.
Remedial mathematics (also known as developmental mathematics) refers to
mathematics courses required for freshman college students who are not prepared for
college-level mathematics courses, typically College Algebra. In this study, mathematics
remediation refers to middle school mathematics (including Pre-Algebra) required for
freshmen high school students who are unprepared for Algebra 1.
Causes and Factors
In addition to internal factors, all organizations, with varying degrees, are
impacted by external changes and influences—the identifications and especially
diagnoses of which are usually very complex. As such, identifying internal and external
contributing factors to problems with respect to educational institutions is a colossal
task. In this study, I attempt to identify both internal and external contributing factors
with respect to the existing problem at RHS.
External Factors
Like other secondary institutions, RHS admits freshman students from a variety
of middle schools. Although the majority of these students come from within the
Adventist schools system, RHS also accepts students from public schools and other
Christian denominations’ school systems, among others. And so, students with varying

14
degree of competencies with respect to their grade levels are admitted who
subsequently attend Algebra 1 as a high school entry level mathematics. RHS has been
experiencing that about 25 percent of these students have difficulties in mathematics,
and thus struggle in Algebra 1. Naturally, RHS does not have control over the possible
educational-related inadequacies in other schools. As explained before, the problem
associated with student unpreparedness, especially in reading and mathematics, is a
national issue which seems to have its roots established early during students’
elementary school-years. Given the complexity and enormity of the issue and its root
causes, most studies have concentrated on remediation as a solution and its
effectiveness.
Internal Factors
Internal factors—such as structural changes, budget, and new administration,
among others—usually have direct impact on an educational institution. Although the
major contributing factors associated with this problem at RHS are external in nature,
there are internal factors which have amplified the problem. To better understand and
diagnose the internal factors associated with this problem at RHS, the Bolman and
Deal’s organizational theory—the four-frame model: human resource as well as
structural, political, and symbolic frames—is used (Bolman & Deal, 2008).
Human Resource Cause: Lack of a dedicated program in the Mathematics
Department
Several administrators and leaders at RHS have been aware of this problem for
many years; however, they did not address the issue effectively. It is important to note
15
that during the last eight years, RHS has been managed by two entirely different
administration teams, and was subject to complete structural changes less than three
years ago. Undoubtedly, such major changes especially during a short span of time
would also have a major impact on the problem in this study. Nonetheless, the
Mathematics Department at RHS has not truly investigated the problem internally—
concentrating on the external causes associated with the problem. Given the situation,
although all four members of the Mathematics Department had been aware of the
problem, they mainly discussed its related impacts.
Structural Cause: Lack of a clear admission policy and procedure with regard to
unprepared incoming freshman students
As far as admissions are concerned, RHS has a relatively relaxed policy with
regard to admitting students. As such, it has continuously been admitting freshman
students (approximately a quarter of whom) require remediation in mathematics.
Political Cause: Lack of a comprehensive plan at the Conference level
Given that the majority of its incoming freshmen come from within the Adventist
system, a good percentage of these unprepared students come from the middle schools
under the jurisdiction of the Conference. The administration at RHS has not discussed
the issue in the Conference. Having done so, they would have critically looked into the
educational processes within many elementary and middle schools under the
jurisdiction of the Conference which is not a “politically correct” move. The other option
for the RHS administration would have been to simply refuse admission to the
unprepared incoming freshmen. This option would have also introduced very negative
political consequences.

16
Symbolic Cause: Undetermined
Given the organization’s mission and culture, RHS has always stressed its
intellectual and academic growth as a symbol for an institution of choice which has also
been a source pride for RHS faculty and staff. The problem associated with the
unprepared freshman students was an important issue to consider, discuss, and
investigate by the faculty and administration. However, it is not entirely clear as to why
such issue has been overlooked at the school level.
Proposed Solution
The new RHS administration became determined to resolve the continuous
problems associated with the unprepared incoming freshmen; however, they highly
desired to avoid a possible tension with other Adventist schools and the Conference.
The school administration finally decided to look into this problem more closely
and provide a data-driven solution using which RHS would be able to control and
gradually resolve this problem “internally”—a possible solution to the political cause with
respect to the problem in this study. The Admission Department at RHS has always
been collecting incoming freshman students’ ACT Explore test, Florida Comprehensive
Assessment Test (FACT 2.0), and/or Iowa Test of Basic Skills (ITBS) scores as part of
its admission requirements. Therefore, the RHS administration has been aware of
students with low scores in mathematics, but the lack of a clear admission policy
prevented them from taking the necessary action. With respect to a comprehensive
admission policy including unprepared incoming freshman students, the new school
administration evaluated two options: 1) Rejecting admissions to these students; and 2)

17
Admitting these students with a precondition—requiring them to take the related
remediation course offered by RHS. The administration selected the latter option
temporarily without changing the current admission policy officially until a proposed
solution is determined, implemented, and evaluated—a possible solution to the
structural cause with respect to the problem in this study.
To study the problem and remedy a solution, the academic dean at school
designated me, one of the teachers at RHS with the necessary experience and
credentials in research and design, to investigate the problem and propose a solution.
Furthermore, under the supervision of the academic dean, I would be fully supported by
the Mathematics Department. In addition, it was decided that after the initial
implementation and evaluation of the desired solution, the Mathematics Department
would be fully in charge of the remediation course. A preliminary study, conducted in
2014, indicated that about 25 percent of incoming freshman students struggle in
mathematics—a high percentage of whom pass Algebra 1 with a grade of “C” (a score
about 75 percent). In this study, students’ ACT Explore scores for grade 8 (the math
portion only) were compared with their semester and final Algebra 1 grades. These
students continue struggling through Geometry and especially Algebra 2 as it has also
been observed by the Mathematics Department at RHS. In such situations, as research
clearly indicates, remediation is a natural solution. Thus, concentrating on the lack of an
adequate student background knowledge of mathematics as a major contributing
(external) factor to this problem, this study proposed a remediation solution by
designing and implementing a remediation course—Mathematics Intervention Program

18
(MIP)—for a select number of incoming freshmen — a possible solution to the human
resource cause with respect to the problem in this study.
Mathematics Remediation
According to the National Assessment of Educational Progress report that
identifies the improvement in mathematics for students at all achievement levels, as
Bottge, Grant, Stephens, & Rueda (2010) point out, “26% of students without disabilities
and 67% of students with disabilities in Grade 8 still scored below the Basic level in
math” (p. 81). Research indicates that traditionally mathematics remediation has been
less successful and that the need for a more comprehensive study on the effectiveness
of mathematics remediation has become necessary. Among those who are in need of
remediation, more students require remediation in mathematics, as Bahr (2007)
observes, yet their low rate of successful remediation is troubling for “three out of four
underprepared students who start down the path toward college-level math never arrive
at that destination” (p. 697). Furthermore, students do often “associate mathematics
with anxiety and failure, which can negatively influence engagement,” motivation, and
self-efficacy—components of which are essential especially in remedial mathematics
courses (Wenner, Burn, & Baer, 2011). With respect to the secondary mathematics,
research indicates that students who lack the necessary knowledge of middle school
mathematics will struggle and most likely fail Algebra 1. As such, remediation in
mathematics is vital in improving the mathematical foundations of the freshman
students who lack the necessary knowledge of middle school mathematics (especially
the grade 8 mathematics and Pre-Algebra). The impact of this unpreparedness is

19
strongly manifested when students take Algebra 1, which is a fundamental course in
high school mathematics and beyond. A successful completion of Algebra 1 is, indeed,
essential for undertaking Geometry and Algebra 2 among others.
20
CHAPTER TWO: DESIGN
Mathematics Intervention Program
Overview
The MIP program is a remedial course in mathematics concentrated on
mathematics grades 6-8 and Pre-Algebra which is designed to “help students make the
transition from basic elementary mathematics to Algebra 1 and Geometry and provides
a foundation for understanding a broad spectrum of mathematical topics” (NAD, 2003,
p. 51).
Objectives
Upon the completion of this course, students will:
1. Know the real number system, and be able to add, subtract, multiply and divide
rational numbers.
2. Solve problems involving integer exponents, roots, and radicals.
3. Understand ratio, analyze proportional relationships, and use their applications.
4. Understand variables and evaluate expressions.
5. Solve one-variable equations and Inequalities.
6. Understand and evaluate functions.
7. Distinguish geometric shapes and figures.
8. Solve problems involving measuring and computing angle, perimeter, area,
surface area and volume.
9. Understand the concept of probability and perform statistical data analysis.

21
Standards
Standard-based education has become a common approach in teaching and
learning for several decades. It has also become a venue by which schools and
teachers (even students) are held accountable for learning achievements. As a set of
guiding principles, standards refer to “how well the student must perform, at what kinds
of tasks, based on what content, to be considered proficient and effective” (Wiggins &
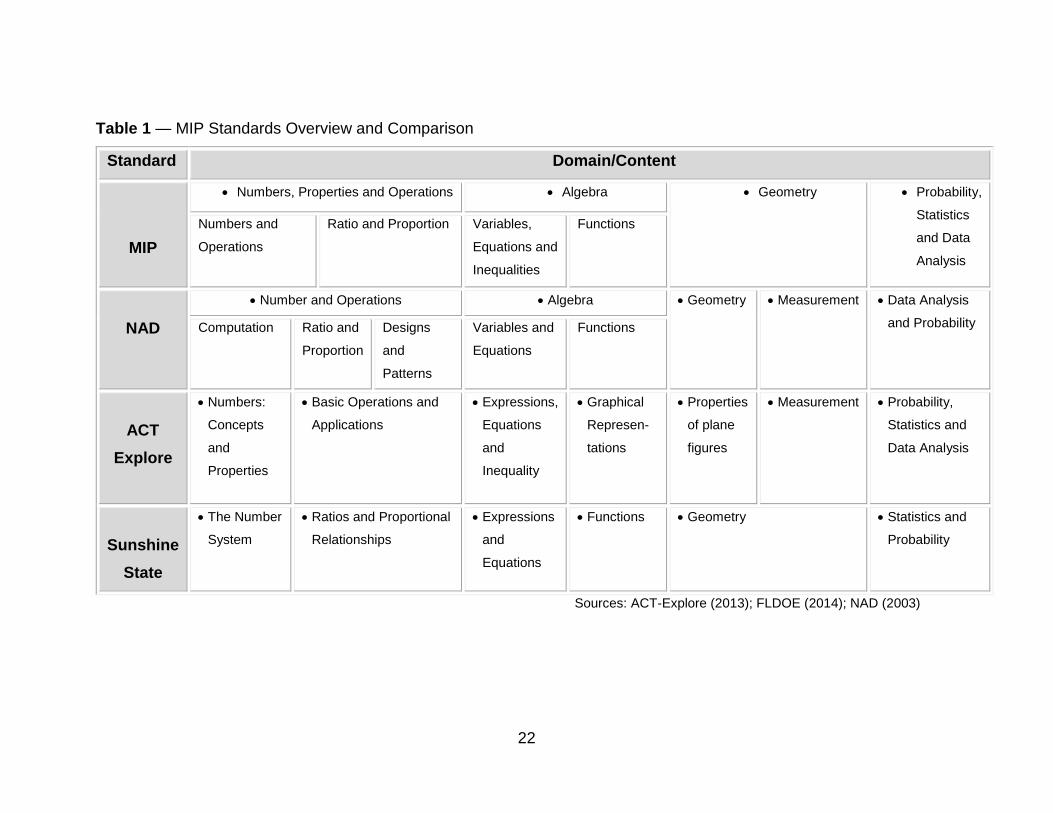
McTighe, 2006, p. 350). The MIP standards are developed in comparison with the NAD
standards and the ACT Explore/Aspire standardized test contents to ensure
compatibility. Although indirectly (somewhat) relevant, Sunshine State Standards are
also considered and compared during the development process. The MIP standards are
divided into four domains and four sub-domains: 1) Numbers, Properties, and
Operations (including two sub-domains: Numbers and Operations as well as Ratio and
Proportions); 2) Algebra (including two sub-domains: Variables, Equations, and
Inequalities as well as Functions); 3) Geometry; and 4) Probability, Statistics, and
Analysis. More information regarding these domains in comparison with the NAD, ACT
Explore and Sunshine State standards are provided in Table 1. To maximize efficiency
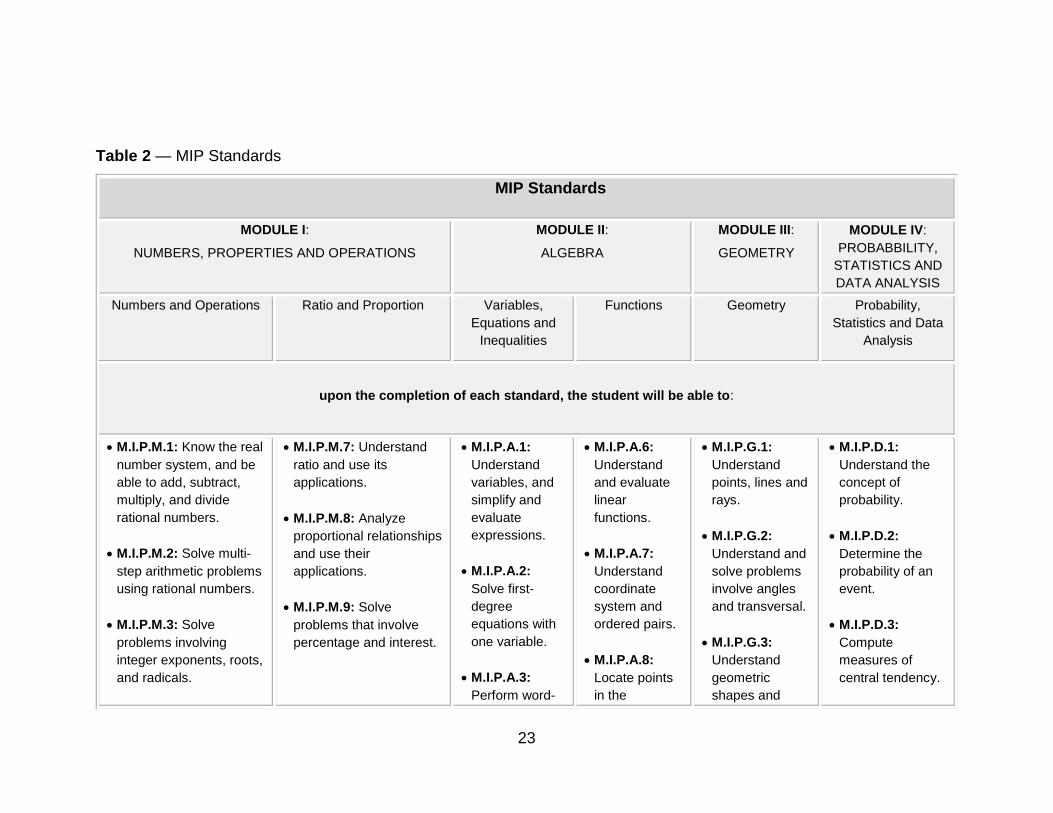
and expand simplicity, four modules of the MIP program carry the names of their
corresponding domains. Furthermore, each domain is identified using specific codes to
facilitate referencing, among others. These codes start with the M.I.P. prefix (for MIP)
followed by “M” (for Mathematics, the first domain), “A” (for Algebra, the second
domain), “G” (for Geometry, the third domain), or “D” (for Data, the forth domain), then
followed by a number. Table 2 provides detail information on MIP standards.
22
Table 1 — MIP Standards Overview and Comparison
Standard Domain/Content
MIP
Numbers, Properties and Operations Algebra Geometry Probability,
Statistics
and Data
Analysis
Numbers and
Operations
Ratio and Proportion Variables,
Equations and
Inequalities
Functions
NAD
Number and Operations Algebra Geometry Measurement Data Analysis
and Probability Computation Ratio and
Proportion
Designs
and
Patterns
Variables and
Equations
Functions
ACT
Explore
Numbers:
Concepts
and
Properties
Basic Operations and
Applications
Expressions,
Equations
and
Inequality
Graphical
Represen-
tations
Properties
of plane
figures
Measurement Probability,
Statistics and
Data Analysis
Sunshine
State
The Number
System
Ratios and Proportional
Relationships
Expressions
and
Equations
Functions Geometry Statistics and
Probability
Sources: ACT-Explore (2013); FLDOE (2014); NAD (2003)
23
Table 2 — MIP Standards
MIP Standards
MODULE I:
NUMBERS, PROPERTIES AND OPERATIONS
MODULE II:
ALGEBRA
MODULE III:
GEOMETRY
MODULE IV:
PROBABBILITY,
STATISTICS AND
DATA ANALYSIS
Numbers and Operations Ratio and Proportion Variables,
Equations and
Inequalities
Functions Geometry Probability,
Statistics and Data
Analysis
upon the completion of each standard, the student will be able to:
M.I.P.M.1: Know the real
number system, and be
able to add, subtract,
multiply, and divide
rational numbers.
M.I.P.M.2: Solve multi-
step arithmetic problems
using rational numbers.
M.I.P.M.3: Solve
problems involving
integer exponents, roots,
and radicals.
M.I.P.M.7: Understand
ratio and use its
applications.
M.I.P.M.8: Analyze
proportional relationships
and use their
applications.
M.I.P.M.9: Solve
problems that involve
percentage and interest.
M.I.P.A.1:
Understand
variables, and
simplify and
evaluate
expressions.
M.I.P.A.2:
Solve first-
degree
equations with
one variable.
M.I.P.A.3:
Perform word-
M.I.P.A.6:
Understand
and evaluate
linear
functions.
M.I.P.A.7:
Understand
coordinate
system and
ordered pairs.
M.I.P.A.8:
Locate points
in the
M.I.P.G.1:
Understand
points, lines and
rays.
M.I.P.G.2:
Understand and
solve problems
involve angles
and transversal.
M.I.P.G.3:
Understand
geometric
shapes and
M.I.P.D.1:
Understand the
concept of
probability.
M.I.P.D.2:
Determine the
probability of an
event.
M.I.P.D.3:
Compute
measures of
central tendency.
24
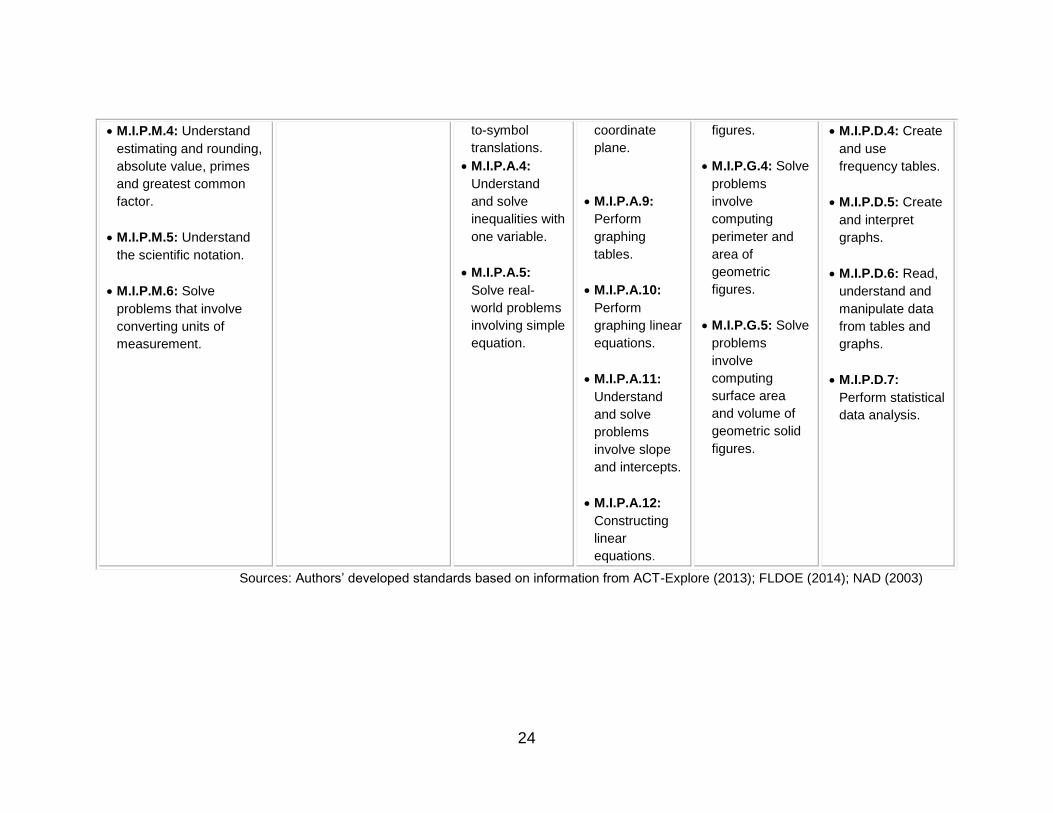
M.I.P.M.4: Understand
estimating and rounding,
absolute value, primes
and greatest common
factor.
M.I.P.M.5: Understand
the scientific notation.
M.I.P.M.6: Solve
problems that involve
converting units of
measurement.
to-symbol
translations.
M.I.P.A.4:
Understand
and solve
inequalities with
one variable.
M.I.P.A.5:
Solve real-
world problems
involving simple
equation.
coordinate
plane.
M.I.P.A.9:
Perform
graphing
tables.
M.I.P.A.10:
Perform
graphing linear
equations.
M.I.P.A.11:
Understand
and solve
problems
involve slope
and intercepts.
M.I.P.A.12:
Constructing
linear
equations.
figures.
M.I.P.G.4: Solve
problems
involve
computing
perimeter and
area of
geometric
figures.
M.I.P.G.5: Solve
problems
involve
computing
surface area
and volume of
geometric solid
figures.
M.I.P.D.4: Create
and use
frequency tables.
M.I.P.D.5: Create
and interpret
graphs.
M.I.P.D.6: Read,
understand and
manipulate data
from tables and
graphs.
M.I.P.D.7:
Perform statistical
data analysis.
Sources: Authors’ developed standards based on information from ACT-Explore (2013); FLDOE (2014); NAD (2003)

25
Contents
The following is a short list of MIP contents.
Module 0: Course Overview (Duration: ½ Week)
Module I: Numbers, Properties, and Operations (Duration: 4½ Weeks)
Module II: Algebra (Duration: 5½ Weeks)
Module III: Geometry (Duration: 4 Weeks)
Module IV: Probability, Statistics, and Data Analysis (Duration: 2½ Weeks)
The following is the list of MIP contents in detail.
Module 0: COURSE OVERVIEW
1. Orientation and syllabus
2. eBackpack Program for Students
Module I: NUMBERS, PROPERTIES AND OPERATIONS
1. Computation and Basic Operation
1.1. Real and Rational Numbers
1.2. Estimating and Rounding
1.3. Absolute Value
1.4. Exponents, Roots, and Radicals
1.5. Scientific Notation
1.6. Primes and Greatest Common Factor
1.7. Units of Measure and Conversions
2. Ratio and Proportion
2.1. Ratio and Proportion and Their Applications

26
2.2. Percent and Interest
MODULE II: ALGEBRA
1. Variables and Expressions
1.1. Variables and Expressions
1.2. Simplifying and Evaluating Expressions
2. Properties and Order of Operations
2.1. Properties
2.2. Order of Operations
3. Equations
3.1. Equations with Variables on One and Both Sides
3.2. Solving Multi-Step Equations
3.3. Performing Word-to-Symbol Translation
4. Inequalities
4.1. Solving Inequalities by Adding or Subtracting
4.2. Solving Inequalities by Multiplying or Dividing
4.3. Solving Multi-Step Inequalities
5. Functions
5.1. Linear Functions
5.2. Coordinate System and Ordered Pairs
5.3. Graphing Tables and Linear Equations
5.4. Slope and Intercept
5.5. Writing Linear Equations
27
MODULE III: GEOMETRY
1. Points, Lines, and Line Segments
2. Angles
2.1. Acute, Right, and Obtuse Angles
2.2. Vertical, Complementary, and Supplementary Angles
3. Transversals
3.1. Parallel Lines and Adjacent Angles
3.2. Alternate Interior and Exterior Angles
4. Triangles
4.1. Right, Acute, and Obtuse Triangles
4.2. Equilateral, Isosceles, and Scalene Triangles
4.3. Similar Triangles
5. Rectangle, Square, and Circle
6. Solid Figures
7. Perimeter, Area, and Volume of a Figure
MODULE IV: PROBABILITY, STATISTICS AND DATA ANALYSIS
1. Probability
1.1. Calculating Probability
1.2. Tree Diagrams
2. Measure of Central Tendency
2.1. Mean, Median, Mode and Range
2.2. Frequency Table
28
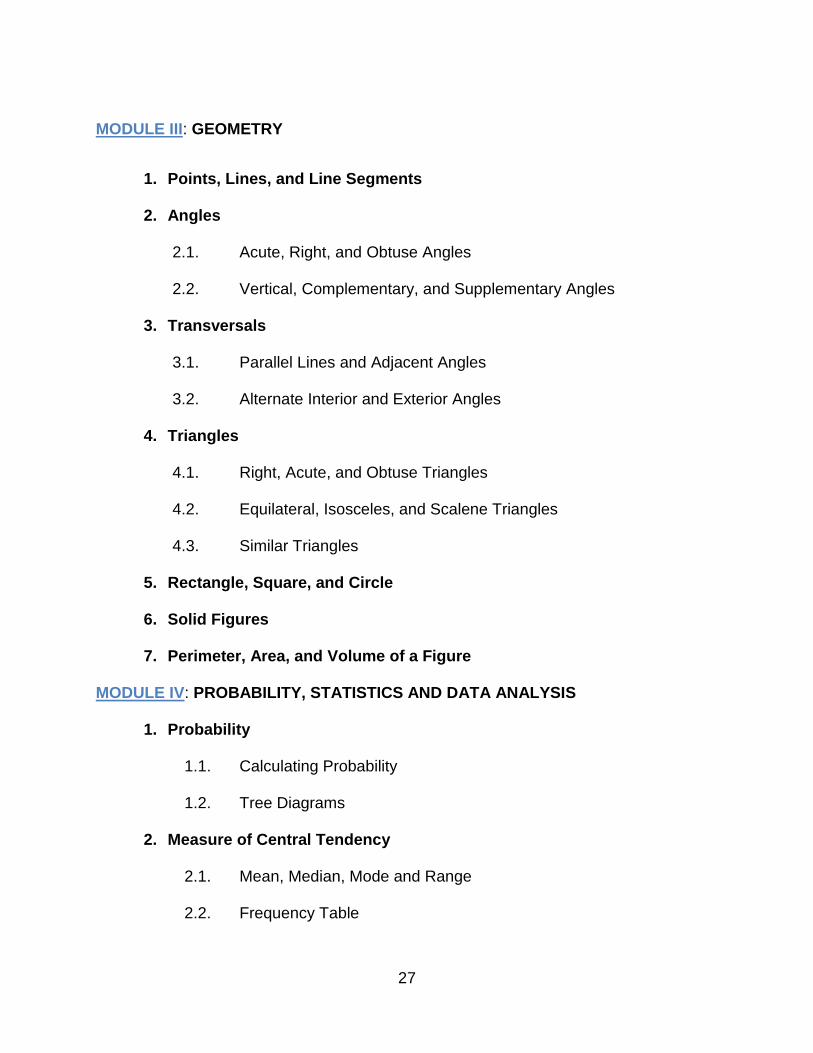
3. Creating and Interpreting Graphs
3.1. Reading and Interpreting Tables and Graphs
3.2. Bar, Line, and Circle Graphs
3.3. Histograms
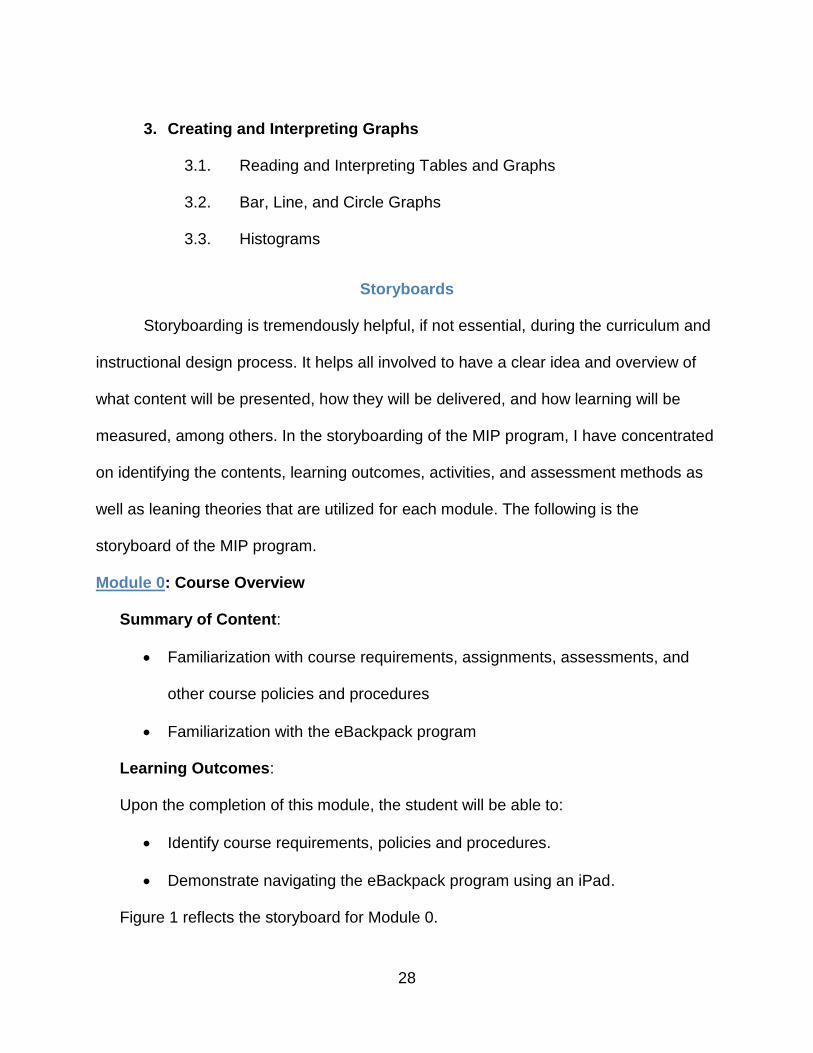
Storyboards
Storyboarding is tremendously helpful, if not essential, during the curriculum and
instructional design process. It helps all involved to have a clear idea and overview of
what content will be presented, how they will be delivered, and how learning will be
measured, among others. In the storyboarding of the MIP program, I have concentrated
on identifying the contents, learning outcomes, activities, and assessment methods as
well as leaning theories that are utilized for each module. The following is the
storyboard of the MIP program.
Module 0: Course Overview
Summary of Content:
Familiarization with course requirements, assignments, assessments, and
other course policies and procedures
Familiarization with the eBackpack program
Learning Outcomes:
Upon the completion of this module, the student will be able to:
Identify course requirements, policies and procedures.
Demonstrate navigating the eBackpack program using an iPad.
Figure 1 reflects the storyboard for Module 0.

29
Figure 1 — Storyboard for Module 0
Module I: Numbers, Properties and Operations
Summary of Content:
Activities
Students will be:
Reading and discussing the
syllabus
Navigating the eBackpack
program using students’ iPads
Completing the Act-Aspire test
(pre-test)
Assignments
Read the course syllabus
Explore the eBackpack program
Complete the ACT-Aspire test
(mathematics section only)
The contents and activities of this
module include Visual, Aural,
Kinesthetic, Interpersonal and
Intrapersonal intelligences within the
Multiple Intelligences Theory.
The assignments in this module fit into
the Bloom Taxonomy under Knowledge
and Application cognitive dimensions.
Assessment
Observation (formative, informal)
Performance task (formative,
informal)
Demonstration (formative,
informal)
Self- and peer-evaluation
(formative, informal)

30
Real numbers and operations involving rational numbers
Improper fraction and mixed numerals
Problems involving integer exponents, roots, and radicals
Estimating and rounding, absolute value, primes and greatest common factor
Scientific notation and conversion of units of measurement
Ratio and proportional relationships and their applications
Learning Outcomes:
Upon the completion of this module, the student will know and be able to:
The real number system and their characteristics and relationship
Estimating, scientific notation and rounding, absolute vale, primes and
greatest common factor
Proportion and use its applications
Solve simple and multi-step arithmetic problems using rational numbers.
Solve problems involving integer exponents, roots, and radicals.
Solve problems involving converting units of measurement.
Analyze proportional relationships and use their applications.
Solve problems involving percentage and interest.
Figure 2 reflects the storyboard for Module I.

31
Activities
Students will be:
Reviewing and solving problems
related to the previous concepts at
home using the module.
Studying the new concepts (as
directed) and solving related
problems using physical and
virtual recourses.
Working on the bell-work and
participating in the corresponding
class discussion.
Participating in the discussion of
the new concepts (and reviews)
presented in class.
Working on examples and
problems related to the presented
new concept individually or in
groups as well as interacting with
the teacher and the in-class tutor.
Completing the corresponding
module tests and quizzes in class.
Assignments
Review the assigned concepts
in the module using the online
links as well as resources
provided in the module and
workbooks.
Solve problems provided in the
module and workbooks as
directed, and check answers in
the provided sources.
Assessment
Observation (formative, informal)
Performance task (formative,
informal)
Demonstration (formative,
informal)
Self- and peer-evaluation
(formative, informal)
Quizzes (formative, formal)
End-of-module Test (summative,
formal) The contents and activities of this
module include Visual, Aural,
Kinesthetic, Logical, Interpersonal
and Intrapersonal intelligences within
the Multiple Intelligences Theory.
The assignments in this module fit
into the Bloom Taxonomy under
Knowledge, Comprehension,
Application and Analysis cognitive
dimensions.

32
Figure 2 — Storyboard for Module I
Module II: Algebra
Summary of Content:
Variables and expressions
Equations and inequalities
Linear Functions
Learning Outcomes:
Upon the completion of this module, the student will be able to:
Simplify and evaluate expressions.
Understand the laws of operations.
Apply the order of operations.
Solve equations and inequalities with one variable.
Understand and apply linear functions.
Understand coordinate system and ordered pairs, and locate points in the
coordinate plane.
Construct and graph linear equations and related tables.
Perform word-to-symbol translation and solve real-world problems.
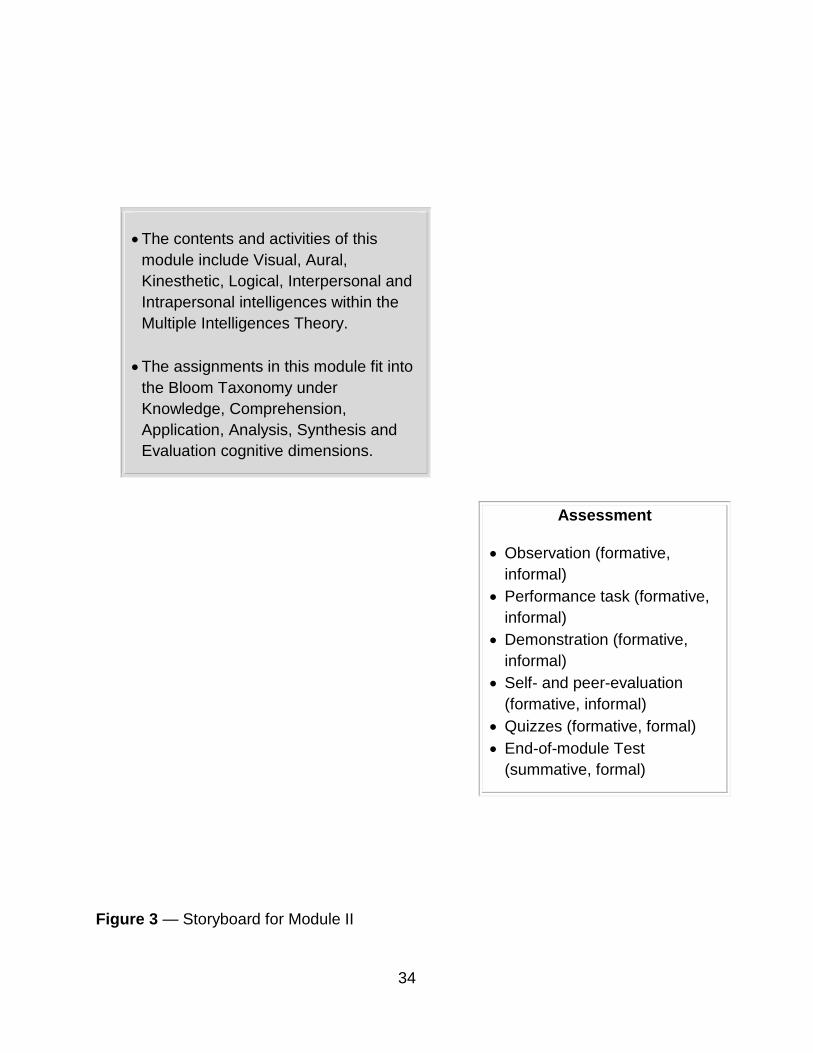
Figure 3 reflects the storyboard for Module II.

33
Activities
Students will be:
Reviewing and solving problems
related to the previous concepts at
home using the module.
Studying the new concepts (as
directed) and solving related problems
using physical and virtual recourses.
Working on the bell-work and
participating in the corresponding
class discussion.
Participating in the discussion of the
new concepts (and reviews) presented
in class.
Working on examples and problems
related to the presented new concept
individually or in groups as well as
interacting with the teacher and the in-
class tutor.
Completing the corresponding module
tests and quizzes in class.
Assignments
Review the assigned
concepts in the module using
the online links as well
resources provided in the
module and workbooks.
Solve problems provided in
the module and workbooks as
directed, and check your
answers in the provided
sources.
34
The contents and activities of this
module include Visual, Aural,
Kinesthetic, Logical, Interpersonal and
Intrapersonal intelligences within the
Multiple Intelligences Theory.
The assignments in this module fit into
the Bloom Taxonomy under
Knowledge, Comprehension,
Application, Analysis, Synthesis and
Evaluation cognitive dimensions.
Assessment
Observation (formative,
informal)
Performance task (formative,
informal)
Demonstration (formative,
informal)
Self- and peer-evaluation
(formative, informal)
Quizzes (formative, formal)
End-of-module Test
(summative, formal)
Figure 3 — Storyboard for Module II

35
Module III: Geometry
Summary of Content:
Points, lines and rays
Angles and transversals
Triangles
Rectangle, Square, and Circle
Solid figures
Learning Outcomes:
Upon the completion of this module, the student will be able to:
Define and distinguish pointes, lines and rays.
Understand different types of angles and their properties.
Understand angles associated with transversals and measure them.
Understand different types of triangles and their properties.
Understand rectangle and square and their properties.
Understand different types of triangles and their properties.
Compute the perimeter and area of geometric figures.
Compute the surface area and volume of solid figure.
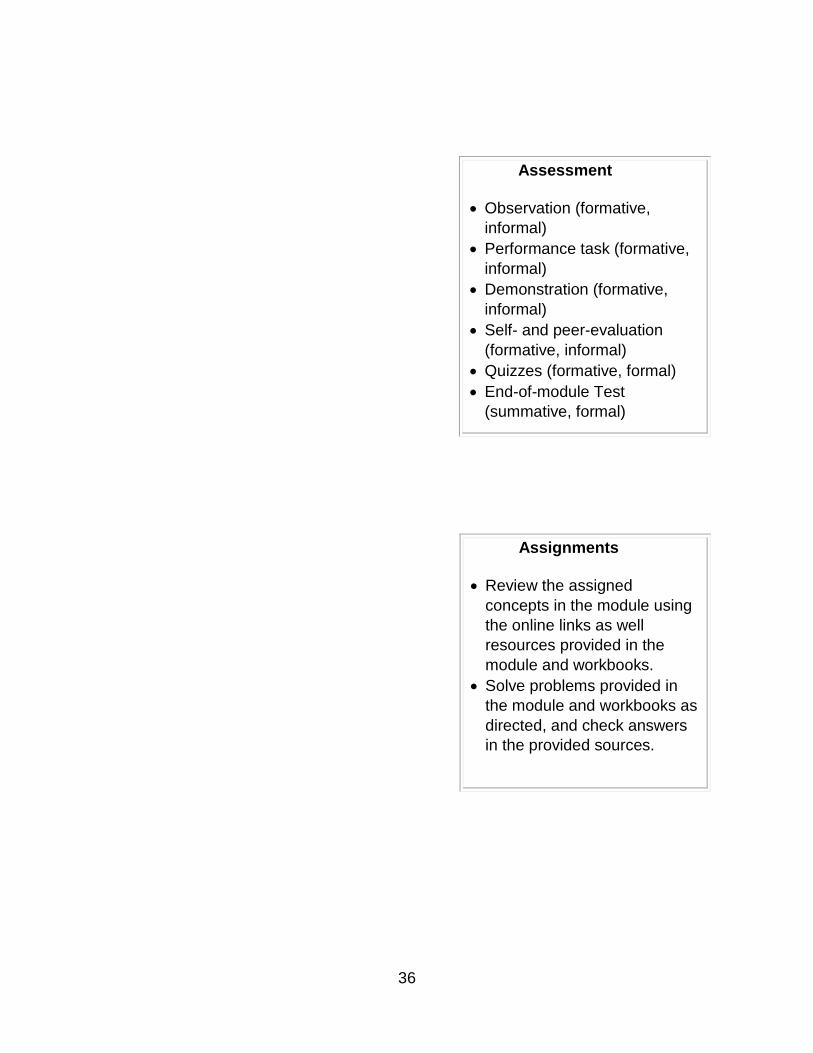
Figure 4 reflects the storyboard for Module III.
36
Assessment
Observation (formative,
informal)
Performance task (formative,
informal)
Demonstration (formative,
informal)
Self- and peer-evaluation
(formative, informal)
Quizzes (formative, formal)
End-of-module Test
(summative, formal)
Assignments
Review the assigned
concepts in the module using
the online links as well
resources provided in the
module and workbooks.
Solve problems provided in
the module and workbooks as
directed, and check answers
in the provided sources.

37
Activities
Students will be
Reviewing and solving problems
related to the previous concepts at
home using the module.
Studying the new concepts (as
directed) and solving related
problems using physical and virtual
recourses.
Working on the bell-work and
participating in the corresponding
class discussion.
Participating in the discussion of the
new concepts (and reviews)
presented in class.
Working on examples and problems
related to the presented new concept
individually or in groups as well as
interacting with the teacher and the
in-class tutor.
Completing the corresponding
module tests and quizzes in class.
The contents and activities of this
module include Visual, Aural,
Kinesthetic, Logical, Interpersonal
and Intrapersonal intelligences within
the Multiple Intelligences Theory.
The assignments in this module fit
into the Bloom Taxonomy under
Knowledge, Comprehension,
Application, Analysis, Synthesis and
Evaluation cognitive dimensions.
Figure 4 — Storyboard for Module III

38
Module IV: Probability, Statistics and Data Analysis
Summary of Content:
Probability of an event
Measure of central tendency
Tables and graphs
Learning Outcomes:
Upon the completion of this module, the student will be able to:
Determine the probability of an event.
Calculate the average of a list of numbers.
Determine the median, mode and range of a list of numbers.
Create and use frequency tables.
Create and interpret graphs.
Read, understand and manipulate data from tables and graphs.
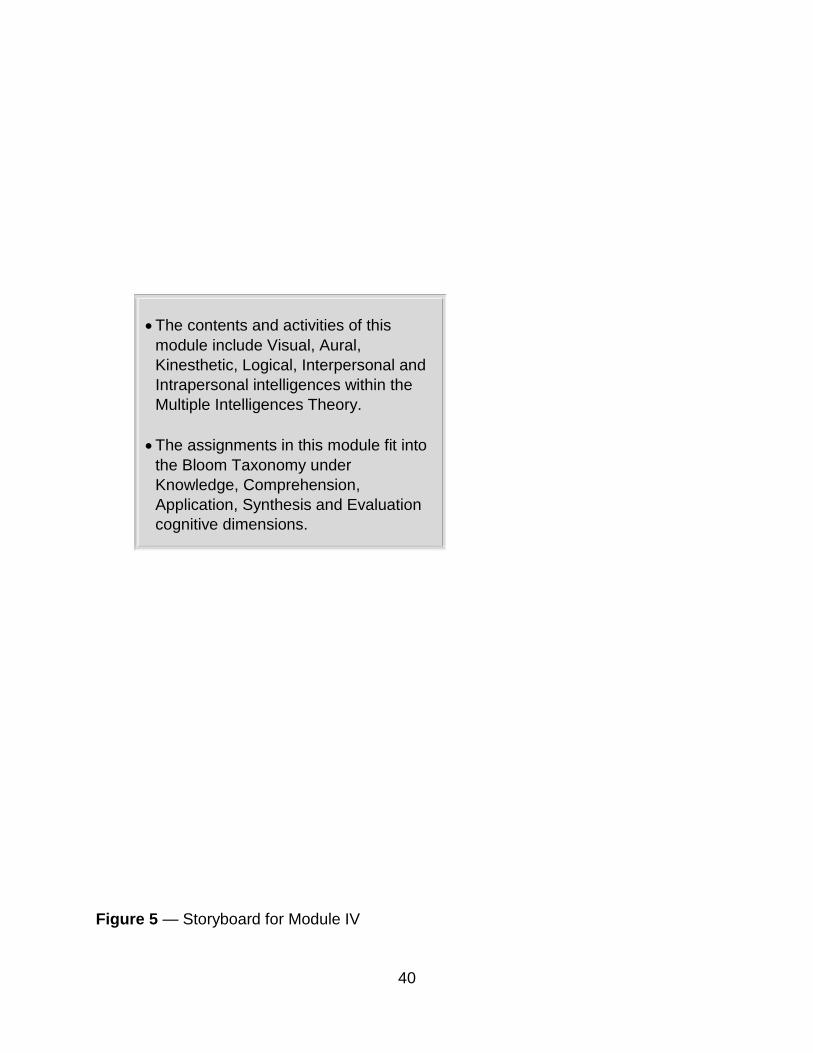
Figure 5 reflects the storyboard for Module IV.

39
Assignments
Review the assigned concepts
in the module using the online
links as well resources
provided in the module and
workbooks.
Solve problems provided in the
module and workbooks as
directed, and check answers in
the provided sources.
Activities
Students will be
Reviewing and solving problems
related to the previous concepts at
home using the module.
Studying the new concepts (as
directed) and solving related
problems using physical and virtual
recourses.
Working on the bell-work and
participating in the corresponding
class discussion.
Participating in the discussion of
the new concepts (and reviews)
presented in class.
Working on examples and
problems related to the presented
new concept individually or in
groups as well as interacting with
the teacher and the in-class tutor.
Completing the corresponding
module tests and quizzes in class.
Assessment
Observation (formative,
informal)
Performance task (formative,
informal)
Demonstration (formative,
informal)
Self- and peer-evaluation
(formative, informal)
Quizzes (formative, formal)
End-of-module Test
(summative, formal)
40
The contents and activities of this
module include Visual, Aural,
Kinesthetic, Logical, Interpersonal and
Intrapersonal intelligences within the
Multiple Intelligences Theory.
The assignments in this module fit into
the Bloom Taxonomy under
Knowledge, Comprehension,
Application, Synthesis and Evaluation
cognitive dimensions.
Figure 5 — Storyboard for Module IV

41
Textbook
Inclusion of a variety of sources has been important in the design of the MIP
program. Textbooks, in general, include too many topics, and promote an overwhelming
feeling for both students and teachers. A textbook is truly helpful if it is used as a tool to
promote learning, among other resources, and not taking a central role in the process of
teaching and learning. As Wiggins and McTighe (2006) observe, at their best, textbooks
“organize information and provide many exercises for reinforcing key knowledge and
skill” (p. 231). Having this principle in mind, the following criteria are considered for an
appropriate textbook for the MIP course: 1) covering the content of the MIP program, 2)
providing a balanced approach to the content and related explanations, 3) including
several solved examples and a variety of exercises and their answers, 4) being visually
pleasing and age appropriate, and 5) being relatively inexpensive since the cost of
providing the text was included in the MIP budget. After careful consideration, the
following three textbooks are designated for the MIP program which satisfy the above
criteria and offer more:
Spectrum (2007). Spectrum math – grade 8. Greensboro, NC: Carson-Dellosa.
Spectrum (2011). Spectrum algebra – grades 6-8. Greensboro, NC: Carson-
Dellosa.
Spectrum (2011). Spectrum Data Analysis & Probability – Grades 6-8.
Greensboro, NC: Carson-Dellosa.

42
Procedures
Upon a full or partial admission of the incoming freshmen at RHS, students’ prior
scores on the Explore test, the ITBS test, or FCAT 2.0 were collected and analyzed.
The following is the criteria for MIP placement: student test score on ACT Explore is 18
or less; student test score in FCAT 2.0 is 240 or less; or student normalized standard
score on ITBS is 3 or less. The procedures are as follow:
1. Students who met the placement criteria for the MIP were automatically placed in
the program during the first semester.
2. During the first week of the program students will take the ACT-Aspire test—pre-test.
3. During the regular class sessions, students studied each section in the selected
module, completed the section activities and exercises, and worked with the teacher
and tutor when necessary. Then, they reviewed the section and completed the
corresponding quiz(s). After completing each module, they reviewed the assigned
module and completed the corresponding end-of-module test.
4. At the end of the semester, students took the ACT-Aspire test again (post-test).
Student who scored 25 (%83.3) or above on the ACT-Aspire test were removed from
the MIP program. However, students with the score of 23 (%76.6) or less continued
with the MIP program in the following semester.
5. A student whose score was 24 (80%, borderline score) were considered for further
consideration. In such case, the MIP teacher compared the student’s average
percentage for each module with the cutoff percentage of 83 percent (grade “B” at
RHS). The result helped the teacher to determine whether the student would pass

43
the corresponding module, and thus only retake modules which she/he has earned
less that than 83 percent.
6. The results will also be analyzed and compared with students’ corresponding pre-
test scores to determine the success of the program.
Figure 6 demonstrates the procedures in detail.

44
Figure 6 – MIP Program Procedure
MIP
Program Procedures
Selection Process for Semester I
Student test score in Explore is 19 or more
OR
Student test score in FCAT 2.0 is 241 or more
OR
Student normalized standard score in ITBS
is 4 or more
Student test score in Explore is 18 or less
OR
Student test score in FCAT 2.0 is 240 or less
OR
Student normalized standard score in ITBS is
3 or less
Student will NOT be selected for the MIP
program
Student will be automatically placed in the MIP
program
Pre-test: MIP Students will take the ACT-Aspire test
MIP
Schedule (Fall 2013): students attend the MIP program during the 2nd period—
Monday and Wednesday (9:40-11:05 am) and Friday (9:40-10:30 am).
Post-test: MIP Students will take the
ACT-Aspire test
Student test score in Aspire is 23 or less
Student will be automatically placed in the
MIP program for the following semester
Student test score in Aspire is 25 or more
Student will NOT continue with the MIP
program
Student with a test score of 24 may only retake modules
with average test/quiz score of less than 80%.

45
Program Design
The purpose of this program design is to address the overall mathematics
remediation needs of the MIP students and teacher, Mathematics Department, and the
administration at RHS. It is designed for a face-to-face (F2F) classroom environment.
The overall design of this program is based on prior research, general principles of
design and learning, and personal experience (as a teacher, designer, and artist). The
MIP program is designed to include the following characteristics:
Promoting a student-center learning environment;
Empowering students to get directly involved in their own learning;
Using differentiated instructional strategies to maximize efficiency and learning;
Using the filliped classroom model to maximize student involvement;
Using appropriate technology and digital media to maximize learning and
differentiation;
Using elements of backward design principles and universal design for learning
to maximize efficiency and promote learning;
Using universal principles of design to enhance the overall usability and
aesthetics aspects of the design;
Using the learning styles theory to maximize differentiation and learning;
Incorporating theoretical approaches to learning that are derived from cognitive
psychology (aspects of information-processing approaches, motivational models,
Vygotsky’s sociocultural-cognitive theory, and Bandura’s social-cognitive theory);
Incorporating aspects of both teacher-led and constructivist approaches to
teaching and learning; and

46
Including assignments, activities, and assessment that are designed based on
cognitive process dimensions included in the Bloom’s Taxonomy for learning,
teaching, and assessing.
Although often neglected, the overall satisfaction of those who actually use the
product is central to a successful design. As Norman (2013) indicates, designs should
be human-centered—a philosophy that encourages designers to make products that
meet people’s needs and satisfaction, in terms of being functional, understandable,
usable, and visually pleasing. To accomplish these important results, designers must
have a “good understanding of people and the needs that the design is intended to
meet” (Norman, 2013, p. 9), which is accomplished primarily through observation of the
intended users and research. Such approaches are, indeed, vital in designing products
that are intended for use in an educational environment. The MIP program has been
designed with consideration for typical characteristics of MIP students and both novice
and veteran teachers. A typical MIP student is about 14 to 15 years old, mainly
freshman high school student with demographic characteristics similar to those of RHS
(more on this on Chapter III). Furthermore, in this design, ample consideration has been
given to both novice and veteran teachers. In practice, given the (daily) classroom
dynamics and teachers’ sense of autonomy and personal satisfactions, providing rigid
step-by-step action recipes for teachers’ functions in the classroom will not be practical.
In this regard, numerous resources, information, and guidelines are provided for novice
teachers. And, at times, flexible recipe-like actions are also provided to maximize
efficiency and productivity (especially for the novice teachers). Furthermore, the design
is flexible enough for a veteran teacher to modify certain aspects of the lesson plans

47
without changing the integrity of the program (more on these two points later in this
chapter).
Designing products that earn users’ overall satisfaction is a complex task given
the variety of individuals’ needs, preferences, interests, knowledge, and abilities.
However, designing a product for an educational learning environment which, along with
utilizing sound design principles, requires knowledge of multiple aspects of human
behavior and learning processes, and more, is a colossal task. Correspondingly,
designing a comprehensive and successful curriculum, in addition to an understanding
of the learners’ characteristics and needs, requires the knowledge of relevant learning
theories, and the necessary design elements among others. Several design and
learning principles and theories have been used in the design of the MIP program.
Theoretical Framework
Learning Theories
The theoretical approaches to learning that are derived from cognitive
psychology (information-processing approaches, motivational models, Vygotsky’s
sociocultural-cognitive theory, and Bandura’s social-cognitive theory); learning styles
theory, and constructivist approaches to teaching and learning; and cognitive process
dimensions included in the Bloom’s Taxonomy for learning, teaching, and assessing are
used in the design of the MIP program.
Vygotsky’s emphasis on the importance of social interactions during the learning
process is used in the design to promote a more collaborative program (student-to-
student during the group work activities; peer-tutoring) in which more experienced

48
students are used to help the teacher with the processes of “imitation and invention”
(Gredler, 2009). This theory is used hand-in-hand with Bandura’s emphasis on
observation, imitation, and modeling and their impact on learners’ cognitive processes
(Gredler, 2009). In this program, an experienced teacher, the designated tutor, and
online videos demonstrate how to approach learning new concepts, perform activities,
and solve problems. The Goal Orientation Models address the learners’ rationale for
engagement in a task and “how they approach and engage in learning activities”
(Gredler, 2009, p. 397). Correspondingly, the modules in this program (semi self-
directed and peer-coaching) are designed to enable students mastering desired tasks,
making progress in learning new skills, and/or feeling good about engaging in those
tasks—the very definition of success for learners with learning-goal orientations
(Gredler, 2009). Given the environment of a remediating classroom, especially in
mathematics, student motivation has a great impact on learning—thus the success of
the program. Therefore, the design of the program must maximize student motivation to
learn—an essential contributing factor in the learning process. In a learning
environment, such as a classroom which embodies learners from different cultures,
ethnicities, emotions, beliefs, and socioeconomic backgrounds, individual and group’s
motivation to learn become very complex and its analysis a colossal task. Nonetheless,
motivational principles seem comparable, although “specifics of motivational beliefs will
vary developmentally, culturally, and along other dimensions” (Rueda, 2011, p. 39).
Motivation, according to Mayer (2011), is a reflection of the amount of effort
learners exert to “engage in the appropriate processes of selecting, organizing, and
integrating” the material during learning (p. 39). As such, it is necessary to study

49
carefully the common indicators of motivational factors. These indicators, according to
Schunk, Pintrich, and Meece (as cited in Rueda, 2011), are identified as active choice—
actively choosing an activity over another—, persistence—commitment to follow an
activity over time, and effort—investing the necessary mental work. Moreover, the
importance of “variables” associated with these indicators—i.e., self-efficacy,
attributions, values, goals, and goal orientations (Rueda, 2011)—in the analysis of the
students’ motivation to learn is emphasized. Self-efficacy, according to Bandura (as
cited in Rueda, 2011), refers to “people’s judgments of their capabilities to organize and
execute the course of action required to attain designated levels of performances” (p.
39). More specifically, in an academic setting, it refers to the beliefs that learners can
successfully perform particular academic tasks (Zimmerman, as cited in Gredler, 2009).
The research indicates that people with higher self-efficacy tend to be highly motivated
to “engage in, persist at, and work hard at a task or activity” and that learners who
perceive themselves as competent for the task tend to learn better (Rueda, 2011, p.
41). Gredler, (2009) asserts that student self-efficacy may be “enhanced by observing
the success of peers who are perceived to be similar in competence” (p. 753). Rueda
(2011) recommends the following strategies to address motivational gaps with respect
to self-efficacy: 1) Frequently provide clear, accurate, and concise feedback, focusing
on the development of students’ expertise and skills; and 2) design tasks that provide
opportunities for success.
Usher and Pajares (2008) emphasize the powerful role of social modeling in “the
development of self-efficacy, especially when students are uncertain about their own
abilities or have limited experience with the academic task at hand” (p. 753). They
50
stress that such an impact is evident when learners “…who struggle through problems
until they reach a successful end, are more likely to boost the confidence of observers
than are mastery models…” (p. 753). However, Schunk (as cited in Gredler, 2009)
asserts that the use of modeling alone in a classroom seems to be “less effective than
when combined with some form of verbal instruction” (p. 375). In this regard, to promote
exerting extra effort to make sense of the presented lessons and maximize learning,
Mayer (2011) recommends providing instruction that fosters generative processing:
Providing relevant graphics along with the words, using a conversational style, relating
the new material with learners’ familiar knowledge to encourage motor activity, and
presenting the new material in a context of familiar situations. Furthermore, he asserts
that people learn better when a complex concept is presented in manageable parts
(segmenting) which also help learners to better manage their essential (cognitive)
processing. He further recommends providing worked examples with step-by-step
explanation of how to solve a problem using a variety of coaching, scaffolding, and
modeling techniques. Worked examples, according to Gredler (2009), are “effective in
facilitating learning in situations involving highly structures tasks or problems…” (p.
247). To facilitate meaningful learning, Mayer (2011) recommends providing pre- and
post-questions which help learners better focus “on parts of the lesson that help answer
the question” and develop expectations “for a certain type of questions” (p. 76). In
addition, providing familiar material relevant to learners’ prior knowledge and immediate
explanative feedback are highly recommended (Mayer, 2011). The MIP program is
designed to provide several solved examples (modeling) and numerous problems
51
(including answers) for each topic. This would help students to study and practice
individually and in groups both in class and at home.
Constructivism maintains that “meaning cannot be taught; it must be fashioned
by the learner via artful design and effective coaching by the teacher” (Wiggins &
McTighe, 2006, pp. 103-104). In comparison to teacher-centered, the higher benefits of
the constructivist’s approach (student-centered) in learning are well establishes.
However, “there is increasing consensus that the two approaches are compatible
and…that a balanced instructional paradigm will ultimately provide comprehensive and
effective instructional practices…” (Zemelman, Daniels, & Bizar, as cited in Johnson,
2004, p. 73). As Tomlinson (2001) observes, there are occasions in which sharing
information or using the same activity with the entire class is more effective or efficient.
She further observes that such instruction “establishes common understandings and a
sense of community of students by sharing discussion and review” (p. 5). Johnson
(2004) observes that a simultaneous combination of both constructivist approaches
(resulting in a “meaningful student learning, student-centered instruction, active student
involvement, student interest and motivation, and student personal satisfaction with
learning” (p. 83)) and instructionist approaches (systematic instruction, and curricular
efficiency as well as teacher control, organization, corrective feedback, and specific
student learning objectives) is essential in an all-reaching learning environment. As
such, although primarily relying on the constructivist approach to learning, the MIP
program is designed to incorporate aspects of the teacher-led approach as well.
52
Design Framework
The Backward Design model, Universal Design for Learning, Filliped Classroom
concept, and general principles of technology and digital media integration in instruction
are used in the design of the MIP program.
The MIP program is generally designed according to the principles of backward
design which is an approach in curriculum design that begins with desired results in
mind (Tomlinson & McTighe, 2006; Wiggins & McTighe, 2006). The essence of
backward design, according to (Wiggins & McTighe, 2006), is: “Given the desired
results and the targeted performances, what kind of instructional approaches,
resources, and experiences are required to achieve these goals?” (p. 192). Planning
curricula using the backward design process, the designer must consider three stages:
1) identifying desired results (to what students should know and be able to do), 2)
determining acceptable evidence (to determine whether students have achieved their
desired results), and 3) planning learning activities and instruction (to determine what
activities and resources are best necessary to accomplish learning goals) (Tomlinson &
McTighe, 2006; Wiggins & McTighe, 2006). In addition, as a theoretical framework for
the development of curricula, Universal Design for Learning (UDL) emphasizes on the
design of “curricula with the needs of all students in mind, so that methods, materials,
and assessment are usable by all” (Little, 2009, p. 10). As Meyer, Rose and Gordon
(2014) put it, the basic premise of UDL is to “provide equitable opportunities to reach
high standards across variable students in our schools” by providing multiple means of
engagement, representation, action, and expression (p. 7). These principles have been

53
used in constructing the backbone of the design of this program which is extensively
explained in the Curriculum Module section which follows later in this chapter.
The integration of technology and digital media in mathematics classrooms (and
other subjects) has continuously been encouraged, especially the use of mobile
technology, such as tablets, which is second nature to many students (Carr, 2012). With
its vast available application programs (apps), using iPads has become very popular in
learning institutions, most of which cannot afford providing it to all students. Given its
popularity and increased usage in the classroom, “scholarly research on the effects of
iPad use on education has been limited in general and nonexistent for mathematics
achievement since the device became available in 2010…” (Carr, 2012, p. 270). Using
mobile devices, in particular, has been important to RHS, given its recent paperless
initiative. At the present time, iPads are primarily used at RHS to replace physical
textbooks, maximize electronic communications between students and teachers,
facilitate electronic homework and project submissions, and utilize somewhat limited
other classroom usage—uniform related policies of which are yet to be determined at
the school level. Furthermore, there is no clear policy with regard to access to sites in
the Internet. This situation has contributed to limiting access to online resources to both
teachers and especially students. A lack of a general policy, in this regard, has also
affected the integration of some innovative instructional tools and strategies, such as
game-based learning applications—integration of which in the design of the MIP
program was highly desirable.
Flipped learning is not a new concept; however, it has become more popular,
manageable, and beneficial given the Internet, current technology, and mobile devices.
54
In addition, online resources such as Khan Academy with its wealth of reliable audio-
visual resources—providing more than “3,250 digital lectures at no cost” (Paslow, 2010,
p. 337) to the consumers—have made flipping classroom a reality for many. Although
this model stresses the use of instructional videos, it is important to note that flipped
learning is not about using videos in lessons; it is “about how to best use your in-class
time with students” (Sams & Bergmann, 2013, p. 16). The flipped classroom model
provides more opportunity for direct student involvement in their learning, and extends
the responsibility for learning to the students—enabling the teacher to allocate more
personalized attention to students in the classroom. According to Fulton (as cited in
Herreid & Schiller, 2013), teachers who are using this method “report seeing increased
levels of student achievement, interest, and engagement…” (p.62). Bergmann and
Sams (2012) observe that using the flipped classroom model helps struggling students
by providing more attempt to study using the videos; increases student-teacher and
student-student interactions during the class-time; enables slow learners to maximize
their learning—given that they can “pause and rewind their teacher” using the provided
videos (p. 24)—; and maximizes differentiated instructions. In contrast, Herreid and
Schiller (2013) indicate that the flipped model depends “heavily on students preparing
outside of class,” and so students “may come unprepared to class to participate in the
active learning phase of the course” (p. 63). Given this valid observation, a provision
has been made in the design of the MIP program to incorporate reviews of the assigned
studies during the (daily) bell-work session in class. Using the flipped classroom model
in the design of the program enables the MIP teacher (and tutor) to spend more time
with individual students. In addition, it helps them to provide a timely feedback to
55
individuals and groups of students during the class sessions. The provided online
videos in each module are at students’ disposal for immediate help, especially at home.
Design Specifications
This section provides detailed information about the design of the components
central to the MIP program itself—learning goals and objectives, instructional strategies,
assessment, individual modules, and more. It explains how elements of the identified
design and learning framework, explained earlier in this chapter, and research findings
are utilized to design and develop these vital components. The MIP program is modular,
and each module has two aspects: 1) the actual module contents that are used mainly
by the students and occasionally the teacher (e.g., Module I), and 2) the overall lesson
plans, standards, prerequisites, goals and objectives, and resources among others
related to each module that are used primarily by the teacher the teacher and
occasionally the academic dean (e.g., Curriculum Module I). This naming convention—
Module and Curriculum Module—is developed to help distinguishing these two aspects
of each module, and thus prevent confusion. The section is subdivided into two main
parts: 1) Curriculum Module, and 2) Module.
Curriculum Module
Framing Questions and Learning Goals
What we ought to teach and want students to know, understand, and be able to
do are central to teaching (Tomlinson & McTighe, 2006). Thus identifying the relevant
and appropriate goals and direction is essential to any educational program. Learning
goals, according to Marzano (2009), “provide a set of shared expectations among

56
students, teachers, [and] administrators…” (p. 4). McTighe and Wiggins (2013) stress
the establishment of essential questions—fundamental and necessary questions that
are thought-provoking and intellectually engaging—is essential to promote higher-order
thinking in the classroom as well as designing well-established learning goals. They
identify two kinds of essential questions: topical (specific questions) and overarching
(more general)—both of which are necessary in designing learning units. Designing
clear learning goals and objectives enables the teacher to guide the learner into the
nature of content and thus learning (Marzano, 2009). This is important because if
educators “aren’t sure of instructional goals, their instructional activities will not be
focused, and unfocussed instructional activities do not engender student learning”
(Marzano, 2009, p. 1). Learning goals and learning objectives are usually used
interchangeably. However, learning goals are more global in nature—what students
ought to know—and learning objectives are specific in nature—what student should be
able to do (sometimes under certain condition) according to a certain criterion. In
addition, in line with the essential questions and learning goals and objectives, a set of
focused questions are developed in each unit (in the MIP program) to better align the
content-focused formal assessment tools. Given the backward design principles,
teachers should identify specific learning goals and objectives, select learning activities
which best align with them, and design appropriate assessment processes to determine
whether learning of the desired goals and objectives is achieved. Table 3 identifies
sample essential questions, learning goals and objectives, and related standards for
Module I. In addition, a complete curriculum Module, including the information specific
to the section for Module I, is provided in Appendix B.

57
Table 3 — Essential Questions and Learning Goals and Objectives for Module I
Content Standards Essential Questions Learning Goals and Objectives
M.I.P.M.1: Know the real number
system, and be able to add, subtract,
multiply, and divide rational numbers.
M.I.P.M.2: Solve multi-step arithmetic
problems using rational numbers.
M.I.P.M.3: Solve problems involving
integer exponents, roots, and
radicals.
M.I.P.M.4: Understand estimating and
rounding, absolute value, primes, and
greatest common factor.
M.I.P.M.5: Understand the scientific
notation.
M.I.P.M.6: Solve problems involving
converting units of measurement.
M.I.P.M.7: Understand ratio and use
its applications.
M.I.P.M.8: Analyze proportional
relationships and use their
applications.
M.I.P.M.9: Solve problems involving
percentage and interest.
Why is it necessary to have
different types of numbers in
mathematics?
How are negative numbers
used in real life situations?
What are the benefits and
drawbacks of estimating?
Why is using the scientific
notation important?
When would using proportions
become necessary? Why?
Upon the completion of this module,
the student will know/understand:
The real number system and their
characteristics and relationship;
Estimating, scientific notation,
rounding, and primes and greatest
common factor;
Proportion and use its applications.
Upon the completion of this module,
the student will be able to:
Solve simple and multi-step
arithmetic problems using rational
numbers.
Solve problems involving integer
exponents, roots, and radicals.
Solve problems involving converting
units of measurement.
Analyze proportional relationships
and use their applications.
Solve problems involving
percentage and interest.

58
Differentiated Instructions and Learning Activities
The United States is a melting pot composed of people from many different
backgrounds (cultures, languages, habits, preferences, economics, and more).
Inevitably such differences are also present in a learning environment. As Tomlinson
and McTighe (2006) observe, “culture, race, language, economics, gender, experience,
motivation to achieve, disability, advanced ability, personal interests, learning
preferences…are just some of the factors that students bring to school with them in
almost stunning variety” (p. 1). Given these diverse personal, social, and economical
factors, “diverse learners at risk and the demands of the new global economy of the 21st
century, educational leaders are requiring more from all students” (Coyne, Kame’enui, &
Carnine, 2011, p. 4). Furthermore, “Students with divers learning and curricular needs,
primarily children living in poverty, children with disabilities, and children with limited
English-speaking skills face numerous forces—cultural, familial, sociological, political,
educational, and economic—that place them at increasing social and educational risk”
(Coyne at al., 2011, p. 2). Naturally, in addition to demographics and characteristic
diversity, students differ in their background knowledge, preferred styles, and the pace
at which they learn. Such learners’ diversity demands a variety of instructional
strategies in order to help them becoming better learners, thinkers, and skilled in order
to be better prepared for the demands of the 21st century and global economy. Unlike
providing instructions predominantly through teacher direction, differentiating instruction
enables diverse students to become more independent and self-regulated (Coyne et al.,
2011). Tomlinson (2001) identifies the following conditions under which people learn
best: a) when content is personally meaningful, challenging, and appropriate for the
59
learner’s developmental level, b) when learner has choice and feels in control, c) when
there exists “opportunities for social interaction,” d) when learner receives timely and
helpful feedback, and e) the learning “environment supports the intended learning”
among others (p. 18). Naturally, such consideration, when designing instructional
strategies, enforces the teacher to create units of instructions that promote and
maximize student learning. A differentiated classroom, as Tomlinson (2001) observes,
“provides different avenues to acquiring content, to processing or making sense of
ideas, and to developing products so that each student can learn effectively” (p. 1).
Similar to the flipped classroom model, differentiated instructions help the
teacher to maximize interactions with students and attend to their specific needs, and
thus become more of a coach, guide, or mentor in the classroom. A differentiated
classroom environment facilitates and promotes direct student involvement in learning.
By incorporating students’ learning personalities, background knowledge, and preferred
style of learning as well as accommodations for students with special needs,
differentiated instructions truly promote and facilitate a student-centered learning
environment. Stressing that learning happens “within students, not to them” (p. 22),
Tomlinson and McTighe (2006) recommend the following guidelines and strategies
which promote differentiating instruction: a) continually, seek opportunities to get to
know students, b) “offer more ways to explore and express learning” (p. 20), c) regularly
use informal assessment strategies to monitor student progress, d) “teach in multiple
ways” (p. 21), e) allow student working individually or in groups, f) respond to struggling
students by adjusting instruction to address their gap in knowledge and skills, g) use
clear and concise rubrics that “coach for quality” (p. 21), and h) “cultivate a taste for

60
diversity” (p. 22). To address student readiness, interest, and learning profile, Tomlinson
and McTighe (2006) stress using small group instruction, designing task at different
degrees of difficulty, expressing learning in a variety of models, and incorporating a
variety of teacher presentation approaches among others.
The central instructional issue, according to Bottge et al. (2010), is “how to
deliver engaging instruction that values procedural fluency (e.g., computing with
fractions) while also giving attention to conceptual understanding (e.g., the meaning
behind computational rules)” (p. 82). In this regard, research recommends incorporating
a variety of authentic (real-world) problems and hands-on activities in the instruction
along with clear and timely feedback. In addition, Wiggins and McTighe (2006)
recommend designing activities that focus on “clear and worthy goals” that help student
to develop “greater skill and understanding,” and providing ample opportunities for
students for self-assessment and self-adjustment on feedback (p. 196). Bottge et al.
(2010) recommend designing instructional strategies that include problems with real-
world applications, providing “in-depth instruction on skills and concepts as students
need them,” and allowing students to “work together in small groups to discuss, test,
and find solutions to the problems” (p. 83). The use of modeling and demonstrating
techniques in instruction is essential in successful teaching and learning, especially in
complex subjects, such as mathematics. Students’ strengths even in a single subject
area do vary as they do in their preferences in working individually or in groups. A
differentiated classroom highly encourages teachers to make accommodations for both
preferred styles in instructional planning. To maximize differentiation, teachers may
allow flexible group formation either by selecting the group members or permit students

61
to form their own. Both strategies are useful; however, certain instructional activities
may require the teacher to create “skills-based or interest-based groups that are
heterogeneous in readiness level”—based on “the match of the task to student
readiness, interest, or learning style” (Tomlinson, 2001, p. 102). The use of modeling
and demonstrating techniques in instruction is essential in successfully teaching and
learning mathematics. Doabler et al. (2012) stress regularly using the modeling and
demonstration techniques in instructional tasks, presenting “visual representations of
math ideas” (p. 50), and providing “frequent and meaningful practice and review
opportunities” (p. 52). Archer and Hughes (as cited in Doabler et al., 2012) suggest
using the following three ways to improve the quality of teacher models: 1) using “clear
and concise language,” 2) providing several (yet not overwhelming) models, and 3)
allowing “students to actively participate in the models, such as answering questions”
(p. 52).
The differentiated classroom is designed with consideration to learners’ diversity
and needs in many areas. Accommodations, according to Little (2009), may be
considered and implemented in “instructional methods and materials; assignments and
classroom assessments; time demands and scheduling; learning environment; and use
of special communication systems” (p. 9). In addition to struggling students, a
differential classroom also requires accommodations for students with special needs,
such as advanced and ELL students, among others. It is important to note that
advanced learners’ special needs are usually dismissed or unrecognized, and thus they
are not accommodated. These students also require teacher’s help to develop their
abilities and achieve their potentials (Tomlinson, 2001). To accommodate advanced
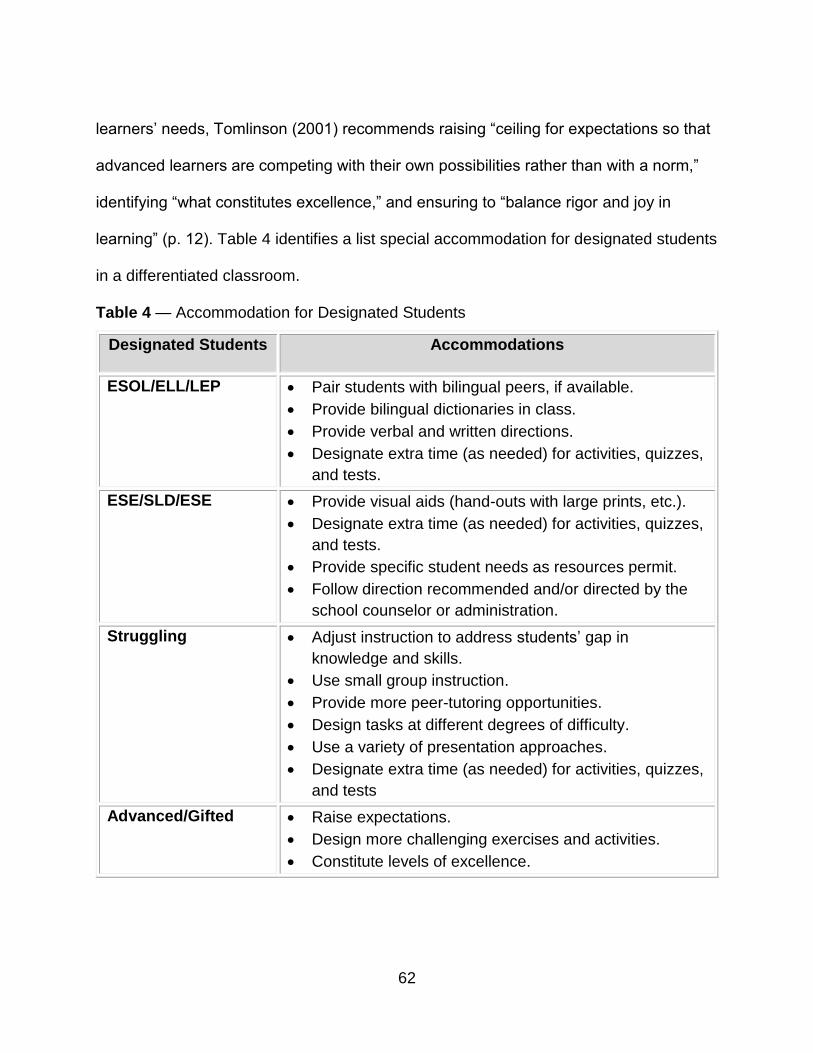
62
learners’ needs, Tomlinson (2001) recommends raising “ceiling for expectations so that
advanced learners are competing with their own possibilities rather than with a norm,”
identifying “what constitutes excellence,” and ensuring to “balance rigor and joy in
learning” (p. 12). Table 4 identifies a list special accommodation for designated students
in a differentiated classroom.
Table 4 — Accommodation for Designated Students
Designated Students Accommodations
ESOL/ELL/LEP Pair students with bilingual peers, if available.
Provide bilingual dictionaries in class.
Provide verbal and written directions.
Designate extra time (as needed) for activities, quizzes,
and tests.
ESE/SLD/ESE Provide visual aids (hand-outs with large prints, etc.).
Designate extra time (as needed) for activities, quizzes,
and tests.
Provide specific student needs as resources permit.
Follow direction recommended and/or directed by the
school counselor or administration.
Struggling Adjust instruction to address students’ gap in
knowledge and skills.
Use small group instruction.
Provide more peer-tutoring opportunities.
Design tasks at different degrees of difficulty.
Use a variety of presentation approaches.
Designate extra time (as needed) for activities, quizzes,
and tests
Advanced/Gifted Raise expectations.
Design more challenging exercises and activities.
Constitute levels of excellence.

63
Table 5 identifies sample differentiated instructional strategies and learning
activities. In addition, a complete curriculum module including related lesson plans for
Module I is provided in Appendix B.

64
Table 5 — Differentiated Instruction and Learning Activities
Differentiated Instruction Learning Activities
Providing visual aids, PowerPoint (visual-
aural);
Providing verbal explanations (aural);
Using written materials (aural-visual);
Assigning hands-on activities (kinesthetic);
Providing (online) video clips (visual-aural);
Providing links to appropriate website(s)
related to the topic;
Allowing collaborations, using flexible
grouping techniques;
Using modeling techniques (using teacher,
student, videos, etc.);
Chucking—especially complex topics
(breaking concept into smaller with
parts/patterns—grouping);
Allowing students to work individually;
Providing special activities for struggling
and advanced students;
Providing special assistance and activities
for ESOL and ESE students;
Providing student-tutoring (peer-tutoring);
Providing guided practice—step-by-step
directions;
Providing individual teacher/tutor
assistance;
Providing ongoing feedback.
Bell-work
Teacher invites students to ask questions about their study and
problems that may have. Then the teacher and students review the new
topic which students have already studied. Most elements of
instructionist teaching will be used during the bell-work session. This
session could last up to 20 minutes.
Class-work
Working individually or in groups, students engage in performing a
variety of tasks and activities the selected by both students and the
teacher—activities such as solving select problems from the module,
MIP textbooks, and online; watching the designated video clips; and
exploring the identified websites.
The teacher observes (individual and groups) of students while they work
on their activities and assignments. The teacher provides feedback, and
may actively and/or passively participate in students’ activities, during
which the teachers provided feedbacks. In addition, as student work on
their activities, they also evaluate their progress and achievement using
the guidelines set by individual students and the teacher.
Students may take a tutoring role and rotate this responsibility while
working in groups. During these activities, students may perform certain
task, demonstrating their mastery of the designated content. In addition to
participating in these groups, the teacher and the tutor will work with the
students who work individually on their selected and/or designated tasks
and activities.
Recap
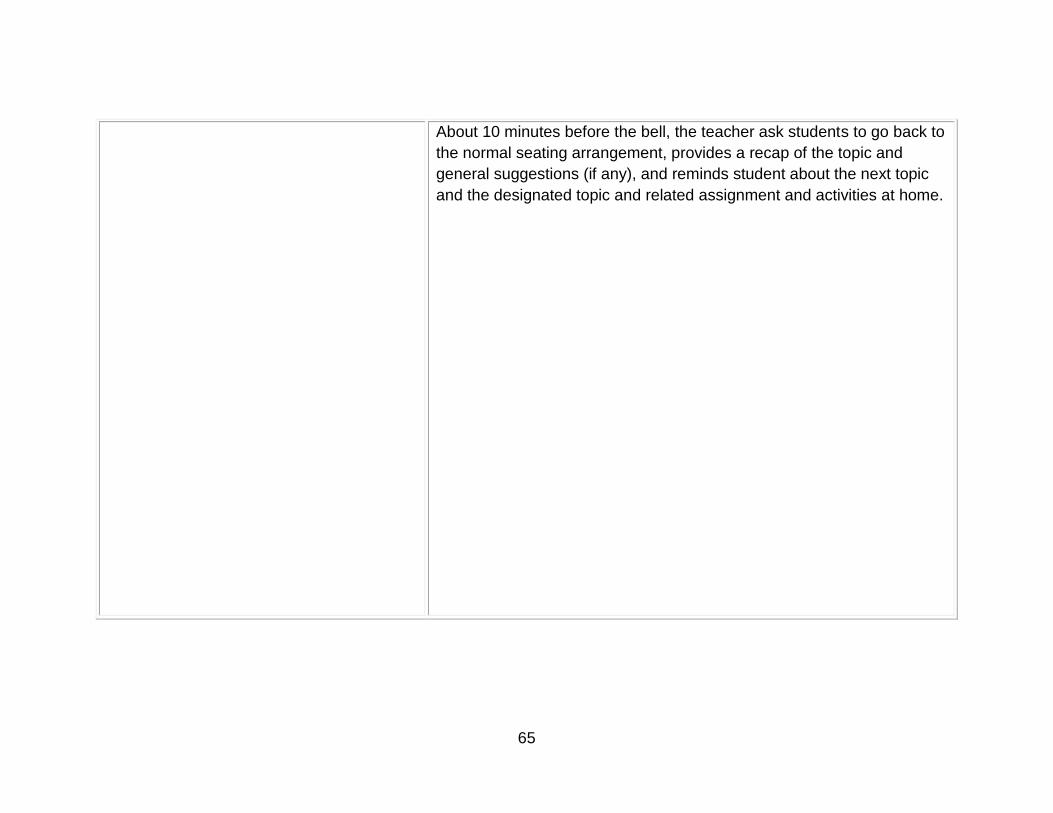
65
About 10 minutes before the bell, the teacher ask students to go back to
the normal seating arrangement, provides a recap of the topic and
general suggestions (if any), and reminds student about the next topic
and the designated topic and related assignment and activities at home.

66
Assessment
Essential to backward design principles, an ongoing assessment is vital to the
learning and instructional processes. In this regard, taking a test at the end of a module
will, at best, represent an insufficient or incomplete picture of student mastery of the
content and thus learning achievement. To obtain a relevant and reliable
picture/outcome, determination, given the desired results, of evidence is required to
ensure that students have achieved them. Little (2009) views assessment as a
“systematic process whereby information about student learning is collected to make
instructional decisions,” and indicates that assessment should “match student’s needs,
the curriculum, and instructional strategies” (p. 9). The purpose of testing, according to
Kubiszyn and Borich (2007), is to “collect objective information that may be used in
conjunction with subjective information to make better educational decision” (p. 65). A
balanced approach in assessment, i.e., using a variety of assessment techniques—in
line with the spirit of the backward design—is necessary in order to analyze “student
accomplishment against specific goals and criteria” (Wiggins & McTighe, p. 337). Given
the diversity of learners, a variety of assessment processes are required in order to
measure and subsequently make valid inferences about the degree to which students
truly know, understand, and be able to do (Tomlinson & McTighe, 2006; Wiggins &
McTighe, 2006). An assessment may be formal (preplanned, such as a test) or informal
(spontaneous, such as teacher observation). Both assessments may be quantitative
and qualitative in nature, although informal assessments are usually viewed as
qualitative. Tomlinson and McTighe (2006) identify three major types of assessments:
1) Formative—ongoing assessments which “occur concurrently with instruction,”

67
2) Summative—generally “used to summarize what has been learned,” and
3) Diagnostic—generally “used to check students’ prior knowledge and skill levels” (p.
71). In the design of the MIP program, formal, informal, formative, and summative types
of assessment are used to assist instruction and evaluate student learning.
Furthermore, formal assessment tools in MIP are criterion-based. A criterion-based
assessment tool measures a student performance against selected criteria
(standards)—in this case, MIP standards.
Student learning assessment is enhanced with greater use of a variety of
formative assessment techniques such as observation, performance task,
demonstration, oral explanations, and peer-assessment. In addition, as Wiggins and
McTighe (2006) observe, empowering students to take greater role in learning is greatly
enhanced when assessment techniques such as self-monitoring and self-assessment
are incorporated. In this regard, constructing a variety of response items allows
“students to show their work and reveal their thinking” (Wiggins and McTighe, 2006, p.
161). As part of the instructional design, provisions must be made for teachers to assist
students to “self-monitor, self-assess, and self-adjust their work, individually and
collectively, as the work progresses” (Wiggins & McTighe, p. 215). To have an accurate
measure of student learning, assessment items should measure what it is supposed to
measure—also referred as the validity of an assessment tool. In other words, there
must be an alignment between the test items and their related contents and thus related
standards. As such, it is considered to be the “…evidence of an achievement test’s
content validity” (Kubiszyn & Borich, 2007, p. 35). To ensure alignment and maximize
validity for formal quizzes and end-of-module tests, test items for each module are

68
selected and/or designed directly from the related sections in the module—content
focused. Unlike the on-going informal assessments which directly or indirectly address
the essential questions and learning goals and objectives, the formal assessment
processes in MIP are directly related to the learning objectives and focused questions.
Whether formal or informal, assessment tools and processes should be clear and
concise, include the necessary information such as required time and total value points,
identify permitted tools and materials; and provide references to the related content for
each item and more. In addition, Wiggins and McTighe (2006) recommend using the
following techniques when developing assessment tools and materials: 1) deriving items
from the goals and objectives, 2) using a reasonable number of questions, and
3) framing the question in “kid language [simple and age appropriate] as needed to
make them more accessible” (p. 121). Student learning assessments should follow a
timely, clear, and specific feedback to the student, resulting in the necessary
instructional adjustment. As Marzano (2009) puts it, “If goals provide clear target for
learning, then feedback may be thought of as information that facilitates the process of
reaching those target” (p. 10). Hattie and Timperley (as cited in Marzano, 2009) indicate
that the main purpose of feedback in educational settings is to “reduce discrepancies
between current understandings and performance and a goal” (p. 10). Assessment tools
in MIP are designed to include two to three problems from each section in the module.
This process will assist teachers to assess students’ performance and learning
achievement specific to each topic in the module, and provide detailed feedback to
students and their parents. Availability of rubrics is very important, especially for the
assessment purposes. Using rubrics, teachers can provide timely, detailed, and
69
meaningful feedback more efficiently. Rubrics describe “the degree of quality,
proficiency, or understanding along a continuum” (Wiggins & McTighe, 2006, p. 173),
and facilitates student “self-assessment and self-improvement” as well as
“communication with students, parents, faculty, and administration” (Stevens & Levi,
2005, pp. 21, 23).
Embedded in its design, the MIP program requires a comprehensive assessment
process which includes a variety of assessment procedures, such as observation,
performance tasks, demonstration, self- and peer-evaluation, quizzes, and tests.
Assessment types and related processes and examples are provided in Table 6.
Furthermore, the overall formal assessment tools (including Taxonomy specification,
test items, and related rubrics) for Module I are available in Appendix C.

70
Table 6 — Assessment Type, Characteristic, and Process
Assessment Type/Characteristic Process
Observation formative,
informal
An on-going assessment process — The teacher’s observe (individual and
groups) of students while they work on selected assignment and activities
during the bell-work and/or subsequent class-time. During this evaluation
process, the teacher will actively and/or passively participate in students’
activities, and share thoughts and observation when necessary.
Performance
Task
formative,
informal
An on-going assessment process — Working individually or in groups, students
engage in performing a variety of tasks and activities, such as solving
problems, as selected by both students and the teacher.
Demonstration formative,
informal
An on-going assessment process — Students may take a tutoring role and
rotate this responsibility while working in groups. During these activities,
students may perform certain task, demonstrating their mastery of the
designated content. In addition to participating in these groups, the teacher will
work student who work individually while they perform selected tasks.
Self- and
peer-evaluation
formative,
informal
An on-going assessment process — As student works progress, they evaluate
progress and achievement using guidelines set by individual students and the
teacher.
Quiz formative,
formal or
informal,
criterion-bases
(rubrics
provided)
A minimum of one to two formal quizzes are designated for each module
including content-focused items. At the discretion of the teacher, short/pop-
quizzes (informal) may also be takes in class for diagnostics purposes. B

71
Test summative,
formal
criterion-bases
(rubrics
provided)
End-of-module test—one test is designated for each module. The related
assessment items are content-focused.

72
Syllabus
Many educators, rightfully, consider syllabus as a contract between the students
and the teacher with respect to the related course. A well-developed syllabus is
essential in communicating the course contents; learning goals and objectives; list of
required and recommended resources, tools, and materials; list of prerequisites;
communication protocols; grading policy; course calendar; list of activities, assignment,
projects, tests and related rubrics; and relevant school policies among others. In
addition to including the necessary components mentioned above, the MIP syllabus is
designed to include age-appropriate visually pleasing elements. A copy of the MIP
syllabus is provided in Appendix E.
Module
In this section, the overall design on the modules is explained. Modules are
extremely important in the overall design of the MIP program, for they are used primarily
by the students. Although the teacher may use MIP modules (from time-to-time) for
different purposes, students routinely use them as a primary source during the entire
program. Modules include, identify, and refer to a variety of physical and virtual sources
relevant to each topic as well as information about the module content, learning goals
and objectives, assessment, and schedule among others. Given its importance,
especially with respect to the students, outmost attention has been paid to the
aesthetics aspects of the modules, in addition to its usability and functionality as a
product. The human-centered design concept has been considered in the overall design
of the MIP program which Norman (2013) defines as “an approach that puts human
73
needs, capabilities, and behavior first, then designs to accommodate those needs,
capabilities, and ways of behaving” (p. 8). Discoverability, in a system, is defined as,
“discovering what it does, how it works, and what operations are possible” (Norman,
2013, p. 10). Among the psychological concepts resulting discoverability, affordance
and signifiers concepts are used in the process of designing modules in MIP program.
For example, several navigation buttons and labels are presented in each module which
communicate possible actions (e.g. content) with the user—affordance—and where
these actions should be taken—signifiers (Norman, 2013). A successful design,
according to Lidwell, Holden, and Butler (2010), must meet people’s basic needs, such
as needs for functionality of its components—for example, do the online links provided
in the module function? b) reliability needs for stable and consistence performance—for
example, do the navigation buttons in the module work consistently? c) proficiency
needs—for example, do students feel that they are making progress when they use (the
content of) the module? In addition, it is utterly important to note that “designs should be
usable by people of diverse abilities, without special adaptation or modification” (Lidwell
et al., 2010, p. 16). The characteristics of an accessible design, such as perceptibility
(being able to use the design regardless of the user’s sensory abilities) and simplicity
(being able to use the design regardless of the user’s experience and literacy level)
have been incorporated in the design of the MIP module (Lidwell et al., 2010, p. 16). For
example, the modules’ components are presented using redundant coding (consistent
text, icon, color, etc.)—perceptibility— and excluding the unnecessary complexity
(usage of simple and concise works and expressions, etc.)—simplicity. In order to

74
identify and explain the overall design of the modules more specifically and efficiently,
these design aspects are grouped according to their usability and aesthetics principles.
Usability
Usability of a design has to do with its simplicity, forgiving (Lidwell et al., 2010),
and usefulness. To enhance the usability of the MIP modules, as recommended by
Lidwell et al. (2010), the following principles are used: the 80/20 rule, consistency,
layering, performance load, progressive disclosure, and readability principles.
The 80/20 rule indicates that “approximately 80 percents of the effects generated
by any large system are caused by 20 percent of the variables in the system” (p. 14).
Most teachers and students concur with this principle that applies to the majority of
textbooks in the market—i.e., approximately 80 percent of the information in many
textbooks is provided by about 20 percent of its content. In this regard, special
consideration has been made so that the overall content of the modules in the MIP
program is kept to an absolute minimum—excluding any unnecessary information,
graphs, images, etc. The “usability of a system is improved when similar parts are
expressed in similar ways,” and functional consistency refers to the consistency of
symbol, meaning, and action (Lidwell et al., 2010, p. 56). For example each icon in a
module corresponds to a specific function. Using the functional consistency principle,
these relationships have been replicated in all modules. To manage complexity and
reinforce relationships in information, module contents are organized into related
groups—a process that is identified as layering (Lidwell et al., 2010). Topics in each
module are grouped into separate sections—accessible by their corresponding

75
navigation buttons, according to their relationships—, which also helps with managing
the complexity of topics. Performance load is defines as the degree of mental activity
(i.e., the “amount mental activity—perception, memory, problem solving”—cognitive
load) and physical activity (i.e., “degree of physical activity—number of steps or
movements, or amount of force”—Kinematic load) required to accomplish a goal
(Lidwell et al., 2010, p. 178). The cognitive load management has been combined with
the layering principles in the design of the MIP modules. Furthermore, to manage its
Kinematic load in its design—in addition to the menu buttons at the beginning of each
module—, several ‘return buttons’ are included to facilitate navigation and reduce extra
and/or unnecessary steps. To prevent information overload and manage information
complexity, “only necessary or requested information is displayed at any given time”
which is identified as progressive disclosure (Lidwell et al., 2010, p. 188). The principle
of readability—expressing “complex materials in the simplest way possible” (Lidwell et
al., 2010, p. 198)—along with layering, cognitive load, and readability principles have
been the basis, using which topics in each module are grouped and presented. To
enhance readability, Lidwell et al. (2010) recommend omitting needless words or
punctuation, avoiding acronyms or jargon, managing sentence length, and using simple
(and age appropriate) language.
Aesthetics
Aesthetic aspect of a design is concerned with the overall appearance of the
design and its appeal to the end-user. Aesthetic designs, according to Lidwell et al.
(2010), are “effective at fostering positive attitudes;” are perceived as easier to use and

76
more readily accepted; promote “creative thinking and problem solving;” and foster
“positive relationship with people” (p. 20). Among the principles used which enhance the
appeal of a system, recommended by Lidwell et al. (2010), the following are used in the
design of the MIP modules: alignment, color, picture superiority effect, proximity, and
similarity principles.
To create a sense of unity, cohesion, and stability, elements in a design should
be aligned with one another (Lidwell et al., 2010). Common elements of the modules
are consistently placed such that edges line up along common rows, columns, or
center. As Williams and Tollett (2006) observe, color can “create moods, add emphasis,
attract attention, organize information, and entertain the viewer” (p. 100); however, its
excessive or inappropriate use can be counterproductive. In the design of modules,
colors have been used consistently yet conservatively for grouping and aesthetics in a
balance with the graphs and icons present in each module. To improve recognition and
recall of key information, the picture superiority effect principle used for “pictures are
generally more easily recognized and recalled than words” (Lidwell et al., 2010, p. 184).
The picture superiority effect along with the proximity principle—the developed
relationships as the result of placing items close together (Williams, & Tollett, 2006)—
and similarity principle—similar elements are perceived to be more related than
elements that are dissimilar (Lidwell et al., 2010)—are used in designing modules to
maximize optimal effect and improve cognitive load when presenting the same
information. As a sample, a full copy of Module I is provided in Appendix D.
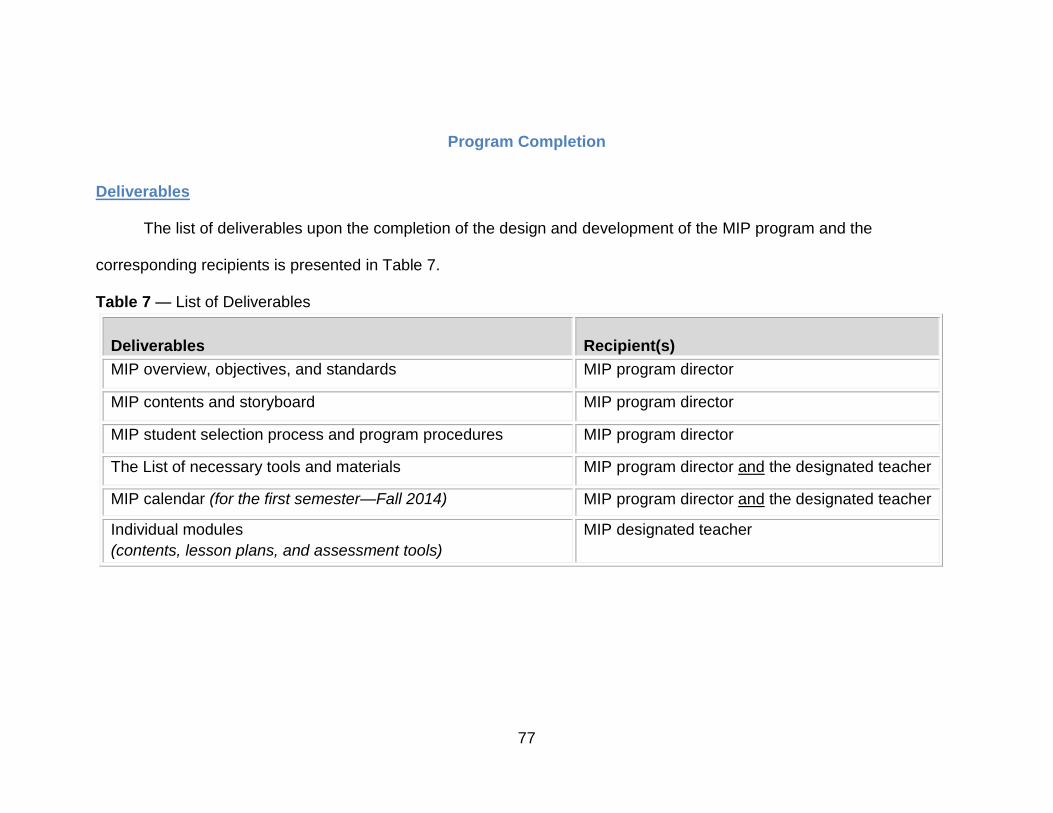
77
Program Completion
Deliverables
The list of deliverables upon the completion of the design and development of the MIP program and the
corresponding recipients is presented in Table 7.
Table 7 — List of Deliverables
Deliverables
Recipient(s)
MIP overview, objectives, and standards MIP program director
MIP contents and storyboard MIP program director
MIP student selection process and program procedures MIP program director
The List of necessary tools and materials MIP program director and the designated teacher
MIP calendar (for the first semester—Fall 2014) MIP program director and the designated teacher
Individual modules
(contents, lesson plans, and assessment tools)
MIP designated teacher

78
Timeline
The allocated time for the design and development of the program is four months (April-July 2014). The related
timeline is provided in Figure 7. In addition, the implementation timeline (for Fall 2014) is provided in Figure 8.
1. Develop Standards April 1-4
2. Develop Overview and Content April 7-11
3. Determine tools and materials April 7-30
4. Develop the storyboard April 15-30
5. Determine the processes and procedures April-May
6. Develop individual modules May-July
7. Develop the calendar July 15-31
0 (April) 1 (May) 2 (June) 3 (July) 4
Timeline (in month)
Figure 7 – Design and Development Timeline
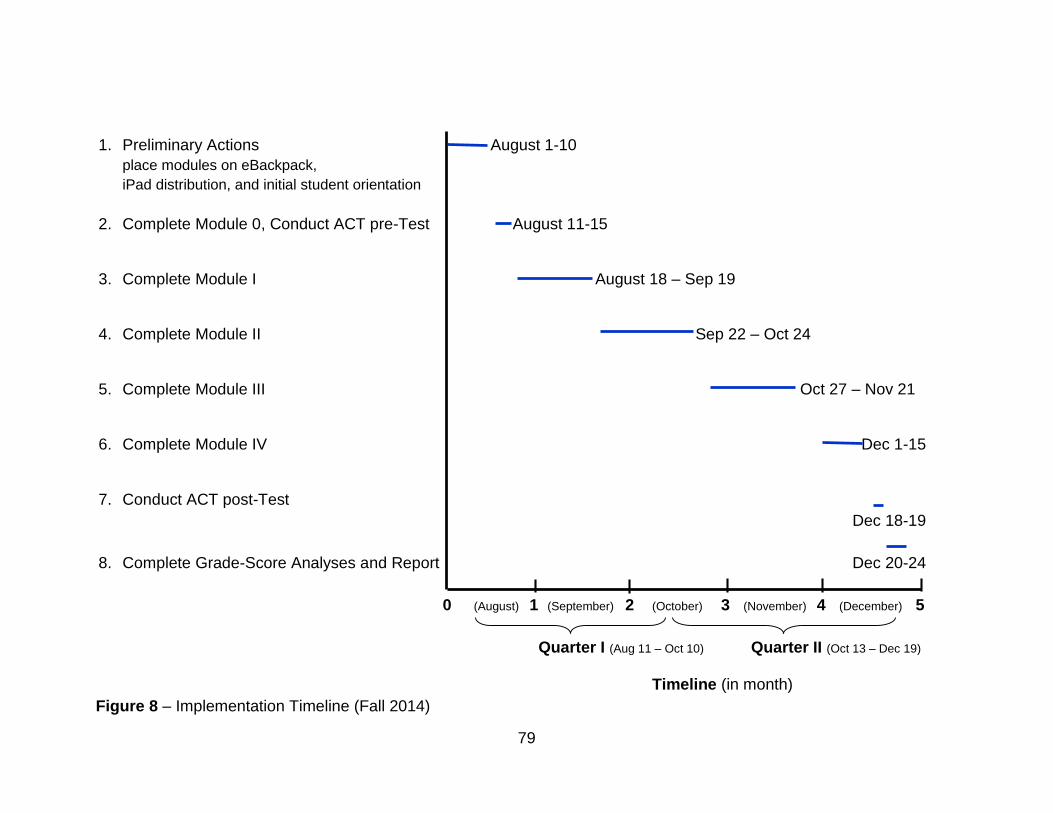
79
1. Preliminary Actions August 1-10
place modules on eBackpack,
iPad distribution, and initial student orientation
2. Complete Module 0, Conduct ACT pre-Test August 11-15
3. Complete Module I August 18 – Sep 19
4. Complete Module II Sep 22 – Oct 24
5. Complete Module III Oct 27 – Nov 21
6. Complete Module IV Dec 1-15
7. Conduct ACT post-Test
Dec 18-19
8. Complete Grade-Score Analyses and Report Dec 20-24
0 (August) 1 (September) 2 (October) 3 (November) 4 (December) 5
Quarter I (Aug 11 – Oct 10) Quarter II (Oct 13 – Dec 19)
Timeline (in month)
Figure 8 – Implementation Timeline (Fall 2014)
80
CHAPTER THREE: EVALUATION
The research and evaluation related to this study are explained in this chapter. A
correlational study is conducted to examine the relationship between students’ ACT
Explore scores and their Algebra 1 grades. The evaluation of the MIP program is
conducted in two stages: 1) evaluation of the program design, and 2) evaluation of the
program effectiveness.
Correlational Study
Purpose
A correlational study is conducted to determine the relationship between
students’ ACT Explore mathematics scores and their Algebra I grades. More
specifically, it is used to determine the correlation between student’s background
knowledge of the middle school mathematics and predict a possible failure or
successful completion of Algebra I (i.e., scoring 83 percent or higher) using their
Explore scores. (The test score of the mathematics portion of the ACT Explore test
reflects students’ knowledge of middle school mathematics.) This study will also be
helpful in determining the minimum score below which students will be placed in the
MIP program.
Methodology
Population and Instrumentation
The population in this study is all freshmen students for each designated
schoolyear. The instruments used in this portion of the study are the ACT Explore

81
standardized tests (mathematics scores) as well as RHS Algebra 1 semester grades for
the 2011-2012, 2012-2013, and 2013-2014 schoolyears. These data reflect students’
scores prior to the implementation of the MIP program in Fall 2014.
Procedures
In this study, all incoming freshman students’ prior ACT Explore scores and their
corresponding Algebra 1 semester grades for the 2011-2012, 2012-2013, and 2013-
2014 schoolyears were necessary. Upon following the necessary procedures required
by the Registrar and Records Office at RHS, these datasets were extracted from the
school archived database. The collected student data included student name, gender,
grade level, Algebra 1 grade, and related Explore test scores. Generic names, such as
Student 1, Student 2, etc., are used to protect student identity. The related student
identifier will remain confidential and secure both electronically and physically. These
datasets were then cleaned to ensure each student who entered RHS had an Explore
score and that completed, at least, the first semester at RHS, and thus having a score in
Algebra 1. Duplicate entries were removed. There were students who were admitted to
RHS without prior Explore scores, and thus their records were removed from the data.
In addition, there were students who had completed Algebra I in the middle school—and
their records did not include the necessary information—, and thus their records were
removed from the datasets as well. Furthermore, these datasets were labeled as
Dataset I (for the 2011-2012 schoolyear), Dataset II (for the 2012-2013 schoolyear), and
Dataset III (for the 2013-2014 schoolyear). The final datasets included paired-data for
82
each student—comprising the following populations for further analyses: Ni=34 for
Dataset I, Nii=35 for Dataset II, and Niii=43 for Dataset III.
Results and Discussion
To analyze the correlation between the students’ Explore scores and their
Algebra 1 (semester) scores, the IBM SPSS Statistics (version 22) software program
was used. Furthermore, to demonstrate the correlation between these two variables, all
three datasets were analyzed.
The null hypothesis indicates that there is no relationship between the two
variables, and the alternative hypothesis indicates that there is—that is, Dataset I (H0: ri
= 0 and H1: ri ≠ 0), Dataset II (H0: rii = 0 and H1: rii ≠ 0), and Dataset III (H0: riii = 0 and
H1: riii ≠ 0). Given that both variables are interval/ration in scale, the Pearson correlation
seems suitable if each dataset meets the necessary assumptions. The ‘independence’
assumption is met for all three datasets given that each dataset is composed of the
population data rather than a sample. The overall results of the test for ‘normality,’ for
each dataset, indicate that only Dataset I is approximately normally distributed (see
Table 8, and Figures 9, 10, and 11 in Appendix A). Correspondingly, a parametric
correlation test (Pearson product-moment) for Dataset I and a non-parametric
correlation test (Spearman) for Datasets II and III are selected and applied. The results
(see Table 9 in Appendix A) indicate that the correlation between students’ Explore
scores and their Algebra 1 scores are positive, moderately strong, and statistically
significant in all three datasets, and thus the null hypotheses are rejected (ri=.57, p <
.01 for Dataset I; rii=.48, p < .01 for Dataset II; and riii=.51, p < .01 for Dataset III). To
83
facilitate visual analyses, graphical representations (scatter plot with a linear trend/fit
line) of these relationships are presented in Figure 12 in Appendix A.
Evaluation Plan
The evaluation of the MIP program will be conducted in two stages: 1) Evaluating
the program design, and 2) Evaluating the program effectiveness. After obtaining the
IRB permission at the University of Central Florida (UCF), the design of the MIP
program was evaluated during the Fall 2014 semester. In addition, MIP students’ test
scores in each program module and their ACT Aspire test scores, at the completion of
the program, were also collected and examined. Furthermore, this study recommends
an evaluation plan to determine the effectiveness of the MIP program.
Design Evaluation
Purpose
The purpose of the design evaluation is to determine how well the program is
designed with respect to its usability, functionality, and aesthetic appeal. This evaluation
is based on a mixed mode design consisting of an interview of a limited number of
participants (qualitative) and a survey of a larger sample (quantitative).
Design Evaluation Criteria
The design of the MIP program is determined to be successful when student
satisfaction measures, at least, at 70 percent with respect to module design’s aesthetic
appeal, usability, and overall helpfulness. Furthermore, the MIP teacher and the
Program Manager are fully satisfied with the MIP design and its content.
84
Design Evaluation Questions
1. Do students perceive the program modules appealing?
2. Do students find the program modules’ content helpful?
3. Do students relate test questions to their corresponding content in the module?
4. Does the program include the necessary components required by the Program
Manager?
5. Does the teacher find the program module content and lesson plans helpful, and
assessment tools valid?
Methodology
Evaluation Approach
In this evaluation, aspects of the case study methodology are used.
Participants
The participants consist of 26 students, faculty, and administrators (24 students,
one teacher, and one administrator) who are selected based on a purposive sampling
method.
Instrumentation
1. Student Satisfaction Survey: The purpose of the Student Satisfaction Survey
instrument is to determine how satisfied students are with the overall design of
the program modules as well as related activities and quizzes. Table 10 (in
Appendix A) reflects the contents of this instrument which is used for collecting
data related to evaluation question numbers one, two, and three.
85
2. Interview Protocol Instrument—MIP Program Manager: The purpose of this
instrument is to determine whether the design includes all the necessary
components required by the Program Manager. Table 11 (in Appendix A) reflects
the contents of this instrument which is used for collecting data related to
evaluation question number four.
3. Interview Protocol Instrument—MIP Teacher: The purpose of this instrument is to
determine whether the program module content and lesson plans are helpful,
and assessment tools valid. Table 12 (in Appendix A) reflects the contents of this
instrument which is used for collecting data related to evaluation question
number five.
The overall information with regard to data sources, selected method(s) for
collecting data, instrumentation, and procedures for each evaluation questions are
explained in Table 13 in Appendix A.
Procedures
Interview: To recruit the participants, the names of the relevant faculty and staff
were obtained from the school vice principal who is also the Program Manager. These
individuals were then contacted, inviting them to participate in the study. The
participants were advised of the nature of the study and the goals of the research,
reviewed the informed consent process, and asked whether he or she would like to
participate. Upon acceptance, an appointment was set up to meet the individual at a
mutually agreed date and time. The face-to-face interview sessions were held in a safe
and comfortable location to both the interviewee and researcher, which allowed for a
86
confidential and private environment. Upon the agreement of the interviewee, the
session was recorded using an audiotape. The identities of the interviewees will remain
confidential, and when necessary, only pseudonyms will be used. All data will remain
confidential and secured both electronically and physically.
Survey: Two anonymous surveys were conducted from the MIP students during
the semester in which the program is offered. The first one was conducted during the
first quarter and the second during the last week of the second quarter. Both surveys
were conducted by the MIP teacher on designated school days and during normal class
sessions. All MIP students were encouraged to participate in the survey. Designated
survey dates were determined in consultation with the MIP teacher. Few days before
the start of the survey, the MIP teacher was provided with the survey instrument, and a
reminder letter was sent one day before the designated survey date. The survey period
was active during class sessions to ensure all students would have a chance to
participate. All data will remain confidential and secured both electronically and
physically.
To examine students’ initial impressions of the design, maximize the efficiency of
the module by incorporating the necessary modifications—based on the study of this
survey—an anonymous survey was conducted on November 14, 2014. Using the
Student Satisfaction Survey for Design Evaluation instrument (Table 10), this survey
was conducted during the class session, monitored and collected by MIP teacher, and
later submitted to me in a sealed envelope. Twenty one students participated in this
survey. The survey results were evaluated, and subsequently few modifications were
made in the remaining modules (e.g., improving the navigation system throughout the
87
module, labeling the online video clips for better referencing, and introducing more
varieties of videos among others). A second anonymous survey was conducted on
December, 3, 2014—the result of which the basis for evaluating the design. Seventeen
students participated in this survey. Using the Student Satisfaction Survey for Design
Evaluation instrument (Table 10), this survey was also conducted during the class
session, monitored and collected by MIP teacher, and later submitted to me in a sealed
envelope.
Results and Discussion
In an interview session, the MIP Program Manager, Paul Smith, who is also the
Academic Dean at RHS, confirms his full satisfaction with respect to the overall
requirements and function of the MIP program (evaluation question number four).
Regarding the characteristics of a good design, P. Smith identifies: “the functionality of
the design itself, relating to the standards...and the usability of the [design] that are
workable for both the student and the teacher” (personal communication, December 8,
2014). With regard to content and standards in the MIP program, P. Smith indicates that
“As a new program, we have been very concerned with the standards and its contents. I
think we have covered those very well, so I am very happy” (personal communication,
December 8, 2014). Furthermore, “The [MIP] program is very clearly defined, and I am
very pleased that we have communicated it to the parents…” (personal communication,
December 8, 2014). With regard to the functionality and usability of the MIP program, P.
Smith responds, “How we have actually set up the course itself. Does it actually meet
the needs of the students…. Is it adjustable…and flexible? And we have done
88
that…these characteristics are present in this program” (personal communication,
December 8, 2014). Furthermore, he concludes that “I am very happy with the program.
We have been looking for ways that we can help our students. I am really excited about
the possibility of continuing on, and may be even expanding” (P. Smith, personal
communication, December 8, 2014). In an interview session with the MIP teacher,
Jeremy Adams confirms his overall satisfaction with respect to the program module
content and lesson plans as well as the validity of the assessment tools (evaluation
question number five). With regard to the characteristics of a good module, J. Adams
identifies: “giving kids multiple things to look at...not just one way. Showing them videos,
using examples…using technology…using things that make it pop a little more…giving
kids multiple examples on how to do things. These are important because you want to
make them interested and have them involved and interact with it” (personal
communication, February 3, 2015). J. Adams confirms the presence of these
characteristics in the modules by expressing that “They have great pictures, sticky
notes…which make them nice to look at. They give the kids examples, plenty of videos
for them to watch. I think these modules do a great job of giving these kids what they
need to be successful.” Furthermore, “When kids look for something or questions they
may have, I mean, they are all there. There is plenty of stuff for them to use —
especially, if they have a question, the module does a great job of making sure that kids
have plenty of resources that they can use” (J. Adams, personal communication,
February 3, 2015). With regard to the assessment items and their relationship with
module content, J. Adams replies, “I think they correspond really well. The questions
are very clear...nothing tricky about them. I think the questions on the test matched up

89
the contents of the module really well” (personal communication, February 3, 2015).
The results of these interview sessions clearly indicate that both the MIP teacher and
the Program Manager are satisfied with the overall design of the MIP program.
The survey items are designed using a Likert scale with the following values
(designated for each response to survey items): 1= Very Dissatisfied, 2= Dissatisfied,
3= Neutral, 4= Satisfied, and 5= Very Satisfied. The Microsoft Excel application program
(version 2013) was used for the statistical analyses related to the design evaluation.
The following strategies (grouping select survey items) were used in order to answer
evaluation questions number one through three: a) grouping survey item numbers one
through three to answer evaluation question number one: Do students perceive the
program modules appealing?; b) grouping survey item numbers four through nine to
answer evaluation question number two: Do students find the program modules’ content
helpful?; and c) grouping survey item numbers ten and eleven to answer evaluation
question number three: Do students relate test questions to their corresponding module
contents? The results are presented in Figure 14 (Appendix A). Considering the design
evaluation criteria, the survey analyses indicate that students, on average, perceive the
design as appealing (evaluation question number one). However, students, on average,
do not find the module’s content as helpful or test questions relating to module contents
(evaluation questions number two and three respectively).
As an expanded approach to evaluating the design of the MIP program, in order
to examine students’ perceptions on design’s usability and aesthetic aspects (the
design framework—explained in Chapter II), the following strategies (grouping select
survey items) were used: a) grouping survey item numbers one through three to
90
determine students’ perceptions with respect to the aesthetic aspect of the design; and
b) grouping survey item numbers four through eleven to determine students’
perceptions with respect to the usability aspect of the design. The results are presented
in Figure 15 (Appendix A). Considering the design evaluation criteria, the survey
analyses indicate that students, on average, perceive the design aesthetically
appealing. However, on average, they are not satisfied with the usability of the design of
the module. Most 14/15 years old adolescence—a typical age for high school
freshmen—usually perceive and react highly emotionally, even with respect to matters
that are primarily cognitive in nature. In a remediation course, especially in
mathematics, such reactions are usually more amplified. Given this observation as well
as the limitations inherent in a self-reporting methodology—such as a survey—, this
may have impacted student responses to the survey items and thus adversely affecting
the results.
Program Evaluation
Purpose
The purpose of the program evaluations is to determine the effectiveness of the
MIP program.
Evaluation Criteria
The program is determined to be successful when at least 80 percent of the
participants score 25 or higher on the ACT-Aspire (post-test).
Evaluation Questions
1. How well is the program designed and implemented?
91
2. Do students attend the program regularly?
3. Do students actively participate in the program activities?
4. Do students find the modules and related activities helpful?
5. Does the program include the necessary components required by the Program
Manager?
6. Does the teacher find the program contents helpful and assessment tools valid?
7. Do 80 percent of participants score 25 or higher on the ACT-Aspire test (post-
test)?
Methodology
Evaluation Approach
The methodological approach for this study is conceptualized as non-
experimental pre- and post-test with no comparison group. As explained in Table 14 (in
Appendix A), this evaluation uses components of multiple approaches: Expertise-
oriented, program-oriented (logic model), and case study.
Participants
The participants consist of 27 students, faculty, and administrators (24 students,
one teacher, and two administrators) who are selected based on purposive sampling
method.
Instrumentation
1. Interview Protocol Instrument for Program Evaluation—MIP Program Manager:
The purpose of this instrument is to determine how well the program is designed

92
and implemented. This instrument is used for the purpose collecting data related
to evaluation question number one, and its content is explained in Table 15 (in
Appendix A).
2. Interview Protocol Instrument—IT Manager: The purpose of this instrument is to
determine how well the program is implemented. This instrument is used for the
purpose collecting data related to evaluation question number one, and its
content is explained in Table 16 (in Appendix A).
3. Student Participation Observation: The purpose of this instrument is to determine
the degree to which students participate in the program activities. This instrument
is used for the purpose of collecting data related to evaluation question number
three, content of which is explained in Table 17 (in Appendix A).
4. Student Satisfaction Survey for Program Evaluation: The purpose of this
instrument is to determine how satisfied students are with the program modules
and related activities, tests, quizzes, and tasks. Table 18 (in Appendix A) reflects
the contents of this instrument which is used for collecting data related to
evaluation question number four.
5. Interview Protocol Instrument for Program Evaluation —MIP Teacher: The
purpose of this instrument is to determine whether the program contents are
helpful and assessment tools valid. Table 19 (in Appendix A) reflects the
contents of this instrument which is used for collecting data related to evaluation
question number five.
6. The ACT Aspire Test: The ACT standardized test (mathematics scores) is used
for the selection process as well as pre- and post-tests. The analysis of the data

93
related to pre- and post-test scores will answer the evaluation question number
six.
The overall information with regard to data sources, selected method(s) for
collecting data, instrumentation, and procedures for each evaluation questions are
explained in Table 20. In addition, the MIP program logic model is explained in Table
21—both of which are present in Appendix A.
Limitations
The pre- and post-test design with no comparison group is relatively weak thus
impacting the generalization possibility. Other possible limitations of the study may be
related to the selected methods of collecting data such as survey (self reporting),
observation, and interview—although having many advantages—also introduce the
possibilities for bias, thus impacting the results of the evaluation. Although the risk was
minimal since the survey was conducted anonymously, students may still feel being
threatened if the teacher or administration becomes aware of their personal views on
the course. If so, this feeling may have impacted their selected answers. The researcher
in this study is also the program designer and evaluator thus the possibilities for bias
exist which may adversely impact the outcome of this study. In addition, the designated
mathematics teacher who facilitated the MIP may not entirely and faithfully follow the
program content and procedures which would impact students’ post-test scores, thus
also adversely affecting the outcome of the study. Unforeseen events impacted the
implementation, thus impacting evaluation results. For example, the unforeseen issues
with regard to the iPad distribution at school caused delay in the actual start of the
94
program. In addition, the decision by ACT to discontinue offering the Explore test and
enforcing the Aspire test earlier than expected caused the cancellation of the planned
pre-post; therefore, the students took only the post-test. Furthermore, factors such as
the type of (standardized) assessment tests, the cutoff score by which remediation is
required as well as successful remediation achieved may also impact the evaluation
results of the program. It is worthy to note that the impact of the MIP program would be
best measured if the participants do not concurrently attend the Algebra 1 class.
However, given the limited resources at RHS, such option was not feasible—especially
given that RHS does not offer any summer courses.

95
CHAPTER FOUR: CONCLUSION
In this study, the problem associated with a high percentage of freshman
students at RHS—who either fail Algebra 1 or pass it with a low percentage rate—has
been studied. After examining the internal and external causes associated with this
problem, designing and implementing a remediation course in mathematics (the MIP
program) was recommended—the content of which is based on grade 8 Mathematics
and Pre-Algebra. In addition to studying the literature and examining the prior research
on the remediation problem in general and mathematics in particular, this decision was
also based on a correctional study that determined the relationship between students’
prior knowledge in middle school mathematics and their semester grades in Algebra I
(in high school). The MIP program design is based on a solid theoretical formwork,
including established learning and design theories and principles.
This study is important given that remediation, as a serious national problem, is
nurtured in the middle and high school—although its roots are developed in the
elementary school system in the Unites States. Research indicates that a good portion
of students who attend the postsecondary schools are not prepared to undertake
related courses, especially in mathematics and English, for they lack necessary prior
knowledge they should have obtained in high school. Fine et al. (2009) indicate that
higher education institutions are finding that ever increasing numbers of entering
freshman students are unprepared for college-level coursework, particularly in
mathematics. Furthermore, 75 percent of postsecondary institutions in the United
States, according to the U.S. Department of Education, “offer remedial courses in
mathematics and English catering to the 28% of first-time college freshmen at both two-
96
and four-year postsecondary institutions who lack the skills necessary to perform
college-level work (Parsad & Lewis, as cited in Howell, 2011, p. 296). The cost
associated with remediation has been exponentially growing as the rate of the number
of students who require remediation has been increasing. Perin (2006) asserts that
more than half of community college students need remediation, and up to 80 percent
enroll in at least one remedial course. Furthermore, Bahr (2008) estimates “the national
direct cost of public postsecondary remedial programs at 1–2 billion dollars annually,
and the total direct and indirect public and private costs at nearly 17 billion dollars
annually” (p. 421). This is a staggering number that reveals the magnitude of the
remediation which is a real burden on our educational system.
The MIP program was implemented in Fall 2014, during which the design of the
program was evaluated to determine its usability, functionality, and aesthetic appeal
with respect to MIP students, teacher, and the Program Manager. The correlational
study indicated that there is a positive and moderately strong correlation between
students’ background knowledge in (middles school) mathematics and their grades in
Algebra 1. The evaluation concluded that students find the design of the MIP program
helpful and aesthetically appealing; however, its usability did not meet the evaluation
criteria. Furthermore, the MIP Program Manager and teacher are fully satisfied with its
design, content, and components. Given the results of this study, RHS has now a solid
(research-based) understanding of the relationship between students’ prior knowledge
in middle-school mathematics and their grades in Algebra 1, and developed an internal
mathematics remediation program—the design of which is approved and supported by
its administration as well as the MIP teacher and students. In this regard, this study has

97
laid the groundwork for future studies at RHS and beyond. Future evaluations will help
to establish the effectiveness of the curriculum and provide information to continue to
develop the MIP program. Furthermore, the next step would be redesigning the MIP
program to include a progress monitoring computer program and expanding its external
resources—aspects of which are included in the Recommendations section which
follows later in this chapter. It is also important to note that most studies and research
on remediation have been concentrated on the post-secondary level; however, it is
absolutely necessary to study this problem at all K-12 levels as well—especially grades
4 through 9. In addition, designing remedial courses suitable for these grade levels and
age groups are at outmost important.
Recommendations
The following is a list of recommendations that is based on the results of this
study:
As Thayer (2008) asserts, the Adventist educational system should develop a
“system-wide assessment plan that periodically determines the extent to which its goals
have been met” (p. 16). Such system should “include assessment of a broad range of
outcomes in all domains: cognitive, affective, and behavior, and outcomes that are both
spiritual and non-spiritual (p. 16). Furthermore, regular research studies should be
conducted at the Conference (or possibly at the corresponding Union) to determine
achievement in core subjects, such as mathematics and English. Quality mathematics
education is essential—lack of which has been detrimental to our educational system.
As the body of research indicates, mathematics remediation is a serious problem and a

98
national concern. As such, the Adventist education has not been immune from this
problem. The mathematics problem, subject to this study at RHS, is a testimony to this
fact. In this regard, Thompson (1985) asserts: “The challenges facing young people in
our schools mandate quality mathematics instruction that emphasizes mastery of basic
arithmetic and general mathematics skills, development of a "number sense," and
command of problem-solving and logical-thinking skills” (p. 4). Thompson’s assertion
still resonates after thirty years. It is strongly recommended that the Conference
establish a policy to regularly evaluate mathematics achievement at 4th, 8th and 9th
grade levels throughout its school jurisdiction. The findings of these studies will be
helpful in terms of making instructional decisions, and establishing new policies and/or
improving the existing ones. Furthermore, initiating such studies, the Office of Education
at the Conference will promote collaboration—by expanding interactions and dialogue
as well as sharing experience and resources—among the faculty and school
administrations within its junior and senior academies.
It is recommended that the Conference provide the necessary funds and
resources, and incorporate expertise and experience from all junior and senior
academies in its jurisdiction to expand the MIP program. Furthermore, the Conference
may initiate establishing similar mathematics remedial courses for other grade levels.
External resources, such as Florida Virtual, are available to provide remedial courses;
however, like RHS, other junior and senior academies may also prefer using internal
resources and establishing programs such as the MIP program.
Currently, the Conference utilizes the ACT (including Aspire), Iowa tests (ITBS
and ITED), and SAT standardized achievement tests, from which schools select their
99
desired tests. As such, there is no uniform standardized testing policy at the Conference
level. Given the routine student transition within the Adventist schools and student
admissions from public and other private schools, this creates complications during the
admission process, academic advising, and conducting research among others. It is
strongly recommended that the Conference adopt a uniform standardized testing policy
to measure academic achievement. Furthermore, given its reliance on ACT-Aspire test,
it is recommended that RHS require all incoming students to take this test upon
admissions, ensuring uniformity which enhances academic advising, and facilitates MIP
placement, and conducting research among others.
It is recommended that RHS assign an experienced instructor to teach the MIP
program. This will maximize the effectiveness of the MIP program and thus student
learning.
Although the designer of the MIP program is considered an expert in both
instructional design and mathematics content, it is recommended that the module
contents in the MIP program be reviewed by external experts in the field for validation
and improvement—process of which would have been beneficial to this study as well.
Placing the MIP students concurrently in Algebra 1 may cause confusion for
students and parents and/or result in unexpected problems. In addition, such placement
introduces an external factor influencing the result of the MIP program, and thus
negatively impacting the evaluation of its effectiveness. Although, RHS has limited
resources, it is strongly recommended that the Conference assist RHS in order to
100
accommodate offering the MIP program during summer—either face-to-face or a
blended mode.
During the course of design evaluation of the MIP program, a possible inverse
relationship between student satisfaction and mathematics anxiety became apparent—a
possible result of which may have impacted the design evaluation (especially the
usability aspect) of this study. The future study may also include, but not limited to,
determining students’ mathematics anxiety and satisfaction.
Currently, the Mathematics Department at RHS offers teacher-designed tests as
final exams for all courses that it offers. Instead, offering a valid and reliable
independent criterion-based test (as final exam), at least in Algebra 1, is strongly
recommended. This will maximize the integrity and accuracy of research and evaluation
with respect to the impact of the MIP program and Algebra 1, mathematics achievement
in general, and correlational studies similar to the one conducted in this study. In
addition, it will minimize the possibility of grade inflation which facilitates conducting a
meaningful evaluation of the MIP program. Furthermore, it will facilitate a reliable
research to compare students who did and did not take the MIP program, and compare
their performance on the final exam in Algebra 1.
Using a progress monitory application program in mathematics is strongly
recommended. There are excellent computer programs in the market, such as
Accelerated Math, which help both students and teachers to monitor progress, provide
numerous examples and problems, and facilitate instructional differentiation and
assessment among others. Using such a program in the Mathematics Department will
maximize efficiency and learning.

101
APPENDIX A: DATA ANALYSIS
102
The research and evaluation related to this study are explained here. A
correlational study is conducted to examine the relationship between students’ ACT
Explore scores and their Algebra 1 grades. The evaluation of the MIP program is
conducted in two stages: 1) evaluation of the program design, and 2) evaluation of the
program effectiveness.
Correlational Study
Purpose
A correlational study is conducted to determine the relationship between
students’ ACT Explore mathematics scores and their Algebra I grades. More
specifically, it is used to determine the correlation between student’s background
knowledge of the middle school mathematics and predict a possible failure or
successful completion of Algebra I (i.e., scoring 83 percent or higher) using their
Explore scores. (The test score of the mathematics portion of the ACT Explore test
reflects students’ knowledge of middle school mathematics.) This study will also be
helpful in determining the minimum score below which students will be placed in the
MIP program.
Methodology
Population and Instrumentation
The population in this study is all freshmen students for each designated
schoolyear. The instruments used in this portion of the study are the ACT Explore
standardized tests (mathematics scores) as well as RHS Algebra 1 semester grades for

103
the 2011-2012, 2012-2013, and 2013-2014 schoolyears. These data correspond to
students’ grades/scores prior to the implementation of the MIP program in Fall 2014.
Procedures
In this study, all incoming freshman students’ prior ACT Explore scores and their
corresponding Algebra 1 semester grades for the 2011-2012, 2012-2013, and 2013-
2014 schoolyears were necessary. Upon following the necessary procedures required
by the Registrar and Records Office at RHS, these datasets were extracted from the
school archived database. The collected student data included student name, gender,
grade level, Algebra 1 grade, and related Explore test scores. Generic names, such as
Student 1, Student 2, etc., are used to protect student identity. The related student
identifier will remain confidential and secure both electronically and physically. These
datasets were then cleaned to ensure each student who entered RHS had an Explore
score and that completed, at least, the first semester at RHS, and thus having a score in
Algebra 1. Duplicate entries were removed. There were students who were admitted to
RHS without prior Explore scores, and thus their records were removed from the data.
In addition, there were students who had completed Algebra I in the middle school—and
their records did not include the necessary information—, and thus their records were
removed from the datasets as well. Furthermore, these datasets were labeled as
Dataset I (for the 2011-2012 schoolyear), Dataset II (for the 2012-2013 schoolyear), and
Dataset III (for the 2013-2014 schoolyear). The final datasets included paired-data for
each student—comprising the following populations for further analyses: Ni=34 for
Dataset I, Nii=35 for Dataset II, and Niii=43 for Dataset III.
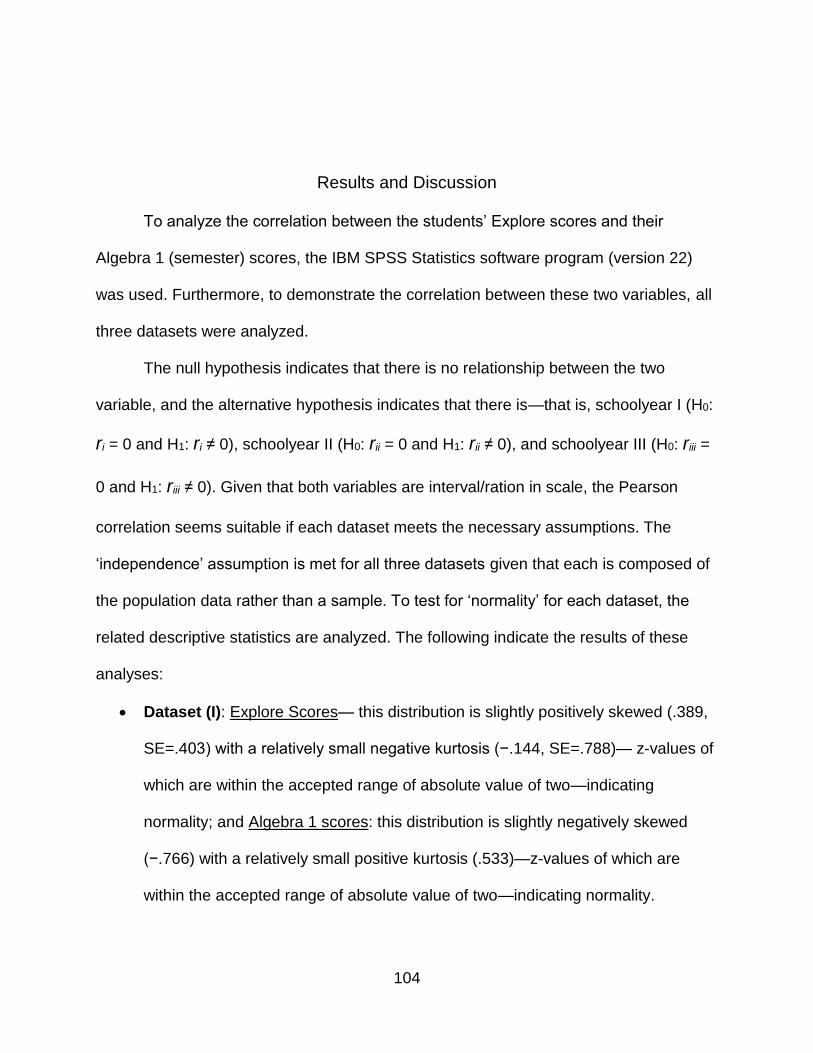
104
Results and Discussion
To analyze the correlation between the students’ Explore scores and their
Algebra 1 (semester) scores, the IBM SPSS Statistics software program (version 22)
was used. Furthermore, to demonstrate the correlation between these two variables, all
three datasets were analyzed.
The null hypothesis indicates that there is no relationship between the two
variable, and the alternative hypothesis indicates that there is—that is, schoolyear I (H0:
ri = 0 and H1: ri ≠ 0), schoolyear II (H0: rii = 0 and H1: rii ≠ 0), and schoolyear III (H0: riii =
0 and H1: riii ≠ 0). Given that both variables are interval/ration in scale, the Pearson
correlation seems suitable if each dataset meets the necessary assumptions. The
‘independence’ assumption is met for all three datasets given that each is composed of
the population data rather than a sample. To test for ‘normality’ for each dataset, the
related descriptive statistics are analyzed. The following indicate the results of these
analyses:
Dataset (I): Explore Scores— this distribution is slightly positively skewed (.389,
SE=.403) with a relatively small negative kurtosis (−.144, SE=.788)— z-values of
which are within the accepted range of absolute value of two—indicating
normality; and Algebra 1 scores: this distribution is slightly negatively skewed
(−.766) with a relatively small positive kurtosis (.533)—z-values of which are
within the accepted range of absolute value of two—indicating normality.
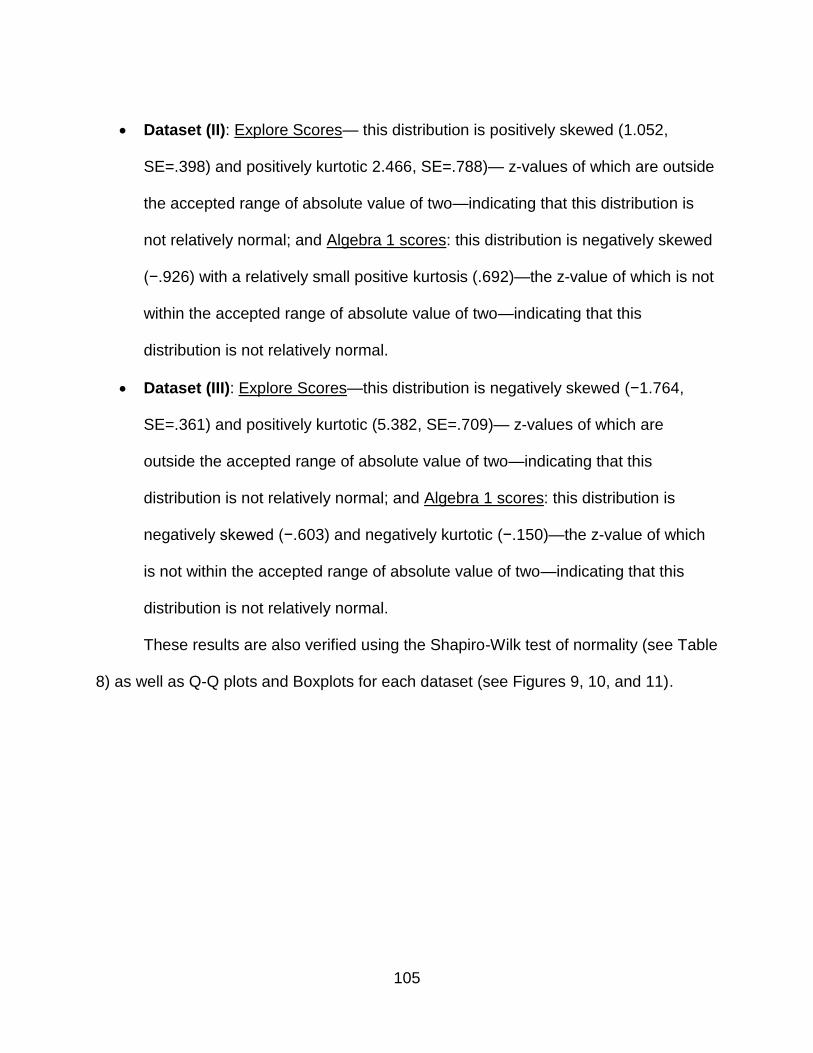
105
Dataset (II): Explore Scores— this distribution is positively skewed (1.052,
SE=.398) and positively kurtotic 2.466, SE=.788)— z-values of which are outside
the accepted range of absolute value of two—indicating that this distribution is
not relatively normal; and Algebra 1 scores: this distribution is negatively skewed
(−.926) with a relatively small positive kurtosis (.692)—the z-value of which is not
within the accepted range of absolute value of two—indicating that this
distribution is not relatively normal.
Dataset (III): Explore Scores—this distribution is negatively skewed (−1.764,
SE=.361) and positively kurtotic (5.382, SE=.709)— z-values of which are
outside the accepted range of absolute value of two—indicating that this
distribution is not relatively normal; and Algebra 1 scores: this distribution is
negatively skewed (−.603) and negatively kurtotic (−.150)—the z-value of which
is not within the accepted range of absolute value of two—indicating that this
distribution is not relatively normal.
These results are also verified using the Shapiro-Wilk test of normality (see Table
8) as well as Q-Q plots and Boxplots for each dataset (see Figures 9, 10, and 11).
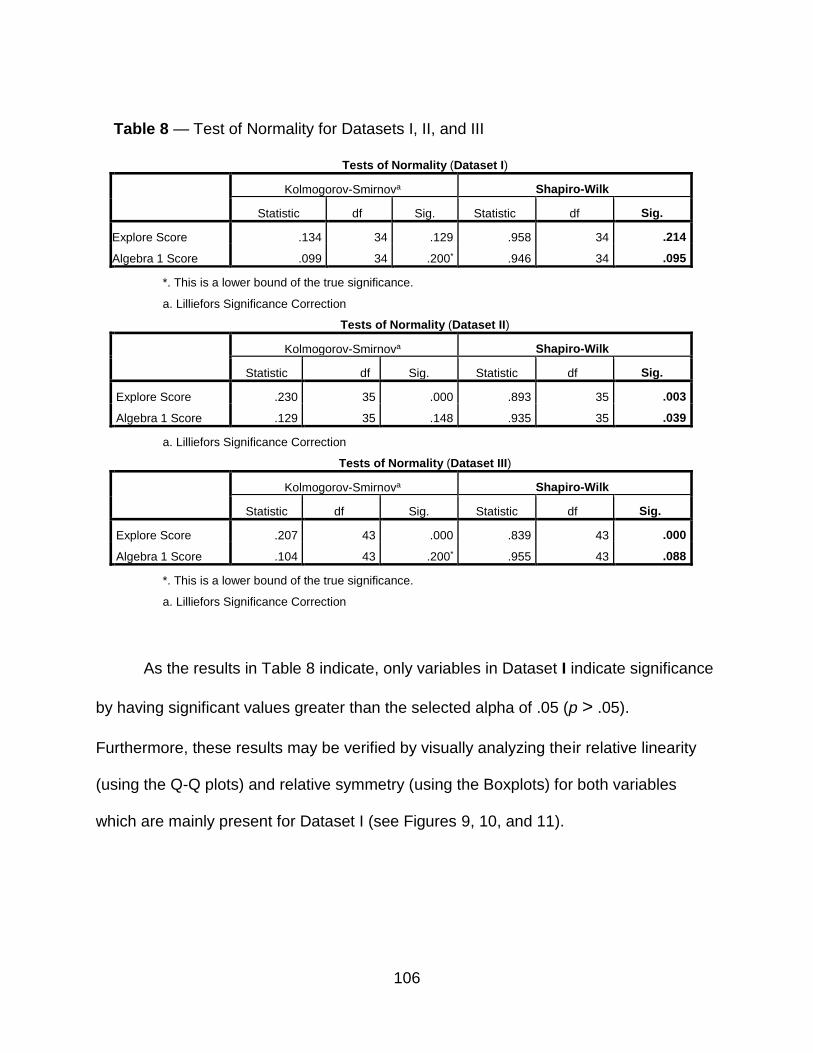
106
Table 8 — Test of Normality for Datasets I, II, and III
As the results in Table 8 indicate, only variables in Dataset I indicate significance
by having significant values greater than the selected alpha of .05 (p > .05).
Furthermore, these results may be verified by visually analyzing their relative linearity
(using the Q-Q plots) and relative symmetry (using the Boxplots) for both variables
which are mainly present for Dataset I (see Figures 9, 10, and 11).
Tests of Normality (Dataset I)
Kolmogorov-Smirnova Shapiro-Wilk
Statistic df Sig. Statistic df Sig.
Explore Score .134 34 .129 .958 34 .214
Algebra 1 Score .099 34 .200* .946 34 .095
*. This is a lower bound of the true significance.
a. Lilliefors Significance Correction
Tests of Normality (Dataset II)
Kolmogorov-Smirnova Shapiro-Wilk
Statistic df Sig. Statistic df Sig.
Explore Score .230 35 .000 .893 35 .003
Algebra 1 Score .129 35 .148 .935 35 .039
a. Lilliefors Significance Correction
Tests of Normality (Dataset III)
Kolmogorov-Smirnova Shapiro-Wilk
Statistic df Sig. Statistic df Sig.
Explore Score .207 43 .000 .839 43 .000
Algebra 1 Score .104 43 .200* .955 43 .088
*. This is a lower bound of the true significance.
a. Lilliefors Significance Correction

107
Figure 9 — Q-Q plots and Boxplots for Distributions in Dataset I
Figure 10 — Q-Q plots and Boxplots for Distributions in Dataset II

108
Figure 11 — Q-Q plots and Boxplots for Distributions in Dataset III
Correspondingly, a parametric correlation test (Pearson product-moment) for
Dataset I and a non-parametric correlation test (Spearman) for Datasets II and III are
selected and applied. The results (see Table 9) indicate that the correlation between
students’ Explore scores and their Algebra 1 scores are positive, moderately strong,
and statistically significant in all three datasets, and thus the null hypotheses are
rejected (ri=.57, p < .01 for Dataset I; rii=.48, p < .01 for Dataset II; and riii=.51, p < .01
for Dataset III).

109
Table 9 — Correlation Tests for Datasets I, II, and III
To facilitate visual analyses, graphical representations (scatter plot with a linear
trend/fit line) of these relationships are presented in Figure 12.
Correlations (Dataset I)
Explore Score Algebra 1 Score
Explore Score Pearson Correlation 1 .568**
Sig. (2-tailed) .000
N 34 34
Algebra 1 Score Pearson Correlation .568** 1
Sig. (2-tailed) .000
N 34 34
**. Correlation is significant at the 0.01 level (2-tailed).
Correlations (Dataset II)
Explore Score Algebra 1 Score
Spearman's rho Explore Score Correlation Coefficient 1.000 .475**
Sig. (2-tailed) . .004
N 35 35
Algebra 1
Score
Correlation Coefficient .475** 1.000
Sig. (2-tailed) .004 .
N 35 35
**. Correlation is significant at the 0.01 level (2-tailed).
Correlations (Dataset III)
Explore Score Algebra 1 Score
Spearman's rho Explore Score Correlation Coefficient 1.000 .506**
Sig. (2-tailed) . .001
N 43 43
Algebra 1
Score
Correlation Coefficient .506** 1.000
Sig. (2-tailed) .001 .
N 43 43
**. Correlation is significant at the 0.01 level (2-tailed).
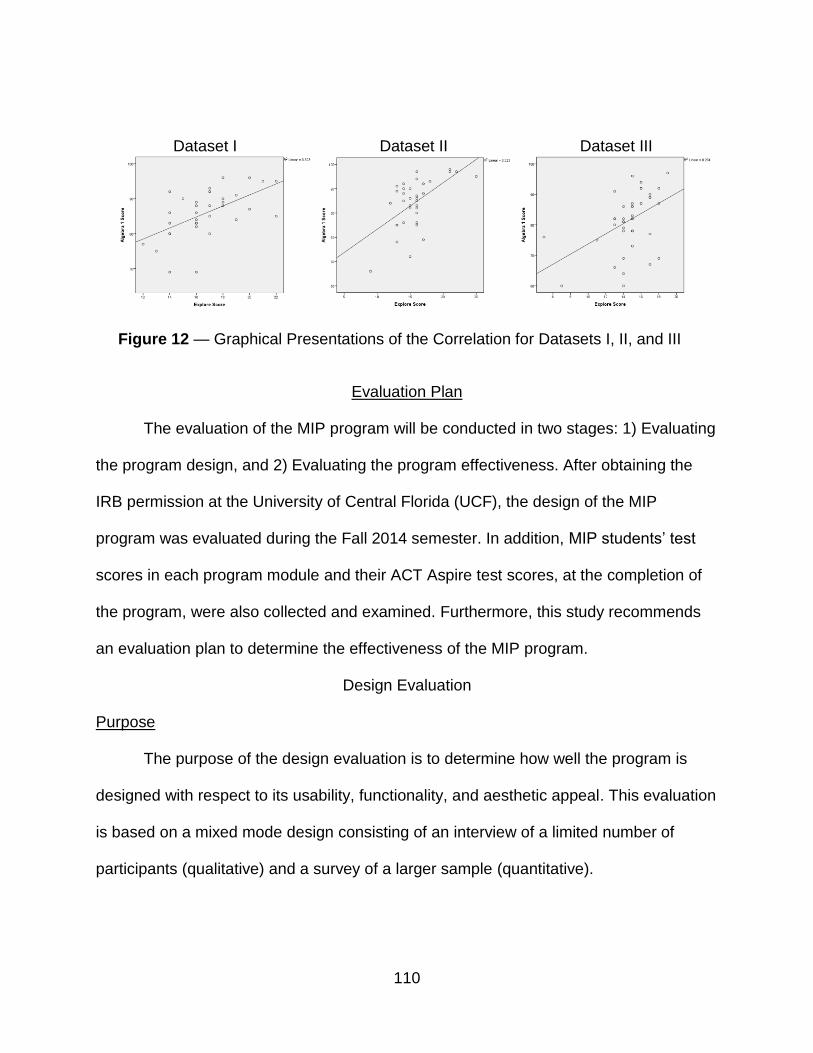
110
Figure 12 — Graphical Presentations of the Correlation for Datasets I, II, and III
Evaluation Plan
The evaluation of the MIP program will be conducted in two stages: 1) Evaluating
the program design, and 2) Evaluating the program effectiveness. After obtaining the
IRB permission at the University of Central Florida (UCF), the design of the MIP
program was evaluated during the Fall 2014 semester. In addition, MIP students’ test
scores in each program module and their ACT Aspire test scores, at the completion of
the program, were also collected and examined. Furthermore, this study recommends
an evaluation plan to determine the effectiveness of the MIP program.
Design Evaluation
Purpose
The purpose of the design evaluation is to determine how well the program is
designed with respect to its usability, functionality, and aesthetic appeal. This evaluation
is based on a mixed mode design consisting of an interview of a limited number of
participants (qualitative) and a survey of a larger sample (quantitative).
Dataset I Dataset II Dataset III
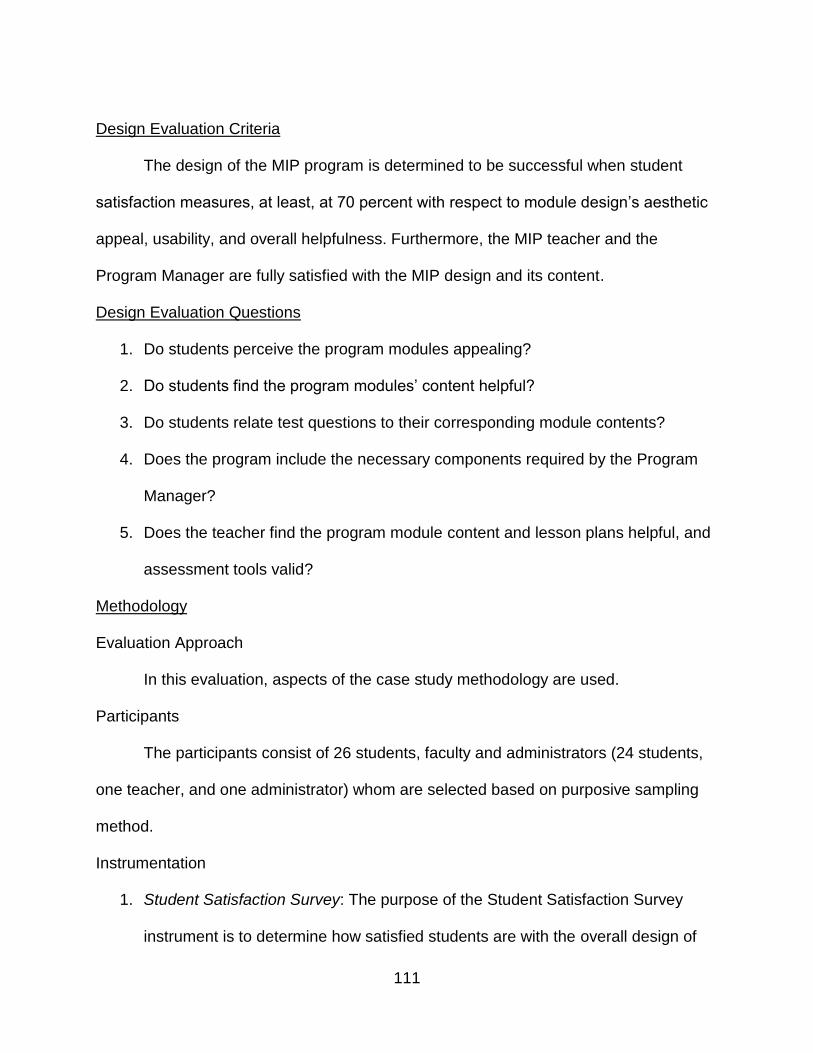
111
Design Evaluation Criteria
The design of the MIP program is determined to be successful when student
satisfaction measures, at least, at 70 percent with respect to module design’s aesthetic
appeal, usability, and overall helpfulness. Furthermore, the MIP teacher and the
Program Manager are fully satisfied with the MIP design and its content.
Design Evaluation Questions
1. Do students perceive the program modules appealing?
2. Do students find the program modules’ content helpful?
3. Do students relate test questions to their corresponding module contents?
4. Does the program include the necessary components required by the Program
Manager?
5. Does the teacher find the program module content and lesson plans helpful, and
assessment tools valid?
Methodology
Evaluation Approach
In this evaluation, aspects of the case study methodology are used.
Participants
The participants consist of 26 students, faculty and administrators (24 students,
one teacher, and one administrator) whom are selected based on purposive sampling
method.
Instrumentation
1. Student Satisfaction Survey: The purpose of the Student Satisfaction Survey
instrument is to determine how satisfied students are with the overall design of

112
the program modules as well as related activities and quizzes. Table 10 reflects
the contents of this instrument which is used for collecting data related to
evaluation question numbers one, two, and three.
Table 10 — Student Satisfaction Survey for Design Evaluation
Student Satisfaction Survey Design Evaluation
The purpose of this anonymous survey is to give you a chance to express your
experience and satisfaction about the way modules are designed. Please,
Read each statement carefully.
Decide how satisfied you feel about the aspect of the design described by
the statement.
Try your best to answer every item.
Very Sat. means I am very satisfied with aspect of the design.
Sat. means I am satisfied with aspect of the design.
N means I can’t decide whether I am satisfied or not with aspect of the
design.
Dissat. means I am dissatisfied with aspect of the design.
Very Dissat. means I am very dissatisfied with aspect of the design.
This is how I feel about… Very
Very Dissat. Dissat. N Sat. Sat.
1. The way visual attributes (clipart, color,
font face/size, and so on) are selected
2. The way visual attributes are consistent
3. Being able to easily access sections in the module
4. The way topics are explained in the module
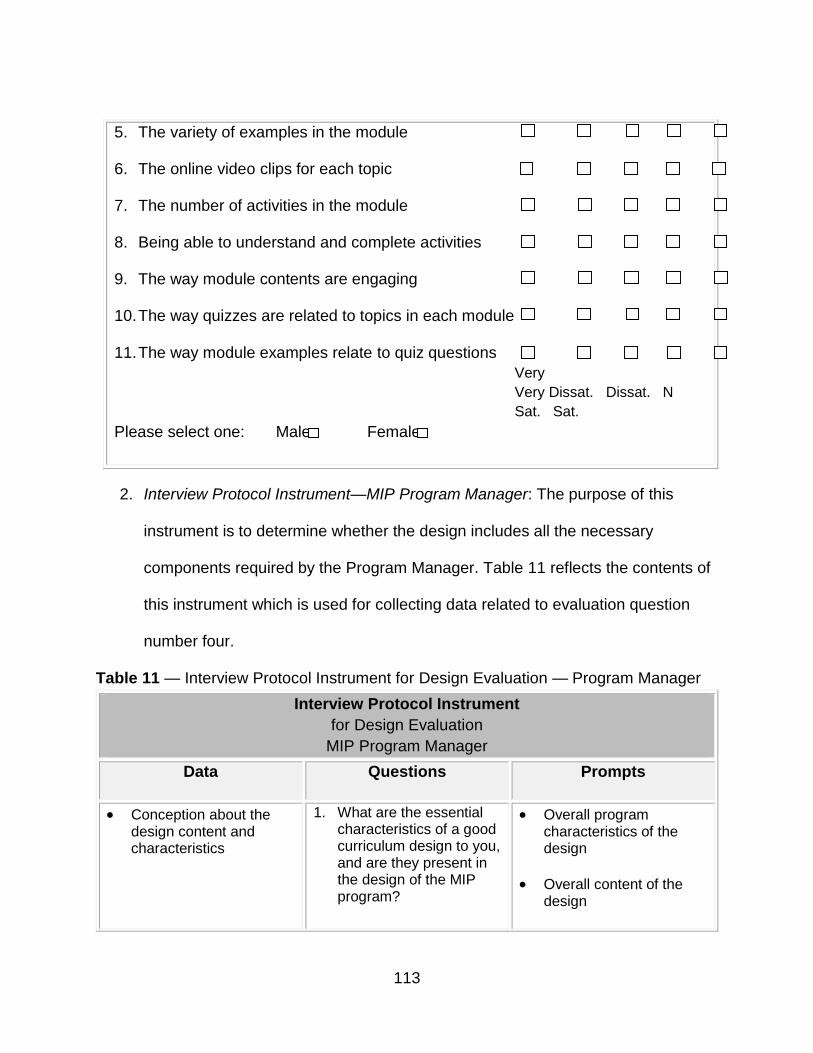
113
5. The variety of examples in the module
6. The online video clips for each topic
7. The number of activities in the module
8. Being able to understand and complete activities
9. The way module contents are engaging
10. The way quizzes are related to topics in each module
11. The way module examples relate to quiz questions
Very
Very Dissat. Dissat. N
Sat. Sat.
Please select one: Male Female
2. Interview Protocol Instrument—MIP Program Manager: The purpose of this
instrument is to determine whether the design includes all the necessary
components required by the Program Manager. Table 11 reflects the contents of
this instrument which is used for collecting data related to evaluation question
number four.
Table 11 — Interview Protocol Instrument for Design Evaluation — Program Manager
Interview Protocol Instrument
for Design Evaluation
MIP Program Manager
Data Questions Prompts
Conception about the design content and characteristics
1. What are the essential characteristics of a good curriculum design to you, and are they present in the design of the MIP program?
Overall program characteristics of the design
Overall content of the design
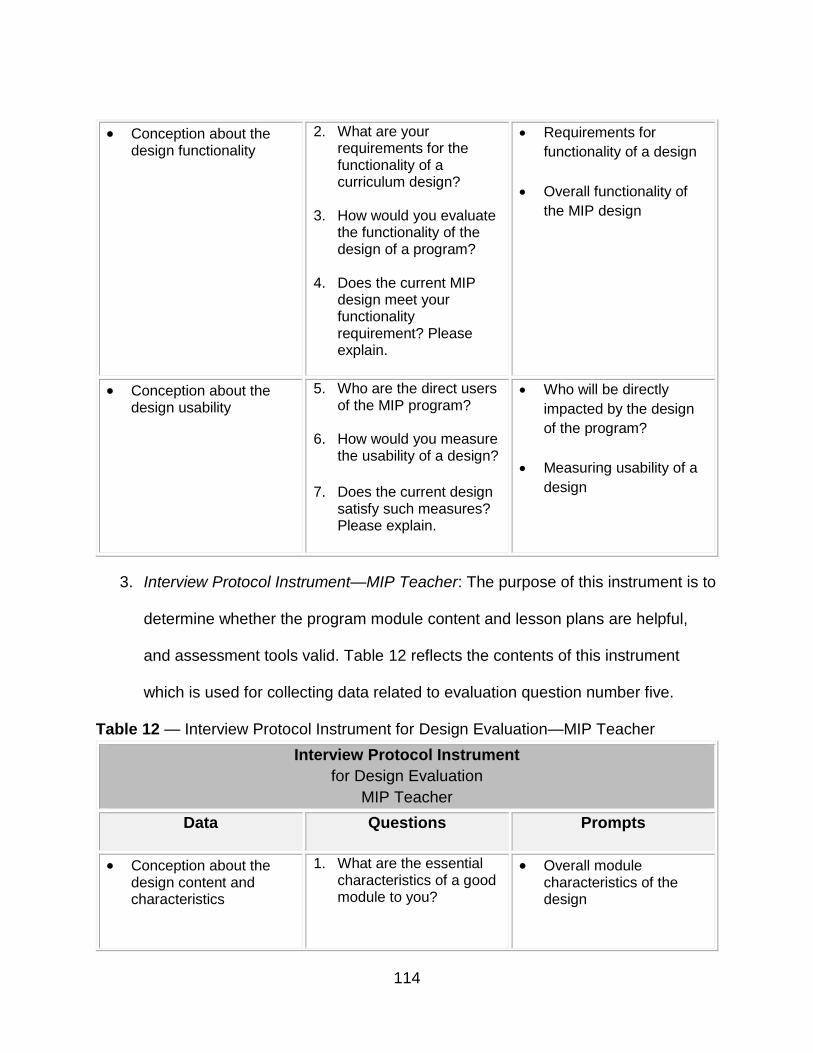
114
Conception about the design functionality
2. What are your requirements for the functionality of a curriculum design?
3. How would you evaluate the functionality of the design of a program?
4. Does the current MIP design meet your functionality requirement? Please explain.
Requirements for
functionality of a design
Overall functionality of
the MIP design
Conception about the design usability
5. Who are the direct users of the MIP program?
6. How would you measure the usability of a design?
7. Does the current design satisfy such measures? Please explain.
Who will be directly
impacted by the design
of the program?
Measuring usability of a
design
3. Interview Protocol Instrument—MIP Teacher: The purpose of this instrument is to
determine whether the program module content and lesson plans are helpful,
and assessment tools valid. Table 12 reflects the contents of this instrument
which is used for collecting data related to evaluation question number five.
Table 12 — Interview Protocol Instrument for Design Evaluation—MIP Teacher
Interview Protocol Instrument
for Design Evaluation
MIP Teacher
Data Questions Prompts
Conception about the design content and characteristics
1. What are the essential characteristics of a good module to you?
Overall module characteristics of the design

115
2. Are such characteristics present in the design of the modules?
Overall content of the design
Conception about the design usability
3. How would you measure the usability of a design?
4. Do current modules satisfy such measures? Please explain.
Measuring usability of a
design
Overall usability of the
modules
Conception about the validity of assessment tools
Conception about assessment rubrics
5. How do you see the relation between the test/quiz items and corresponding modules? Please explain.
6. How useful did you find the assessment rubrics?
Test/Quiz relations to the
module contents
Assessment rubric
usefulness
The overall information with regard to data sources, selected method(s) for
collecting data, instrumentation, and procedures for each evaluation questions are
explained in Table 13.
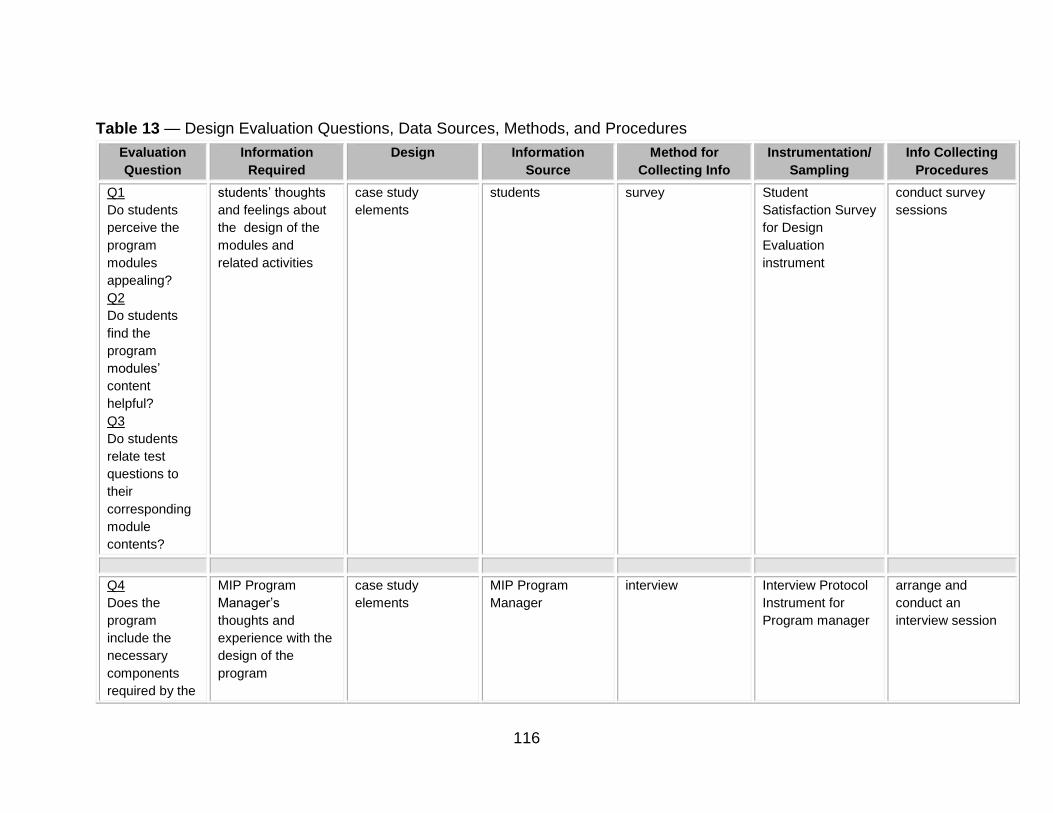
116
Table 13 — Design Evaluation Questions, Data Sources, Methods, and Procedures
Evaluation
Question
Information
Required
Design Information
Source
Method for
Collecting Info
Instrumentation/
Sampling
Info Collecting
Procedures
Q1
Do students
perceive the
program
modules
appealing?
Q2
Do students
find the
program
modules’
content
helpful?
Q3
Do students
relate test
questions to
their
corresponding
module
contents?
students’ thoughts
and feelings about
the design of the
modules and
related activities
case study
elements
students survey Student
Satisfaction Survey
for Design
Evaluation
instrument
conduct survey
sessions
Q4
Does the
program
include the
necessary
components
required by the
MIP Program
Manager’s
thoughts and
experience with the
design of the
program
case study
elements
MIP Program
Manager
interview Interview Protocol
Instrument for
Program manager
arrange and
conduct an
interview session
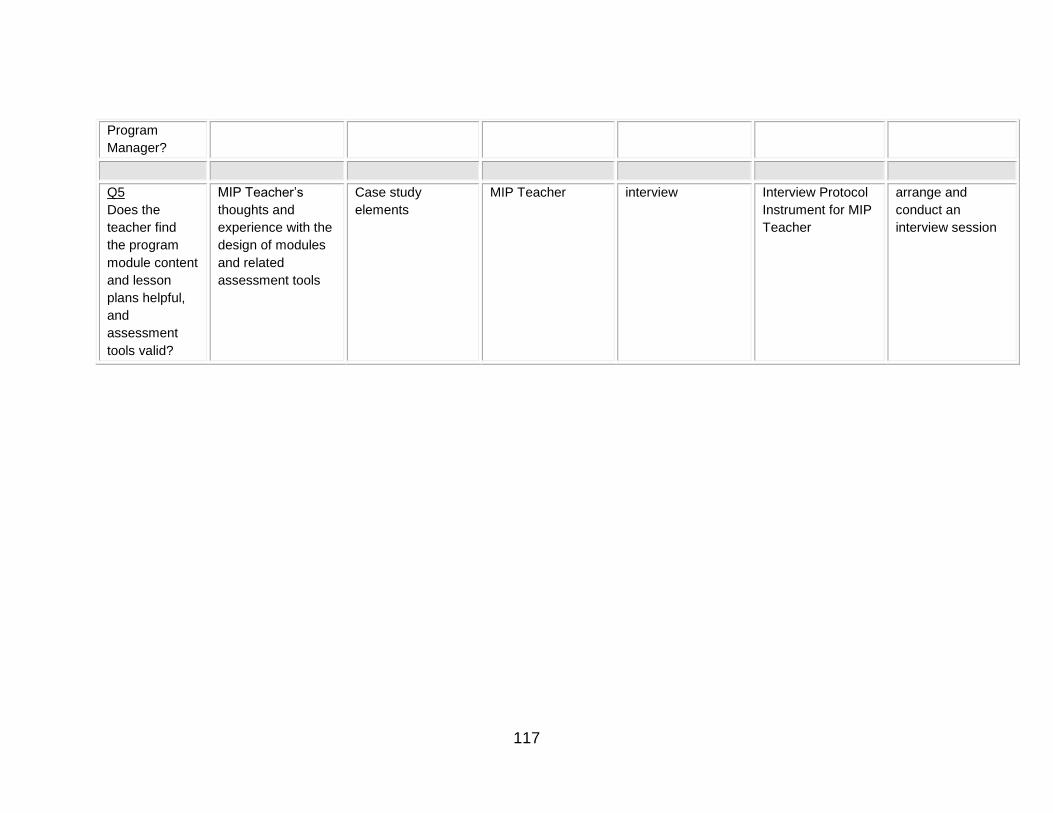
117
Program
Manager?
Q5
Does the
teacher find
the program
module content
and lesson
plans helpful,
and
assessment
tools valid?
MIP Teacher’s
thoughts and
experience with the
design of modules
and related
assessment tools
Case study
elements
MIP Teacher interview Interview Protocol
Instrument for MIP
Teacher
arrange and
conduct an
interview session

118
Procedures
Interview: To recruit the participants, the names of the relevant faculty and staff
were obtained from the school vice principal who is also the Program Manager. These
individuals were then contacted, inviting them to participate in the study. The
participants were advised of the nature of the study and the goals of the research,
reviewed the informed consent process, and asked whether he or she would like to
participate. Upon acceptance, an appointment was set up to meet the individual at a
mutually agreed date and time. The face-to-face interview sessions were held in a safe
and comfortable location to both the interviewee and researcher, which allowed for a
confidential and private environment. Upon the agreement of the interviewee, the
session was recorded using an audiotape. The identities of the interviewees will remain
confidential, and when necessary, only pseudonyms will be used. All data will remain
confidential and secured both electronically and physically.
Survey: Two anonymous surveys were conducted from the MIP students during
the semester in which the program is offered. The first one was conducted during the
first quarter and the second during the last week of the second quarter. Both surveys
were conducted by the MIP teacher on designated school days and during normal class
sessions. All MIP students were encouraged to participate in the survey. Designated
survey dates were determined in consultation with the MIP teacher. Few days before
the start of the survey, the MIP teacher was provided with the survey instrument, and a
reminder letter was sent one day before the designated survey date. The survey period
was active during two class sessions to ensure all students would have a chance to

119
participate. All data will remain confidential and secured both electronically and
physically.
To examine students’ initial impressions of the design, maximize the efficiency of
the module by incorporating the necessary modifications—based on the study of this
survey—an anonymous survey was conducted on November 14, 2014. Using the
Student Satisfaction Survey for Design Evaluation instrument (Table 10), this survey
was conducted during the class session, and monitored and collected by MIP teacher
who placed them in a sealed envelope and delivered it to me. The survey results were
evaluated, and subsequently few modifications were introduced in the remaining
modules (e.g., improving the navigation system throughout the module, labeling the
online video clips for better referencing, and introducing more varieties of videos among
others). A second anonymous survey was conducted on December, 3, 2014—the result
of which was the basis for evaluating the design. Seventeen students participated in this
survey. Using the Student Satisfaction Survey for Design Evaluation instrument (Table
10), this survey was also conducted during the class session, monitored and collected
by MIP teacher, and later submitted to me in a sealed envelope.
Results and Discussions
In an interview session, the MIP Program Manager, Paul Smith, who is also the
Academic Dean at RHS, confirms his full satisfaction with respect to the overall
requirements and function of the MIP program (evaluation question number four).
Regarding the characteristics of a good design, P. Smith identifies: “the functionality of
the design itself, relating to the standards...and the usability of the [design] that are
workable for both the student and the teacher” (personal communication, December 8,

120
2014). With regard to content and standards in the MIP program, P. Smith indicates that
“As a new program, we have been very concerned with the standards and its contents. I
think we have covered those very well, so I am very happy” (personal communication,
December 8, 2014). Furthermore, “The [MIP] program is very clearly defined, and I am
very pleased that we have communicated it to the parents…” (personal communication,
December 8, 2014). With regard to the functionality and usability of the MIP program, P.
Smith responds, “How we have actually set up the course itself. Does it actually meet
the needs of the students…. Is it adjustable…and flexible? And we have done
that…these characteristics are present in this program” (personal communication,
December 8, 2014). Furthermore, he concludes that “I am very happy with the program.
We have been looking for ways that we can help our students. I am really excited about
the possibility of continuing on, and may be even expanding” (P. Smith, personal
communication, December 8, 2014). In an interview session with the MIP teacher,
Jeremy Adams confirms his overall satisfaction with respect to the program module
content and lesson plans as well as the validity of the assessment tools (evaluation
question number five). With regard to the characteristics of a good module, J. Adams
identifies: “giving kids multiple things to look at...not just one way. Showing them videos,
using examples…using technology…using things that make it pop a little more…giving
kids multiple examples on how to do things. These are important because you want to
make them interested and have them involved and interact with it” (personal
communication, February 3, 2015). J. Adams confirms the presence of these
characteristics in the modules by expressing that “They have great pictures, sticky
notes…which make them nice to look at. They give the kids examples, plenty of videos
121
for them to watch. I think these modules do a great job of giving these kids what they
need to be successful.” Furthermore, “When kids look for something or questions they
may have, I mean, they are all there. There is plenty of stuff for them to use —
especially, if they have a question, the module does a great job of making sure that kids
have plenty of resources that they can use” (J. Adams, personal communication,
February 3, 2015). With regard to the assessment items and their relationship with
module content, J. Adams replies, “I think they correspond really well. The questions
are very clear...nothing tricky about them. I think the questions on the test matched up
the contents of the module really well” (personal communication, February 3, 2015).
The results of these interview sessions clearly indicate that both the MIP teacher and
the Program Manager are satisfied with the overall design of the MIP program.
The survey items are designed using a Likert scale with the following values
(designated for each response to survey items): 1= Very Dissatisfied, 2= Dissatisfied,
3= Neutral, 4= Satisfied, and 5= Very Satisfied. The Microsoft Excel application program
(version 2013) was used for the statistical analyses related to the design evaluation.
The results for individual survey items (averages) are presented in Figure 13.
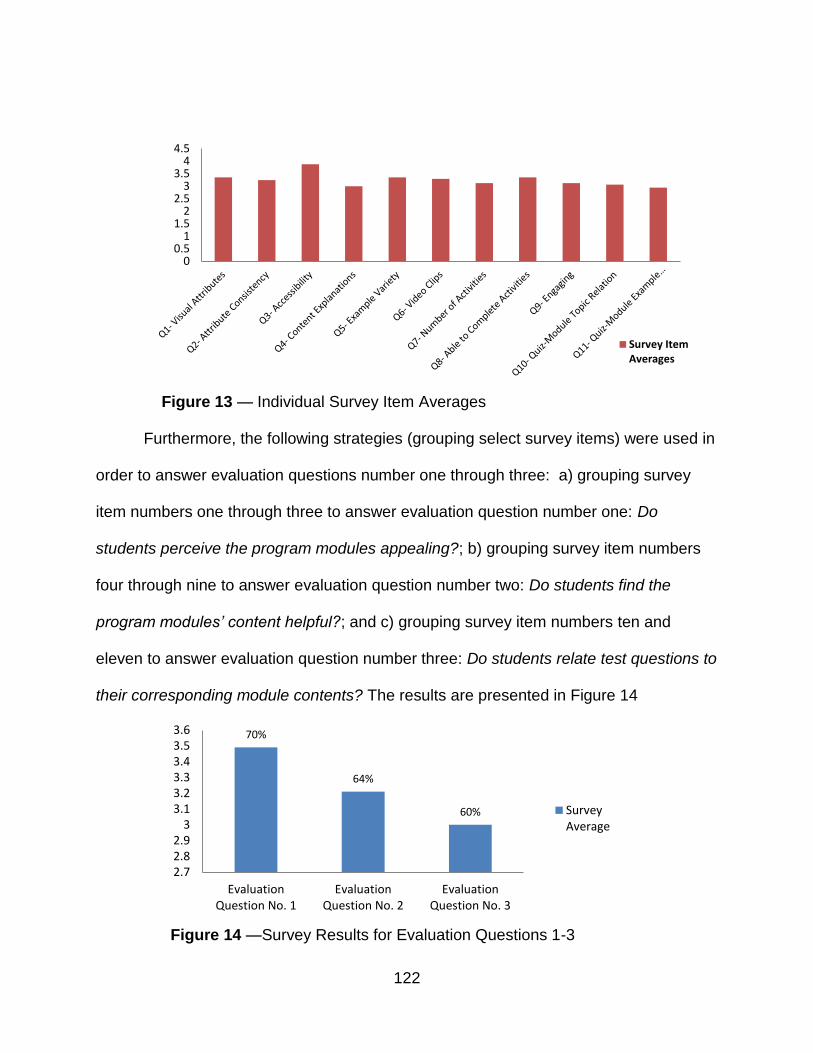
122
Figure 13 — Individual Survey Item Averages
Furthermore, the following strategies (grouping select survey items) were used in
order to answer evaluation questions number one through three: a) grouping survey
item numbers one through three to answer evaluation question number one: Do
students perceive the program modules appealing?; b) grouping survey item numbers
four through nine to answer evaluation question number two: Do students find the
program modules’ content helpful?; and c) grouping survey item numbers ten and
eleven to answer evaluation question number three: Do students relate test questions to
their corresponding module contents? The results are presented in Figure 14
Figure 14 —Survey Results for Evaluation Questions 1-3
00.5
11.5
22.5
33.5
44.5
Survey ItemAverages
70%
64%
60%
2.72.82.9
33.13.23.33.43.53.6
EvaluationQuestion No. 1
EvaluationQuestion No. 2
EvaluationQuestion No. 3
SurveyAverage

123
Considering the design evaluation criteria, the survey analyses indicate that
students, on average, perceive the design as appealing (evaluation question number
one). However, students, on average, do not find the module’s content as helpful or test
questions relating to module contents (evaluation questions number two and three
respectively).
As an expanded approach to evaluating the design of the MIP program, in order
to examine students’ perceptions on design’s usability and aesthetic aspects (the
design framework—explained in Chapter II), the following strategies (grouping select
survey items) were used: a) grouping survey item numbers one through three to
determine students’ perceptions with respect to the aesthetic aspect of the design; and
b) grouping survey item numbers four through eleven to determine students’
perceptions with respect to the usability aspect of the design. The results are presented
in Figure 15.
Figure 15 — Survey Results for the Design Framework
Considering the design evaluation criteria, the survey analyses indicate that
students, on average, perceive the design aesthetically appealing. However, on
70%
63%
2.9
3
3.1
3.2
3.3
3.4
3.5
3.6
Aesthetic Usability
SurveyAverage
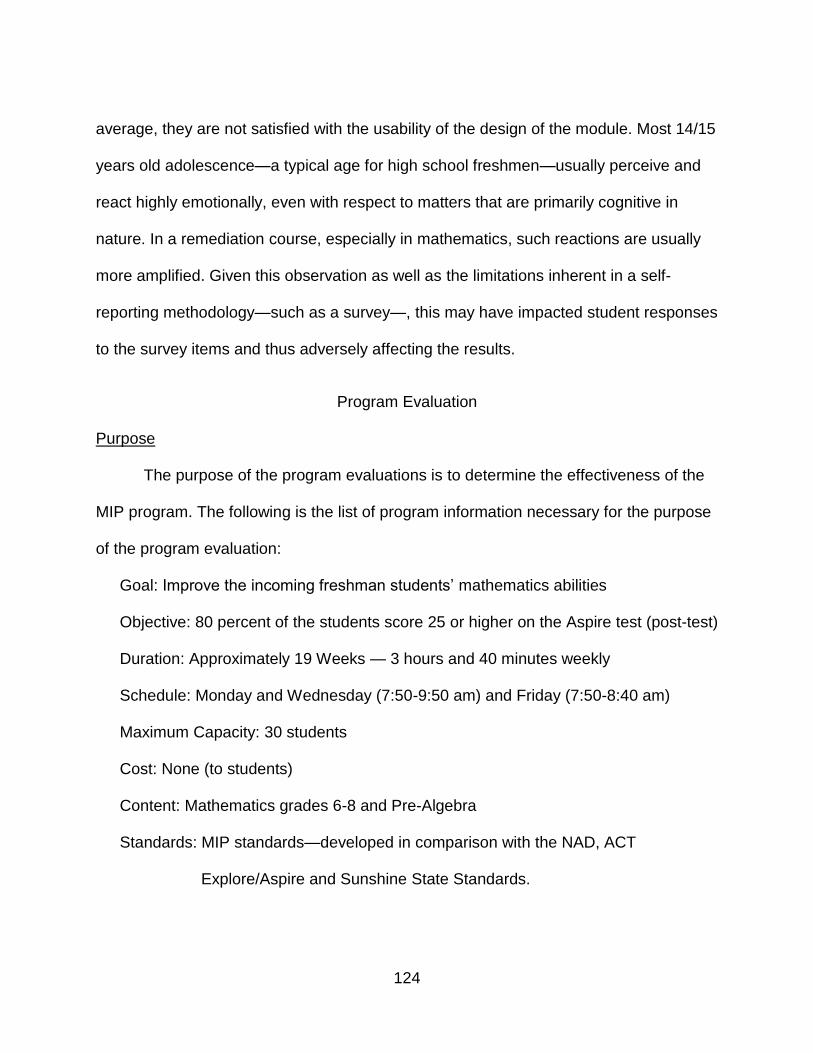
124
average, they are not satisfied with the usability of the design of the module. Most 14/15
years old adolescence—a typical age for high school freshmen—usually perceive and
react highly emotionally, even with respect to matters that are primarily cognitive in
nature. In a remediation course, especially in mathematics, such reactions are usually
more amplified. Given this observation as well as the limitations inherent in a self-
reporting methodology—such as a survey—, this may have impacted student responses
to the survey items and thus adversely affecting the results.
Program Evaluation
Purpose
The purpose of the program evaluations is to determine the effectiveness of the
MIP program. The following is the list of program information necessary for the purpose
of the program evaluation:
Goal: Improve the incoming freshman students’ mathematics abilities
Objective: 80 percent of the students score 25 or higher on the Aspire test (post-test)
Duration: Approximately 19 Weeks — 3 hours and 40 minutes weekly
Schedule: Monday and Wednesday (7:50-9:50 am) and Friday (7:50-8:40 am)
Maximum Capacity: 30 students
Cost: None (to students)
Content: Mathematics grades 6-8 and Pre-Algebra
Standards: MIP standards—developed in comparison with the NAD, ACT
Explore/Aspire and Sunshine State Standards.

125
Measurement
Summative Assessment: The ACT-Aspire test for both pre- and post-tests
Formative Assessment: Quizzes and Tests in each module
Criteria for Student Selection:
1. Full or partial acceptance to RHS
2. Students whose scores are 18 or less on the ACT Explore test, 240 or less on
FCAT 2.0, and/or their normalized standard score in ITBS is 3 or less.
Stakeholders
Students, parents, Algebra 1 teacher, Mathematics Department, and school
administration
Primary stakeholder: Vice Principal for Academics at RHS who is also the
designated Program Manager
Evaluation Criteria
The program is determined to be successful when at least 80 percent of the
participants score 25 or higher on the ACT-Aspire (post-test).
Program Evaluation Questions
1. How well is the program designed and implemented?
2. Do students attend the program regularly?
3. Do students actively participate in the program activities?
4. Do students find the modules and related activities helpful?
5. Does the teacher find the program contents helpful and assessment tools valid?
6. Do 80 percent of participants score 25 or higher on the ACT-Aspire test (post-
test)?
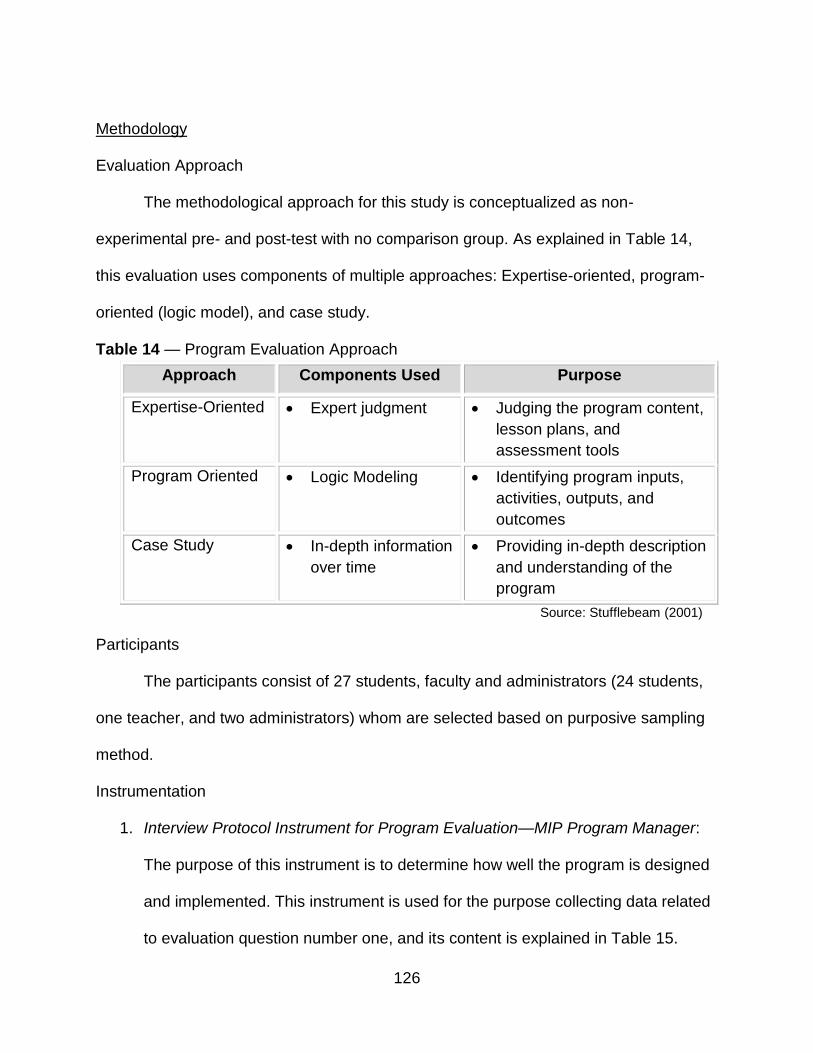
126
Methodology
Evaluation Approach
The methodological approach for this study is conceptualized as non-
experimental pre- and post-test with no comparison group. As explained in Table 14,
this evaluation uses components of multiple approaches: Expertise-oriented, program-
oriented (logic model), and case study.
Table 14 — Program Evaluation Approach
Approach Components Used Purpose
Expertise-Oriented Expert judgment Judging the program content,
lesson plans, and
assessment tools
Program Oriented Logic Modeling Identifying program inputs,
activities, outputs, and
outcomes
Case Study In-depth information
over time
Providing in-depth description
and understanding of the
program
Source: Stufflebeam (2001)
Participants
The participants consist of 27 students, faculty and administrators (24 students,
one teacher, and two administrators) whom are selected based on purposive sampling
method.
Instrumentation
1. Interview Protocol Instrument for Program Evaluation—MIP Program Manager:
The purpose of this instrument is to determine how well the program is designed
and implemented. This instrument is used for the purpose collecting data related
to evaluation question number one, and its content is explained in Table 15.

127
Table 15 — Interview Protocol Instrument for Program Evaluation—Program Manager
Interview Protocol Instrument
for Program Evaluation
Program Manager
Data Questions Prompts
Conceptions about the program characteristics
Conception about the placement process
Conceptions about steps of the program implementation
1. What are the essential MIP program characteristics?
2. How are students selected for the MIP program?
3. What steps are necessary to implement the program?
Overall program characteristics
Criteria and placement process
Steps of implementing the program
Conception about implementing these steps and their completion
4. How was the implementation plan scheduled and responsibilities assigned?
5. How was the implementation plan supervised?
Implementation plan schedule
People responsible for implementing steps and monitoring
Conception about testing the functionality at each step and when the program was fully implemented
6. Was the implementation of each step testes? If so, how?
7. Was the program pilot-tested after its completion? If so, how?
Methods of testing the implementation of each step
Methods of testing the full functionality of the program
2. Interview Protocol Instrument—IT Manager: The purpose of this instrument is to
determine how well the program is implemented. This instrument is used for the
purpose collecting data related to evaluation question number one, and its
content is explained in Table 16.

128
Table 16 — Interview Protocol Instrument for the IT Manager
Interview Protocol Instrument
IT Manager
Data Questions Prompts
Conception about the MIP technical requirement, both hardware and software
1. What are the hardware and software requirements for the MIP program?
2. Are these requirements met during the implementation of the MIP program?
Overall hardware and software requirements
Overall implementation of the technical requirements
Conception about
online access policies
and limitations
Conception about on
the related impacts on
the MIP students and
teachers
3. What are the school policies with regard to online access for the students?
4. How do these policies may impact MIP students and teacher
School online access
policies
The impact of related
policies on MIP
students and teacher
3. Student Participation Observation: The purpose of this instrument is to determine
the degree to which students participate in the program activities. This instrument
is used for the purpose of collecting data related to evaluation question number
three, content of which is explained in Table 17.
Table 17 — Student Participation Observation Protocol
Student Participation Observation Protocol
Data Notes
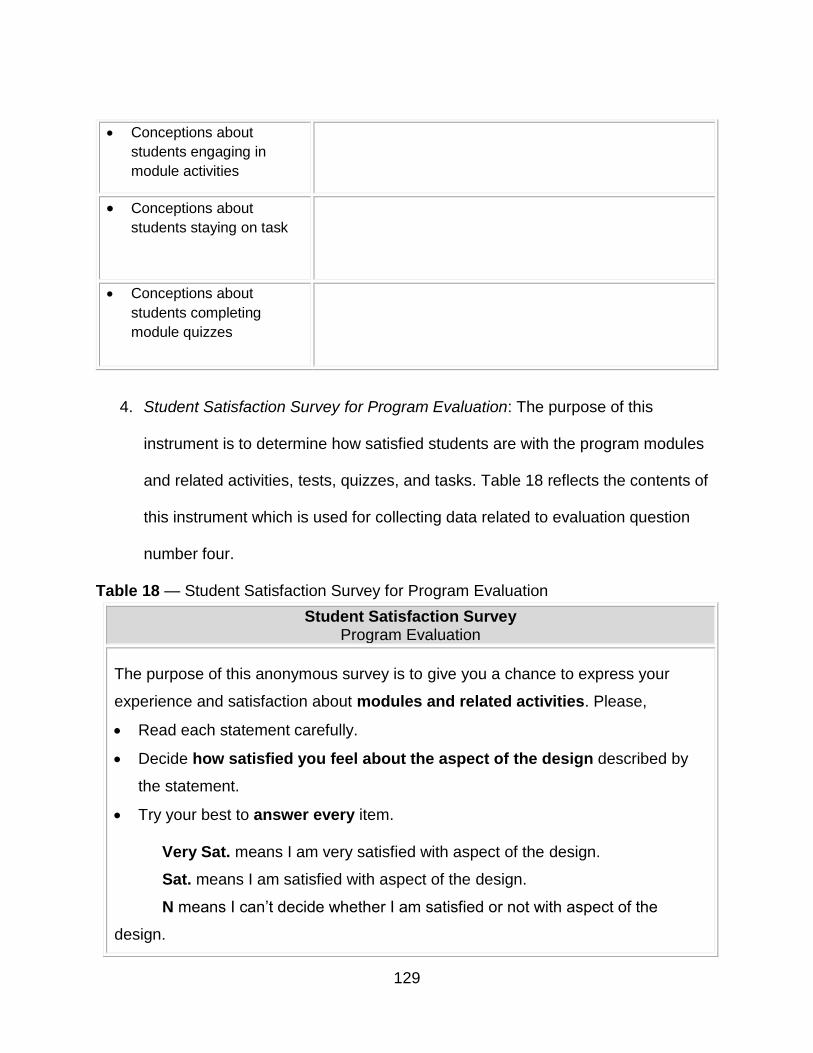
129
Conceptions about
students engaging in
module activities
Conceptions about
students staying on task
Conceptions about
students completing
module quizzes
4. Student Satisfaction Survey for Program Evaluation: The purpose of this
instrument is to determine how satisfied students are with the program modules
and related activities, tests, quizzes, and tasks. Table 18 reflects the contents of
this instrument which is used for collecting data related to evaluation question
number four.
Table 18 — Student Satisfaction Survey for Program Evaluation
Student Satisfaction Survey Program Evaluation
The purpose of this anonymous survey is to give you a chance to express your
experience and satisfaction about modules and related activities. Please,
Read each statement carefully.
Decide how satisfied you feel about the aspect of the design described by
the statement.
Try your best to answer every item.
Very Sat. means I am very satisfied with aspect of the design.
Sat. means I am satisfied with aspect of the design.
N means I can’t decide whether I am satisfied or not with aspect of the
design.
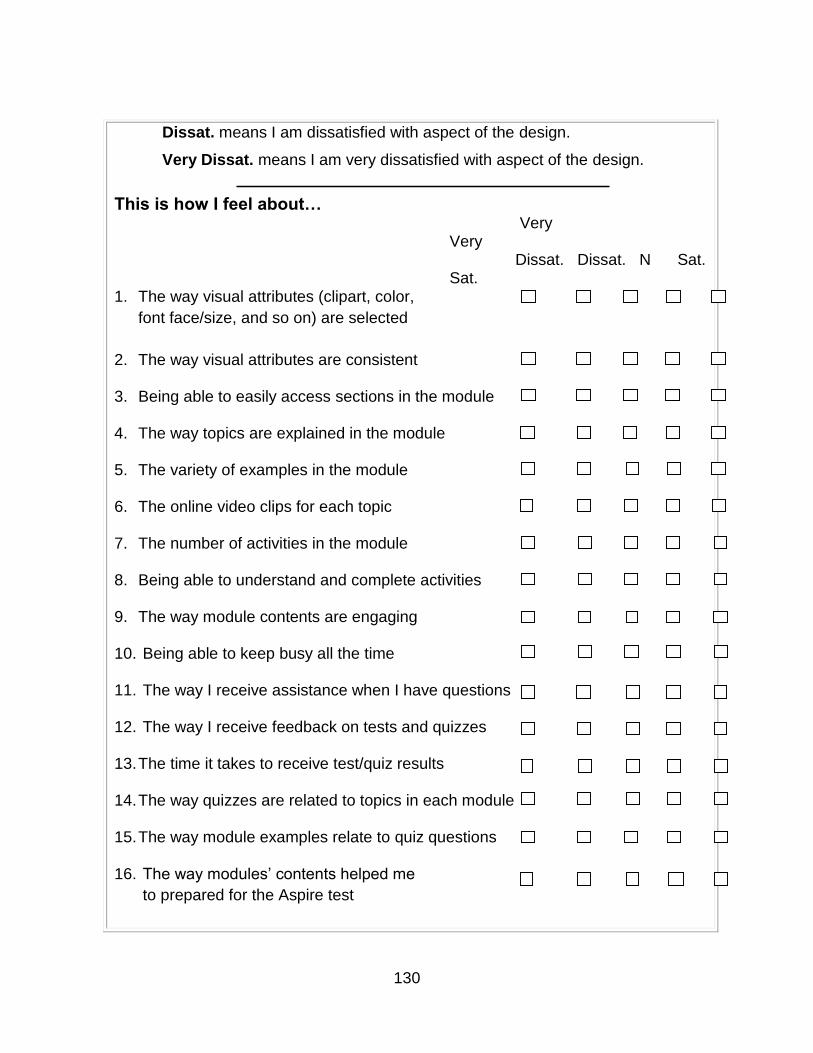
130
Dissat. means I am dissatisfied with aspect of the design.
Very Dissat. means I am very dissatisfied with aspect of the design.
This is how I feel about… Very
Very Dissat. Dissat. N Sat. Sat.
1. The way visual attributes (clipart, color,
font face/size, and so on) are selected
2. The way visual attributes are consistent
3. Being able to easily access sections in the module
4. The way topics are explained in the module
5. The variety of examples in the module
6. The online video clips for each topic
7. The number of activities in the module
8. Being able to understand and complete activities
9. The way module contents are engaging
10. Being able to keep busy all the time
11. The way I receive assistance when I have questions
12. The way I receive feedback on tests and quizzes
13. The time it takes to receive test/quiz results
14. The way quizzes are related to topics in each module
15. The way module examples relate to quiz questions
16. The way modules’ contents helped me
to prepared for the Aspire test

131
17. The way modules’ tests/quizzes helped me
to prepared for the Aspire test
Very
Very Dissat. Dissat. N
Sat. Sat.
Please select one: Male Female
5. Interview Protocol Instrument for Program Evaluation —MIP Teacher: The
purpose of this instrument is to determine whether the program contents are
helpful and assessment tools valid. Table 19 reflects the contents of this
instrument which is used for collecting data related to evaluation question
number five.
Table 19 — Interview Protocol Instrument for Program Evaluation—MIP Teacher
Interview Protocol Instrument
for Program Evaluation
MIP Teacher
Data Questions Prompts
Conception about the design content and characteristics
7. What are the essential characteristics of a good module to you?
8. Are such characteristics present in the design of the modules?
Overall module characteristics of the design
Overall content of the design
Conception about the design usability
9. How would you measure the usability of a design?
10. Do current modules satisfy such measures? Please explain.
Measuring usability of a
design
Overall usability of the
modules

132
Conception about the validity of assessment tools
Conception about assessment rubrics
11. How do you see the relation between the test/quiz items and corresponding modules? Please explain.
12. How useful did you find the assessment rubrics?
Test/Quiz relations to the
module contents
Assessment rubric
usefulness
6. The ACT Aspire Test: The ACT standardized test (mathematics scores) is used
for the selection process as well as pre- and post-tests. The analysis of the data
related to pre- and post-test scores will answer the evaluation question number
six.
The overall information with regard to data sources, selected method(s) for collecting
data, instrumentation, and procedures for each evaluation questions are explained in
Table 20.

133
Table 20 — Program Evaluation Questions, Data Sources, Methods, and Procedures
Evaluation
Question
Information
Required
Design Information
Source
Method for
Collecting Info
Instrumentation/
Sampling
Info Collecting
Procedures
Q1
How well is the
program
designed and
implemented?
program
documents and
implementation
plans; ease of
access to
eBackpack and
module online links;
modules’
contents and
activities; program
function in action
case study
elements; logic
model; expertise-
oriented elements
program designer,
program manager,
school IT director,
mathematics
teacher, tutor and
students
documentation
review, interviews,
and observation
Interview Protocol
instrument for
Program
Evaluation—
Program Manager,
Interview Protocol
for IT Director,
Student
Participation
Observation
Protocol
obtain program
documentation;
arrange and
conduct interview
sessions; student
observations are
done during daily
class sessions
Q2
Do students
attend the
program
regularly?
attendance records case study
elements
school Registrar
and Records
school records related school
request form
obtain, complete,
and submit the
Attendance
Request form from
the office of school
Registrar and
Record.
Q3
Do students
actively
participate in
the program
activities?
student
attentiveness
during daily class
sessions
case study
elements
students observation (quite
participation)
Student
Participation
Observation
Protocol
the evaluator
collects data by
conducting
multiple direct
quite observation
sessions

134
Q4
Do students
find the
modules and
related
activities and
quizzes
helpful?
students thoughts
and feelings about
the modules and
related activities
case study
elements
students survey Student
Satisfaction Survey
for Program
Evaluation
conduct survey
sessions
Q5
Does the
teacher find
the program
contents
helpful and
assessment
tools valid?
MIP Teacher’s
thoughts and
experience with the
program modules
and related
assessment tools
case study
elements
MIP Teacher interview Interview Protocol
Instrument for
Program
Evaluation —MIP
Teacher
arrange and
conduct an
interview session
Q6
Do 80 percent
of participants
score 25 or
higher on the
ACT Aspire
(post-test)?
students’ scores on
the ACT Aspire test
(pre- and post-test)
descriptive; pre-
and post-test
school Registrar
and Records
school records related school
request form
obtain, complete
and submit the
Grade Request
form from the
Office of Registrar
and Record.
In addition, the MIP program logic model is explained in Table 21.

135
Table 21 — MIP Program Logic Model
Inputs Activities Outputs Outcomes Impact
Short Term
Medium Term
A large room with the necessary furniture
32 iPads connected to the network
32 headsets with microphone
32 basic calculators Network access ID and
password for 32 people
One mathematics teacher
One mathematics tutor
One person to design and develop
Implement the MIP program
One administrator (to select teacher and tutor)
One person to order textbooks
One person to order ACT Aspire tests
The necessary stationary materials
The eBackpack tutorial training session for students
The necessary budget One IT Director
Select a classroom with suitable furniture
Obtain iPads, headphones, and calculators
Obtain network IDs and password for students and tutors, and test them
Designate persons to order textbooks and Aspire tests
Research and select the overall resources in order to develop course modules
Develop modules, assessment tools and related rubrics
Check the module contents, and related quizzes, tests, and rubrics
Upload modules on the eBackpack program
Check the links in the modules
Assign one mathematics teacher
Select students
Recruit a tutor
Create seat assignment for students and tutor
Write a concise information on the MIP program for parents
Students will take the ACT Aspire test (pre-test).
Students study each section in the module
Students complete the section activities and exercises, and work with the teacher and tutor if necessary.
Students review the section and complete the corresponding quiz.
Students review the assigned module and complete the corresponding end-of-module test
Mathematics teacher takes attendance (students and tutor), conducts a 10-15 minutes bell-work session, monitor student activities, and answer questions.
Tutor works with each student who desires his/her assistance.
Passing quizzes for each module
Passing end-of-modules
tests
Students score 25 or higher on the ACT-Aspire test (post-test).

136
A copy of the approval letter from the UCF Institutional Review Board (IRB) with
respect to human research for this study is displayed below.

137
APPENDIX B: SAMPLE CURRICULUM MODULE
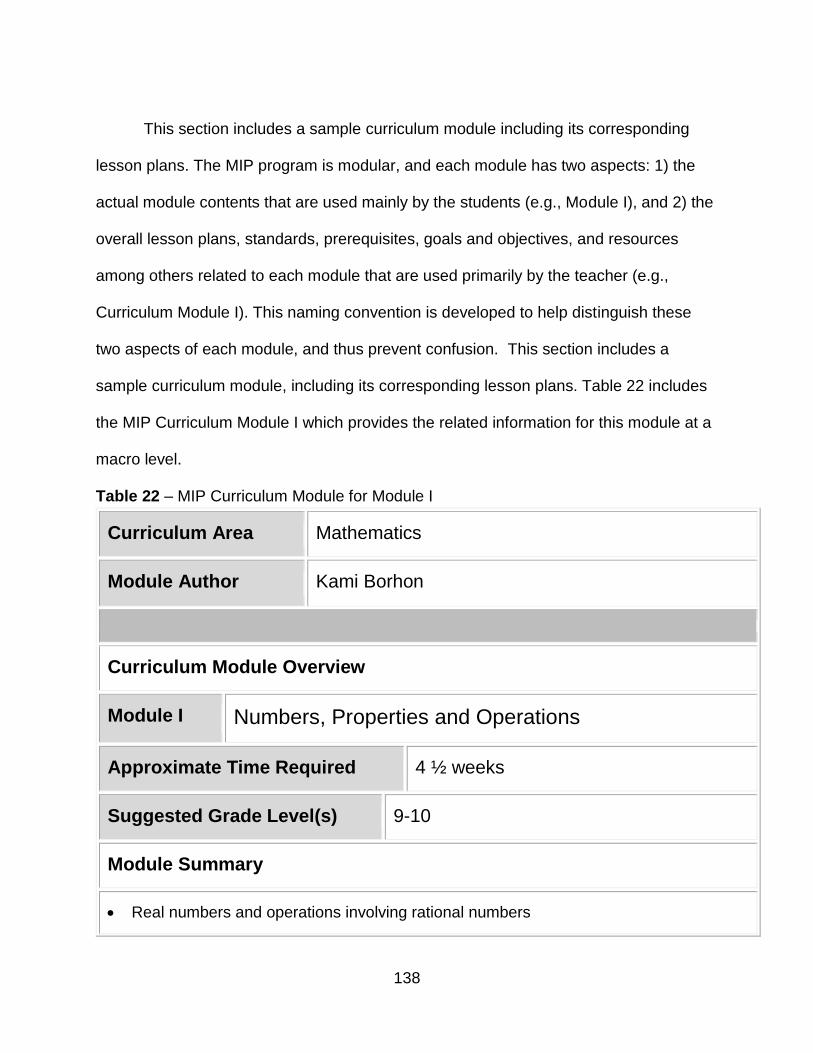
138
This section includes a sample curriculum module including its corresponding
lesson plans. The MIP program is modular, and each module has two aspects: 1) the
actual module contents that are used mainly by the students (e.g., Module I), and 2) the
overall lesson plans, standards, prerequisites, goals and objectives, and resources
among others related to each module that are used primarily by the teacher (e.g.,
Curriculum Module I). This naming convention is developed to help distinguish these
two aspects of each module, and thus prevent confusion. This section includes a
sample curriculum module, including its corresponding lesson plans. Table 22 includes
the MIP Curriculum Module I which provides the related information for this module at a
macro level.
Table 22 – MIP Curriculum Module for Module I
Curriculum Area Mathematics
Module Author Kami Borhon
Curriculum Module Overview
Module I Numbers, Properties and Operations
Approximate Time Required 4 ½ weeks
Suggested Grade Level(s) 9-10
Module Summary
Real numbers and operations involving rational numbers

139
Improper fraction and mixed numerals
Problems involving integer exponents, roots, and radicals
Estimating and rounding, absolute value, primes and greatest common factor
Scientific notation and conversion of units of measurement
Ratio and proportional relationships and their applications
Targeted Content Standards
M.I.P.M.1: Know the real number system, and be able to add, subtract, multiply and
divide rational numbers.
M.I.P.M.2: Solve multi-step arithmetic problems using rational numbers.
M.I.P.M.3: Solve problems involving integer exponents, roots, and radicals.
M.I.P.M.4: Understand estimating and rounding, absolute value, primes and greatest
common factor.
M.I.P.M.5: Understand the scientific notation.
M.I.P.M.6: Solve problems involving converting units of measurement.
M.I.P.M.7: Understand ratio and use its applications.
M.I.P.M.8: Analyze proportional relationships and use their applications.
M.I.P.M.9: Solve problems involving percentage and interest.
Student Prerequisite Skills
Students should know basic arithmetic computations.
Students should be familiar with using an iPad.
Students should be able to use the eBackpack program. Students should be familiar with using a basic calculator.
Materials and Resources Required for Module/Lessons
Tools and Materials Pen-pencil and paper
Technology, Internet,
Hardware and Software
iPad, earphone, calculator, monitor, speakers,
and access to the Internet
Other Tools and Supply None

140
Curriculum-Framing Questions
Essential Questions Why is it necessary to have different types of
numbers in mathematics?
How negative numbers are used in real life
situations?
What are the benefits and drawbacks of
estimating?
Why is using the scientific notation important?
When using proportions becomes necessary?
Why?
Focus Questions Does the student know the real number system
and its properties?
Is the student able to add, subtract, multiply and
divide rational numbers?
Can the student solve multi-step arithmetic
problems using rational numbers?
Can the student solve problems involving integer
exponents, roots, and radicals?
Does the student understand estimating and
rounding, absolute vale, primes and greatest
common factor as well as the scientific notation?
Can the student solve problems that involve
converting units of measurement?
Does the student Understand ratio and use its
applications?
Can the student analyze proportional relationships
and use their applications?
Can the student solve problems involve percentage
and interest?
Learning Goals and Objectives
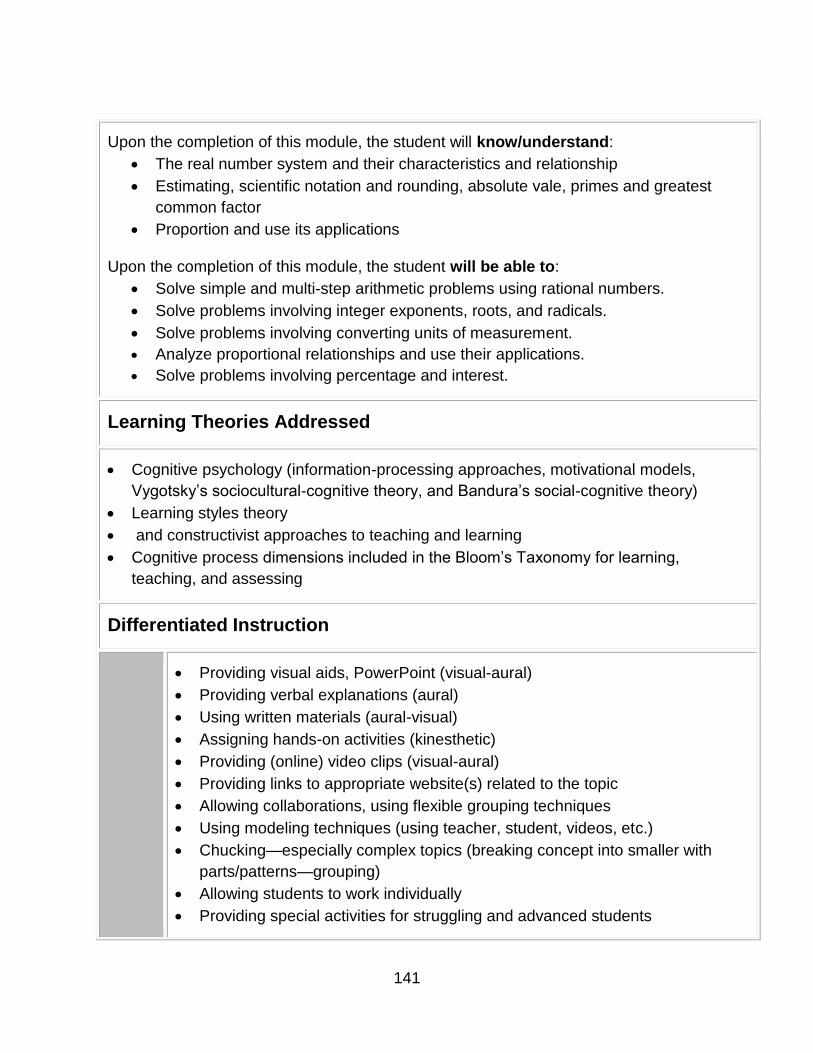
141
Upon the completion of this module, the student will know/understand:
The real number system and their characteristics and relationship
Estimating, scientific notation and rounding, absolute vale, primes and greatest
common factor
Proportion and use its applications
Upon the completion of this module, the student will be able to:
Solve simple and multi-step arithmetic problems using rational numbers.
Solve problems involving integer exponents, roots, and radicals.
Solve problems involving converting units of measurement.
Analyze proportional relationships and use their applications.
Solve problems involving percentage and interest.
Learning Theories Addressed
Cognitive psychology (information-processing approaches, motivational models,
Vygotsky’s sociocultural-cognitive theory, and Bandura’s social-cognitive theory)
Learning styles theory
and constructivist approaches to teaching and learning
Cognitive process dimensions included in the Bloom’s Taxonomy for learning,
teaching, and assessing
Differentiated Instruction
Providing visual aids, PowerPoint (visual-aural)
Providing verbal explanations (aural)
Using written materials (aural-visual)
Assigning hands-on activities (kinesthetic)
Providing (online) video clips (visual-aural)
Providing links to appropriate website(s) related to the topic
Allowing collaborations, using flexible grouping techniques
Using modeling techniques (using teacher, student, videos, etc.)
Chucking—especially complex topics (breaking concept into smaller with
parts/patterns—grouping)
Allowing students to work individually
Providing special activities for struggling and advanced students

142
Providing special assistance and activities for ESOL and ESE students
Providing student-tutoring (peer-tutoring)
Providing guided practice—step-by-step directions
Providing individual teacher/tutor assistance
Providing ongoing feedback
Accommodations
ESOL/ELL/LEP Pair students with bilingual peers, if available.
Provide bilingual dictionaries in class.
Provide verbal and written directions.
Designate extra time (as needed) for activities, quizzes,
and tests.
ESE/SLD/ESE Provide visual aids (hand-outs with large prints, etc.).
Designate extra time (as needed) for activities, quizzes,
and tests.
Provide specific student needs as resources permit.
Follow direction recommended and/or directed by the
school counselor or administration.
Struggling Adjust instruction to address students’ gap in knowledge
and skills.
Use small group instruction.
Provide more peer-tutoring opportunities.
Design task at different degrees of difficulty.
Use a variety of presentation approaches.
Designate extra time (as needed) for activities, quizzes,
and tests
Advanced/Gifted Raise expectations.
Design more challenging exercises and activities.
Constitute levels of excellence.
Assessment

143
Observation (formative, informal)
Performance task (formative, informal)
Demonstration (formative, informal)
Self- and peer-evaluation (formative, informal)
Quiz (formative, formal)
Test (summative, formal)
Technology Assessment
iPads must be functional and connected to the Internet.
eBackpack app must be functional.
Earphones must function properly.
Source: Author’s produced content using template generated by Gunter (2010) and in-text by Gunter and Gunter (2015)
Detailed information for lesson plans 1 and 2 for this module (Module I) are
provided in Tables 23 and 24 respectively. These tables include specific information for
learning activities and assignment, assessment, and resources for their corresponding
lesson plans.

144
Table 23 – Lesson Plan 1 of Module I
Subject Mathematics Week/Day 3 ½ Weeks
Module I Numbers, Properties and Operations Grade 9-10
Topic Lesson 1: Computation and Basic Operation Author Kami Borhon
Lesson Summary
Real numbers and operations involving rational numbers
Improper fraction and mixed numerals
Problems involving integer exponents, roots, and radicals
Estimating and rounding, absolute value, primes and greatest common factor
Scientific notation and conversion of units of measurement
Benchmarks
M.I.P.M.1: Know the real number system, and be able to add, subtract, multiply and
divide rational numbers.
M.I.P.M.2: Solve multi-step arithmetic problems using rational numbers.
M.I.P.M.3: Solve problems involving integer exponents, roots, and radicals.
M.I.P.M.4: Understand estimating and rounding, absolute value, primes and greatest
common factor.
M.I.P.M.5: Understand the scientific notation.
M.I.P.M.6: Solve problems involving converting units of measurement.
Materials
iPad, earphone, monitor, speakers, and access to the Internet
Essential Questions
Why is it necessary to have different types of numbers in
mathematics?
How negative numbers are used in real life situations?
What are the benefits and drawbacks of estimating?
Why is using the scientific notation important?
Focus
Questions
Does the student know the real number system and its properties?
Can the student add, subtract, multiply and divide rational numbers?
Can the student solve multi-step arithmetic problems using rational
numbers?

145
Can the student solve problems involving integer exponents, roots,
and radicals?
Does the student understand estimating and rounding, absolute
vale, primes and greatest common factor as well as the scientific
notation?
Can the student solve problems that involve converting units of
measurement?
Learning Goals and Objectives
Upon the completion of this module, the student will know/understand:
The real number system, and be able to add, subtract, multiply
and divide rational numbers.
Estimating and rounding, absolute vale, primes and greatest
common factor as well as the scientific notation.
Upon the completion of this module, the student will be able to:
Solve multi-step arithmetic problems using rational numbers.
Solve problems involving integer exponents, roots, and radicals.
Solve problems involving converting units of measurement.
Schedule Week 1: Complete sections 1.1-1.3
Week 2: Review; Quiz 1 (sections 1.1-1.3); complete sections 1.4-
1.5
Week 3 ½: Complete sections 1.6, 1.7; review, Quiz 2 (sections 1.4-
1.7)
Learning Activities & Assignments and Assessments
Week 1
I. Bellwork
Ask students if they have any questions about the previous
lessons and/or the assigned study at home.
Have students work on 2-3 selected questions and exercises
from the related to the Focused Questions and Module I
(Sections 1.1-1.3). Have students work on them individually,
and then discuss in groups (of two or three) or with the tutor
and/or the teacher.

146
If necessary, show one or two of the related video clips and
discuss in class.
II. Activities/Assignments
(at Home): Assign students to study selected sections of
Module I (on eBackpack) at home, and use the related
resources identified in each Section. Encourage students to
watch the related videos with their parents.
(in Class):
o Working solo or in groups (of two or three) and using
Module I, have students working on the selected (following)
sections from the available resources (textbooks, video
clips, etc.). Allow students to use the whiteboards if they so
desire.
o Teacher and/or students would select from the following
resources from the textbooks, video clips, websites, and
module contents:
Section 1.1
Module content: pp. 3-4
TXTBK I: pp. 11-14
TXTBK II: pp. 33-36, 39-40
Video clip: 1
Section 1.2
Module content: pp. 4-5
Video clips: 2, 3, and 4
Section 1.3
Module content: p. 5
Video clip: 5
o During this time, the teacher would observe students, ask
questions, and provides assistance as students work their
assigned activities.

147
o Have the tutor available during the class, so students would
have an extra help if they prefer and/or as the teacher
becomes occupied by other students.
o About 10 minutes before the bell, the teacher would be
providing a recap of what was studied as well sharing
observations and suggestions (if any). In addition, the
teacher will be reminding students about the next topic and
students’ assignment and activities at home referencing
related sections in Module I.
III. Assessment
Observation (formative, informal)
Performance task (formative, informal)
Demonstration (formative, informal)
Self- and peer-evaluation (formative, informal)
Week 2
I. Bellwork
Ask students if they have any questions about the previous
lessons and/or the assigned study at home.
Have students work on 2-3 selected questions and exercises
from the related to the Focused Questions and Module I
(Sections 1.1-1.3). Have students work on them individually,
and then discuss in groups (of two or three) or with the tutor
and/or the teacher.
If necessary, show one or two of the related video clips and
discuss in class.
II. Activities/Assignments
(at Home): Assign students to study selected sections of
Module I (on eBackpack) at home, and use the related
resources identified in each Section. Encourage students to
watch the related videos with their parents.
(in Class):

148
o Working solo or in groups (of two or three) and using
Module I, have students working on the selected (following)
sections from the available resources (textbooks, video
clips, etc.). Allow students to use the whiteboards if they so
desire.
o Teacher and/or students would select from the following
resources from the textbooks, video clips, websites, and
module contents:
Section 1.4
Module content: pp. 6-10
TXTBK II: pp. 24, 26-26
Video clips: 6, 7, 8, 9, 10, 11, 12, and 13
Section 1.5
Module content: p. 10
TXTBK II: p. 28
Video clips: 14, 15, and 16
o During this time, the teacher would observe students, ask
questions, and provides assistance as students work their
assigned activities.
o Have the tutor available during the class, so students would
have an extra help if they prefer and/or as the teacher
becomes occupied by other students.
o About 10 minutes before the bell, the teacher would be
providing a recap of what was studied as well sharing
observations and suggestions (if any). In addition, the
teacher will be reminding students about the next topic and
students’ assignment and activities at home referencing
related sections in Module I.
III. Assessment
Observation (formative, informal)
Performance task (formative, informal)

149
Demonstration (formative, informal)
Self- and peer-evaluation (formative, informal)
Quiz (formative, formal)
Week 3½
I. Bellwork
Ask students if they have any questions about the previous
lessons and/or the assigned study at home.
Have students work on 2-3 selected questions and exercises
from the related to the Focused Questions and Module I
(Sections 1.1-1.3). Have students work on them individually,
and then discuss in groups (of two or three) or with the tutor
and/or the teacher.
If necessary, show one or two of the related video clips and
discuss in class.
II. Activities/Assignments
(at Home): Assign students to study selected sections of
Module I (on eBackpack) at home, and use the related
resources identified in each Section. Encourage students to
watch the related videos with their parents.
(in Class):
o Working solo or in groups (of two or three) and using
Module I, have students working on the selected (following)
sections from the available resources (textbooks, video
clips, etc.). Allow students to use the whiteboards if they so
desire.
o Teacher and/or students would select from the following
resources from the textbooks, video clips, websites, and
module contents:
Section 1.6
Module content: pp. 10-13
TXTBK II: p. 23
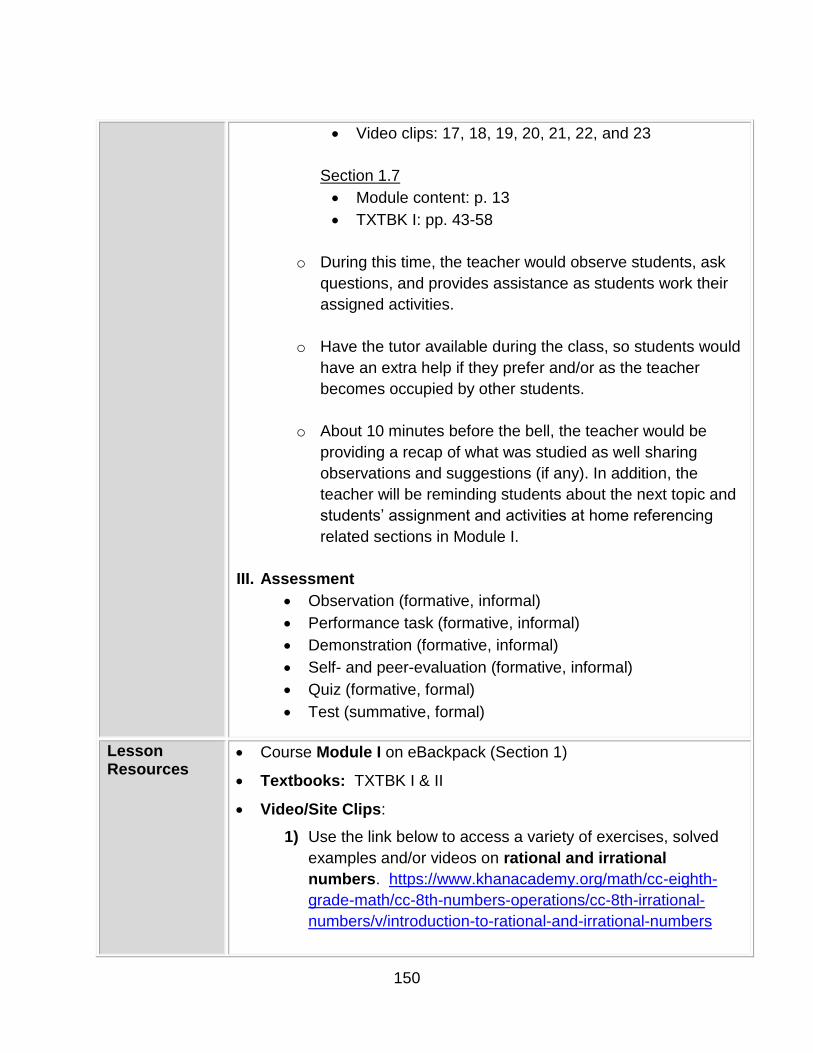
150
Video clips: 17, 18, 19, 20, 21, 22, and 23
Section 1.7
Module content: p. 13
TXTBK I: pp. 43-58
o During this time, the teacher would observe students, ask
questions, and provides assistance as students work their
assigned activities.
o Have the tutor available during the class, so students would
have an extra help if they prefer and/or as the teacher
becomes occupied by other students.
o About 10 minutes before the bell, the teacher would be
providing a recap of what was studied as well sharing
observations and suggestions (if any). In addition, the
teacher will be reminding students about the next topic and
students’ assignment and activities at home referencing
related sections in Module I.
III. Assessment
Observation (formative, informal)
Performance task (formative, informal)
Demonstration (formative, informal)
Self- and peer-evaluation (formative, informal)
Quiz (formative, formal)
Test (summative, formal)
Lesson Resources
Course Module I on eBackpack (Section 1)
Textbooks: TXTBK I & II
Video/Site Clips:
1) Use the link below to access a variety of exercises, solved
examples and/or videos on rational and irrational
numbers. https://www.khanacademy.org/math/cc-eighth-
grade-math/cc-8th-numbers-operations/cc-8th-irrational-
numbers/v/introduction-to-rational-and-irrational-numbers

151
2) This is site is an excellent site for rounding and estimating.
Look at “Rounding a whole numbers” and “Estimating a
Sum.” http://www.basic-mathematics.com/rounding-and-
estimating.html
3) This is an excellent video clip explaining rounding a whole
number (4:22 min.)- https://www.khanacademy.org/math/cc-
fourth-grade-math/cc-5th-place-value-rounding-topi/cc-4th-
rounding/v/rounding-whole-numbers-1
4) This is an excellent short video clip explaining rounding a
decimal number (1.26 min.)-
https://www.khanacademy.org/math/cc-fifth-grade-math/cc-
5th-place-value-decimals-top/cc-5th-rounding-
decimals/v/rounding-decimals
5) Use the link below to access a variety of exercises, solved
examples and/or videos on absolute value. Khan Academy
Website # 5
6) This is an introductory video on exponent (9:46 min.)-
http://www.bing.com/videos/search?q=exponents+khan+aca
demy&qpvt=exponents+khan+academy&FORM=VDRE#view
=detail&mid=50F2066405A7E6F7EC2B50F2066405A7E6F7
EC2B
7) Use the links below to access a variety of exercises, solved
examples and/or videos on exponents.
https://www.khanacademy.org/math/pre-algebra/exponents-
radicals/World-of-exponents
8) Use the links below to access a variety of exercises, solved
examples and/or videos on exponent properties.
https://www.khanacademy.org/math/pre-algebra/exponents-
radicals/exponent-properties/v/exponent-rules-part-1
9) Here is a video clip on understanding square root (1:21
min.)- https://www.khanacademy.org/math/pre-
algebra/exponents-radicals/radical-radicals/v/understanding-
square-roots

152
10) This is an excellent video on simplifying square roots (5:35
min.)-
http://www.bing.com/videos/search?q=roots+khan+academy
&qpvt=roots+khan+academy&FORM=VDRE#view=detail&mi
d=FC7C1460C2633DA5CA0CFC7C1460C2633DA5CA0C
11) This is an excellent video on approximating square roots
(7:11 min.)-
http://www.bing.com/videos/search?q=roots+khan+academy
&qpvt=roots+khan+academy&FORM=VDRE#view=detail&mi
d=98E3DE3EA55841C07F8D98E3DE3EA55841C07F8D
12) This is a video clip on simplifying radicals (9:44 min.)-
http://www.bing.com/videos/search?q=radicals+khan+acade
my&qpvt=radicals+khan+academy&FORM=VDRE#view=det
ail&mid=5E6101527BF2E2909B045E6101527BF2E2909B04
13) Use the links below to access a variety of exercises, solved
examples and/or videos on roots and radicals.
https://www.khanacademy.org/math/pre-algebra/rates-and-
ratios/ratios_and_proportions/v/introduction-to-ratios-new-hd-
version
14) This is an excellent video on scientism notation (4:11 min.)-
https://www.khanacademy.org/math/cc-eighth-grade-
math/cc-8th-numbers-operations/cc-8th-scientific-
notation/v/scientific-notation-i
15) This video explores scientific notation more
comprehensively with more examples (11:26 min.)-
https://www.khanacademy.org/math/cc-eighth-grade-
math/cc-8th-numbers-operations/cc-8th-scientific-
notation/v/scientific-notation
16) Use the links below to access a variety of exercises, solved
examples and/or videos on scientific notation.
https://www.khanacademy.org/math/pre-algebra/exponents-
radicals/scientific-notation/v/scientific-notation-old
17) This is an introductory video on greatest common factor
(2:24 min.)-

153
http://www.bing.com/videos/search?q=greatest+common+fac
tor+khan+academy&qs=n&form=QBVR&pq=greatest+comm
on+factor+khan+academy&sc=2-35&sp=-
1&sk=#view=detail&mid=BC615A195C615372E0B9BC615A
195C615372E0B9
18) Here is another example/video (6:19 min.)-
https://www.khanacademy.org/math/cc-sixth-grade-math/cc-
6th-factors-and-multiples/cc-6th-gcf/v/greatest-common-
divisor
19) Here is a video of a few sample problems (6:49 min.)-
https://www.khanacademy.org/math/pre-algebra/factors-
multiples/greatest_common_divisor/v/greatest-common-
divisor-factor-exercise#!
20) Another good video clip on the greatest common factor
(6:19 min.)- http://www.youtube.com/watch?v=jFd-6EPfnec
21) Use the links below to access a variety of exercises, solved
examples and/or videos on prime and composite numbers.
https://www.khanacademy.org/math/pre-algebra/factors-
multiples/prime_numbers/v/prime-numbers
22) Use the links below to access a variety of exercises, solved
examples and/or videos on prime factorization.
https://www.khanacademy.org/math/pre-algebra/factors-
multiples/prime_factorization/v/prime-factorization
23) Use the links below to access a variety of exercises, solved
examples and/or videos on greatest common factor.
https://www.khanacademy.org/math/pre-algebra/factors-
multiples/greatest_common_divisor/v/greatest-common-
divisor-factor-exercise
Website(s): none
Others: none
References Basic-Mathematics (2008). Retrieved from http://www.basic-
mathematics.com/.

154
Source: Author’s produced content using template generated by Gunter (2010) and in-text by Gunter and Gunter (2015)
Table 24 – Lesson Plan 2 of Module I
Khan Academy (2014, May 8). Retrieved from
https://www.khanacademy.org/.
Rappaport, J. (2003). Algebra survival guide. Santa Fe, New Mexico:
Singing Turtle Press.
Rappaport J. (2013). Algebra survival guide workbook. Santa Fe, New
Mexico: Singing Turtle Press.
Spectrum (2007). Spectrum math – grade 8. Greensboro, NC: Carson-
Dellosa.
Spectrum (2011). Spectrum algebra – grades 6-8. Greensboro, NC:
Carson-Dellosa.
Subject Mathematics Week/Day 1 Week
Module I Numbers, Properties and Operations Grade 9-10
Topic Lesson 2: Ratio and Proportion Author Kami Borhon
Lesson Summary
Ratio and proportional relationships and their applications
Benchmarks
M.I.P.M.7: Understand ratio and use its applications.
M.I.P.M.8: Analyze proportional relationships and use their applications.
M.I.P.M.9: Solve problems involving percentage and interest.
Materials
iPad, earphone, monitor, speakers, and access to the Internet
Essential Question(s)
When is using proportions necessary? Why?
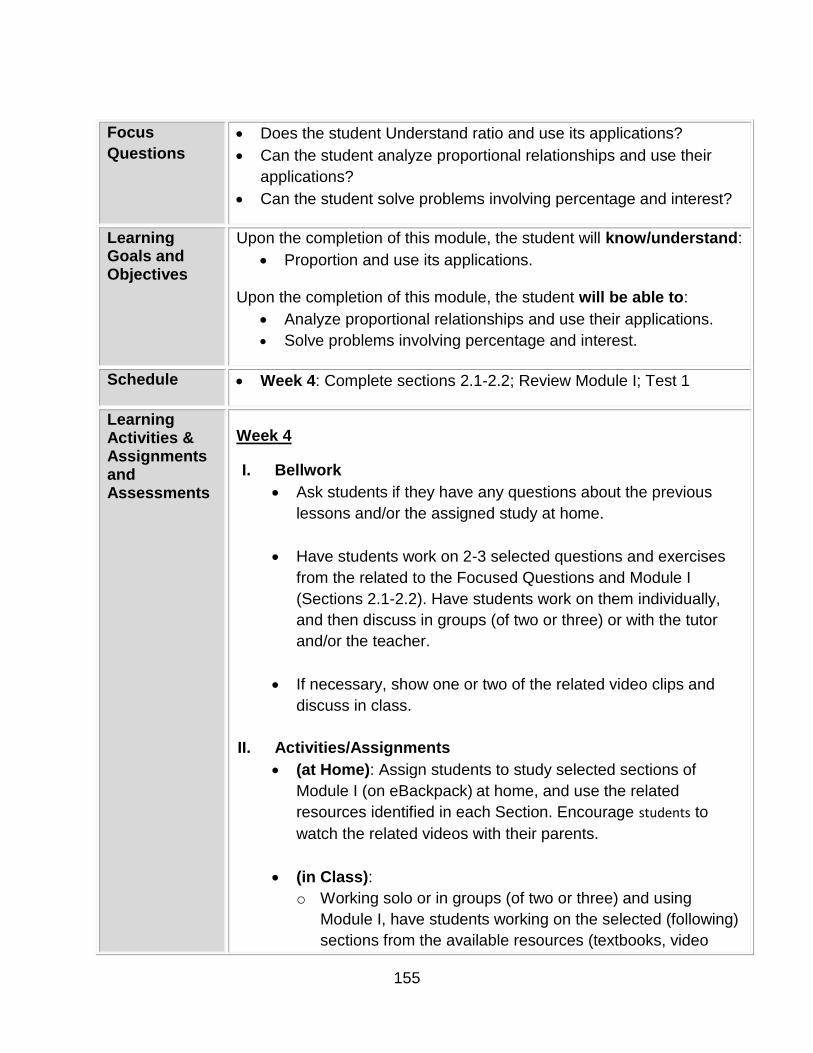
155
Focus
Questions
Does the student Understand ratio and use its applications?
Can the student analyze proportional relationships and use their
applications?
Can the student solve problems involving percentage and interest?
Learning Goals and Objectives
Upon the completion of this module, the student will know/understand:
Proportion and use its applications.
Upon the completion of this module, the student will be able to:
Analyze proportional relationships and use their applications.
Solve problems involving percentage and interest.
Schedule Week 4: Complete sections 2.1-2.2; Review Module I; Test 1
Learning Activities & Assignments and Assessments
Week 4
I. Bellwork
Ask students if they have any questions about the previous
lessons and/or the assigned study at home.
Have students work on 2-3 selected questions and exercises
from the related to the Focused Questions and Module I
(Sections 2.1-2.2). Have students work on them individually,
and then discuss in groups (of two or three) or with the tutor
and/or the teacher.
If necessary, show one or two of the related video clips and
discuss in class.
II. Activities/Assignments
(at Home): Assign students to study selected sections of
Module I (on eBackpack) at home, and use the related
resources identified in each Section. Encourage students to
watch the related videos with their parents.
(in Class):
o Working solo or in groups (of two or three) and using
Module I, have students working on the selected (following)
sections from the available resources (textbooks, video
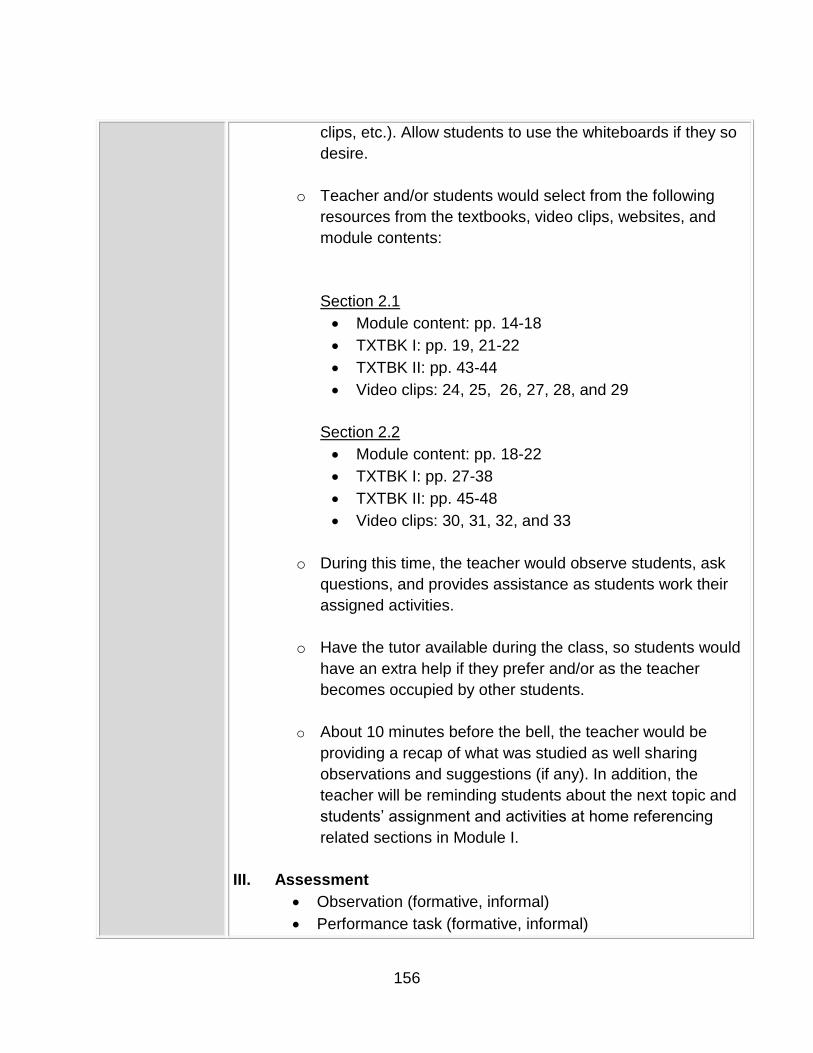
156
clips, etc.). Allow students to use the whiteboards if they so
desire.
o Teacher and/or students would select from the following
resources from the textbooks, video clips, websites, and
module contents:
Section 2.1
Module content: pp. 14-18
TXTBK I: pp. 19, 21-22
TXTBK II: pp. 43-44
Video clips: 24, 25, 26, 27, 28, and 29
Section 2.2
Module content: pp. 18-22
TXTBK I: pp. 27-38
TXTBK II: pp. 45-48
Video clips: 30, 31, 32, and 33
o During this time, the teacher would observe students, ask
questions, and provides assistance as students work their
assigned activities.
o Have the tutor available during the class, so students would
have an extra help if they prefer and/or as the teacher
becomes occupied by other students.
o About 10 minutes before the bell, the teacher would be
providing a recap of what was studied as well sharing
observations and suggestions (if any). In addition, the
teacher will be reminding students about the next topic and
students’ assignment and activities at home referencing
related sections in Module I.
III. Assessment
Observation (formative, informal)
Performance task (formative, informal)

157
Demonstration (formative, informal)
Self- and peer-evaluation (formative, informal)
Test (summative, formal)
Lesson Resources
Course Module I on eBackpack (Section 2)
Textbooks: TXTBK I & II
Videos Clips:
24) This is an introductory video on ratio (7:27 min.)-
http://www.youtube.com/watch?v=UsPmg_Ne1po
25) This is an introductory video on proportion (1.24 min.)-
http://www.youtube.com/watch?v=V3FvaClh6LY
26) This is a video on ratios as fractions (1:18 min.)-
http://www.youtube.com/watch?v=JWmCiZwoyMs
27) This is a video clip on a word problem with respect to ratio
(2:03 min.)- http://www.youtube.com/watch?v=Vx5uoZAkxng
28) This is good video on finding an unknown in a proportion
(7:19 min.)-
http://www.youtube.com/watch?v=GO5ajwbFqVQ
29) Use the links below to access a variety of exercises, solved
examples and/or videos on greatest common factor.
https://www.khanacademy.org/math/pre-algebra/rates-and-
ratios/ratios_and_proportions/v/introduction-to-ratios-new-hd-
version
30) This is a link on the meaning of percent (2:21 min.):
https://www.khanacademy.org/math/arithmetic/decimals/perc
ent_tutorial/v/describing-the-meaning-of-percent
31) This link provides extensive explanation on how to take
percentages: (9:55 min.):
https://www.khanacademy.org/math/algebra/solving-linear-
equations-and-inequalities/old-school-equations/v/taking-
percentages#!

158
Source: Author’s produced content using template generated by Gunter (2010) and in-text by Gunter and Gunter (2015)
32) This site provides an excellent explanation for simple and
compound interest with examples: http://www.basic-
mathematics.com/simple-vs-compound-interest.html
33) Here is the link to excellent video on introduction to
interest (9:55 min.):
http://www.bing.com/videos/search?q=simple+and+compoun
d+interest+khan+academy&qpvt=Simple+and+compound+int
erest+khan+academy&FORM=VDRE#view=detail&mid=0A0
06C544C0C525AA7320A006C544C0C525AA732
Website(s): none
Others: none
References Basic-Mathematics (2008). Retrieved from http://www.basic-
mathematics.com/.
Khan Academy (2014, May 8). Retrieved from
https://www.khanacademy.org/.
Rappaport, J. (2003). Algebra survival guide. Santa Fe, New Mexico:
Singing Turtle Press.
Rappaport J. (2013). Algebra survival guide workbook. Santa Fe, New
Mexico: Singing Turtle Press.
Spectrum (2007). Spectrum math – grade 8. Greensboro, NC: Carson-
Dellosa.
Spectrum (2011). Spectrum algebra – grades 6-8. Greensboro, NC:
Carson-Dellosa.

159
APPENDIX C: SAMPLE ASSESSMENT

160
Assessment — Module I
Grade: 9-10
Age: 14/15-yearolds
Course: Mathematics Intervention
Program
Unit of Instruction: Module I—Numbers, Properties and Operations
Assessment Types: Students will be assessed using a criterion-referenced test
(CRT) including short answer and performance-based items.
Two Quizzes (formal, formative)
One Test (formal, summative)
Assessment Purpose: To assess students’ mastery in using numbers and their
properties and related operations in solving real work
problems as determined by the corresponding MIP
Standards. The result of this test will also be used to
determine students’ readiness for the assessment of the
corresponding section in the ACT Aspire test. Moreover,
aspects of the test results will be used in preparations
and/or modification of the lesson plans corresponding
to the remaining modules in the course.
Benchmarks: The related MIP Standards relevant to this instructional unit
assessment are as follow:
M.I.P.M.1: Know the real number system, and be able to
add, subtract, multiply and divide rational numbers.
M.I.P.M.2: Solve multi-step arithmetic problems using
rational numbers.
M.I.P.M.3: Solve problems involving integer exponents,
roots, and radicals.
M.I.P.M.4: Understand estimating and rounding, absolute
value, primes and greatest common factor.
M.I.P.M.5: Understand the scientific notation.
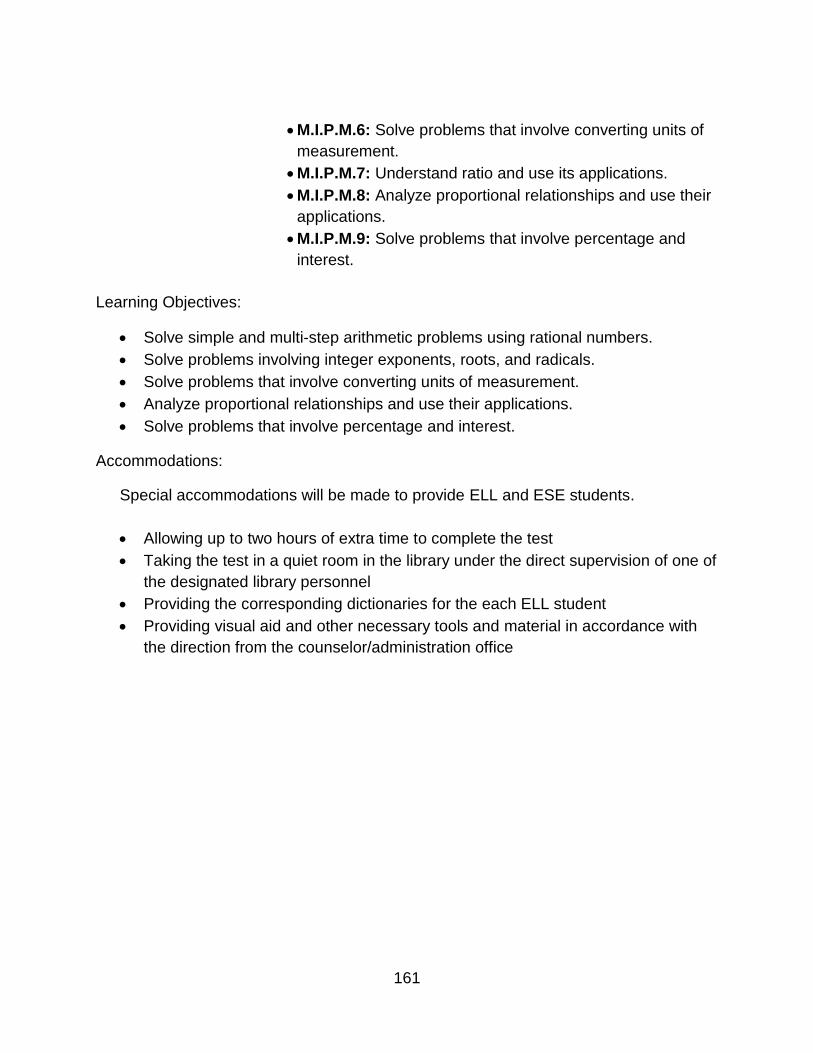
161
M.I.P.M.6: Solve problems that involve converting units of
measurement.
M.I.P.M.7: Understand ratio and use its applications.
M.I.P.M.8: Analyze proportional relationships and use their
applications.
M.I.P.M.9: Solve problems that involve percentage and
interest.
Learning Objectives:
Solve simple and multi-step arithmetic problems using rational numbers.
Solve problems involving integer exponents, roots, and radicals.
Solve problems that involve converting units of measurement.
Analyze proportional relationships and use their applications.
Solve problems that involve percentage and interest.
Accommodations:
Special accommodations will be made to provide ELL and ESE students.
Allowing up to two hours of extra time to complete the test
Taking the test in a quiet room in the library under the direct supervision of one of
the designated library personnel
Providing the corresponding dictionaries for the each ELL student
Providing visual aid and other necessary tools and material in accordance with
the direction from the counselor/administration office
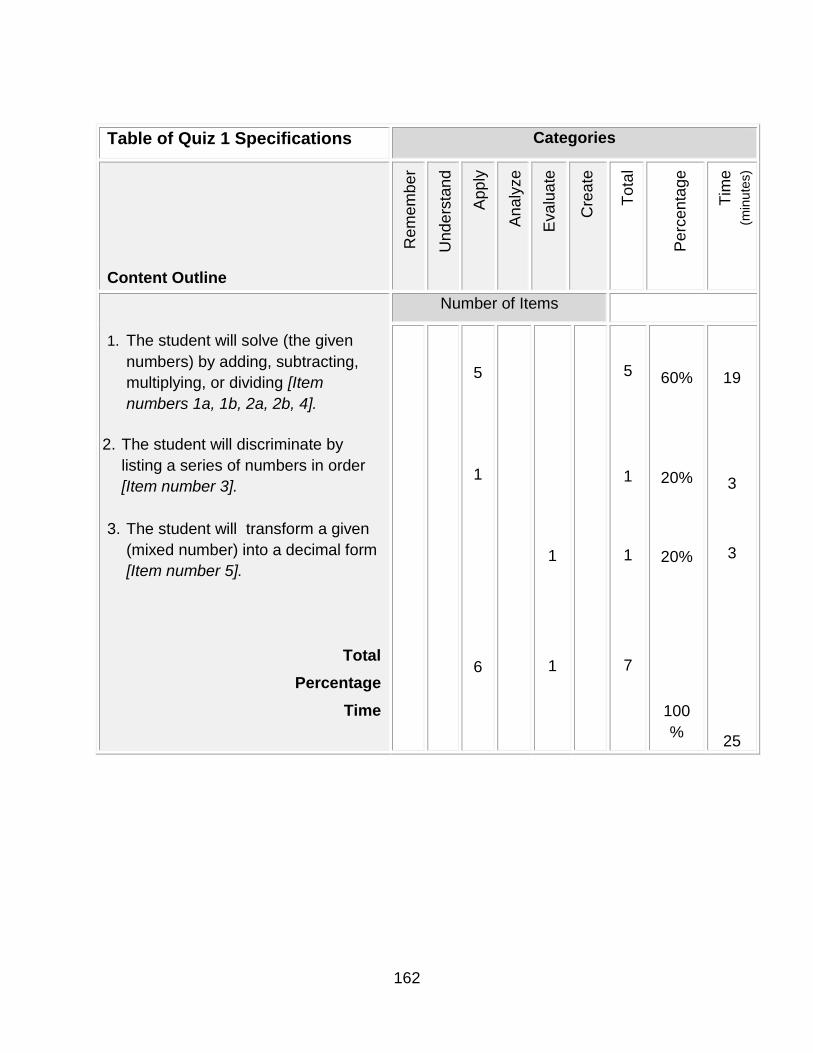
162
Table of Quiz 1 Specifications Categories
Content Outline
Rem
em
be
r U
nd
ers
tan
d
Ap
ply
An
aly
ze
Eva
lua
te
Cre
ate
To
tal
Pe
rcen
tag
e
Tim
e
(min
ute
s)
1. The student will solve (the given
numbers) by adding, subtracting,
multiplying, or dividing [Item
numbers 1a, 1b, 2a, 2b, 4].
2. The student will discriminate by
listing a series of numbers in order
[Item number 3].
3. The student will transform a given
(mixed number) into a decimal form
[Item number 5].
Total
Percentage
Time
Number of Items
5
1
1
6
1
1
1
5
5
1
1
1
1
7
6
60%
20%
20%
100
%
1
19
3
3
3
3
225
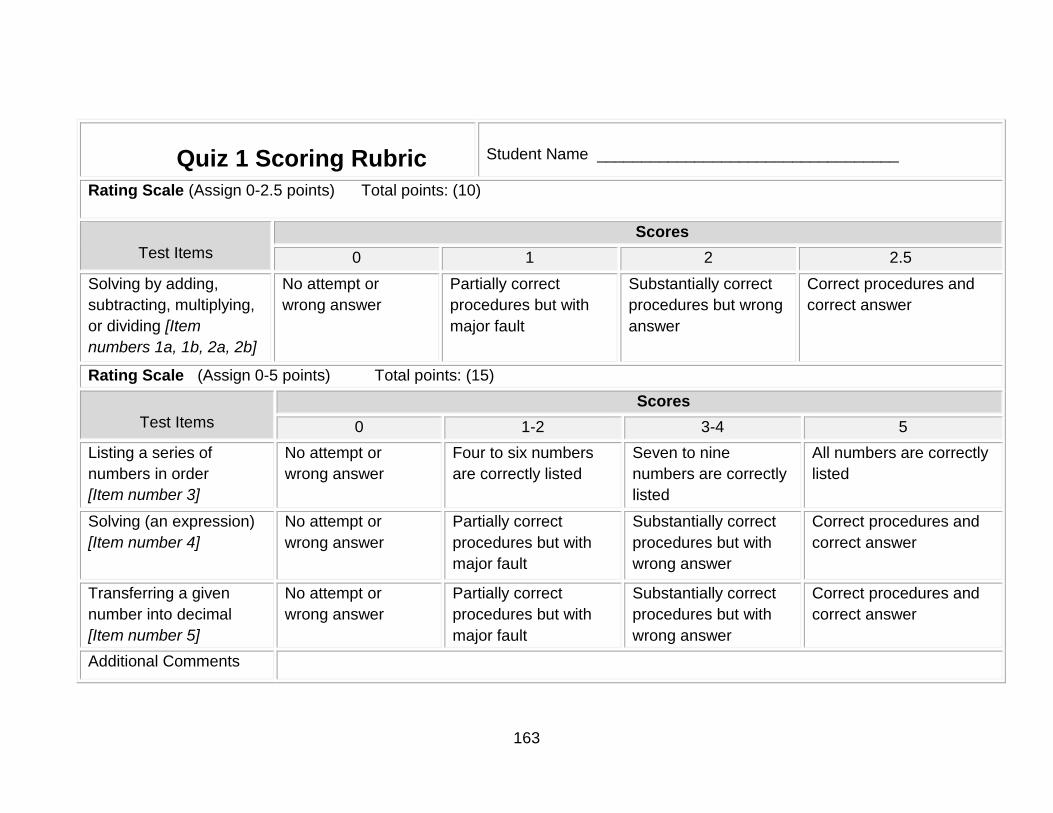
163
Quiz 1 Scoring Rubric
Student Name __________________________________
Rating Scale (Assign 0-2.5 points) Total points: (10)
Test Items
Scores
0 1 2 2.5
Solving by adding,
subtracting, multiplying,
or dividing [Item
numbers 1a, 1b, 2a, 2b]
No attempt or
wrong answer
Partially correct
procedures but with
major fault
Substantially correct
procedures but wrong
answer
Correct procedures and
correct answer
Rating Scale (Assign 0-5 points) Total points: (15)
Test Items
Scores
0 1-2 3-4 5
Listing a series of
numbers in order
[Item number 3]
No attempt or
wrong answer
Four to six numbers
are correctly listed
Seven to nine
numbers are correctly
listed
All numbers are correctly
listed
Solving (an expression)
[Item number 4]
No attempt or
wrong answer
Partially correct
procedures but with
major fault
Substantially correct
procedures but with
wrong answer
Correct procedures and
correct answer
Transferring a given
number into decimal
[Item number 5]
No attempt or
wrong answer
Partially correct
procedures but with
major fault
Substantially correct
procedures but with
wrong answer
Correct procedures and
correct answer
Additional Comments
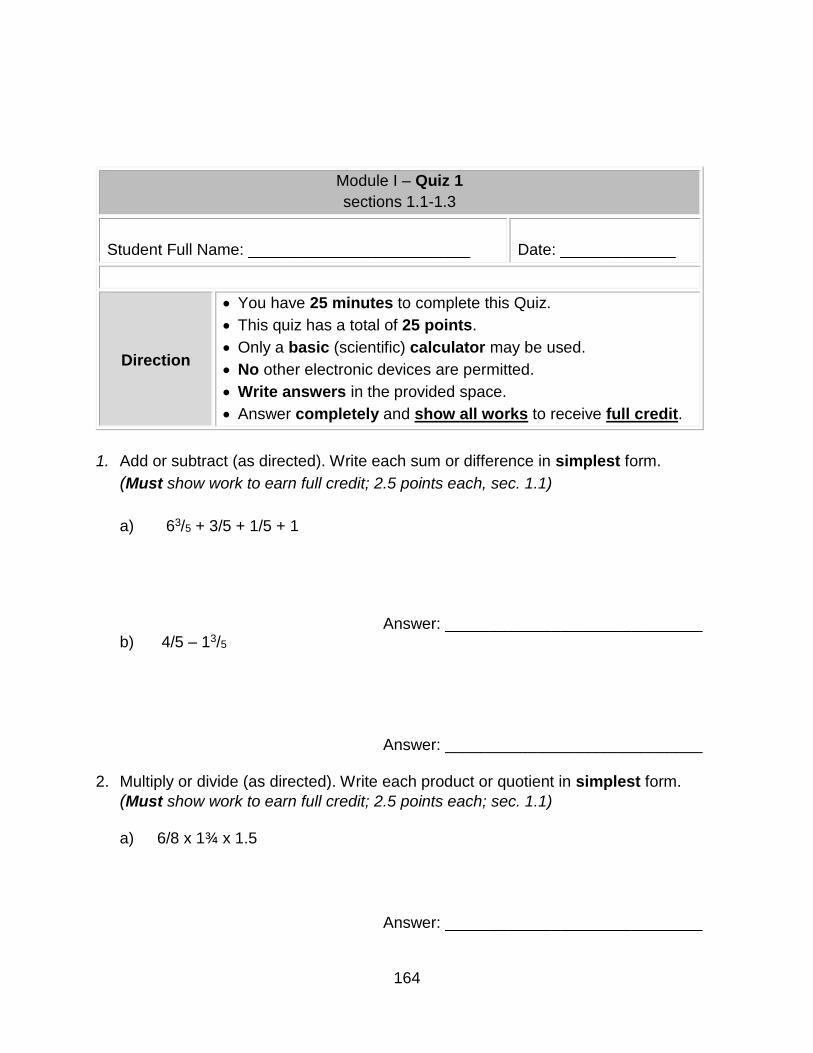
164
1. Add or subtract (as directed). Write each sum or difference in simplest form.
(Must show work to earn full credit; 2.5 points each, sec. 1.1)
a) 63/5 + 3/5 + 1/5 + 1
Answer: _____________________________ b) 4/5 – 13/5
Answer: _____________________________
2. Multiply or divide (as directed). Write each product or quotient in simplest form.
(Must show work to earn full credit; 2.5 points each; sec. 1.1) a) 6/8 x 1¾ x 1.5
Answer: _____________________________
Module I – Quiz 1
sections 1.1-1.3
Student Full Name: _________________________
Date: _____________
Direction
You have 25 minutes to complete this Quiz.
This quiz has a total of 25 points.
Only a basic (scientific) calculator may be used.
No other electronic devices are permitted.
Write answers in the provided space.
Answer completely and show all works to receive full credit.

165
b) 3½ ÷ 0.5
Answer: _____________________________
3. List the following in order from largest to smallest.
(Must show work to earn full credit; 5 points; sec. 1.3)
–4 , |0| , –23, 21/5 , –0.01 , –5 , 1.3 , |–0.5| , –0.1 , –5.01
Answer: _____________________________
4. Evaluate the following. (Must show work to earn full credit; 5 points; sec. 1.3)
–12 – (–2)2 – |1–2|
Answer: _____________________________
5. Change 51/5 to hundredth. (Must show work to earn full credit; 5 points; sec. 1.1)
Answer: _____________________________
use the space below as scratch paper

166
Table of Quiz 2 Specifications Categories
Content Outline
Rem
em
be
r U
nd
ers
tan
d
Ap
ply
An
aly
ze
Eva
lua
te
Cre
ate
To
tal
Pe
rcen
tag
e
Tim
e
(min
ute
s)
1. The student will evaluate (an
expression).
[Item numbers 1a, 1b, 1c, 1d]
2. The student will rewrite a given
number in a specific format.
[Item numbers 2a, 2b]
3. Given a series of numbers, the
student will determine their greatest
common factor.
[Item numbers 3a, 3b]
4. The student will solve a problem.
[Item numbers 4, 5]
Total
Percentage
Time
Number of Items
2
2
2
2
4
4
2
2
4
2
2
2
1
1
10
3
33%
1
17%
1
17%
3
33%
100
%
20
5
5
8
12
4
45

167
Quiz 2 Scoring Rubric
Student Name __________________________________
Rating Scale (Assign 0-2.5 points) Total points: (20)
Test Items
Scores
0 1 2 2.5
Evaluating (an
expression)
[Item numbers, 1a, 1b,
1c, 1d]
No attempt or
wrong answer
Partially correct
procedures but with
major fault
Substantially correct
procedures but with
wrong answer
Correct procedures and
correct answer
Transform a given
number in a scientific
notation
[Item numbers 2a, 2b]
No attempt or
wrong answer
Partially correct
procedures but wrong
answer
--
Correct answer
Determining the greatest
common factor for a
given list of numbers
[Item numbers 3a, 3b]
No attempt or
wrong answer
Partially correct
procedures but with
major fault
Substantially correct
procedures but with
wrong answer
Correct procedures and
correct answer
Rating Scale (Assign 0-5 points) Total points: (10)
Test Items
Scores
0 1-2 3-4 5
Solving a problem
[Item numbers 4, 5]
No attempt or
wrong answer
Partially correct
procedures but with
major fault
Substantially correct
procedures but with
wrong answer
Correct procedures and
correct answer
Additional Comments
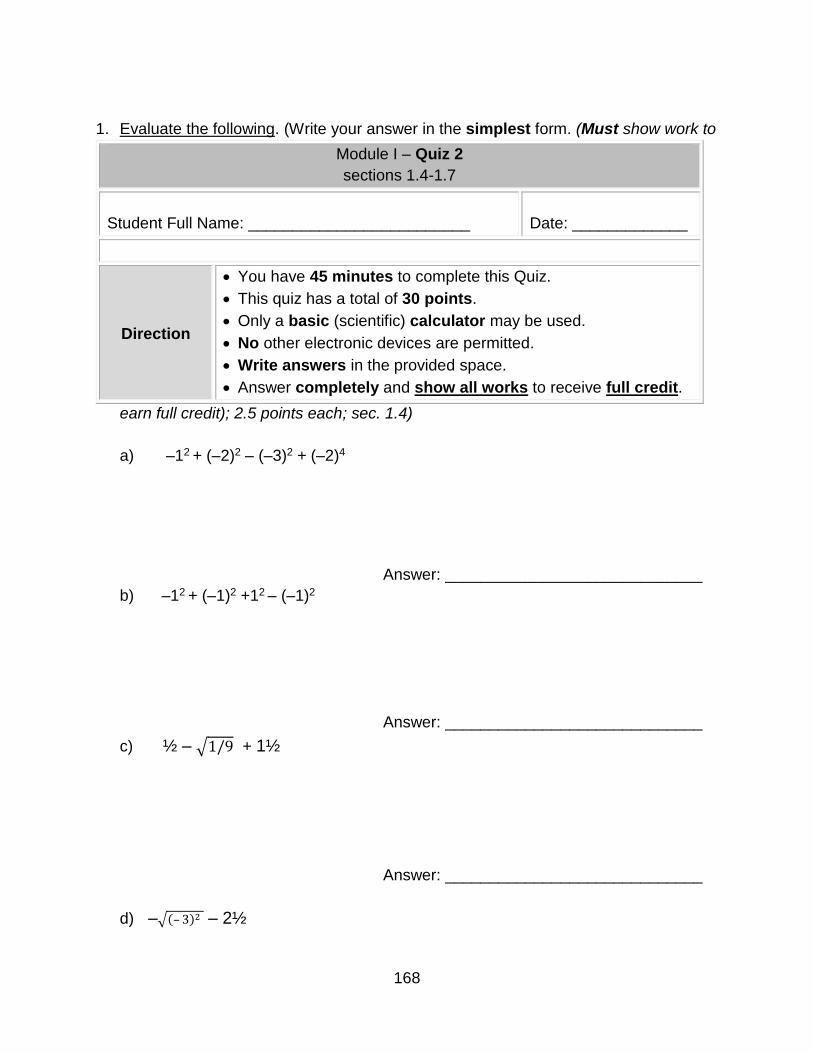
168
1. Evaluate the following. (Write your answer in the simplest form. (Must show work to
earn full credit); 2.5 points each; sec. 1.4)
a) –12 + (–2)2 – (–3)2 + (–2)4
Answer: _____________________________
b) –12 + (–1)2 +12 – (–1)2
Answer: _____________________________
c) ½ – √1/9 + 1½
Answer: _____________________________
d) –√(– 3)2 – 2½
Module I – Quiz 2
sections 1.4-1.7
Student Full Name: _________________________
Date: _____________
Direction
You have 45 minutes to complete this Quiz.
This quiz has a total of 30 points.
Only a basic (scientific) calculator may be used.
No other electronic devices are permitted.
Write answers in the provided space.
Answer completely and show all works to receive full credit.

169
Answer: _____________________________
2. Write each number in scientific notation. (Must show work to earn full credit; 2.5
points each; sec. 1.5)
a) 0.00401
Answer: _____________________________
b) 19000000000
Answer: _____________________________
3. Fined the greatest common factor of the two numbers. (Must show work to earn
full credit; 2.5 points each; sec. 1.6)
a) 25 and 15
Answer: _____________________________
b) 18 and 24
Answer: _____________________________
4. A floor is 126 inches long. How many 1-foot tiles will be needed to cover the length?
(Must show work to earn full credit; 5 points; sec. 1.7)

170
Answer: _____________________________
5. Emily’s swim practice is 2 hours and 15 minutes. 1 hour 40 minutes have gone by.
How much practice time is left?
(Must show work to earn full credit; 5 points; sec. 1.7)
Answer: _____________________________
use the space below and back as scratch paper

171
Table of Test 1 Specifications Categories
Content Outline
Rem
em
be
r U
nd
ers
tan
d
Ap
ply
An
aly
ze
Eva
lua
te
Cre
ate
To
tal
Pe
rcen
tag
e
Tim
e
(min
ute
s)
The student will discriminate by listing
a series of numbers in specific order.
[Item numbers 1, 2]
The student will select from a series of
numbers in specific order.
[Item number 3]
The student will evaluate (an
expression).
[Item numbers 4, 5, 6]
The student will rewrite a given number
in a specific format.
[Item numbers 7, 8]
Given a series of numbers, the student
will determine their greatest common
factor.
[Item numbers 9, 10]
The student will solve a problem.
[Item numbers 11, 12, 13, 14, 15]
Total
Percentage
Number of Items
2
2
2
2
5
5
5
1
1
3
3
2
2
2
2
2
2
2
2
2
1
3
5
2
2
2
2
5
5
1
15
113%
7
7%
2
20%
13%
1
13%
33%
8
8
3
3
1
12
1
5
7
7
30

172
Time
4
1
100
%
65
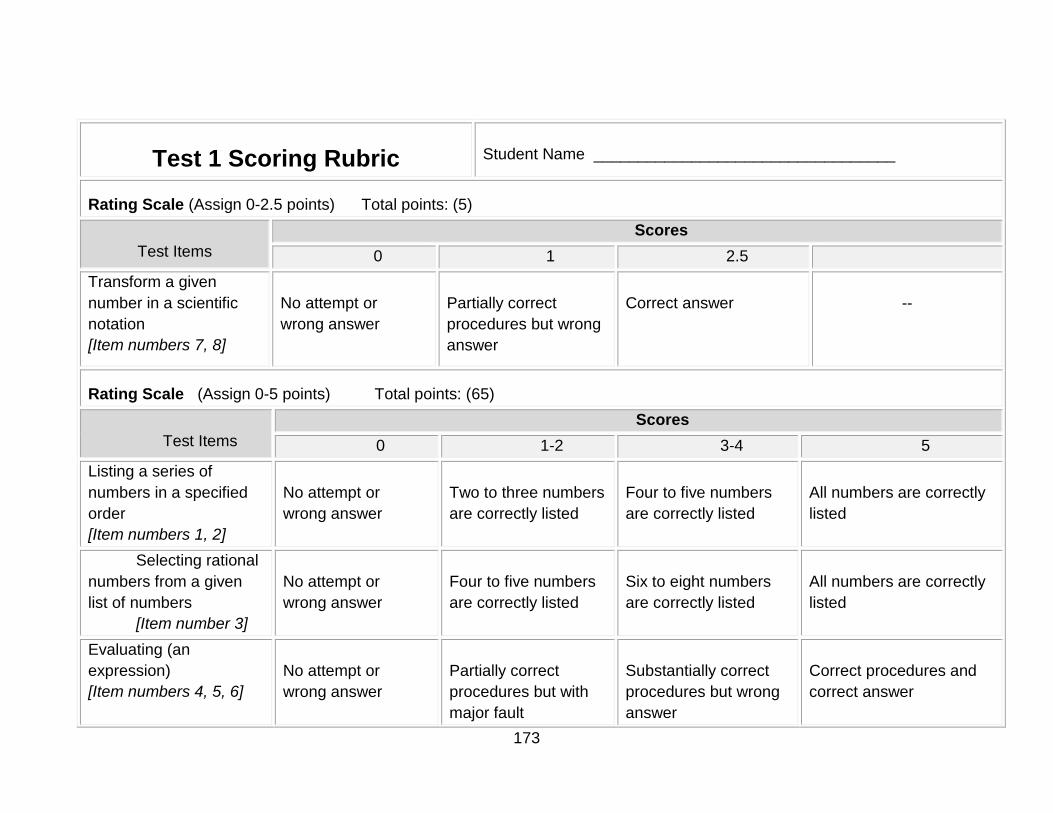
173
Test 1 Scoring Rubric
Student Name __________________________________
Rating Scale (Assign 0-2.5 points) Total points: (5)
Test Items
Scores
0 1 2.5
Transform a given
number in a scientific
notation
[Item numbers 7, 8]
No attempt or
wrong answer
Partially correct
procedures but wrong
answer
Correct answer
--
Rating Scale (Assign 0-5 points) Total points: (65)
Test Items
Scores
0 1-2 3-4 5
Listing a series of
numbers in a specified
order
[Item numbers 1, 2]
No attempt or
wrong answer
Two to three numbers
are correctly listed
Four to five numbers
are correctly listed
All numbers are correctly
listed
Selecting rational
numbers from a given
list of numbers
[Item number 3]
No attempt or
wrong answer
Four to five numbers
are correctly listed
Six to eight numbers
are correctly listed
All numbers are correctly
listed
Evaluating (an
expression)
[Item numbers 4, 5, 6]
No attempt or
wrong answer
Partially correct
procedures but with
major fault
Substantially correct
procedures but wrong
answer
Correct procedures and
correct answer
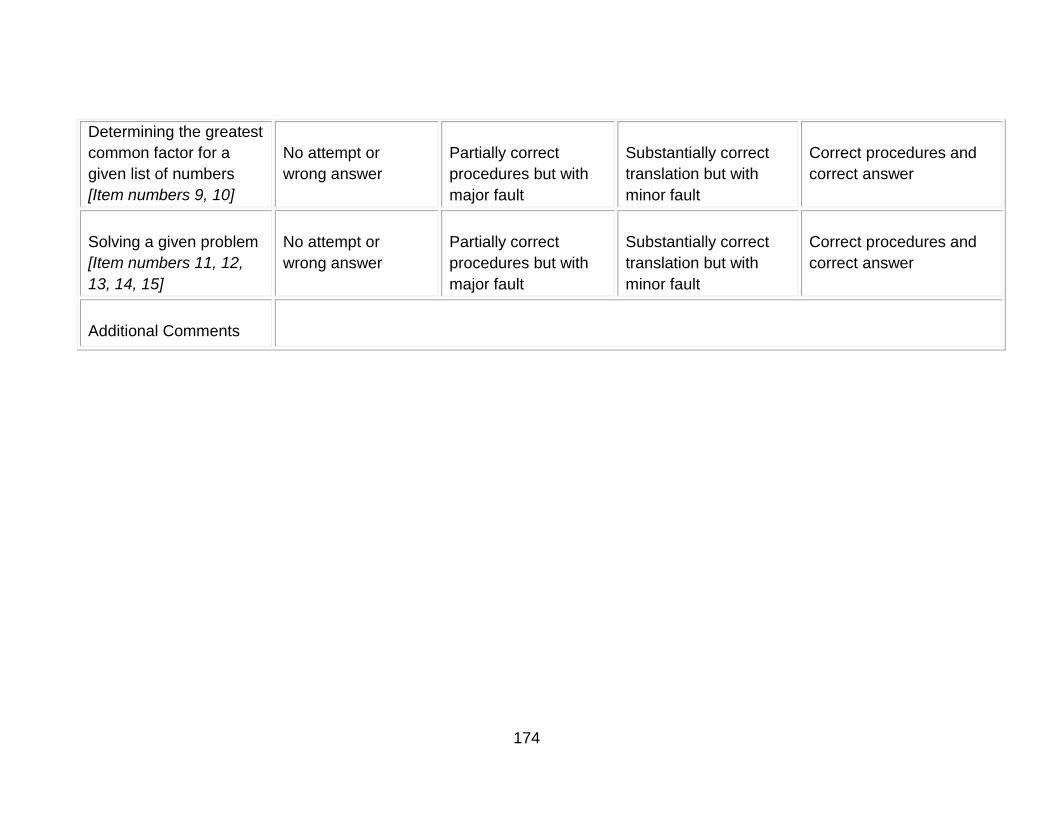
174
Determining the greatest
common factor for a
given list of numbers
[Item numbers 9, 10]
No attempt or
wrong answer
Partially correct
procedures but with
major fault
Substantially correct
translation but with
minor fault
Correct procedures and
correct answer
Solving a given problem
[Item numbers 11, 12,
13, 14, 15]
No attempt or
wrong answer
Partially correct
procedures but with
major fault
Substantially correct
translation but with
minor fault
Correct procedures and
correct answer
Additional Comments

175
1. List the following in order from smallest to largest.
(5 points; sec. 1.3)
|5| , |9–7| , |5–15| , |0| , |–3| , – |0 – 2|
Answer: _____________________________
2. List the following in order from largest to smallest. (5 points, sec. 1.1)
–4 , 0 , –2 , –5 , 1.3 , –0.5 , –0.1
Answer: _____________________________
3. Select all rational numbers below. (5 points, sec. 1.1)
0 , –1.25 , √8 , √4 , 36/4 , ½ , 0.1 , –23 , 2
Answer: _____________________________
Module I
Test 1
Student Full Name: _________________________
Date: _____________
Direction
You have 65 minutes to complete this test.
This quiz has a total of 70 points.
Only a basic (scientific) calculator may be used.
No other electronic devices are permitted.
Write answers in the provided space.
Answer completely and show all works to receive full credit.

176
For questions 4-6, Evaluate. (Must show work to earn full credit; 5 points each)
4. –32 + (–3)2 (sec. 1.4)
Answer: _____________________________
5. –¼ –¾ –½ –1.5 –0.5 (answer must be in fraction/mixed numeral; sec. 1.1)
Answer: _____________________________
6. √49/36 + 4/3 + 1½ (answer must be in fraction and in lowest term; sec. 1.4)
Answer: _____________________________
For questions 7-8, write each number in scientific notation. (2.5 points each, sec. 1.5)
7. 0.00013
Answer: _____________________________
8. 20300000
Answer: _____________________________

177
For questions 9-10, fined the greatest common factor of the two numbers.
(Must show work to earn full credit; 5 points each, sec. 1.7)
9. 14 and 21
Answer: _____________________________
10. 15 and 62
Answer: _____________________________
11. Gabby got a loan for 1½ years. The interest rate was 5%. She paid interest of $450. How much was the principal? (Must show work to earn full credit; 5 points, sec. 2.2)
Answer: _____________________________
12. All video games are on 15% off. If a video game originally cost $49, how much does it cost now? (Must show work to earn full credit; 5 points, sec. 2.2)
Answer: _____________________________
13. Marvin biked 7 miles in 25 minutes. At that rate, how far will he bike in 45 minutes? (Must show work to earn full credit; 5 points, sec. 2.1)
Answer: _____________________________
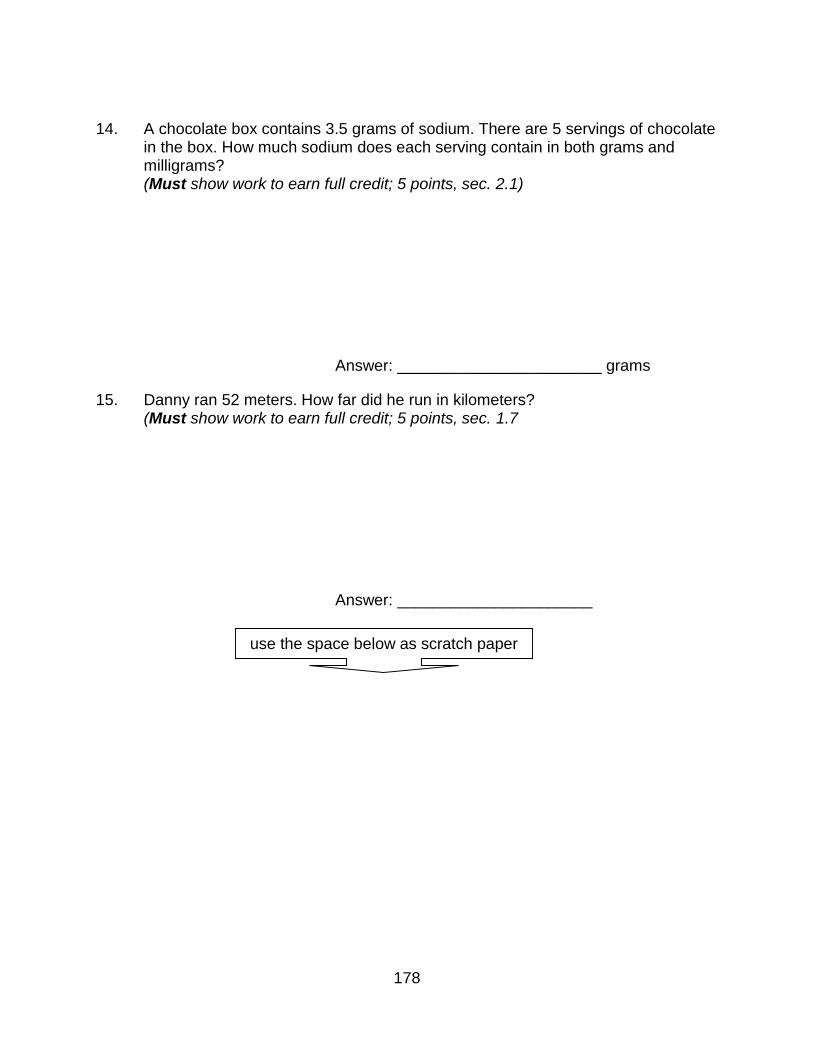
178
14. A chocolate box contains 3.5 grams of sodium. There are 5 servings of chocolate in the box. How much sodium does each serving contain in both grams and milligrams? (Must show work to earn full credit; 5 points, sec. 2.1)
Answer: _______________________ grams
15. Danny ran 52 meters. How far did he run in kilometers? (Must show work to earn full credit; 5 points, sec. 1.7
Answer: ______________________
use the space below as scratch paper

179
APPENDIX D: SAMPLE MODULE

180
Mathematics Intervention Program (MIP) Kami Borhon
Module I: Numbers, Properties and Operations
Objectives and Outcomes:
In this module, we will explore the world of real numbers; study various
operations involving rational numbers, study concepts such as exponents,
roots, radicals, estimating and rounding, converting units of measurement,
and more. In addition, we will study ratio and proportion and their
applications. After completing this module, you should know/understand
and be able to do:
The real number system and their characteristics and relationship; and
Estimating, scientific notation, rounding, and primes and greatest
common factor.
Solve simple and multi-step arithmetic problems using rational numbers.
Solve problems involving integer exponents, roots, and radicals.
Solve problems involving converting units of measurement.
Analyze proportional relationships and use their applications.
Solve problems involving percentage and interest.
This is important because such knowledge and understanding of
mathematics would enable you to develop the basic foundation necessary
for courses such as Algebra 1 and 2, Geometry and various other (higher)
mathematics courses.
Section 1.1
Section 1.6
Section 1.2
Section 1.3
Section 1.5
Section 1.7
Section 2.2
Section 2.1
Section 1.4
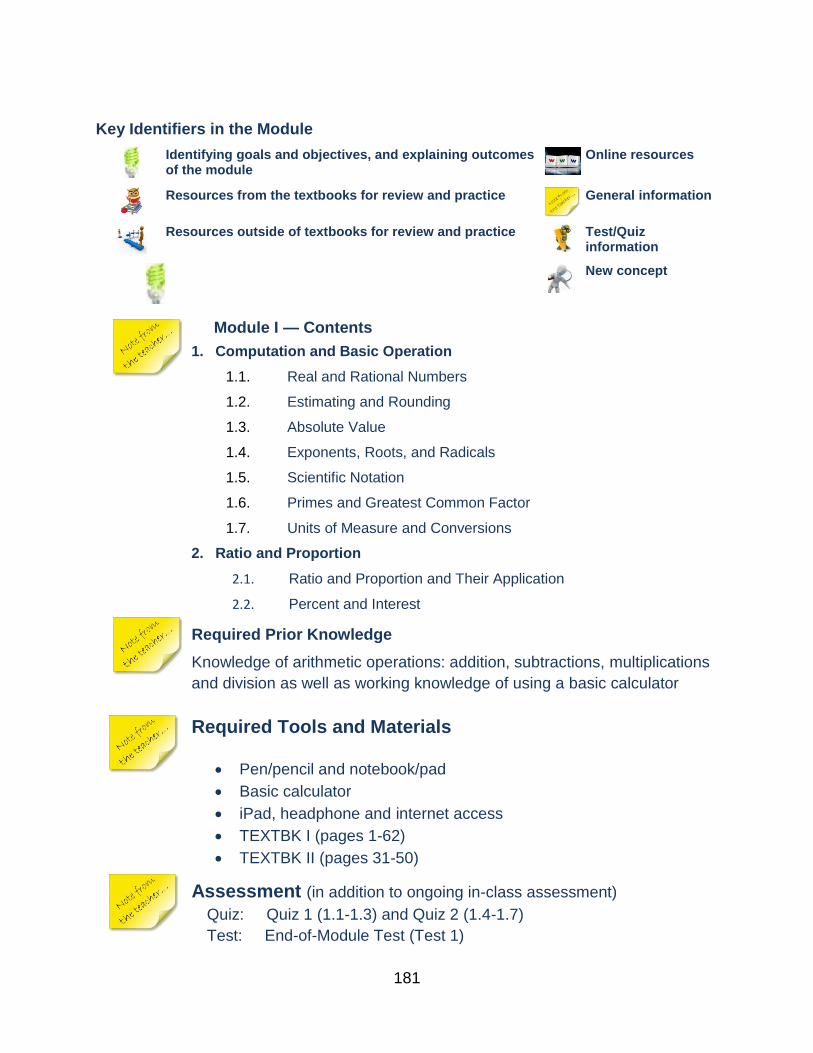
181
Key Identifiers in the Module
Identifying goals and objectives, and explaining outcomes of the module
Online resources
Resources from the textbooks for review and practice
General information
Resources outside of textbooks for review and practice
Test/Quiz information
New concept
Module I — Contents
Required Prior Knowledge
Knowledge of arithmetic operations: addition, subtractions, multiplications
and division as well as working knowledge of using a basic calculator
Required Tools and Materials
Pen/pencil and notebook/pad
Basic calculator
iPad, headphone and internet access
TEXTBK I (pages 1-62)
TEXTBK II (pages 31-50)
Assessment (in addition to ongoing in-class assessment)
Quiz: Quiz 1 (1.1-1.3) and Quiz 2 (1.4-1.7)
Test: End-of-Module Test (Test 1)
1. Computation and Basic Operation
1.1. Real and Rational Numbers
1.2. Estimating and Rounding
1.3. Absolute Value
1.4. Exponents, Roots, and Radicals
1.5. Scientific Notation
1.6. Primes and Greatest Common Factor
1.7. Units of Measure and Conversions
2. Ratio and Proportion
2.1. Ratio and Proportion and Their Application
2.2. Percent and Interest
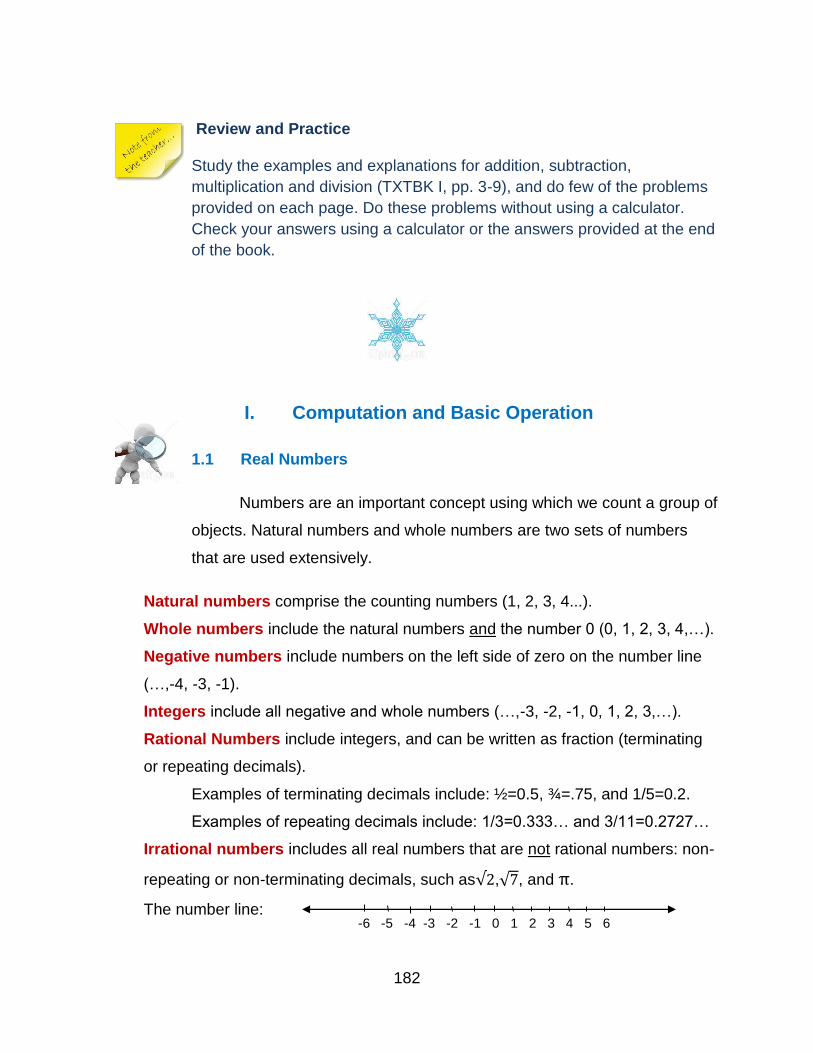
182
Review and Practice
Study the examples and explanations for addition, subtraction,
multiplication and division (TXTBK I, pp. 3-9), and do few of the problems
provided on each page. Do these problems without using a calculator.
Check your answers using a calculator or the answers provided at the end
of the book.
I. Computation and Basic Operation
1.1 Real Numbers
Numbers are an important concept using which we count a group of
objects. Natural numbers and whole numbers are two sets of numbers
that are used extensively.
Natural numbers comprise the counting numbers (1, 2, 3, 4...).
Whole numbers include the natural numbers and the number 0 (0, 1, 2, 3, 4,…).
Negative numbers include numbers on the left side of zero on the number line
(…,-4, -3, -1).
Integers include all negative and whole numbers (…,-3, -2, -1, 0, 1, 2, 3,…).
Rational Numbers include integers, and can be written as fraction (terminating
or repeating decimals).
Examples of terminating decimals include: ½=0.5, ¾=.75, and 1/5=0.2.
Examples of repeating decimals include: 1/3=0.333… and 3/11=0.2727…
Irrational numbers includes all real numbers that are not rational numbers: non-
repeating or non-terminating decimals, such as√2,√7, and π.
The number line:
-6 -5 -4 -3 -2 -1 0 1 2 3 4 5 6

183
See below for more information on rational numbers and examples for improper
fraction and mixed numerals.
Source: Spectrum (2011)
Read/Review/Practice
Study the examples and explanations for renaming, adding,
subtracting, multiplying and dividing fractions and mixed
numerals (TXTBK I, pp. 11-14 and TXTBK II, pp. 33-36; 39-40). Solve
few of the problems provided on each page—you may use your
calculator. Compare your answers with those that are provided at the
end of the book.
Assignment/Activity
Use the link below to access a variety of exercises, solved examples
and/or videos on rational and irrational numbers.
Back to
Menu
Khan Academy Website # 1

184
1.2 Estimating and Rounding
Check out the following links on rounding and estimating. We’ll do
more exercises in class as well.
Online Resources
This Website is an excellent site for rounding and estimating.
Look at “Rounding a whole numbers” and “Estimating a
Sum.”
This is an excellent video clip explaining rounding a whole
number (4:22 min).
This is an excellent short video clip explaining rounding a
decimal number (1.25 min).
1.3 Absolute Value
The term absolute value refers to the distance from zero on the
number line. For example, the absolute value of 2 or -2 tells how far each
number is from zero. Rather than repeating the term absolute value, we
use the mathematical symbol “| |” instead, e.g., |4|. So, given the
definition, we say that |2| and |-2| are both equal 2 since both 2 and -2 are
two units away from zero.
Here are more examples: |3| = 3 ; |0| = 0 ; |-23| = 23
|3+1| = |4| = 4 (3+1 = 4)
|-2-3| = |-5| = 5 (-2-3 = -5)
|-3+1| = |-2| = 2 (-3+1 = -2)
Important Note: If there is a negative sign “-“ before the absolute value,
the answer become negative.
For example: -|3| = -3 ; -|-2+1| = -|-1| = -1 (-2+1 = -1)
Website # 2
Video Clip # 3
Video Clip # 4
Back to
Menu
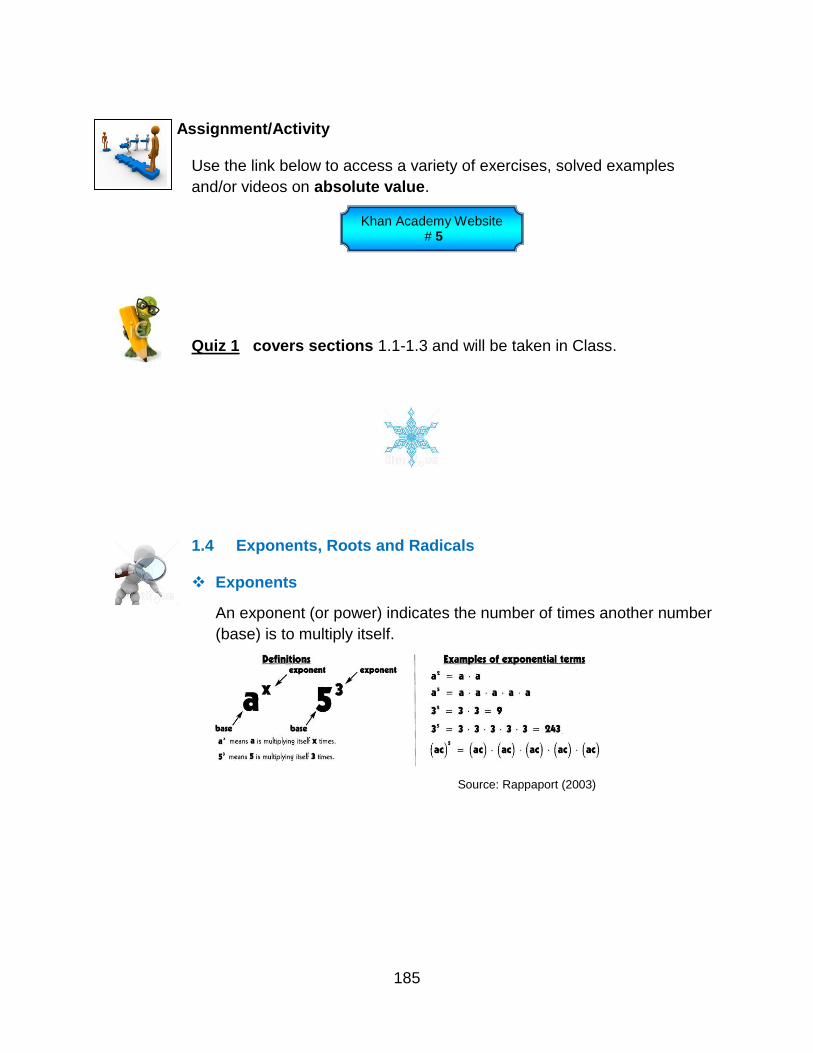
185
Assignment/Activity
Use the link below to access a variety of exercises, solved examples
and/or videos on absolute value.
Quiz 1 covers sections 1.1-1.3 and will be taken in Class.
1.4 Exponents, Roots and Radicals
Exponents
An exponent (or power) indicates the number of times another number
(base) is to multiply itself.
Source: Rappaport (2003)
Khan Academy Website # 5

186
Here are the general rules of exponents and related examples:
Source: Rappaport (2003)
Important Note: As a rule, any base (except 0) raised to the power of
zero is equal to 1, that is a0 = 1.
For example: 20 = 1 ; (-4)0 = 1 ; (1.5)0 = 1
Here are more examples: 1 + 32 = 1 + 9 = 10 ; 2 + (-2)0 = 2 + 1 = 3
Online Resources
This is an introductory video on exponent (9:46 min).
Read/Review/Practice
Study the examples and explanations for powers/exponents (TXTBK II,
pp. 24, 26-27). Solve few of the problems provided on each page—you
may use your calculator. Compare your answers with those that are
provided at the end of the book.
Video Clip # 6

187
Assignment/Activity
Solve the following problems.
Problem Answer
1 25 32
2 (-2)2 4
3 71 7
4 80 1
5 (-8)0 1
6 -80 -1
7 5 + 30 6
8 5 x 30 5
9 5 - 30 4
10 5/30 5
Source: Rappaport (2003)
Also
Use the links below to access a variety of exercises, solved examples
and/or videos on exponents.
Use the links below to access a variety of exercises, solved examples
and/or videos on exponent properties
[space left blank]
Khan Academy Website # 7
Khan Academy Website # 8

188
Roots and Radicals
Source: Rappaport (2003)
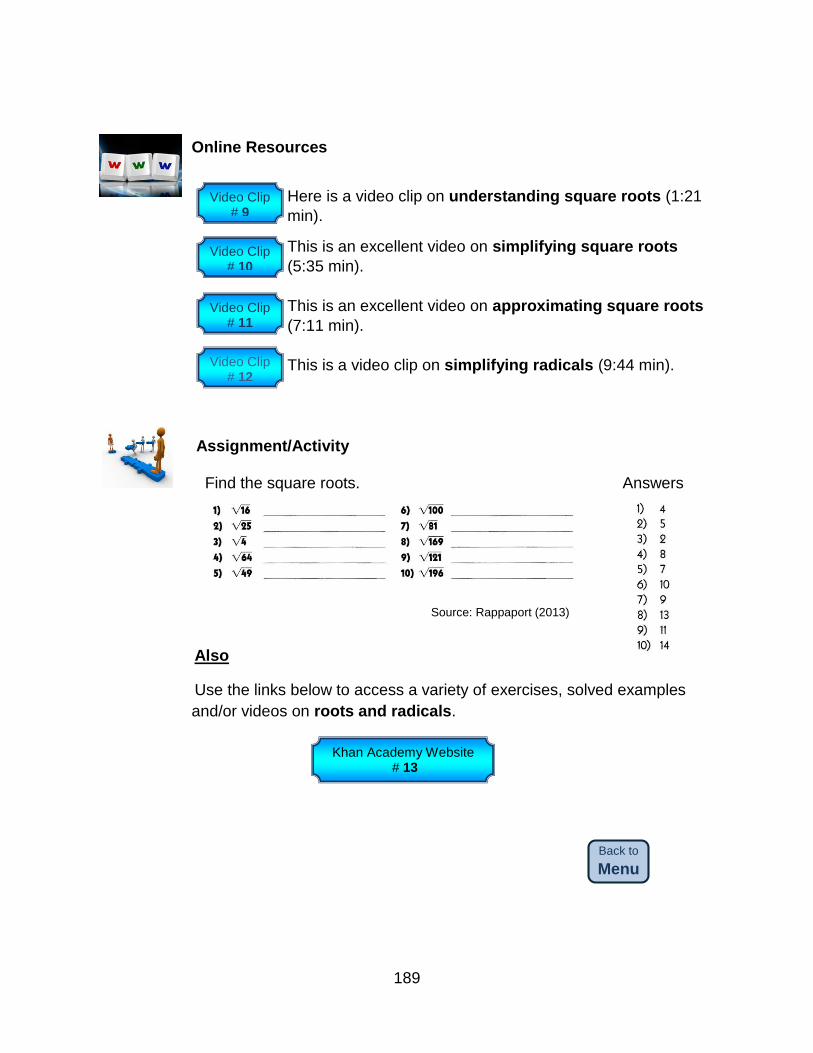
189
Online Resources
Here is a video clip on understanding square roots (1:21
min).
This is an excellent video on simplifying square roots
(5:35 min).
This is an excellent video on approximating square roots
(7:11 min).
This is a video clip on simplifying radicals (9:44 min).
Assignment/Activity
Find the square roots. Answers
Source: Rappaport (2013)
Also
Use the links below to access a variety of exercises, solved examples
and/or videos on roots and radicals.
Video Clip # 9
Video Clip # 10
Video Clip # 11
Video Clip # 12
Back to
Menu
Khan Academy Website # 13
190
1.5 Scientific Notation is a simplified way of writing a number or in a
special way.
Online Resources
This is an excellent video on scientific notation (4:11 min).
This video explores scientific notation more comprehensively with more examples (11:25 min).
Read/Review/Practice
Study the examples and explanations for scientific notation (TXTBK II, p.
28). Solve few of the problems provided on each page—you may use your
calculator. Compare your answers with those that are provided at the end of
the book.
Assignment/Activity
Use the links below to access a variety of exercises, solved examples
and/or videos on scientific notation.
Video Clip
# 14
Video Clip # 15
Back to
Menu
Khan Academy Website # 16
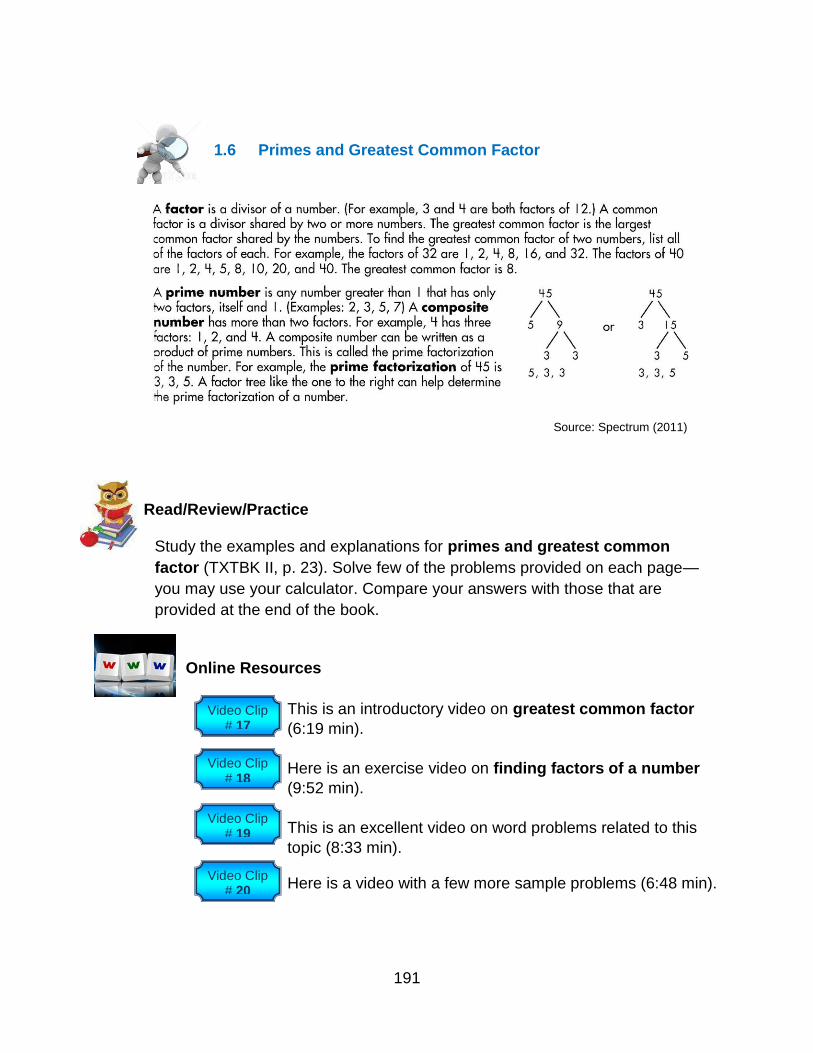
191
1.6 Primes and Greatest Common Factor
Source: Spectrum (2011)
Read/Review/Practice
Study the examples and explanations for primes and greatest common
factor (TXTBK II, p. 23). Solve few of the problems provided on each page—
you may use your calculator. Compare your answers with those that are
provided at the end of the book.
Online Resources
This is an introductory video on greatest common factor
(6:19 min).
Here is an exercise video on finding factors of a number
(9:52 min).
This is an excellent video on word problems related to this
topic (8:33 min).
Here is a video with a few more sample problems (6:48 min).
Video Clip
# 17
Video Clip # 18
Video Clip # 19
Video Clip # 20

192
Assignment/Activity
Find the greatest common factor. Answers
Source: Rappaport (2013)
Also
Use the links below to access a variety of exercises, solved examples
and/or videos on prime and composite numbers.
Use the links below to access a variety of exercises, solved examples
and/or videos on prime factorization.
Use the links below to access a variety of exercises, solved examples
and/or videos on greatest common factor.
1.7 Units of Measure and Conversions
Excellent examples and conversion chars for units of length, weight,
time, and volume are provided in TXTBK I.
Back to
Menu
Khan Academy Website # 21
Khan Academy Website # 22
Khan Academy Website # 23

193
Read/Review/Practice
Study the examples and explanations for units of measure and
conversions (TXTBK I, pp. 43-58). Solve few of the problems provided on
each page—you may use your calculator. Compare your answers with
those that are provided at the end of the book.
Quiz 2 covers sections 1.4-1.7 and will be taken in Class.
II. Ratio and Proportion
2.1 Ratio, Proportion and Their Applications
Source: Spectrum (2011)

194
Online Resources
This is an introductory video on Ratio (7:27 min).
This is an introductory video on proportion (1.24 min).
This is a video on ratios as fractions (1:18 min).
This is a video clip on a word problem with respect to ratio
(2:03 min).
This is good video on finding an unknown in a proportion
(7:19 min).
Read/Review/Practice
Study the examples and explanations for ratio and proportion
(TXTBK I, pp. 19, 21-22, 24 and TXTBK II, pp. 43-44). Solve few of the
problems provided on each page—you may use your calculator.
Compare your answers with those that are provided at the end of the
book.
Assignment/Activity
Use the links below to access a variety of exercises, solved examples
and/or videos on greatest common factor.
Video Clip
# 24
Video Clip # 25
Video Clip # 26
Video Clip # 27
Video Clip
# 28
Back to
Menu
Khan Academy Website # 29
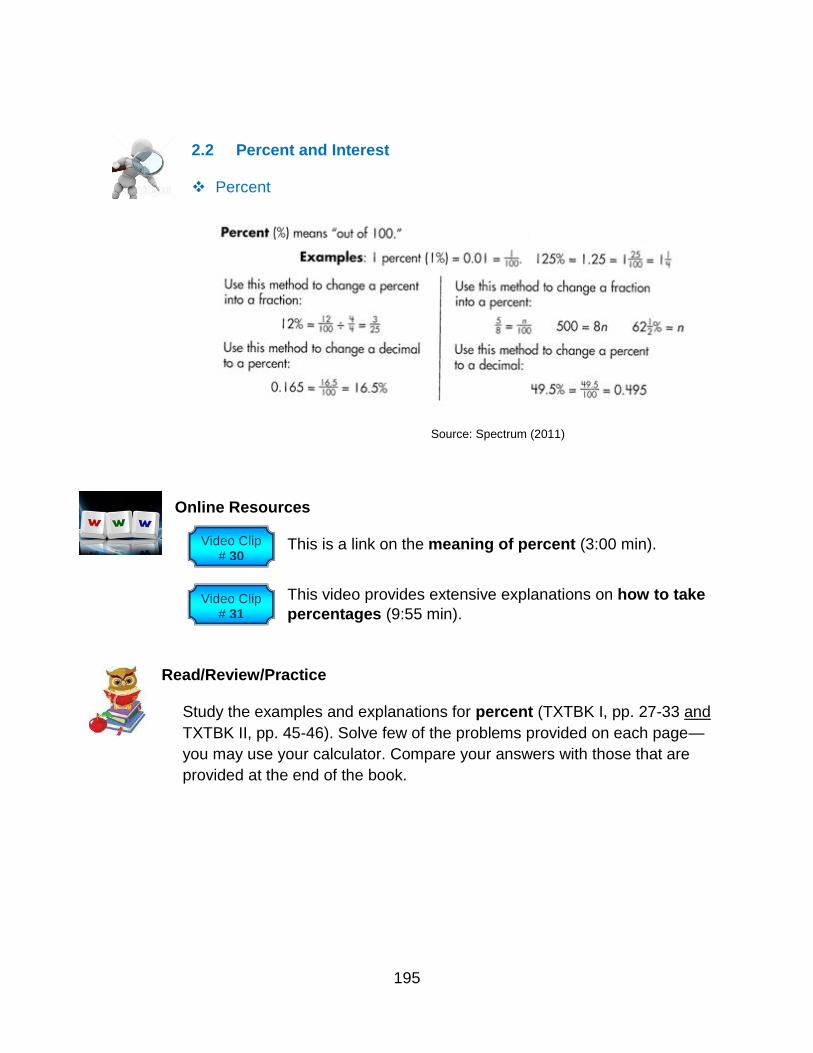
195
2.2 Percent and Interest
Percent
Source: Spectrum (2011)
Online Resources
This is a link on the meaning of percent (3:00 min).
This video provides extensive explanations on how to take
percentages (9:55 min).
Read/Review/Practice
Study the examples and explanations for percent (TXTBK I, pp. 27-33 and
TXTBK II, pp. 45-46). Solve few of the problems provided on each page—
you may use your calculator. Compare your answers with those that are
provided at the end of the book.
Video Clip
# 30
Video Clip # 31
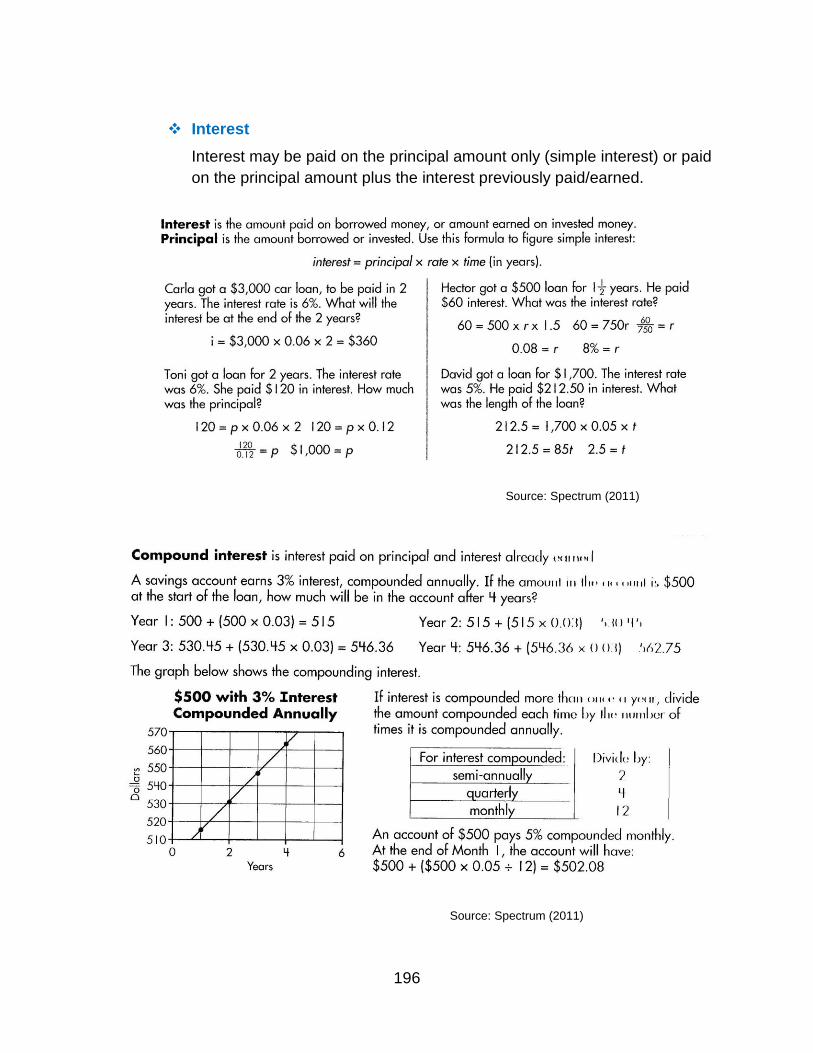
196
Interest
Interest may be paid on the principal amount only (simple interest) or paid
on the principal amount plus the interest previously paid/earned.
Source: Spectrum (2011)
Source: Spectrum (2011)
197
Online Resources
This Website provides an excellent explanation for simple
and compound interest with examples.
Here is the link to excellent video on introduction to
interest (9:55 min).
Read/Review/Practice
Study the examples and explanations for interest (TXTBK I, pp. 34-38
and TXTBK II, pp. 47-48). Solve few of the problems provided on each
page—you may use your calculator. Compare your answers with those
that are provided at the end of the book.
Module I test (Test 1) will be taken in class.
References
Basic-Mathematics (2008). Retrieved from http://www.basic-mathematics.com/.
Khan Academy (2014, May 8). Retrieved from https://www.khanacademy.org/.
Rappaport, J. (2003). Algebra survival guide. Santa Fe, New Mexico: Singing Turtle
Press.
Rappaport J. (2013). Algebra survival guide workbook. Santa Fe, New Mexico: Singing
Turtle Press.
Spectrum (2011). Spectrum algebra – grades 6-8. Greensboro, NC: Carson-Dellosa.
Website
# 32
Video Clip # 33
Back to
Menu

198
A copy of the copyright permission letter from the Carson-Dellosa Publishing is
displayed below.

199
A copy of the copyright permission letter from Josh Rappaport (publisher,
Singing Turtle Press) is displayed below.
200
APPENDIX E: SAMPLE SYLLABUS

201
Remnant High School
Mathematics Intervention Program (MIP) Syllabus for Fall 2014
1. Class Information
MIP is a one-semester course with ½ credit (elective), and is open to freshman (and
occasionally sophomore) students.
Prerequisite: None
2. Instructor
Mr. Jeremy Adams
Office: Mathematics Building; Room 123
E-mail: [email protected]
Office Number: 123-456-7899
3. Textbooks Required
Three textbooks are required which will be provided to the students.
1. Spectrum Math – Grade 8 (2007) TEXTBK I
2. Spectrum Algebra – Grades 6-8 (2011) TEXTBK II
3. Spectrum Data Analysis & Probability – Grades 6-8 (2011) TEXTBK III
4. Tools and Materials Needed
Pen, pencil, sharpener, eraser, paper, binder (1-1 ½” soft or hard cover), ruler, a
basic calculator, and an iPad (provided by school)
5. Course Description and Content
MIP is a remedial course in mathematics concentrated on Mathematics grades 6-8
and Pre-Algebra. It is designed to “help students make the transition from basic
elementary mathematics to Algebra 1 and Geometry and provides a foundation for
understanding a broad spectrum of mathematical topics” (NAD, 2003, p. 51).

202
Course Content
Module 0: Course Overview (Duration: ½ Week)
Module I: Numbers, Properties, and Operations (Duration: 4½ Weeks)
Module II: Algebra (Duration: 5½ Weeks)
Module III: Geometry (Duration: 4 Weeks)
Module IV: Probability, Statistics, and Data Analysis (Duration: 2½ Weeks)
6. Student Outcomes
Upon the completion of this course, students will:
1. Extend previous understandings and expand skills in arithmetic computations.
2. Know the real number system, and be able to add, subtract, multiply and
divide rational numbers.
3. Solve problems involving integer exponents, roots, and radicals.
4. Understand ratio, analyze proportional relationships, and use their
applications.
5. Understand variables and evaluate expressions.
6. Solve one-variable equations and Inequalities.
7. Understand and evaluate functions.
8. Understand geometric shapes and figures.
9. Solve problems involving measuring and computing angle, perimeter, area,
surface area and volume.
10. Understand the concept of probability and perform statistical data analysis.
[space left blank]

203
7. Schedule
1st Quarter (9 weeks)
Week Topic/Concept/Assessment Dates
1 Course Overview; Mod 0; Aspire Test (pre-test) Aug 11-15
2 Mod I (1.1-1.3) Aug 18-22
3 Mod I (1.3 (cont.); Review; QZ 1; 1.4) Aug 25-29
4 Mod I (1.5-1.7; Review) Sep 01-05
5 Mod I (QZ 2; 2.1-2.2; Review) Sep 08-12
6 Mod I (Test 1); Mod II (1-1-1.2; 2.1) Sep15-19
7 Mod II (2.2; 3.1-3.2) Sep 22-26
8 Mod II (Review; QZ 3; 3.3) Sep29-Oct 03
9 Mod II (4.1-4.3) Oct 06-10
Mod — Module; QZ — Quiz
2nd Quarter (10 weeks)
Week Topic/Concept/Assessment Dates
1 Mod II (Review; QZ 4; 5.1-5.3) Oct 13-17
2 Mod II (5.4-5.5; Review; Test 2) Oct 20-24
3 Mod III (1; 2.1-2.2; 3.1-3.2) Oct 27-31
4 Mod III (4.1-4.3; Review) Nov 03-07
5 Mod III (QZ 5; 5; 6) Nov10-14
6 Mod III (6 (cont.); 7; Review; Test 3) Nov17-21
7 Thanksgiving Break Nov 24-28
8 Mod IV (1.1-1.2; 2.1-2.2) Dec 01-05
9 Mod IV (3.1-3.3; Review) Dec 08-12
10 Test 4; ACT-Aspire Test (post-test) Dec15-19
204
8. Attendance Attendance is taken at the beginning of each class period.
No restroom permission will be granted during the first and last 5 minutes of the
class period.
Students whose outfits do not comply with school’s dress code will not be
allowed until they comply in a timely manner.
RHS attendance policy will be enforced.
Tardiness
o Students must be in class by the bell, otherwise he/she will be tardy.
o Students who are late more than 10 minutes will be considered as absent.
o Tardiness will be considered excused ONLY when the student provide a
pass.
o If a student leaves the class (e.g., bathroom breaks, etc.) and does not return
within five minutes, the student will be considered tardy.
o If a student is sent to the front office, he/she MUST have a note when
returning to class.
o If a student is sent the front office and does not return, he/she will be
considered absent.
o If a student needs to go see the nurse, he/she MUST have a note from the
nurse/front offices when returning to class.
9. Participation
Attendance and full participation are central to the success in this course. Be on-
time, ready and bring all necessary materials. Take advantage of the class activities.
10. Late Work
All exercises and activities are designed to be completed in class. Quizzes and tests
must be taken during the class sessions unless otherwise determined by the
instructor. Work missed because of unexcused absences cannot be made up. In
accordance with the RHS policy, students will have two days to makeup missed
assignments.
205
11. Plagiarism and Cheating Any kind of academic dishonesty is a serious offense. Therefore, this calls into
question the right of an offender to remain a part of the Remnant High School
community. Cheating and plagiarism are academic dishonesty. Plagiarism is the
presentation of the words, ideas, concepts, images, or works of another as one’s
own. Material (in whole or paraphrased) taken from a primary or secondary source
without following standards of conventional attribution, and/or without appropriate
reference citation is considered to be plagiarized. Cheating is obtaining (or
attempting to obtain) something by dishonest or deceptive means. The Principal,
Vice Principal, and Student Services Committee handle questions of academic
dishonesty. Examples of academic dishonesty include but are not limited to the
following:
Possession or use of unauthorized notes or tests or copying answers from
another on an exam
Plagiarism
Copying homework or other papers or allowing work to be copied
Unauthorized exchange of information
12. Grading
The final grade for this course is designed as Pass or Fail based on the student’s score on ACT-Aspire (post-test) at the end of the semester. Module quizzes and tests are to help students assess the degree of which they have mastered the concepts and their applications. As such, they are use for diagnostic purposes. Furthermore, students’ quiz and test grades are not a determining factor whether students pass or fail the course. List of Quizzes and Tests (for designated dates, refer to the schedule above)
Module I: Quiz 1 (sections 1.1-1.3)
Quiz 2 (sections 1.4-1.7)
Test 1 (all sections)
Module II: Quiz 3 (sections 1.1-1.2; 2.1-2.2; 3.1-3.2)
Quiz 4 (sections 3.3; 4.1-4.3)
Test 2 (all sections)
Module III: Quiz 5 (sections 1; 2.1-2.2; 3.1-3.2; 4.1-4.3)
Test 3 (all sections)
206
Module VI: Test 4 (all sections)
13. Classroom Guidelines
The classroom is a special environment in which students and faculty come together
to promote learning and growth. Show respect for others, yourselves, media, and
equipment. Students are expected to comply with the school policies by being
responsible for their own actions and behave in an appropriate manner. Be prepared
for the class and manage your time wisely.
Cell phones and other electronic devices must be off and not visible.
Absolutely no food or drink (except screw-cap water bottles) in the studio.
Do not write on the equipments or walls.
Any class taught by a substitute teacher will follow these regulations as well.
14. Suggestions for Success
Be ready, present and alert in class.
Bring all necessary materials for work in class.
Take advantage of the class activities.
Stay current.
Reference
NAD (2003). Curriculum Guide. Mathematics Grades K-12. Office of Education.
North American Division. Retrieved from
http://www.nadeducation.org/client_data/files/725_mathematicsk12.pdf.
Disclaimer: The instructor may change this syllabus without prior notice.
207
REFERENCES
ACT-Explore (2013). Interpretive guide for student and school reports. Retrieved form
http://www.act.org/explore/pdf/Explore-InterpGuide.pdf.
ADOE (2011). The General Conference Education Team. Adventist Department of
Education. Retrieved from http://education.gc.adventist.org/about.html.
American Psychological Association (2010). Publication manual of the American
Psychological Association (6th ed.). Washington, DC: American Psychological
Association.
Anderson, L. W., Krathwohl, D. R., Airasian, P. W., Cruikshank, K. A., Mayer, R. E.,
Pintrich, P. R., et al. (Eds.) (2001). Taxonomy for learning, teaching, and
assessing. New York: Addison Wesley Longman.
Attewell, P., Lavin, D., Domina, T., & Levey, T. (2006). New evidence on college
remediation. Journal of Higher Education, 77(5), 886-924.
Bahr, P. R. (2007, September). Double jeopardy: Testing the effects of multiple basic
skill differences on successful remediation. Research in Higher Education, 48(6),
695-725.
Bahr, P. R. (2008). Does mathematics remediation work? A comparative analysis of
academic attainment among community college students. Research in Higher
Education, 49(5), 420-450.
Balfanz, R., & Byrnes, V. (2006). Closing the mathematics achievement gap in high-
poverty middle schools: Enablers and constraints. Journal of Education for
students places at risk, 11(2), 143–159.
Basic-Mathematics (2008). Retrieved from http://www.basic-mathematics.com/.
208
Bergmann, J, & Sams, A. (2012). Flip your classroom—reach every student in every
class every day. Alexandria, VA: ASCD.
Bettinger, E. P., & Long, B. T. (2009). Addressing the needs of underprepared students
in higher education: Does college remediation work? Journal of Human
Resources, 44(3), 736-771.
Bolman, L. G., & Deal, T. E. (2008). Reframing organizations—artistry, choice, and
leadership (4th ed.). San Francisco: Jossey-Bass.
Bottge, B. A., Grant, T. S., Stephens, A. C., & Rueda, E. (2010). Advancing the math
skills of middle school students in technology education classrooms. NASSP
Bulletin, 94(2), 81–106.
Carr, J. M. (2012). Does math achievement h’APP’en when iPads and game-based
learning are incorporated into fifth-grade mathematics instruction? Journal of
Information Technology Education, 11, 269-285.
Circle (2011). About Seventh-day Adventist Education. Retrieved from
http://circle.adventist.org/services/info/?topic=adventist_ed.
CognitiveGenesis (2013). CognitiveGenesis research study. Retrieved from
http://www.cognitivegenesis.org/.
Conference (2013). The Florida Conference of the Seventh-day Adventist. Retrieved
from http://www.floridaconference.com/iym/education/.
Coyne, M. D., Kame’enui, E. J., & Carnine, D. W. (2011) Effective teaching strategies
that accommodate diverse learners (4th ed.). Upper Saddle River, NJ: Pearson
Education.
209
Doabler C. T., Cary, M. S., JungJohann, K., Clarke, B., Fien, H., Baker, S., et al. (2012,
March/April). Enhancing core mathematics instruction for students at risk for
mathematics disabilities. Teaching Exceptional Children, 44(4), 48-57.
Explore (2013). ACT Explore interpretive guide for student and school report—2013-
2014. Retrieved from http://www.act.org/explore/pdf/Explore-InterpGuide.pdf.
Field, A. (2013). Discovering statistics using IBM SPSS Statistics (4th ed.). Thousand
Oaks, CA: SAGE Publications Inc.
Fine, A., Duggan, M., & Braddy, L. (2009). Removing remediation requirements:
Effectiveness of intervention programs. PRIMUS, 19(5), 433-446.
FLDOE (2014). MAFS: Mathematics standards. Florida Department of education.
Retrieved from http://www.fldoe.org/pdf/mathfs.pdf.
Fitzpatrick, J. L., Sanders, J. R., and Worthen, B. R. (2011). Program evaluation—
alternative approaches and practical guidelines (4th ed.). Upper Saddle River,
New Jersey: Pearson Education.
Gredler, M. E. (2009). Learning and instruction (6th ed.). Upper Saddle River, NJ:
Pearson Education.
Gunter, G. A. & Gunter, R. E. (2015, Published October 2014), Shelly-Cashman Series,
Teachers Discovering Computers: Integrating Technology in a Changing World –
8th Ed. Boston, MA: Cengage Learning.
Handel, S. J., & Williams, R. A. (2011, March). Reimagining remediation. Change: The
Magazine of Higher Learning, 43(2), 28-33.
Herreid, C. F., & Schiller, N. A. (2013). Case studies and the flipped classroom. Journal
of College Science Teaching, 42(5), 62-66.
210
Howell, J. S. (2011, May/June). What influences students’ need for remediation in
college? Evidence from California. The Journal of Higher Education, 82(3), 292-
318.
Illich, P. A., Hagan, C., & McCallister, L. (2004). Performance in college-level courses
among students concurrently enrolled in remedial courses: Policy implications.
Community College Journal of Research and Practice, 28(5), 435-453.
Johnson, G. M. (2004). Constructivist remediation: Correction in context. International
Journal of Special Education, 19(1), 72-88.
Jordan, N. C., Kaplan, D., Locuniak, M. N., & Ramineni, C. (2007). Predicting first-grade
math achievement from developmental number sense trajectories. Learning
Disabilities Research & Practice, 22(1), 36–46.
Khan Academy (2014). Retrieved from https://www.khanacademy.org/.
Kubiszyn, T., & Borich, G. (2007). Educational testing and measurement (8th ed.).
Hoboken, NJ: John Wiley and Sons.
Lidwell, W., Holden, K., & Butler, J. (2010). Universal principles of design. Beverly, MA:
Rockport.
Little, M. E. (2009). Teaching mathematics: issues and solutions. Teaching Exceptional
Children Plus, 6(1), 2-15.
Marzano, R. J. (2009). Designing and teaching learning goals and objectives.
Bloomington, IN: Marzano Research Laboratory.
Mayer, R. E. (2011). Applying the science of learning. Boston, MA: Pearson Education.
McTighe, J., & Wiggins, G. (2013). Essential questions—opening doors to student
understanding. Alexandria, VA: ASCD.

211
Meyen, E., & Greer, D. (2009, January). The role of instructional planning in math
instruction for students with learning disabilities. Focus On Exceptional Children,
41(5), 1-12.
Meyer, A., Rose, D. H., & Gordon, D. (2014). Universal design for learning—theory and
practice. Wakefield, MA: CAST Inc.
NAD (2003). Curriculum guide: Mathematics grades K-12. Office of education—North
American Division of Seventh-day Adventists. Retrieved from
http://www.nadeducation.org/client_data/files/725_mathematicsk12.pdf.
NAD (2013). The North American Division of the Seventh-day Adventist. Retrieved from
http://www.nadadventist.org/article/19/about-our-church/organizational-structure.
Norman, D. (2013). The design of everyday things. New York: Basic Books.
Perin, D. (2006). Can community colleges protect both access and standards? The
problem of remediation. Teachers College Record, 108(3), 339-373.
Parslow (2012). Commentary: The Khan Academy and the day-night flipped classroom.
The International Union of Biochemistry and Molecular Biology. 40(5). 337–338.
Rappaport, J. (2003). Algebra survival guide. Santa Fe, New Mexico: Singing Turtle
Press.
Rappaport J. (2013). Algebra survival guide workbook. Santa Fe, New Mexico: Singing
Turtle Press.
Rich, B., & Schmidt, P. A. (2012). Elementary mathematics (2nd ed.). New York, NY:
McGraw-Hill.
Rueda, R. (2011). The 3 dimensions of improving student performance. New York, NY:
Teachers College Press.
212
Sams, A., & Bergmann, J. (2013, March). Flip your student’s learning. Educational
Leadership, 16-20.
Spectrum (2007). Spectrum math – grade 8. Greensboro, NC: Carson-Dellosa.
Spectrum (2011a). Spectrum algebra – grades 6-8. Greensboro, NC: Carson-Dellosa.
Spectrum (2011b). Spectrum data analysis & probability – Grades 6-8. Greensboro, NC:
Carson-Dellosa.
Stevens, D. D., & Levi, A. J. (2005). Introduction to rubrics. Sterling, VA: Stylus.
Stufflebeam, D., L. (2001). Evaluation models. New York, NY: Jossey-Bass.
Thayer, J. (2008). The impact of Adventist schools on students. 4th symposium on the
Bible and Adventist scholarship—Riviera Maya, Estado Quintana Roo, Mexico.
March 16-22, 20118. Retrieved from
http://fae.adventist.org/essays/iv_Thayer_Jerry.pdf.
Thompson, G. E. (1985). Mathematics education—implications for SDA schools. The
Journal of Adventist Education, 47(3), p. 4.
Tomlinson, C. A. (2001). How to differentiate instruction in mixed-ability classrooms (2nd
ed.). Alexandria, VA: ASCD.
Tomlinson, C. A., & McTighe, J. (2006). Integrating differentiated instruction and
understanding by design. Alexandria, VA: ASCD.
Usher, E. L., & Pajares, F. (2008, December). Sources of self-efficacy in school: Critical
review of the literature and future directions. Review of Educational Research,
78(4), 751–796.
213
Waycaster, P. (2001). Factors impacting success in community college developmental
mathematics courses and subsequent courses. Community College Journal of
Research & Practice, 25(5/6), 403-416.
Wenner, J. M., Burn, H. E., & Baer, E. M. (2011). The math you need, when you need it:
Online modules that remediate mathematical skills in introductory geoscience
courses. Journal of College Science Teaching, 41(1), 16-24.
Wiggins, G, & McTighe, J. (2006). Understanding by design. Upper Saddle River: NJ:
Pearson Education.
Williams, R., & Tollett, J. (2006). The non-designer’s web book (3rd ed.). Berkeley, CA:
Peachpit Press.