math 1342 - uh
TRANSCRIPT
MATH 1342Review for Exam 2 (Alternate)
24 Multiple Choice Questions
Terms and Vocabulary:Know sampling techniques
Experiment vs. Observational StudyUniform Distribution vs. Normal Distribution
Normal Distribution (x) vs. Standard Normal Distribution (z)
Answer the following for a normal distribution with a mean of 65 and a standard deviation of 5.P(X < 68)
P(X > 70)
P(57 < X < 60)
P(X < c) = 0.6753
P(X > c) = 0.3345
Answer the following:P(Z < 1.4)
P(Z > -0.8)
P(0.3 < Z < 1.9)
P(Z < c) = 0.7645
P(Z > c) = 0.4321
P(Z > c) = 1.4328
Random samples (of size 40) are selected from a population with μ = 345 and σ = 15. Determine the following:Mean of the Sample Means (𝜇𝜇�̅�𝑥):
Standard Error of the Sample Means (𝜎𝜎�̅�𝑥):
Probability that a randomly selected sample (as described above) would have a mean of greater than 370.
A researcher wished to run an experiment concerning which color wall paint makes people more productive in a work environment. Determine the appropriate course of action: Send 100 people a survey concerning their work habits and the room color.
Randomly assign 100 people to three different-colored room and monitor their results in a standardized skill-test.
Observe the most productive employee in a corporation for a week to see what color room he/she usually works in.
Speak to the head of human resources of a major corporation to discuss employee retention rates as a function of room color.
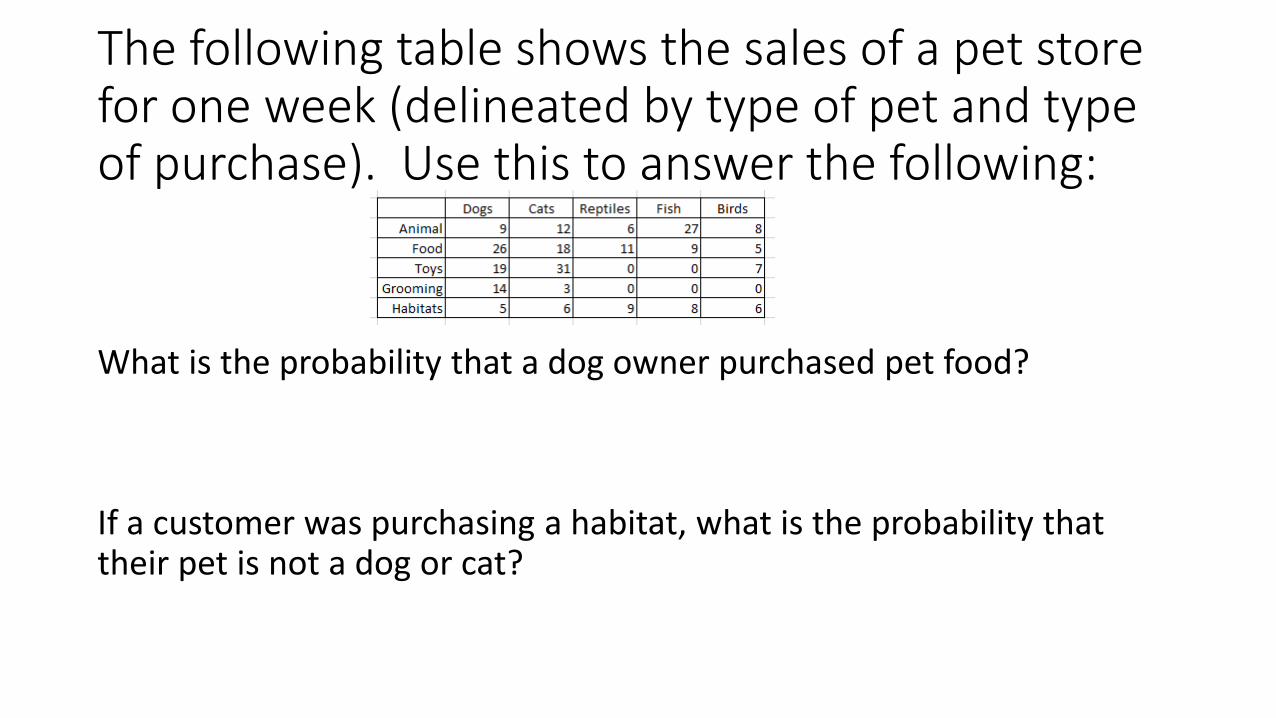
The following table shows the sales of a pet store for one week (delineated by type of pet and type of purchase). Use this to answer the following:
What is the probability that a dog owner purchased pet food?
If a customer was purchasing a habitat, what is the probability that their pet is not a dog or cat?
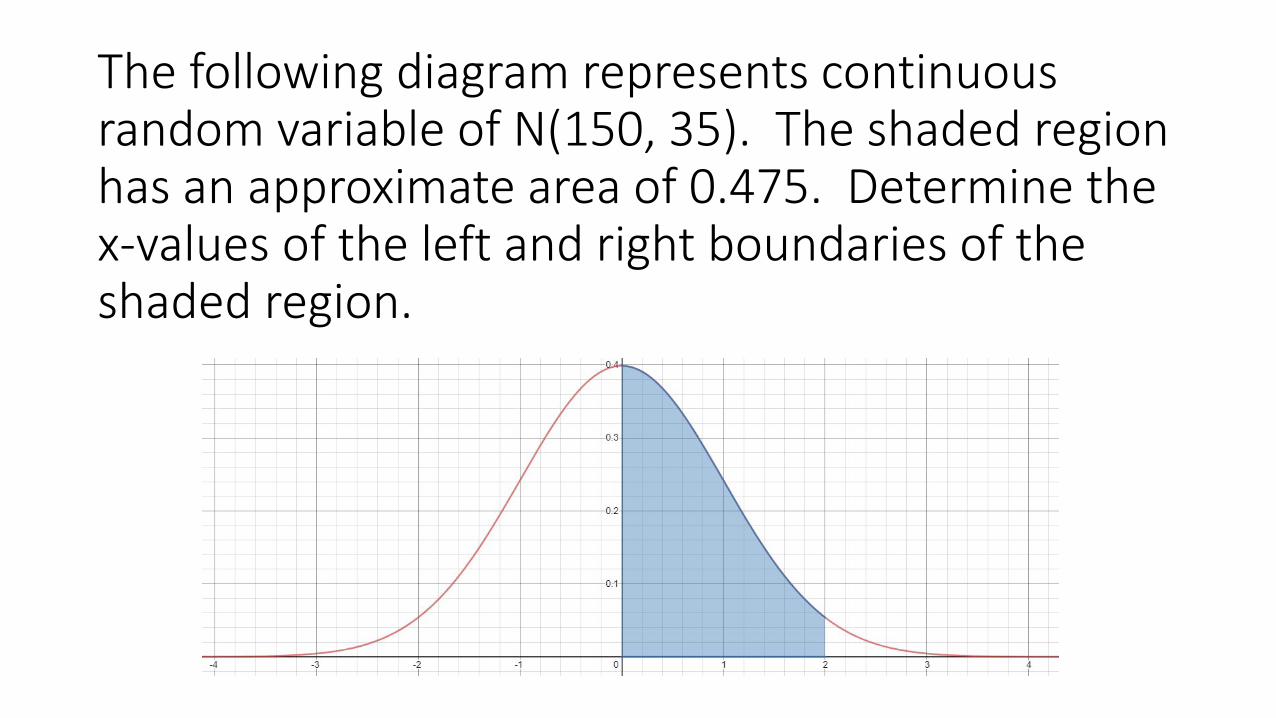
The following diagram represents continuous random variable of N(150, 35). The shaded region has an approximate area of 0.475. Determine the x-values of the left and right boundaries of the shaded region.
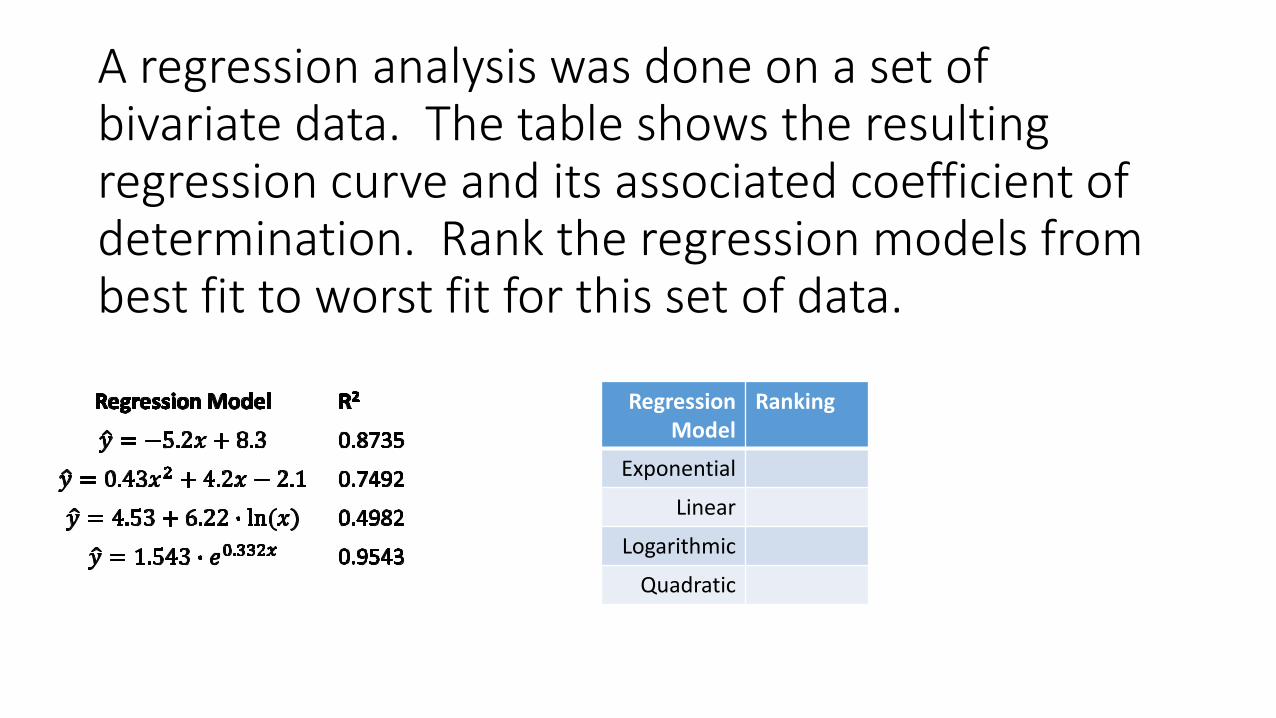
A regression analysis was done on a set of bivariate data. The table shows the resulting regression curve and its associated coefficient of determination. Rank the regression models from best fit to worst fit for this set of data.
Regression Model
Ranking
Exponential
Linear
Logarithmic
Quadratic
Two males are comparing their heights. The first has a height of 71.3 inches and the second has a height of 178 centimeters. Which is taller? (Consider that mean height for a male, in inches, is 69.6986, standard deviation of 3.0023, and in centimeters is 176.9, standard deviation of 7.62.
A cereal company has discovered that one of their coloring agents can cause a severe allergic reaction in 10% of the population, and a mild reaction in an additional 20% of the population. They decide to simulate an experiment to determine the severity of this problem. How would make assignments in a random digit table to model this situation?
A density curve consists of two line segments. The first connects the points (0, 1) and (0.5, 1). The second connects (0.5, 1) and the x-axis.Sketch the density curve.Determine the coordinates where the graph crosses the x-axisCalculate P(x > 0.2)Calculate P(x < 0.5)Calculate P(x > 1.5)Determine the median
*

Continued:
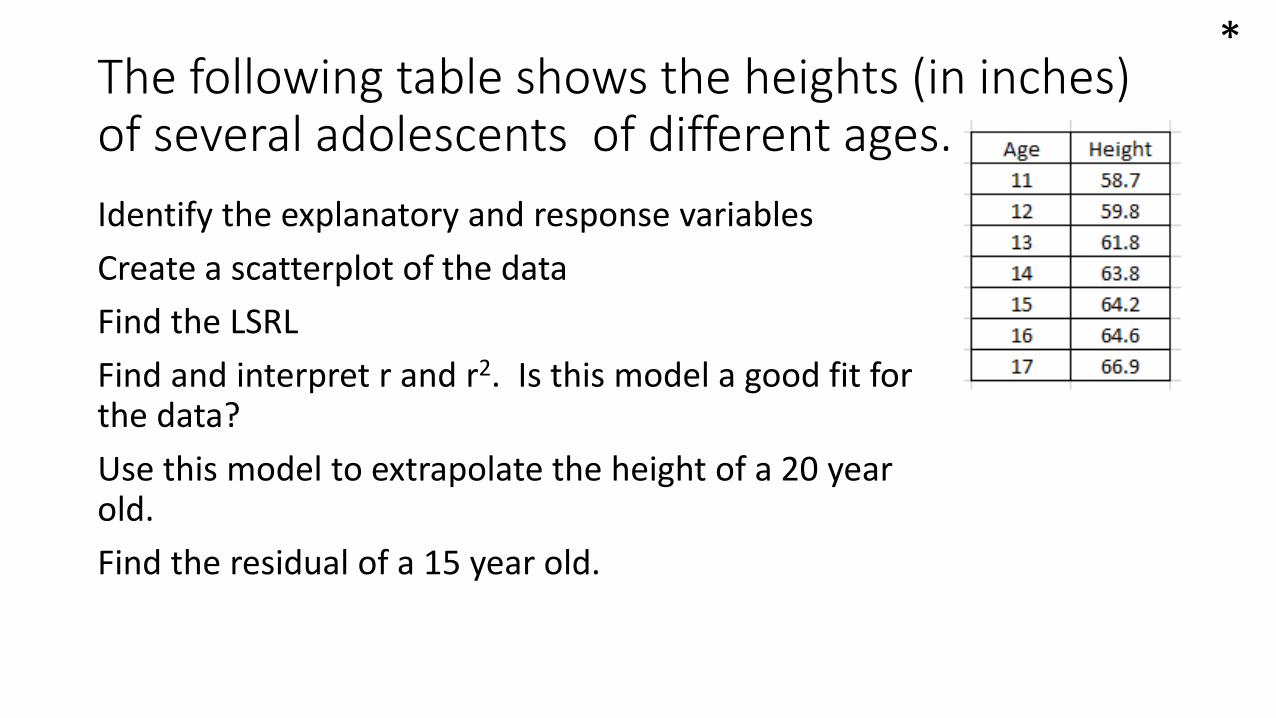
The following table shows the heights (in inches) of several adolescents of different ages.Identify the explanatory and response variablesCreate a scatterplot of the dataFind the LSRLFind and interpret r and r2. Is this model a good fit for the data?Use this model to extrapolate the height of a 20 year old.Find the residual of a 15 year old.
*

Continued:
A researcher is running a study to see what kind of food purchases people make (generic versus name brand). In order to do this, he selects 100 people entering the supermarket and monitors them (through security cameras) to see which items they select.Is this an experiment or an observational study? Why?Identify the population and sample.The researcher wants 25% of his sample to be senior citizens. How can probability sampling be used to do this?If the researcher also wants to consider race of the customer, what is this considered?If the researcher removed all customers with children from the sample, what is this considered?
*
A researcher is trying to determine if eating foods high in protein versus high in sugar has an immediate effect on motor skills and hand-eye coordination. To do this, he selects 45 people and divides them into three groups (2 treatment groups and a control group). After eating a meal, the subjects bowl five frames and the number of pins knocked down and the number of gutter balls is recorded.Is this an experiment or an observational study? Why?Identify the population and sample.Describe how matching can be used in the assignment of the groups.Describe possible control and treatment groups based on this research.Describe how double-blindness can be used in this research.
*