maternal prepregnancy body mass index and child...
TRANSCRIPT
Maternal Prepregnancy Body MassIndex and Child PsychosocialDevelopment at 6 Years of AgeHeejoo Jo, MPHa,b, Laura A. Schieve, PhDa, Andrea J. Sharma, PhDc,d, Stefanie N. Hinkle, PhDe, Ruowei Li, MD, PhDf,Jennifer N. Lind, PharmDd,f,g
abstract BACKGROUND: Both obesity and developmental disabilities have increased in recent decades. Limited studiessuggest associations between maternal prepregnancy obesity and child neurodevelopment.
METHODS: The Infant Feeding Practices Study II, a US nationally distributed longitudinal study of maternalhealth and infant health and feeding practices, was conducted from 2005 to 2007. In 2012, mothers wererecontacted for information on their children’s health and development. We examined associations betweenmaternal prepregnancy BMI and child psychosocial development in 1311 mother–child pairs included in thisfollow-up study. Children’s development was assessed by maternal report of child psychosocial difficultiesfrom the Strengths and Difficulties Questionnaire, past developmental diagnoses, and receipt of special needsservices.
RESULTS: Adjusting for sociodemographic factors, children of obese class II/III mothers (BMI .35.0) hadincreased odds of emotional symptoms (adjusted odds ratio [aOR] 2.24; 95% confidence interval [CI],1.27–3.98), peer problems (aOR 2.07; 95% CI, 1.26–3.40), total psychosocial difficulties (aOR 2.17; 95%CI, 1.24–3.77), attention-deficit/hyperactivity disorder diagnosis (aOR 4.55; 95% CI, 1.80–11.46), autismor developmental delay diagnosis (aOR 3.13; 95% CI, 1.10–8.94), receipt of speech language therapy(aOR 1.93; 95% CI, 1.18–3.15), receipt of psychological services (aOR 2.27; 95% CI, 1.09–4.73), andreceipt of any special needs service (aOR 1.99; 95% CI, 1.33–2.97) compared with children of normalweight mothers (BMI 18.5–24.9). Adjustment for potential causal pathway factors including pregnancyweight gain, gestational diabetes, breastfeeding duration, postpartum depression, and child’s birth weightdid not substantially affect most estimates.
CONCLUSIONS: Children whose mothers were severely obese before pregnancy had increased risk foradverse developmental outcomes.
WHAT’S KNOWN ON THIS SUBJECT: Both obesityand developmental disabilities have increased inrecent decades; however, the full long-termeffects of prepregnancy obesity on a child’spsychosocial development remain unknown.Limited studies suggest associations betweenmaternal prepregnancy obesity and childpsychosocial development.
WHAT THIS STUDY ADDS: This study in 6-year-oldchildren provides evidence that severeprepregnancy obesity is associated with adversechild psychosocial outcomes, including attention-deficit/hyperactivity disorder. These findingswere not explained by many pregnancy andpostpartum factors related to maternal obesityor child development.
aDivision of Birth Defects and Developmental Disabilities, National Center on Birth Defects and DevelopmentalDisabilities, fDivision of Nutrition, Physical Activity, and Obesity, and gEpidemic Intelligence Service, Office ofSurveillance, Epidemiology, and Laboratory Services, Centers for Disease Control and Prevention, Atlanta,Georgia; bOak Ridge Institute for Science and Education, Oak Ridge, Tennessee; cDivision of Reproductive Health,National Center for Chronic Disease Prevention and Health Promotion, Atlanta, Georgia; dUnited States PublicHealth Service Commissioned Corps, Atlanta, Georgia; and eDivision of Intramural Population Health Research,Eunice Kennedy Shriver National Institute of Child Health and Human Development, National Institutes of Health,Bethesda, Maryland
Ms Jo conceptualized and designed the study, carried out the initial analyses, and drafted the initialmanuscript; Drs Schieve, Sharma, Hinkle, Li, and Lind reviewed and revised the manuscript; and allauthors approved the final manuscript as submitted.
The findings and conclusions in this article are those of the authors and do not necessarilyrepresent the official position of the Centers for Disease Control and Prevention.
www.pediatrics.org/cgi/doi/10.1542/peds.2014-3058
DOI: 10.1542/peds.2014-3058
Accepted for publication Jan 30, 2015
Address correspondence to Heejoo Jo, MPH, Division of Birth Defects and DevelopmentalDisabilities, National Center on Birth Defects and Developmental Disabilities, Centers for DiseaseControl and Prevention, 1600 Clifton Rd, MS-E86, Atlanta, GA 30333. E-mail: [email protected]
ARTICLE PEDIATRICS Volume 135, number 5, May 2015 by guest on April 8, 2019www.aappublications.org/newsDownloaded from
Both obesity and developmentaldisabilities have increaseddramatically in recent decades.1–4 By2009, 20.5% of US women wereobese at the start of their pregnancy,a 16.5% increase since 2003.5 By2006–2008, 15% of US children werediagnosed with a developmentaldisability, a 17% increase since1997.3
Pregnancy obesity has beenassociated with increased systemicinflammation, altered endocrineresponses, and insulin resistance.6,7
Although associations betweenmaternal obesity and pregnancycomplications are well documented,less is known about longer-term childoutcomes. There is growing concernabout neurologic effects.8,9 Recentepidemiologic studies suggestassociations between prepregnancyobesity and variousneurodevelopmental outcomes.10–21
However, these studies were limitedby small sample sizes, insufficientinformation on confounders andmediators, and impreciseneurodevelopment measures.Additionally, 1 study reported noassociation.22
Using a larger sample from a USlongitudinal study than most previousstudies, we addressed many previousstudy limitations. We examinedassociations between maternalprepregnancy BMI and subsequentchild psychosocial development usingmultiple, complementary outcomemeasures: parent report of children’sdifficulties, specific developmentaldisability diagnoses, and receipt ofspecial needs services. Thus, weexpanded on many previous studies’findings that focused more narrowlyon cognitive performance10,13,14,17,21
and incorporated measures ofdevelopmental difficulties not solelydependent on a past diagnosis orparents specifically seeking services,but also measures based on parents’direct observations. Additionally, weexamined the effects of numerousfactors potentially in the causal
pathway, including pregnancy weightgain, gestational diabetes,breastfeeding, and postpartumdepression.
METHODS
Study Population
The Infant Feeding Practices Study II(IFPS II) includes participants froma nationally distributed consumeropinion panel, which followedmother–infant pairs from the thirdtrimester of pregnancy throughinfants’ first year of life.23
Information on infants’ feeding andhealth and mothers’ health werecollected from 2005 to 2007. Allinfants included in IFPS II weredelivered at $35 weeks. Among 4902pregnant women who began IFPS II,3033 answered the neonatal (month1) questionnaire and were contactedfor the Year 6 Follow-Up (Y6FU) in2012; 2958 mother–child pairs meteligibility criteria, and 1542 mothers(52.1%) completed the self-administered questionnaire on theirchild’s health and development.Overall, Y6FU respondents were morelikely than nonrespondents to be ofhigher socioeconomic status (SES),older, and white and to have receivedearly prenatal care. However,respondents were not different fromnonrespondents on employmentstatus, parity, or prepregnancy BMI.Children of respondents had longerdurations of breastfeeding and wereless likely to receive public assistancethan children of nonrespondents.There were no differences betweenthe 2 groups on breastfeedinginitiation, birth weight, or gestationalage. Additional details on the IFPS IIand Y6FU are publishedelsewhere.23,24
Maternal Prepregnancy BMI
The IFPS II collected data on mother’sprepregnancy height and weight viamaternal report. Prepregnancy BMIwas calculated and categorized:underweight (BMI ,18.5), normalweight (BMI 18.5–24.9), overweight
(BMI 25.0–29.9), obese class I (BMI30.0–34.9), and obese class II/III(BMI $35.0).25
Child Psychosocial Development atAge 6
Strengths and Difficulties QuestionnaireScores
The Y6FU included the Strengths andDifficulties Questionnaire (SDQ),a behavioral screening questionnaireconsisting of 25 attributes subdividedinto 5 subscales: emotionalsymptoms, conduct problems,hyperactivity, peer problems, andprosocial behavior.26 Mothersindicated how much each attributepertained to their child during thepast 6 months (not true, somewhattrue, and certainly true). Eachattribute was thus scored as 0 to 2,and each subscale, based on thecompilation of 5 individual attributes,was scored as 0 to 10. Subscale scoreswere categorized as low, moderate,and high difficulties based onestablished criteria.27,28 The specificcutoff points used to distinguish low,moderate, and high difficulties variedfor each subscale; they were chosenbased on empirical assessment tocorrespond to specific frequencydistributions for each subscale in a USpopulation-based sample.27 The totaldifficulties score was the sum of 4subscales; prosocial behavior (theonly positive scale) was notconsidered in the total difficultiescalculation.26 The total difficultiesscore was categorized analogously tothe subscale scores. In our finalanalyses, we dichotomized 4 SDQsubscale scores and the totaldifficulties score as low versusmoderate/high difficulties. Wesubsequently refer to children withmoderate/high difficulties as simplyhaving “difficulties.” We dichotomizedthe prosocial behavior subscale scoreas high versus low/moderatedifficulties.
Developmental Diagnoses
Mothers were asked whether theirchild had ever been diagnosed by
PEDIATRICS Volume 135, number 5, May 2015 e1199 by guest on April 8, 2019www.aappublications.org/newsDownloaded from
a doctor or other health professionalwith attention-deficit (hyperactivity)disorder (ADD/ADHD), autism ordevelopmental delay (autism/DD),depression or anxiety, or hearingproblems. A diagnosis of autism/DDwas included as a single item in thesurvey because of sample sizeconstraints; thus, we could notexamine the 2 diagnoses separately.
Receipt of Special Needs Services
Mothers also indicated special needsservices their child received duringthe past school year: speech orlanguage therapy; occupationaltherapy or other therapy for helpwith handwriting or motor skills;special instruction or help in $1school subject; special services forvision or hearing problems;psychological services or counselingbecause of a problem with emotions,behavior, or socialization; behavioralsupport, such as behaviormanagement plan or individualclassroom support; other services; orno services received. We assessedeach service separately, and wecreated a composite variable, receiptof any special needs service.
Covariates
Covariates were chosen a priori basedon previous research examiningmaternal weight and childdevelopment associations. Potentialconfounders included maternal age,race or ethnicity, marital status,education level, poverty-to-incomeratio, parity, smoking duringpregnancy, child gender, child’scurrent weight (via maternal report),and level of child’s enrichmentactivities. We dichotomized “any”enrichment versus “none” based onwhether mothers reported readingaloud to their child $3 times perweek, child participated in speciallessons or organizations, or both.
Potential causal pathway factorsincluded pregnancy weight gain,gestational diabetes, breastfeedingduration, postpartum depression, andchild’s birth weight. Mother’s
pregnancy weight gain wascategorized as inadequate, adequate,and more than adequate based on2009 Institute of Medicineguidelines.29 Breastfeeding wascategorized as never, ,6 months, $6months/exclusively ,3 months, and$6 months/exclusively $3 months.Child’s birth weight for gestationalage was calculated according toa national reference30 andcategorized as small (,10thpercentile), appropriate (10th–90thpercentile), and large for gestationalage (.90th percentile). Postpartumdepression was based on theEdinburgh Postnatal DepressionScale.31 Because ∼10% of motherswere missing responses topostpartum depression, we createda separate “not-specified” category tomaximize model sample sizes. Inaddition to postpartum depression,we assessed maternal history of anypsychiatric condition; however, weincluded only the more specific andproximal outcome, postpartumdepression, in our final analysesbecause the 2 variables werecorrelated and the findings using eachvariable were analogous.
Statistical Analyses
Our final sample sizes varied byoutcomes. Among the 1542mother–child pairs in the Y6FU, 1241mothers had complete prepregnancyBMI information and covariates toexamine child’s SDQ scores; 1311 hadsufficient data to examine child’sdevelopmental diagnoses; and 1253had sufficient data to examine child’sreceipt of special needs services. Wealso assessed the 1166 mother–childpairs with complete information onall 3 outcome types; findings werecomparable to those from theaforementioned samples (data notshown). Thus, we present the findingsbased on the larger samples. We alsocompared the characteristics of thefinal analytic samples to mother–childpairs excluded from each outcome-specific analysis. Excluded motherswere more likely to be underweight
or obese class I and less likely to be$30 years of age, married, a collegegraduate, and to have breastfed .6months. Excluded children were morelikely to have been small forgestational age and to have severalneurodevelopmental outcomes.
We conducted bivariate analysescomparing the proportion of childrenwith each developmental outcome(moderate/high difficulties for eachSDQ domain, previous diagnosis ofeach developmental condition, andreceipt of each special needs service)by maternal BMI. Stratified analyseswere conducted to assess possibleeffect modifications betweenprepregnancy BMI and each of thecovariates and between prepregnancyBMI and each of the potential causalpathway factors. We observed onlyvariable estimates within gestationaldiabetes and birth weight strata; weassessed effect modificationstatistically for those 2 factors byusing likelihood ratio tests.
By using multivariable logisticregression models, we found noevidence of multicollinearity betweenincluded variables for any model. Foreach outcome, 2 models wereconstructed: The first includedmaternal prepregnancy BMI and allpotential confounders; the secondincluded maternal prepregnancy BMI,all potential confounders, and allpotential causal pathway factors. Weconducted all analyses by using SAS9.3 (SAS Institute, Inc, Cary, NC).
RESULTS
Before pregnancy, 4.0% of motherswere underweight, 45.8% werenormal weight, 25.4% wereoverweight, 12.6% were obese class I,and 12.2% were obese class II/III.Maternal age was markedly lower forunderweight mothers and notablyhigher for obese class II/III mothersthan normal weight mothers(Table 1). Obese class II/III mothershad the highest proportions of highschool education or less, inadequate
e1200 JO et al by guest on April 8, 2019www.aappublications.org/newsDownloaded from
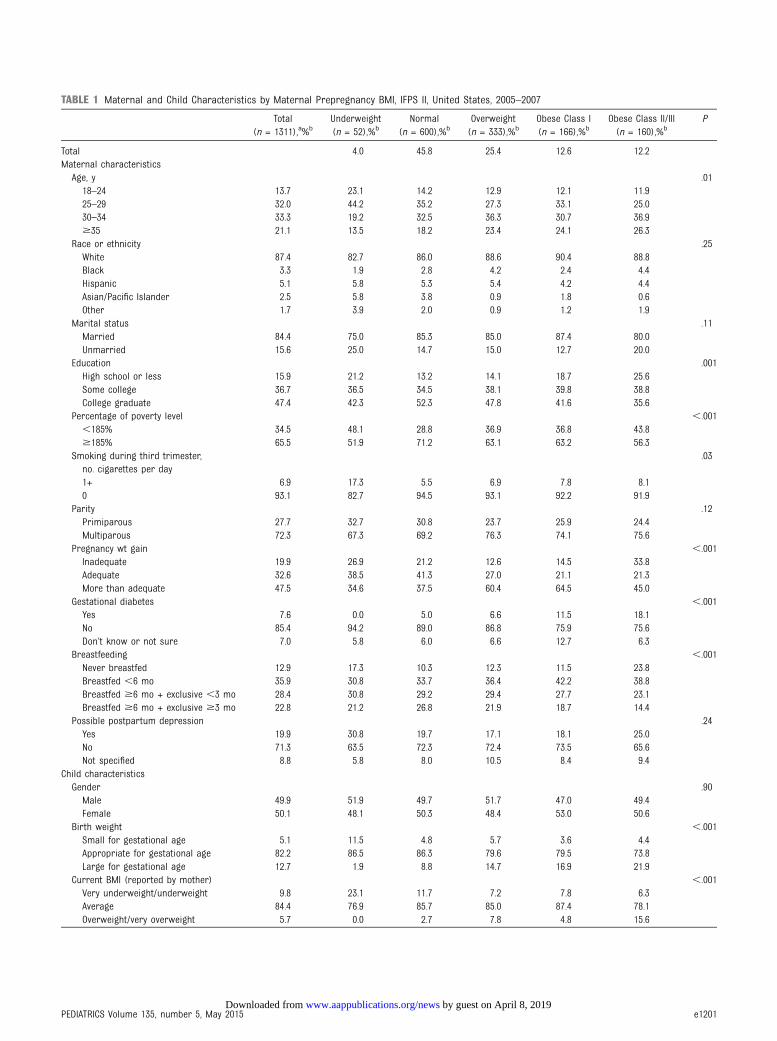
TABLE 1 Maternal and Child Characteristics by Maternal Prepregnancy BMI, IFPS II, United States, 2005–2007
Total(n = 1311),a%b
Underweight(n = 52),%b
Normal(n = 600),%b
Overweight(n = 333),%b
Obese Class I(n = 166),%b
Obese Class II/III(n = 160),%b
P
Total 4.0 45.8 25.4 12.6 12.2Maternal characteristicsAge, y .0118–24 13.7 23.1 14.2 12.9 12.1 11.925–29 32.0 44.2 35.2 27.3 33.1 25.030–34 33.3 19.2 32.5 36.3 30.7 36.9$35 21.1 13.5 18.2 23.4 24.1 26.3
Race or ethnicity .25White 87.4 82.7 86.0 88.6 90.4 88.8Black 3.3 1.9 2.8 4.2 2.4 4.4Hispanic 5.1 5.8 5.3 5.4 4.2 4.4Asian/Pacific Islander 2.5 5.8 3.8 0.9 1.8 0.6Other 1.7 3.9 2.0 0.9 1.2 1.9
Marital status .11Married 84.4 75.0 85.3 85.0 87.4 80.0Unmarried 15.6 25.0 14.7 15.0 12.7 20.0
Education .001High school or less 15.9 21.2 13.2 14.1 18.7 25.6Some college 36.7 36.5 34.5 38.1 39.8 38.8College graduate 47.4 42.3 52.3 47.8 41.6 35.6
Percentage of poverty level ,.001,185% 34.5 48.1 28.8 36.9 36.8 43.8$185% 65.5 51.9 71.2 63.1 63.2 56.3
Smoking during third trimester,no. cigarettes per day
.03
1+ 6.9 17.3 5.5 6.9 7.8 8.10 93.1 82.7 94.5 93.1 92.2 91.9
Parity .12Primiparous 27.7 32.7 30.8 23.7 25.9 24.4Multiparous 72.3 67.3 69.2 76.3 74.1 75.6
Pregnancy wt gain ,.001Inadequate 19.9 26.9 21.2 12.6 14.5 33.8Adequate 32.6 38.5 41.3 27.0 21.1 21.3More than adequate 47.5 34.6 37.5 60.4 64.5 45.0
Gestational diabetes ,.001Yes 7.6 0.0 5.0 6.6 11.5 18.1No 85.4 94.2 89.0 86.8 75.9 75.6Don’t know or not sure 7.0 5.8 6.0 6.6 12.7 6.3
Breastfeeding ,.001Never breastfed 12.9 17.3 10.3 12.3 11.5 23.8Breastfed ,6 mo 35.9 30.8 33.7 36.4 42.2 38.8Breastfed $6 mo + exclusive ,3 mo 28.4 30.8 29.2 29.4 27.7 23.1Breastfed $6 mo + exclusive $3 mo 22.8 21.2 26.8 21.9 18.7 14.4
Possible postpartum depression .24Yes 19.9 30.8 19.7 17.1 18.1 25.0No 71.3 63.5 72.3 72.4 73.5 65.6Not specified 8.8 5.8 8.0 10.5 8.4 9.4
Child characteristicsGender .90Male 49.9 51.9 49.7 51.7 47.0 49.4Female 50.1 48.1 50.3 48.4 53.0 50.6
Birth weight ,.001Small for gestational age 5.1 11.5 4.8 5.7 3.6 4.4Appropriate for gestational age 82.2 86.5 86.3 79.6 79.5 73.8Large for gestational age 12.7 1.9 8.8 14.7 16.9 21.9
Current BMI (reported by mother) ,.001Very underweight/underweight 9.8 23.1 11.7 7.2 7.8 6.3Average 84.4 76.9 85.7 85.0 87.4 78.1Overweight/very overweight 5.7 0.0 2.7 7.8 4.8 15.6
PEDIATRICS Volume 135, number 5, May 2015 e1201 by guest on April 8, 2019www.aappublications.org/newsDownloaded from
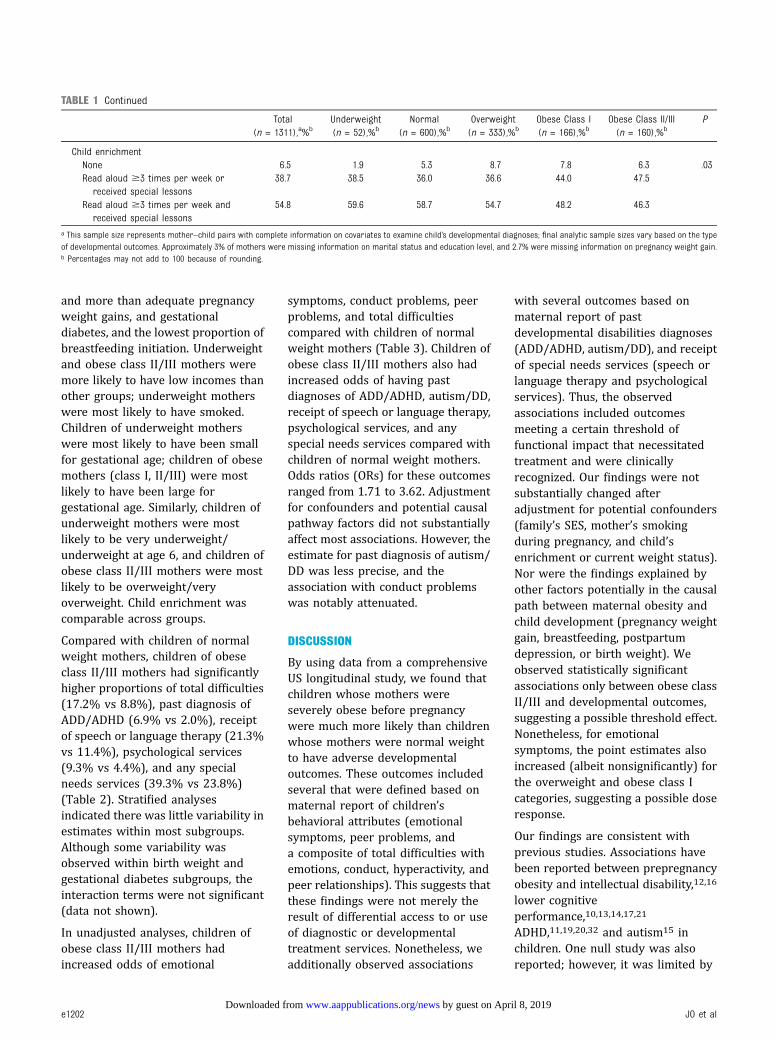
and more than adequate pregnancyweight gains, and gestationaldiabetes, and the lowest proportion ofbreastfeeding initiation. Underweightand obese class II/III mothers weremore likely to have low incomes thanother groups; underweight motherswere most likely to have smoked.Children of underweight motherswere most likely to have been smallfor gestational age; children of obesemothers (class I, II/III) were mostlikely to have been large forgestational age. Similarly, children ofunderweight mothers were mostlikely to be very underweight/underweight at age 6, and children ofobese class II/III mothers were mostlikely to be overweight/veryoverweight. Child enrichment wascomparable across groups.
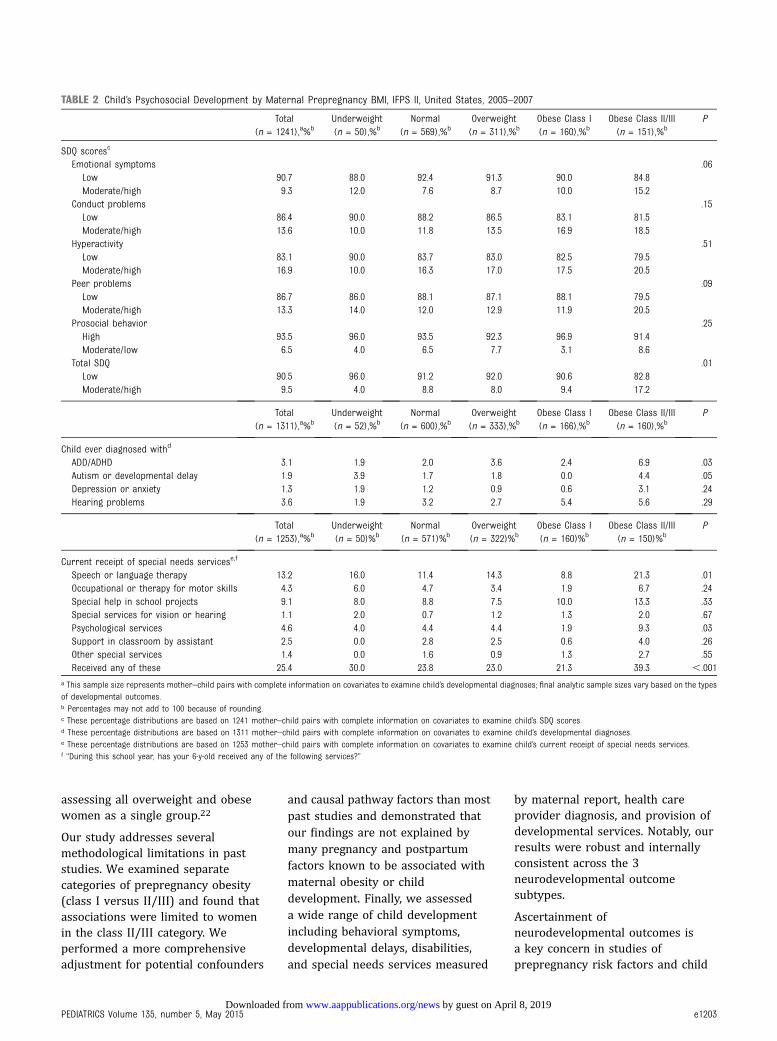
Compared with children of normalweight mothers, children of obeseclass II/III mothers had significantlyhigher proportions of total difficulties(17.2% vs 8.8%), past diagnosis ofADD/ADHD (6.9% vs 2.0%), receiptof speech or language therapy (21.3%vs 11.4%), psychological services(9.3% vs 4.4%), and any specialneeds services (39.3% vs 23.8%)(Table 2). Stratified analysesindicated there was little variability inestimates within most subgroups.Although some variability wasobserved within birth weight andgestational diabetes subgroups, theinteraction terms were not significant(data not shown).
In unadjusted analyses, children ofobese class II/III mothers hadincreased odds of emotional
symptoms, conduct problems, peerproblems, and total difficultiescompared with children of normalweight mothers (Table 3). Children ofobese class II/III mothers also hadincreased odds of having pastdiagnoses of ADD/ADHD, autism/DD,receipt of speech or language therapy,psychological services, and anyspecial needs services compared withchildren of normal weight mothers.Odds ratios (ORs) for these outcomesranged from 1.71 to 3.62. Adjustmentfor confounders and potential causalpathway factors did not substantiallyaffect most associations. However, theestimate for past diagnosis of autism/DD was less precise, and theassociation with conduct problemswas notably attenuated.
DISCUSSION
By using data from a comprehensiveUS longitudinal study, we found thatchildren whose mothers wereseverely obese before pregnancywere much more likely than childrenwhose mothers were normal weightto have adverse developmentaloutcomes. These outcomes includedseveral that were defined based onmaternal report of children’sbehavioral attributes (emotionalsymptoms, peer problems, anda composite of total difficulties withemotions, conduct, hyperactivity, andpeer relationships). This suggests thatthese findings were not merely theresult of differential access to or useof diagnostic or developmentaltreatment services. Nonetheless, weadditionally observed associations
with several outcomes based onmaternal report of pastdevelopmental disabilities diagnoses(ADD/ADHD, autism/DD), and receiptof special needs services (speech orlanguage therapy and psychologicalservices). Thus, the observedassociations included outcomesmeeting a certain threshold offunctional impact that necessitatedtreatment and were clinicallyrecognized. Our findings were notsubstantially changed afteradjustment for potential confounders(family’s SES, mother’s smokingduring pregnancy, and child’senrichment or current weight status).Nor were the findings explained byother factors potentially in the causalpath between maternal obesity andchild development (pregnancy weightgain, breastfeeding, postpartumdepression, or birth weight). Weobserved statistically significantassociations only between obese classII/III and developmental outcomes,suggesting a possible threshold effect.Nonetheless, for emotionalsymptoms, the point estimates alsoincreased (albeit nonsignificantly) forthe overweight and obese class Icategories, suggesting a possible doseresponse.
Our findings are consistent withprevious studies. Associations havebeen reported between prepregnancyobesity and intellectual disability,12,16
lower cognitiveperformance,10,13,14,17,21
ADHD,11,19,20,32 and autism15 inchildren. One null study was alsoreported; however, it was limited by
TABLE 1 Continued
Total(n = 1311),a%b
Underweight(n = 52),%b
Normal(n = 600),%b
Overweight(n = 333),%b
Obese Class I(n = 166),%b
Obese Class II/III(n = 160),%b
P
Child enrichmentNone 6.5 1.9 5.3 8.7 7.8 6.3 .03Read aloud $3 times per week or
received special lessons38.7 38.5 36.0 36.6 44.0 47.5
Read aloud $3 times per week andreceived special lessons
54.8 59.6 58.7 54.7 48.2 46.3
a This sample size represents mother–child pairs with complete information on covariates to examine child’s developmental diagnoses; final analytic sample sizes vary based on the typeof developmental outcomes. Approximately 3% of mothers were missing information on marital status and education level, and 2.7% were missing information on pregnancy weight gain.b Percentages may not add to 100 because of rounding.
e1202 JO et al by guest on April 8, 2019www.aappublications.org/newsDownloaded from
assessing all overweight and obesewomen as a single group.22
Our study addresses severalmethodological limitations in paststudies. We examined separatecategories of prepregnancy obesity(class I versus II/III) and found thatassociations were limited to womenin the class II/III category. Weperformed a more comprehensiveadjustment for potential confounders
and causal pathway factors than mostpast studies and demonstrated thatour findings are not explained bymany pregnancy and postpartumfactors known to be associated withmaternal obesity or childdevelopment. Finally, we assesseda wide range of child developmentincluding behavioral symptoms,developmental delays, disabilities,and special needs services measured
by maternal report, health careprovider diagnosis, and provision ofdevelopmental services. Notably, ourresults were robust and internallyconsistent across the 3neurodevelopmental outcomesubtypes.
Ascertainment ofneurodevelopmental outcomes isa key concern in studies ofprepregnancy risk factors and child
TABLE 2 Child’s Psychosocial Development by Maternal Prepregnancy BMI, IFPS II, United States, 2005–2007
Total(n = 1241),a%b
Underweight(n = 50),%b
Normal(n = 569),%b
Overweight(n = 311),%b
Obese Class I(n = 160),%b
Obese Class II/III(n = 151),%b
P
SDQ scoresc
Emotional symptoms .06Low 90.7 88.0 92.4 91.3 90.0 84.8Moderate/high 9.3 12.0 7.6 8.7 10.0 15.2
Conduct problems .15Low 86.4 90.0 88.2 86.5 83.1 81.5Moderate/high 13.6 10.0 11.8 13.5 16.9 18.5
Hyperactivity .51Low 83.1 90.0 83.7 83.0 82.5 79.5Moderate/high 16.9 10.0 16.3 17.0 17.5 20.5
Peer problems .09Low 86.7 86.0 88.1 87.1 88.1 79.5Moderate/high 13.3 14.0 12.0 12.9 11.9 20.5
Prosocial behavior .25High 93.5 96.0 93.5 92.3 96.9 91.4Moderate/low 6.5 4.0 6.5 7.7 3.1 8.6
Total SDQ .01Low 90.5 96.0 91.2 92.0 90.6 82.8Moderate/high 9.5 4.0 8.8 8.0 9.4 17.2
Total(n = 1311),a%b
Underweight(n = 52),%b
Normal(n = 600),%b
Overweight(n = 333),%b
Obese Class I(n = 166),%b
Obese Class II/III(n = 160),%b
P
Child ever diagnosed withd
ADD/ADHD 3.1 1.9 2.0 3.6 2.4 6.9 .03Autism or developmental delay 1.9 3.9 1.7 1.8 0.0 4.4 .05Depression or anxiety 1.3 1.9 1.2 0.9 0.6 3.1 .24Hearing problems 3.6 1.9 3.2 2.7 5.4 5.6 .29
Total(n = 1253),a%b
Underweight(n = 50)%b
Normal(n = 571)%b
Overweight(n = 322)%b
Obese Class I(n = 160)%b
Obese Class II/III(n = 150)%b
P
Current receipt of special needs servicese,f
Speech or language therapy 13.2 16.0 11.4 14.3 8.8 21.3 .01Occupational or therapy for motor skills 4.3 6.0 4.7 3.4 1.9 6.7 .24Special help in school projects 9.1 8.0 8.8 7.5 10.0 13.3 .33Special services for vision or hearing 1.1 2.0 0.7 1.2 1.3 2.0 .67Psychological services 4.6 4.0 4.4 4.4 1.9 9.3 .03Support in classroom by assistant 2.5 0.0 2.8 2.5 0.6 4.0 .26Other special services 1.4 0.0 1.6 0.9 1.3 2.7 .55Received any of these 25.4 30.0 23.8 23.0 21.3 39.3 ,.001
a This sample size represents mother–child pairs with complete information on covariates to examine child’s developmental diagnoses; final analytic sample sizes vary based on the typesof developmental outcomes.b Percentages may not add to 100 because of rounding.c These percentage distributions are based on 1241 mother–child pairs with complete information on covariates to examine child’s SDQ scores.d These percentage distributions are based on 1311 mother–child pairs with complete information on covariates to examine child’s developmental diagnoses.e These percentage distributions are based on 1253 mother–child pairs with complete information on covariates to examine child’s current receipt of special needs services.f “During this school year, has your 6-y-old received any of the following services?”
PEDIATRICS Volume 135, number 5, May 2015 e1203 by guest on April 8, 2019www.aappublications.org/newsDownloaded from
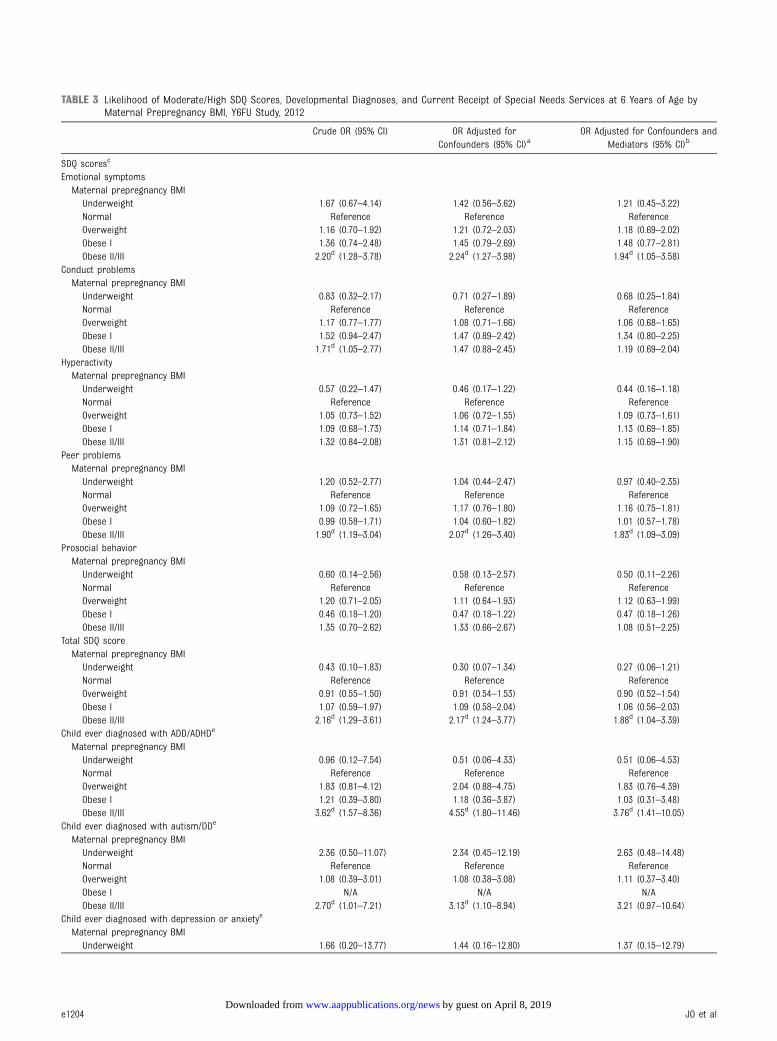
TABLE 3 Likelihood of Moderate/High SDQ Scores, Developmental Diagnoses, and Current Receipt of Special Needs Services at 6 Years of Age byMaternal Prepregnancy BMI, Y6FU Study, 2012
Crude OR (95% CI) OR Adjusted forConfounders (95% CI)a
OR Adjusted for Confounders andMediators (95% CI)b
SDQ scoresc
Emotional symptomsMaternal prepregnancy BMIUnderweight 1.67 (0.67–4.14) 1.42 (0.56–3.62) 1.21 (0.45–3.22)Normal Reference Reference ReferenceOverweight 1.16 (0.70–1.92) 1.21 (0.72–2.03) 1.18 (0.69–2.02)Obese I 1.36 (0.74–2.48) 1.45 (0.79–2.69) 1.48 (0.77–2.81)Obese II/III 2.20d (1.28–3.78) 2.24d (1.27–3.98) 1.94d (1.05–3.58)
Conduct problemsMaternal prepregnancy BMIUnderweight 0.83 (0.32–2.17) 0.71 (0.27–1.89) 0.68 (0.25–1.84)Normal Reference Reference ReferenceOverweight 1.17 (0.77–1.77) 1.08 (0.71–1.66) 1.06 (0.68–1.65)Obese I 1.52 (0.94–2.47) 1.47 (0.89–2.42) 1.34 (0.80–2.25)Obese II/III 1.71d (1.05–2.77) 1.47 (0.88–2.45) 1.19 (0.69–2.04)
HyperactivityMaternal prepregnancy BMIUnderweight 0.57 (0.22–1.47) 0.46 (0.17–1.22) 0.44 (0.16–1.18)Normal Reference Reference ReferenceOverweight 1.05 (0.73–1.52) 1.06 (0.72–1.55) 1.09 (0.73–1.61)Obese I 1.09 (0.68–1.73) 1.14 (0.71–1.84) 1.13 (0.69–1.85)Obese II/III 1.32 (0.84–2.08) 1.31 (0.81–2.12) 1.15 (0.69–1.90)
Peer problemsMaternal prepregnancy BMIUnderweight 1.20 (0.52–2.77) 1.04 (0.44–2.47) 0.97 (0.40–2.35)Normal Reference Reference ReferenceOverweight 1.09 (0.72–1.65) 1.17 (0.76–1.80) 1.16 (0.75–1.81)Obese I 0.99 (0.58–1.71) 1.04 (0.60–1.82) 1.01 (0.57–1.78)Obese II/III 1.90d (1.19–3.04) 2.07d (1.26–3.40) 1.83d (1.09–3.09)
Prosocial behaviorMaternal prepregnancy BMIUnderweight 0.60 (0.14–2.56) 0.58 (0.13–2.57) 0.50 (0.11–2.26)Normal Reference Reference ReferenceOverweight 1.20 (0.71–2.05) 1.11 (0.64–1.93) 1.12 (0.63–1.99)Obese I 0.46 (0.18–1.20) 0.47 (0.18–1.22) 0.47 (0.18–1.26)Obese II/III 1.35 (0.70–2.62) 1.33 (0.66–2.67) 1.08 (0.51–2.25)
Total SDQ scoreMaternal prepregnancy BMIUnderweight 0.43 (0.10–1.83) 0.30 (0.07–1.34) 0.27 (0.06–1.21)Normal Reference Reference ReferenceOverweight 0.91 (0.55–1.50) 0.91 (0.54–1.53) 0.90 (0.52–1.54)Obese I 1.07 (0.59–1.97) 1.09 (0.58–2.04) 1.06 (0.56–2.03)Obese II/III 2.16d (1.29–3.61) 2.17d (1.24–3.77) 1.88d (1.04–3.39)
Child ever diagnosed with ADD/ADHDe
Maternal prepregnancy BMIUnderweight 0.96 (0.12–7.54) 0.51 (0.06–4.33) 0.51 (0.06–4.53)Normal Reference Reference ReferenceOverweight 1.83 (0.81–4.12) 2.04 (0.88–4.75) 1.83 (0.76–4.39)Obese I 1.21 (0.39–3.80) 1.18 (0.36–3.87) 1.03 (0.31–3.48)Obese II/III 3.62d (1.57–8.36) 4.55d (1.80–11.46) 3.76d (1.41–10.05)
Child ever diagnosed with autism/DDe
Maternal prepregnancy BMIUnderweight 2.36 (0.50–11.07) 2.34 (0.45–12.19) 2.63 (0.48–14.48)Normal Reference Reference ReferenceOverweight 1.08 (0.39–3.01) 1.08 (0.38–3.08) 1.11 (0.37–3.40)Obese I N/A N/A N/AObese II/III 2.70d (1.01–7.21) 3.13d (1.10–8.94) 3.21 (0.97–10.64)
Child ever diagnosed with depression or anxietye
Maternal prepregnancy BMIUnderweight 1.66 (0.20–13.77) 1.44 (0.16–12.80) 1.37 (0.15–12.79)
e1204 JO et al by guest on April 8, 2019www.aappublications.org/newsDownloaded from
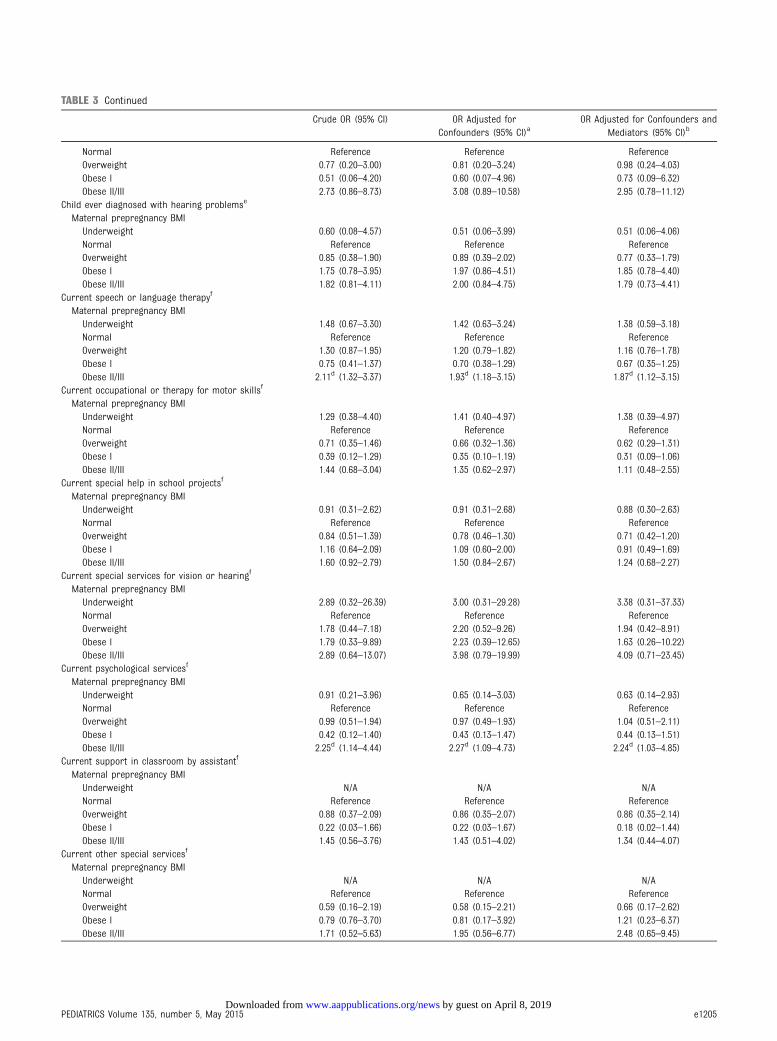
TABLE 3 Continued
Crude OR (95% CI) OR Adjusted forConfounders (95% CI)a
OR Adjusted for Confounders andMediators (95% CI)b
Normal Reference Reference ReferenceOverweight 0.77 (0.20–3.00) 0.81 (0.20–3.24) 0.98 (0.24–4.03)Obese I 0.51 (0.06–4.20) 0.60 (0.07–4.96) 0.73 (0.09–6.32)Obese II/III 2.73 (0.86–8.73) 3.08 (0.89–10.58) 2.95 (0.78–11.12)
Child ever diagnosed with hearing problemse
Maternal prepregnancy BMIUnderweight 0.60 (0.08–4.57) 0.51 (0.06–3.99) 0.51 (0.06–4.06)Normal Reference Reference ReferenceOverweight 0.85 (0.38–1.90) 0.89 (0.39–2.02) 0.77 (0.33–1.79)Obese I 1.75 (0.78–3.95) 1.97 (0.86–4.51) 1.85 (0.78–4.40)Obese II/III 1.82 (0.81–4.11) 2.00 (0.84–4.75) 1.79 (0.73–4.41)
Current speech or language therapyf
Maternal prepregnancy BMIUnderweight 1.48 (0.67–3.30) 1.42 (0.63–3.24) 1.38 (0.59–3.18)Normal Reference Reference ReferenceOverweight 1.30 (0.87–1.95) 1.20 (0.79–1.82) 1.16 (0.76–1.78)Obese I 0.75 (0.41–1.37) 0.70 (0.38–1.29) 0.67 (0.35–1.25)Obese II/III 2.11d (1.32–3.37) 1.93d (1.18–3.15) 1.87d (1.12–3.15)
Current occupational or therapy for motor skillsf
Maternal prepregnancy BMIUnderweight 1.29 (0.38–4.40) 1.41 (0.40–4.97) 1.38 (0.39–4.97)Normal Reference Reference ReferenceOverweight 0.71 (0.35–1.46) 0.66 (0.32–1.36) 0.62 (0.29–1.31)Obese I 0.39 (0.12–1.29) 0.35 (0.10–1.19) 0.31 (0.09–1.06)Obese II/III 1.44 (0.68–3.04) 1.35 (0.62–2.97) 1.11 (0.48–2.55)
Current special help in school projectsf
Maternal prepregnancy BMIUnderweight 0.91 (0.31–2.62) 0.91 (0.31–2.68) 0.88 (0.30–2.63)Normal Reference Reference ReferenceOverweight 0.84 (0.51–1.39) 0.78 (0.46–1.30) 0.71 (0.42–1.20)Obese I 1.16 (0.64–2.09) 1.09 (0.60–2.00) 0.91 (0.49–1.69)Obese II/III 1.60 (0.92–2.79) 1.50 (0.84–2.67) 1.24 (0.68–2.27)
Current special services for vision or hearingf
Maternal prepregnancy BMIUnderweight 2.89 (0.32–26.39) 3.00 (0.31–29.28) 3.38 (0.31–37.33)Normal Reference Reference ReferenceOverweight 1.78 (0.44–7.18) 2.20 (0.52–9.26) 1.94 (0.42–8.91)Obese I 1.79 (0.33–9.89) 2.23 (0.39–12.65) 1.63 (0.26–10.22)Obese II/III 2.89 (0.64–13.07) 3.98 (0.79–19.99) 4.09 (0.71–23.45)
Current psychological servicesf
Maternal prepregnancy BMIUnderweight 0.91 (0.21–3.96) 0.65 (0.14–3.03) 0.63 (0.14–2.93)Normal Reference Reference ReferenceOverweight 0.99 (0.51–1.94) 0.97 (0.49–1.93) 1.04 (0.51–2.11)Obese I 0.42 (0.12–1.40) 0.43 (0.13–1.47) 0.44 (0.13–1.51)Obese II/III 2.25d (1.14–4.44) 2.27d (1.09–4.73) 2.24d (1.03–4.85)
Current support in classroom by assistantf
Maternal prepregnancy BMIUnderweight N/A N/A N/ANormal Reference Reference ReferenceOverweight 0.88 (0.37–2.09) 0.86 (0.35–2.07) 0.86 (0.35–2.14)Obese I 0.22 (0.03–1.66) 0.22 (0.03–1.67) 0.18 (0.02–1.44)Obese II/III 1.45 (0.56–3.76) 1.43 (0.51–4.02) 1.34 (0.44–4.07)
Current other special servicesf
Maternal prepregnancy BMIUnderweight N/A N/A N/ANormal Reference Reference ReferenceOverweight 0.59 (0.16–2.19) 0.58 (0.15–2.21) 0.66 (0.17–2.62)Obese I 0.79 (0.76–3.70) 0.81 (0.17–3.92) 1.21 (0.23–6.37)Obese II/III 1.71 (0.52–5.63) 1.95 (0.56–6.77) 2.48 (0.65–9.45)
PEDIATRICS Volume 135, number 5, May 2015 e1205 by guest on April 8, 2019www.aappublications.org/newsDownloaded from
neurodevelopment because of thelack of specific diagnostic biomarkers.Outcome measures rely on parent orprovider observations or child’sresponses on a standardized test.Tests of cognitive skills orachievement such as reading, mathability, and achievement tests areprobably highly influenced by thechild’s early enrichmentopportunities and other familysociodemographic factors33;therefore, using such tests tospecifically assess prenatal orpreconceptional influences on childneurodevelopment presents inherentdifficulties. Despite control ofsociodemographic confounders, thepossibility of unmeasuredconfounding remains. Measuresrelying on specific diagnoses orplacement in developmental servicesare helpful because they require somethreshold level of developmentaldeficit that meets diagnostic criteriaor to a lesser extent, service receiptcriteria. However, developmentaldiagnoses and special educationplacements are often subject toparents’ access and ability to navigatecomplex health and educationalsystems and cultural or individualfactors that might influence parents’recognition of developmental delaysand treatment-seeking behavior.34,35
Because there is no biologic measure
to serve as the gold standard fordefining neurodevelopmental impact,using multiple measures withdiffering strengths and limitationsallowed us to assess the internalvalidity of our findings.
Our assessment of SDQ scores was animportant supplement to ourmeasures based on diagnoses andservice receipt. In the SDQ, parentsare simply asked about individualbehavioral attributes such as“considerate of other people’sfeelings” or “is easily distracted,concentration wanders.” Thus,responses are probably less driven byparents’ concerns about specificdiagnoses. SDQ outcomes are also notaffected by access to or use ofservices.
Only 1 other study has conducteda comprehensive assessment by usingmultiple measures ofneurodevelopmental outcome. Hinkleet al14 reported associations betweenprepregnancy maternal class II/IIIobesity and both past diagnoses oflearning or behavioral developmentaldisabilities and lower scores onstandardized reading tests at age 5.Although the specific outcomes weredifferent, the findings are generallyconsistent with those reported here.
Additional studies are needed toelucidate the underlying mechanisms
of these associations. It has beenhypothesized that increased systemicinflammation associated withmaternal obesity alters fetal braindevelopment and makes the brainmore vulnerable to otherenvironmental factors, which maylead to the increased risk forcognitive disabilities.8,36 Additionally,prepregnancy obesity increases therisk of numerous pregnancycomplications.6
We did not observe an independentassociation between any outcome andexcessive pregnancy weight gain.Although this finding is consistentwith several studies,16,17,37 2 recentstudies reported positiveassociations. Rodriguez et al19 foundthat excessive pregnancy weight gainamong obese women increasedchildren’s ADHD risk. Bilder et al38
reported an association betweenautism spectrum disorder and highpregnancy weight gain, independentof prepregnancy BMI; however, thelatter study examined prepregnancyBMI as a continuous variable anddid not assess interactionsbetween prepregnancy BMI andweight gain.
Despite its strengths, this study alsohas potential limitations. Althoughour sample includes a large cohortfollowed longitudinally, it was not
TABLE 3 Continued
Crude OR (95% CI) OR Adjusted forConfounders (95% CI)a
OR Adjusted for Confounders andMediators (95% CI)b
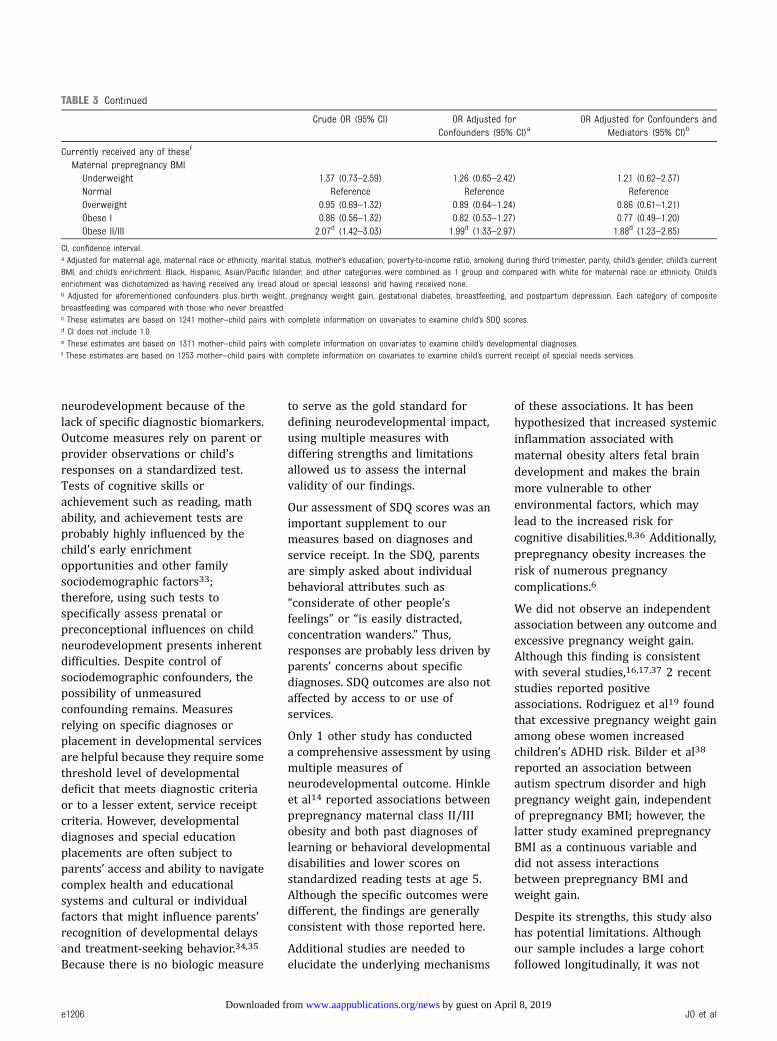
Currently received any of thesef
Maternal prepregnancy BMIUnderweight 1.37 (0.73–2.59) 1.26 (0.65–2.42) 1.21 (0.62–2.37)Normal Reference Reference ReferenceOverweight 0.95 (0.69–1.32) 0.89 (0.64–1.24) 0.86 (0.61–1.21)Obese I 0.86 (0.56–1.32) 0.82 (0.53–1.27) 0.77 (0.49–1.20)Obese II/III 2.07d (1.42–3.03) 1.99d (1.33–2.97) 1.88d (1.23–2.85)
CI, confidence interval.a Adjusted for maternal age, maternal race or ethnicity, marital status, mother’s education, poverty-to-income ratio, smoking during third trimester, parity, child’s gender, child’s currentBMI, and child’s enrichment. Black, Hispanic, Asian/Pacific Islander, and other categories were combined as 1 group and compared with white for maternal race or ethnicity. Child’senrichment was dichotomized as having received any (read aloud or special lessons) and having received none.b Adjusted for aforementioned confounders plus birth weight, pregnancy weight gain, gestational diabetes, breastfeeding, and postpartum depression. Each category of compositebreastfeeding was compared with those who never breastfed.c These estimates are based on 1241 mother–child pairs with complete information on covariates to examine child’s SDQ scores.d CI does not include 1.0.e These estimates are based on 1311 mother–child pairs with complete information on covariates to examine child’s developmental diagnoses.f These estimates are based on 1253 mother–child pairs with complete information on covariates to examine child’s current receipt of special needs services.
e1206 JO et al by guest on April 8, 2019www.aappublications.org/newsDownloaded from
nationally representative;mother–child pairs in this study wereless likely to be nonwhite or low SESthan mother–child pairs in thegeneral US birth cohort from thesame time period.24 Nonetheless, ourstudy design was internally valid, andthe associations were adjusted fornumerous sociodemographicdifferences. Moreover, we conducteda thorough stratified analysis beforedeveloping regression models and didnot observe differential effects in anyof the sociodemographic subgroupstrata (data not shown).Developmental diagnoses were basedon maternal report and not verifiedclinically. However, previous studiessuggest that select conditions such asautism and behavioral disorders arereliably reported by parents.39,40
Maternal report of behavioralattributes might vary according tomaternal characteristics andthresholds for identifying a particularbehavior as a problem; although wecould not control for such factors,such variability was unlikely to beassociated with prepregnancy BMI.We were unable to separatelyexamine autism/DD diagnoses;however, the strong association withprepregnancy BMI we observedindicates that the association mightbe stronger if the more specific
diagnosis of autism were examinedseparately. Maternal BMI estimateswere not directly measured.Validation studies indicate thatwomen tend to underreport theirweight, particularly overweight orobese women.41,42 However, it isunlikely that height and weightreporting differed according to childoutcome measures or that reportingof developmental diagnoses differedaccording to prepregnancy BMI. Thus,the impact of using self-reportedmeasures for weight and heightwould probably be a bias toward thenull hypothesis; the associationsreported here might therefore beconservative. Finally, we lackedinformation on child’s medicationuse; therefore, we cannot determinewhether the disparity in our findingsof a strong association with pastADHD diagnosis yet no associationwith current hyperactivity symptomsresulted in part from current use ofADHD medications.
CONCLUSIONS
We found that high prepregnancyBMI was associated withneurodevelopmental outcomesamong 6-year-old children. Childrenof severely obese mothers hadsignificantly increased odds of having
emotional symptoms, peer problems,total psychosocial difficulties,previous developmental diagnoses,and receipt of special needs servicescompared with children of normalweight mothers. This study adds tothe limited body of literaturedocumenting that prepregnancyobesity may have long-termneurologic effects on children. Giventhe high proportion of obesity amongwomen of reproductive age and therecent increase in developmentaldisabilities in children, future studiesshould focus on evaluating maternalobesity as a potential predictor ofdevelopmental delays in children.Finally, these findings supportprevious recommendations offocusing on preconception health tohelp women achieve and maintaina healthy weight and lifestyle beforepregnancy.
ACKNOWLEDGMENTS
This research was performed in partunder an appointment to the Centersfor Disease Control and Prevention,administered by the Oak RidgeInstitute for Science and Educationunder contract DE-AC05-06OR23100between the US Department ofEnergy and Oak Ridge AssociatedUniversities.
PEDIATRICS (ISSN Numbers: Print, 0031-4005; Online, 1098-4275); published in the public domain by the American Academy of Pediatrics
FINANCIAL DISCLOSURE: The authors have indicated they have no financial relationships relevant to this article to disclose.
FUNDING: Supported in part by the intramural research program of the Eunice Kennedy Shriver National Institute of Child Health and Human Development, National
Institutes of Health. Funded by the National Institutes of Health (NIH).
POTENTIAL CONFLICT OF INTEREST: The authors have indicated they have no potential conflicts of interest to disclose.
REFERENCES
1. Flegal KM, Carroll MD, Kit BK, Ogden CL.Prevalence of obesity and trends in thedistribution of body mass index amongUS adults, 1999–2010. JAMA. 2012;307(5):491–497
2. Blumberg SJ, Bramlett MD, Kogan MD,Schieve LA, Jones JR, Lu MC. Changes inprevalence of parent-reported autismspectrum disorder in school-aged U.S.
children: 2007 to 2011–2012. Natl HealthStat Rep. 2013;(65):1–11
3. Boyle CA, Boulet S, Schieve LA, et al.Trends in the prevalence ofdevelopmental disabilities in USchildren, 1997–2008. Pediatrics. 2011;127(6):1034–1042
4. Pastor PN, Reuben CA, Duran CR.Identifying emotional and behavioral
problems in children aged 4–17 years:United States, 2001–2007. Natl HealthStat Rep. 2012;(48):1–17
5. Fisher SC, Kim SY, Sharma AJ, Rochat R,Morrow B. Is obesity still increasingamong pregnant women?Prepregnancy obesity trends in 20states, 2003–2009. Prev Med. 2013;56(6):372–378
PEDIATRICS Volume 135, number 5, May 2015 e1207 by guest on April 8, 2019www.aappublications.org/newsDownloaded from
6. Denison FC, Roberts KA, Barr SM,Norman JE. Obesity, pregnancy,inflammation, and vascular function.Reproduction. 2010;140(3):373–385
7. Heerwagen MJ, Miller MR, Barbour LA,Friedman JE. Maternal obesity and fetalmetabolic programming: a fertileepigenetic soil. Am J Physiol Regul IntegrComp Physiol. 2010;299(3):r711–r722
8. Bowers K, Zhang C. Maternal diabetesand autism spectrum disorders in theoffspring: a review of epidemiologicalevidence and potential biologicmechanisms. N A J Med Sci. 2011;4(4):217–221
9. Xu G, Jing J, Bowers K, Liu B, Bao W.Maternal diabetes and the risk of autismspectrum disorders in the offspring:a systematic review and meta-analysis.J Autism Dev Disord. 2014;44(4):766–775
10. Basatemur E, Gardiner J, Williams C,Melhuish E, Barnes J, Sutcliffe A.Maternal prepregnancy BMI and childcognition: a longitudinal cohort study.Pediatrics. 2013;131(1):56–63
11. Buss C, Entringer S, Davis EP, et al.Impaired executive function mediatesthe association between maternal pre-pregnancy body mass index and childADHD symptoms. PLoS ONE. 2012;7(6):e37758
12. Heikura U, Taanila A, Hartikainen AL,et al. Variations in prenatalsociodemographic factors associatedwith intellectual disability: a study of the20-year interval between two birthcohorts in northern Finland. Am JEpidemiol. 2008;167(2):169–177
13. Hinkle SN, Schieve LA, Stein AD, Swan DW,Ramakrishnan U, Sharma AJ.Associations between maternalprepregnancy body mass index and childneurodevelopment at 2 years of age. IntJ Obes (Lond). 2012;36(10):1312–1319
14. Hinkle SN, Sharma AJ, Kim SY, Schieve LA.Maternal prepregnancy weight statusand associations with children’sdevelopment and disabilities atkindergarten. Int J Obes (Lond). 2013;37(10):1344–1351
15. Krakowiak P, Walker CK, Bremer AA, et al.Maternal metabolic conditions and riskfor autism and otherneurodevelopmental disorders.Pediatrics. 2012;129(5). Available at:www.pediatrics.org/cgi/content/full/129/5/e1121
16. Mann JR, McDermott SW, Hardin J, Pan C,Zhang Z. Pre-pregnancy body massindex, weight change during pregnancy,and risk of intellectual disability inchildren. BJOG. 2013;120(3):309–319
17. Neggers YH, Goldenberg RL, Ramey SL,Cliver SP. Maternal prepregnancy bodymass index and psychomotordevelopment in children. Acta ObstetGynecol Scand. 2003;82(3):235–240
18. Pan C, Deroche CB, Mann JR, McDermottS, Hardin JW. Is prepregnancy obesityassociated with risk of cerebral palsyand epilepsy in children? J Child Neurol.2014;29(12):NP196–NP201
19. Rodriguez A, Miettunen J, Henriksen TB,et al. Maternal adiposity prior topregnancy is associated with ADHDsymptoms in offspring: evidence fromthree prospective pregnancy cohorts. IntJ Obes (Lond). 2008;32(3):550–557
20. Rodriguez A. Maternal pre-pregnancyobesity and risk for inattention andnegative emotionality in children. J ChildPsychol Psychiatry. 2010;51(2):134–143
21. Tanda R, Salsberry PJ, Reagan PB, FangMZ. The impact of prepregnancy obesityon children’s cognitive test scores.Matern Child Health J. 2013;17(2):222–229
22. Brion MJ, Zeegers M, Jaddoe V, et al.Maternal pre-pregnancy overweight andchild cognition and behavior: exploringintrauterine effects in two pregnancycohorts. Pediatrics. 2011;127(1).Available at: www.pediatrics.org/cgi/content/full/127/1/e202
23. Fein SB, Labiner-Wolfe J, Shealy KR, Li R,Chen J, Grummer-Strawn LM. InfantFeeding Practices Study II: studymethods. Pediatrics. 2008;122(suppl 2):S28–S35
24. Fein SB, Li R, Chen J, Scanlon KS,Grummer-Strawn LM. Methods for theYear 6 Follow-Up Study of children in theInfant Feeding Practices Study II.Pediatrics. 2014;134(suppl 1):S4–S12
25. World Health Organization. Obesity:Preventing and Managing the GlobalEpidemic. Report of a WHO Consultation.2000. Report no.: 894. Available at: http://www.who.int/nutrition/publications/obesity/WHO_TRS_894/en/. AccessedJune 27, 2013
26. Goodman R. Psychometric properties ofthe Strengths and Difficulties
Questionnaire. J Am Acad Child AdolescPsychiatry. 2001;40(11):1337–1345
27. Bourdon KH, Goodman R, Rae DS,Simpson G, Koretz DS. The Strengths andDifficulties Questionnaire: US normativedata and psychometric properties. J AmAcad Child Adolesc Psychiatry. 2005;44(6):557–564
28. SDQ. Information for researchers andprofessionals about the Strengths &Difficulties Questionnaires. Available at:www.sdqinfo.org. Accessed June 27,2013
29. Rasmussen KM, Catalano PM, Yaktine AL.New guidelines for weight gain duringpregnancy: what obstetrician/gynecologists should know. Curr OpinObstet Gynecol. 2009;21(6):521–526
30. Oken E, Kleinman KP, Rich-Edwards J,Gillman MW. A nearly continuousmeasure of birth weight for gestationalage using a United States nationalreference. BMC Pediatr. 2003;3(6):6
31. Cox JL, Holden JM, Sagovsky R. Detectionof postnatal depression. Development ofthe 10-item Edinburgh PostnatalDepression Scale. Br J Psychiatry. 1987;150:782–786
32. Chen Q, Sjölander A, Långström N, et al.Maternal pre-pregnancy body massindex and offspring attention deficithyperactivity disorder: a population-based cohort study using a sibling-comparison design. Int J Epidemiol.2014;43(1):83–90
33. Power C, Jefferis BJ, Manor O, HertzmanC. The influence of birth weight andsocioeconomic position on cognitivedevelopment: does the early home andlearning environment modify theireffects? J Pediatr. 2006;148(1):54–61
34. Christensen DL, Schieve LA, Devine O,Drews-Botsch C. Socioeconomic status,child enrichment factors, and cognitiveperformance among preschool-agechildren: results from the Follow-Up ofGrowth and Development Experiencesstudy. Res Dev Disabil. 2014;35(7):1789–1801
35. Drews-Botsch C, Schieve LA, Kable J,Coles C. Socioeconomic differences andthe impact of being small for gestationalage on neurodevelopment amongpreschool-aged children. Rev EnvironHealth. 2011;26(3):221–229
e1208 JO et al by guest on April 8, 2019www.aappublications.org/newsDownloaded from
36. Huleihel M, Golan H, Hallak M.Intrauterine infection/inflammationduring pregnancy and offspring braindamages: possible mechanisms involved.Reprod Biol Endocrinol. 2004;2(17):17
37. Keim SA, Pruitt NT. Gestational weightgain and child cognitive development. IntJ Epidemiol. 2012;41(2):414–422
38. Bilder DA, Bakian AV, Viskochil J, et al.Maternal prenatal weight gain andautism spectrum disorders. Pediatrics.2013;132(5). Available at: www.pediatrics.org/cgi/content/full/132/5/e1276
39. Autism and Developmental DisabilitiesMonitoring Network Surveillance Year2006 Principal Investigators; Centers forDisease Control and Prevention (CDC).Prevalence of autism spectrumdisorders: Autism and DevelopmentalDisabilities Monitoring Network, UnitedStates, 2006. MMWR Surveill Summ.2009;58(10):1–20
40. Ackland MJ, Wade RW. Health status ofVictorian special school children.J Paediatr Child Health. 1995;31(6):571–575
41. Bodnar LM, Siega-Riz AM, Simhan HN,Diesel JC, Abrams B. The impact ofexposure misclassification onassociations between prepregnancy BMIand adverse pregnancy outcomes.Obesity (Silver Spring). 2010;18(11):2184–2190
42. Merrill RM, Richardson JS. Validity ofself-reported height, weight, and bodymass index: findings from the NationalHealth and Nutrition Examination Survey,2001–2006. Prev Chronic Dis. 2009;6(4):a121
PEDIATRICS Volume 135, number 5, May 2015 e1209 by guest on April 8, 2019www.aappublications.org/newsDownloaded from
DOI: 10.1542/peds.2014-3058 originally published online April 27, 2015; 2015;135;e1198Pediatrics
Jennifer N. LindHeejoo Jo, Laura A. Schieve, Andrea J. Sharma, Stefanie N. Hinkle, Ruowei Li and
at 6 Years of AgeMaternal Prepregnancy Body Mass Index and Child Psychosocial Development
ServicesUpdated Information &
http://pediatrics.aappublications.org/content/135/5/e1198including high resolution figures, can be found at:
Referenceshttp://pediatrics.aappublications.org/content/135/5/e1198#BIBLThis article cites 40 articles, 9 of which you can access for free at:
Subspecialty Collections
http://www.aappublications.org/cgi/collection/obesity_new_subObesityhttp://www.aappublications.org/cgi/collection/autism:asd_subAutism/ASDal_issues_subhttp://www.aappublications.org/cgi/collection/development:behaviorDevelopmental/Behavioral Pediatricsfollowing collection(s): This article, along with others on similar topics, appears in the
Permissions & Licensing
http://www.aappublications.org/site/misc/Permissions.xhtmlin its entirety can be found online at: Information about reproducing this article in parts (figures, tables) or
Reprintshttp://www.aappublications.org/site/misc/reprints.xhtmlInformation about ordering reprints can be found online:
by guest on April 8, 2019www.aappublications.org/newsDownloaded from
DOI: 10.1542/peds.2014-3058 originally published online April 27, 2015; 2015;135;e1198Pediatrics
Jennifer N. LindHeejoo Jo, Laura A. Schieve, Andrea J. Sharma, Stefanie N. Hinkle, Ruowei Li and
at 6 Years of AgeMaternal Prepregnancy Body Mass Index and Child Psychosocial Development
http://pediatrics.aappublications.org/content/135/5/e1198located on the World Wide Web at:
The online version of this article, along with updated information and services, is
ISSN: 1073-0397. 60007. Copyright © 2015 by the American Academy of Pediatrics. All rights reserved. Print the American Academy of Pediatrics, 141 Northwest Point Boulevard, Elk Grove Village, Illinois,has been published continuously since 1948. Pediatrics is owned, published, and trademarked by Pediatrics is the official journal of the American Academy of Pediatrics. A monthly publication, it
by guest on April 8, 2019www.aappublications.org/newsDownloaded from