maternal overnutrition impacts offspring adiposity and brain appetite markers-modulation by...
TRANSCRIPT
ORIGINAL ARTICLE
Maternal Overnutrition Impacts Offspring Adiposity and Brain AppetiteMarkers-Modulation by Postweaning DietS. Rajia,* H. Chen*� and M. J. Morris*
*Department of Pharmacology, School of Medical Sciences, University of New South Wales, Sydney, NSW, Australia.
�Department of Medical and Molecular Bioscience, Faculty of Science, University of Technology, Broadway, NSW, Australia.
Obesity is a worldwide epidemic in both adults and children. In
many societies, maternal obesity is becoming the most common
perturbation in pregnancy (1). This increases the likelihood of a
cluster of disorders in offspring, including impaired glucose toler-
ance, insulin resistance, dyslipidaemia, hypertension and obesity (2).
Animal studies indicate that maternal nutrition exerts an important
influence on the development of hypothalamic neurons involved in
energy homeostasis and thus metabolic profile in offspring (3–5).
The process by which prenatal and early postnatal environmental
factors have long-term effects in adulthood is called programming.
This is now considered a potential mechanism underlying the
development of obesity, hyperphagia, cardiovascular disease and
metabolic disorders later in life whereby altered gene expression
occurs as a consequence of an adaptation to environmental
changes (6–8). The plasticity of the hypothalamus in late gestation
and early postnatal life (7) plays a key role in programming where
adipose tissue secreted cytokines such as leptin are considered to
act as key neurotrophic factors during brain development, which
may permanently influence appetite and metabolism (3, 4, 9). Both
maternal and postweaning HFD can impact on the expression of
hypothalamic gene that regulates food intake and metabolism (5,
10).
Journal ofNeuroendocrinology
Correspondence to:
Margaret J. Morris, Department of
Pharmacology, School of Medical
Sciences, The University of New South
Wales, Sydney, NSW 2052, Australia
(e-mail: [email protected]).
Maternal obesity has long-term consequences for the development of hypothalamic neurones
involved in energy homeostasis and the metabolic profile in offspring. In the present study, we
compared the effects of maternal obesity induced by longstanding high-fat diet (HFD) with
milder postnatal overfeeding during suckling induced by litter size reduction. Female Sprague–
Dawley rats consumed chow (C) or HFD. On postnatal day 1, litters from chow dams were
adjusted to three per dam (small litter, CS) versus 12 control (normal litter, CN). Litters from
HFD dams were adjusted to 12 per dam and fed HFD after weaning to induce obesity (HN).
Thus, two degrees of maternal overnutrition were produced (CS and HN). To test whether post-
weaning diet can amplify the effects of maternal obesity, male offspring weaned onto chow or
HFD were followed to 21 weeks. Maternal postnatal overnutrition (CS) and HFD-induced mater-
nal obesity (HN) increased body weight and fat mass in offspring compared to those from con-
trol dams (CN). Significant glucose intolerance was induced by both degrees of maternal
overnutrition, but only in offspring consuming HFD. HFD-induced maternal obesity (HN) was
linked to increased offspring leptin, insulin, lipids, insulin resistance and hyperphagia, and was
exaggerated by postweaning HFD. No effect of maternal postnatal overnutrition (CS) was seen
on these parameters. Hypothalamic signal transducer and activator of transcription-3 and sup-
pressor of cytokine signalling-3 mRNA were significantly elevated by maternal HFD (HN) in the
HFD-fed offspring. The data obtained suggest that even mild maternal overnutrition (CS) led to
increased adiposity, glucose intolerance and altered brain appetite regulators in offspring. A
greater impact of HFD-induced maternal obesity was evident. Marked additive effects were
observed when animals consumed a HFD postweaning.
Key words: maternal overnutrition, high-fat diet, glucose homeostasis, leptin, adiposity, appetite
regulation.
doi: 10.1111/j.1365-2826.2010.02005.x
Journal of Neuroendocrinology 22, 905–914
ª 2010 The Authors. Journal Compilation ª 2010 Blackwell Publishing Ltd
Journal of NeuroendocrinologyFrom Molecular to Translational Neurobiology
The circulating hormones insulin and leptin constitute important
homeostatic signals influencing hypothalamic fuel metabolism. The
adipocyte-derived hormone leptin regulates body weight and food
intake via leptin receptors (Ob-Rb) located predominantly in the
hypothalamus (11). Subsequent phosphorylation of signal transduc-
tion and activator of transcription-3 (STAT-3) inhibits the expression
of orexigenic neuropeptide Y (NPY) and agouti-related protein
(AgRP), whereas anorexigenic pro-opiomelanocortin (POMC) and
cocaine- and amphetamine-regulated transcript are stimulated to
inhibit food intake (12). However, the high leptin levels in obese
subjects, proportional to adipose tissue mass (13), fail to bring
about weight loss as a result of central leptin resistance (14). In
particular, suppressor of cytokine signalling-3 (SOCS-3) has been
suggested as a potential mediator of central leptin resistance in
obesity (15). Leptin has also been reported to increase sympathetic
nerve activity resulting in hypertension (16).
Many studies have explored the impact of maternal undernutri-
tion on programming of obesity in offspring (8, 17–19); more
recently, attention has focused on maternal overnutrition (6, 10,
20–22), which is a more prominent health problem worldwide.
However, the issue of the extent of maternal obesity is important,
and the effect of maternal overnutrition induced early in life, as
a result of litter size reduction, on offspring is not known. We
hypothesised that frank maternal obesity induced by the overcon-
sumption of a high-fat diet (HFD) would exert greater effects on
plasma hormones and brain appetite regulators in offspring than
mild maternal early postnatal overnutrition induced by litter size
reduction. Given the link between maternal obesity and offspring
cardiovascular disease, blood pressure was measured in offspring,
in addition to food intake, glucose tolerance, plasma leptin, insulin
and triglyceride levels. To investigate alterations in hypothalamic
appetite regulators, we also examined mRNA expression of NPY,
POMC, Ob-Rb and its downstream mediators STAT-3 and SOCS-3.
Materials and methods
Animals and diet
All animal experiments were approved by the Animal Care and Ethics Com-
mittee of the University of New South Wales. Female out bred Sprague–
Dawley rats (Animal Resource Centre, Murdoch, WA, Australia) aged 9 weeks
were housed at 20 � 2 �C and maintained under a 12 : 12 h light ⁄ dark
cycle. They were fed normal chow (11 kJ ⁄ g, 14% fat, 21% protein, 65% car-
bohydrate by energy; Gordon’s Specialty Stockfeeds, Yanderra, NSW, Austra-
lia) or palatable cafeteria-style (HFD) (15.33 kJ ⁄ g, 34% fat, 19% protein,
47% carbohydrate by energy) as described previously (5, 23) for 5 weeks to
produce two groups: Chow and HFD. At 14 weeks, they were mated with
chow fed male Sprague–Dawley rats from the same source. On postnatal
day 1, litters from chow fed dams were adjusted to 3 per dam (small litter,
CS) inducing postnatal overnutrition by increasing milk availability (24, 25)
versus 12 per dam (normal litter, CN) and both groups were fed chow after
weaning. Pups from HFD fed dams were maintained in normal litters (12
per dam, HN) and were fed HFD after weaning (Table 1).
Thus, three goups of mother were generated: control and two degrees of
overnutrition, one by early postnatal overnutrition after litter size reduction
(chow, small litter CS) and another rendered obese by HFD consumption
(HFD, normal litter HN; Table 1). They were mated at 14 weeks of age with
chow fed males. After delivery, the litters were adjusted to normal size and
at weaning (day 20) the males were divided into two groups of equal body
weight and provided chow (CNC, CSC, HNC) or HFD (CNH, CSH, HNH), produc-
ing six groups of rats (n = 12–17; Table 1).
Body weight and energy intake
Body weight of offspring was monitored every 3 days till weaning (20 days)
and weekly thereafter. Average 24-h food intake (g) was calculated weekly
from 5–15 weeks by carefully collecting and weighing the food remaining in
the cage, and then subtracting this from the known amount given. The total
energy (kJ) consumed by each group was calculated from the energy infor-
mation supplied on the packet.
Blood pressure measurement
Blood pressure was measured at 12 weeks of age in conscious animals
using tail-cuff pulse plethysmography (CODA-6; Kent Scientific Corporation,
Torrington, CT, USA). Rats were pre-warmed by placing at 37 �C for
5–10 min to facilitate tail blood flow before blood pressure was measured.
After five acclimation readings, the average of three to seven readings was
used for each rat.
Glucose tolerance test
At 16 weeks, an i.p. glucose tolerance test (IPGTT) was performed on con-
scious animals after 6 h of fasting. After baseline blood glucose was deter-
mined (Accu-Chek Advantage Glucometre; Roche Diagnostics, Castle Hill,
NSW, Australia), rats were administered 2 g glucose ⁄ kg body weight (30%
w ⁄ v) by i.p. injection. Further blood samples were taken at 15, 30, 45, 60,
90 and 120 min for glucose determination.
Table 1. Experimental Procedure.
Diet Maternal (intervention) Offspring (diet) Offspring ID
Chow Normal litter consuming chow (CN); n = 7 Chow CN-chow (CNC); n = 17
HFD CN-HFD (CNH); n = 14
Small litter consuming chow (CS); n = 6 Chow CS-chow (CSC); n = 12
HFD CS-HFD (CSH); n = 12
HFD Normal litter consuming HFD (HN); n = 7 Chow HN-chow (HNC); n = 17
HFD HN-HFD (HNH); n = 15
HFD, high-fat diet.
906 S. Rajia et al.
ª 2010 The Authors. Journal Compilation ª 2010 Blackwell Publishing Ltd, Journal of Neuroendocrinology, 22, 905–914
Sample collection
Blood samples (0.3 ml) were obtained from the tail vein of warmed con-
scious rats using a heparinised syringe (Pfizer, New York, NY, USA;
1000 IU ⁄ ml saline) at 14 weeks of age for fasting glucose and insulin levels.
The insulin resistance index was estimated by homeostasis model
assessment (HOMA): plasma insulin (ng ⁄ ml) · fasting plasma glucose
(mM) ⁄ (22.5 · 0.0417): the greater the HOMA value, the greater the level of
insulin resistance (26). Although the correlation between HOMA and eugly-
caemic clamp data is stronger in the human than the rodent, HOMA was
significantly correlated with euglycaemic clamp outcome as an indicator of
insulin resistance in the rat and is more feasible in small animals (27).
At 21 weeks, nonfasted offspring were anaesthetised (xylazine ⁄ ketamine
20 ⁄ 80 mg ⁄ kg). After measurement of naso–anal length and girth, blood
was removed by cardiac puncture for plasma hormone analysis. After decap-
itation, the brain was placed ventral side up; coronal cuts were made at the
optic chiasm and the rostral border of the hypothalamus. The hypothalamus
(minus preoptic area) was separated by making incisions at the lateral edges
of the hypothalamic sulcus and above the third ventricle. The hypothalamus
was dissected into dorsal and ventral segments. The ventral hypothalamus
containing the arcuate nucleus was snap frozen. White adipose tissue (WAT:
right retroperitoneal (rRP), gonadal and mesenteric) and liver were collected
and weighed. Hypothalamus and rRP WAT were snap frozen in liquid nitro-
gen and stored at )80 �C for later measurement of mRNA expression. Tibia
length was recorded. Body mass index (BMI) was calculated as kg ⁄ m2.
Plasma biochemistry
Glucose was measured and blood was centrifuged at 4472 g for 8 min
(Eppendorf Minispin; Crown Scientific, Minto, NSW, Australia). Separated
plasma was stored at )20 �C. Plasma leptin and insulin concentrations were
analysed using commercially available radioimmunoassay kits according to
manufacturer’s instructions (Linco, St Charles, MO, USA). Plasma triglycerides
were analysed colorimetrically (490 nm; Bio-Rad 680XR, Bio-Rad,Gladesville,
NSW, Australia) using commercially available triglyceride reagent (Roche)
and standard (Sigma, Croydon, Victoria, Australia).
Haematoxylin and eosin staining of liver
A section of liver from each rat was placed in 4% formaldehyde overnight,
transferred to 70% ethanol embedded in paraffin wax and stained for
hematoxylin and eosin. Fatty change in liver was scored by an observer
blinded to the treatment by assessing the amount and size of white vacu-
oles present throughout the stained section (0 = no fat vacuoles; 1 = few
small lipid vacuoles; 2 = increased number of small fat vacuoles and some
big vacuoles; 3 = hepatocytes filled by big fat vacuoles). The average of the
grades within each treatment group was then calculated. Grading of liver
histology used a scoring method adapted from a previous publication (28).
Real-time polymerase chain reaction (PCR)
Quantitative real-time PCR was used to determine mRNA expression of NPY,
POMC, SOCS-3, STAT-3, and Ob-Rb in ventral hypothalamus and adipose tri-
glyceride lipase (ATGL) in rRP WAT. Total RNA was extracted by homogenis-
ing tissue with Tri reagent (Sigma, St Louis, MO, USA), separation by
chloroform, precipitated with isopropyl alcohol and then washed with 75%
ethanol. Spectrophotometric measurements were done using the Nanodrop
Spectrophotometre (Nanodrop Technologies, Wilmington, DE, USA) to deter-
mine RNA concentration and purity. The purified total RNA was used as a
template to generate single-strand cDNA using M-MLV Reverse Transcrip-
tase, RNase H Minus, Point Mutant Kit, (Promega Corporation, Madison, WI,
USA). Pre-optimised probe ⁄ primers (Applied Biosystems, Foster City, CA,
USA) were used for quantitative PCR (Realplex software, Eppendorf,
Hamburg, Germany). Ob-Rb, STAT-3, SOCS-3, NPY and POMC mRNA levels
in hypothalamus were compared to housekeeping gene ribosomal 18s RNA.
ATGL mRNA levels in rRP were compared to housekeeping gene b-actin. The
housekeeping gene was labelled by VIC and target gene by FAM. An individ-
ual sample from the control CN-chow group was then arbitrarily assigned
as a calibrator against which all other samples are expressed as fold differ-
ence.
Statistical analysis
Results are expressed as the mean � SEM. Maternal characteristics and pre-
weaning data were analysed by one-way ANOVA followed by least significant
difference (LSD) using SPSS, version 17 (SPSS Inc., Chicago, IL, USA). Post-
weaning weekly body weights and IPGTT glucose concentrations were analy-
sed by one-way ANOVA with repeated measures, followed by LSD. Food intake,
blood pressure and endpoint organ weights, body weight, fat masses,
plasma markers, mRNA levels were analysed by two-way ANOVA followed by
least significant difference test using SPSS. If two-way ANOVA showed signifi-
cant overall maternal effects, then it was followed by one-way ANOVA to
examine maternal effects separately in chow and HFD groups. Correlation
between the body weight and fat masses was assessed by Pearson’s correla-
tion.
Results
Maternal characteristics
HN mothers showed marked increases in body weight at 14 weeks
when mating began (Table 2). Mothers were killed at 22 weeks,
after offspring were weaned; at this time, they were 17% heavier
than CN females, with a marked increase in sampled WAT mass
(P < 0.001) and a doubling of plasma leptin and triglyceride con-
centrations (HN versus CN; P < 0.01 and 0.05, respectively; Table 2).
Postnatal overnutrition via litter size reduction resulted in increased
body weight compared to CN dams at 14 weeks (CS versus CN;
P < 0.05; Table 2). No overall effect of litter size reduction was
seen at 21 weeks on body weight, plasma leptin, insulin and tri-
glyceride concentration (CS versus CN; Table 2). Although total fat
mass was increased 24%, this failed to reach significance.
Offspring body weight
Preweaning
No difference was observed in offspring day 1 body weight across
maternal groups (Fig. 1A). During suckling, the offspring of obese
HN dams were significantly heavier (P < 0.01) by 4 days and those
from CS dams showed increased body weight (P < 0.01) from post-
natal day 7 versus those of lean CN dams (Fig. 1A).
Postweaning
HFD-induced maternal obesity (HN) and maternal postnatal
overnutrition (CS) as a result of litter size reduction both led to
significantly greater postweaning body weight gain in offspring.
Maternal adiposity influences offspring hormones and metabolic disorders 907
ª 2010 The Authors. Journal Compilation ª 2010 Blackwell Publishing Ltd, Journal of Neuroendocrinology, 22, 905–914
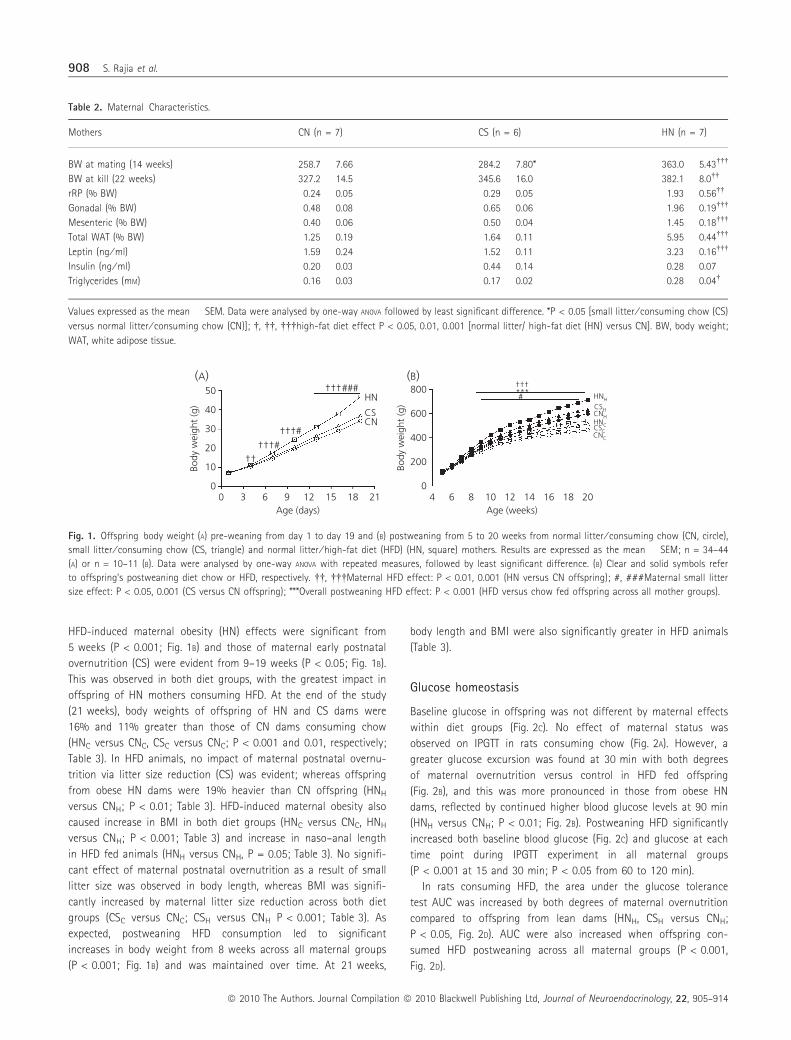
HFD-induced maternal obesity (HN) effects were significant from
5 weeks (P < 0.001; Fig. 1B) and those of maternal early postnatal
overnutrition (CS) were evident from 9–19 weeks (P < 0.05; Fig. 1B).
This was observed in both diet groups, with the greatest impact in
offspring of HN mothers consuming HFD. At the end of the study
(21 weeks), body weights of offspring of HN and CS dams were
16% and 11% greater than those of CN dams consuming chow
(HNC versus CNC, CSC versus CNC; P < 0.001 and 0.01, respectively;
Table 3). In HFD animals, no impact of maternal postnatal overnu-
trition via litter size reduction (CS) was evident; whereas offspring
from obese HN dams were 19% heavier than CN offspring (HNH
versus CNH; P < 0.01; Table 3). HFD-induced maternal obesity also
caused increase in BMI in both diet groups (HNC versus CNC, HNH
versus CNH; P < 0.001; Table 3) and increase in naso–anal length
in HFD fed animals (HNH versus CNH, P = 0.05; Table 3). No signifi-
cant effect of maternal postnatal overnutrition as a result of small
litter size was observed in body length, whereas BMI was signifi-
cantly increased by maternal litter size reduction across both diet
groups (CSC versus CNC; CSH versus CNH P < 0.001; Table 3). As
expected, postweaning HFD consumption led to significant
increases in body weight from 8 weeks across all maternal groups
(P < 0.001; Fig. 1B) and was maintained over time. At 21 weeks,
body length and BMI were also significantly greater in HFD animals
(Table 3).
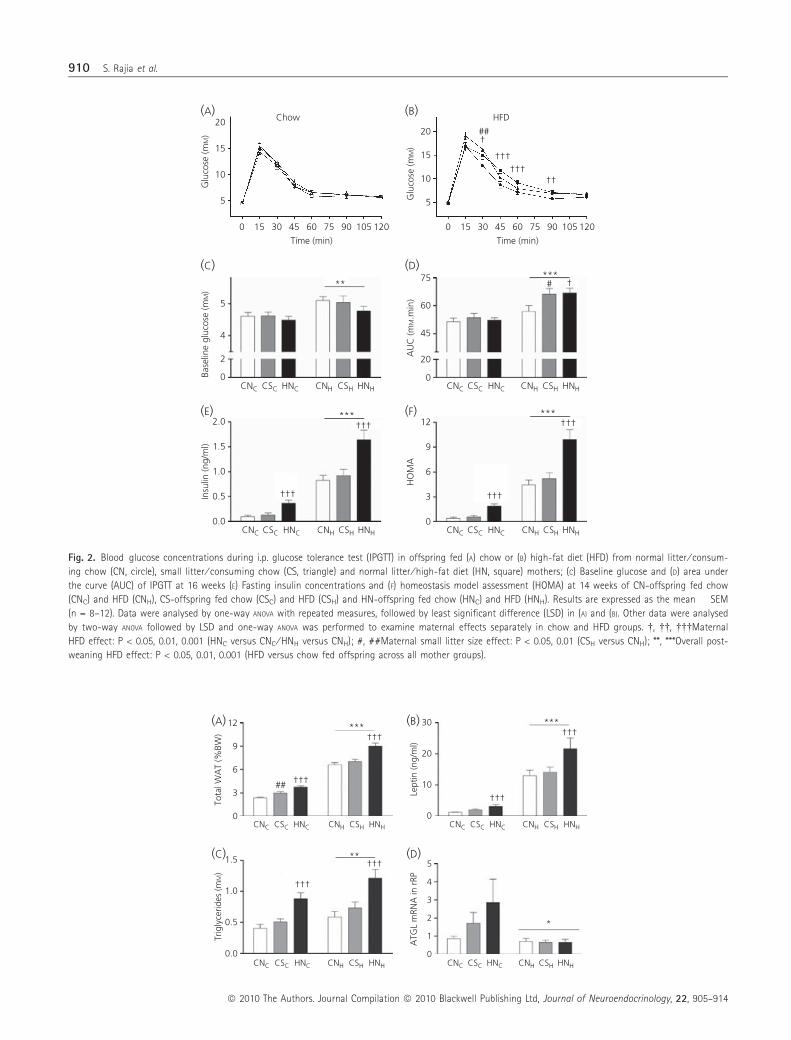
Glucose homeostasis
Baseline glucose in offspring was not different by maternal effects
within diet groups (Fig. 2C). No effect of maternal status was
observed on IPGTT in rats consuming chow (Fig. 2A). However, a
greater glucose excursion was found at 30 min with both degrees
of maternal overnutrition versus control in HFD fed offspring
(Fig. 2B), and this was more pronounced in those from obese HN
dams, reflected by continued higher blood glucose levels at 90 min
(HNH versus CNH; P < 0.01; Fig. 2B). Postweaning HFD significantly
increased both baseline blood glucose (Fig. 2C) and glucose at each
time point during IPGTT experiment in all maternal groups
(P < 0.001 at 15 and 30 min; P < 0.05 from 60 to 120 min).
In rats consuming HFD, the area under the glucose tolerance
test AUC was increased by both degrees of maternal overnutrition
compared to offspring from lean dams (HNH, CSH versus CNH;
P < 0.05, Fig. 2D). AUC were also increased when offspring con-
sumed HFD postweaning across all maternal groups (P < 0.001,
Fig. 2D).
Table 2. Maternal Characteristics.
Mothers CN (n = 7) CS (n = 6) HN (n = 7)
BW at mating (14 weeks) 258.7 � 7.66 284.2 � 7.80* 363.0 � 5.43���
BW at kill (22 weeks) 327.2 � 14.5 345.6 � 16.0 382.1 � 8.0��
rRP (% BW) 0.24 � 0.05 0.29 � 0.05 1.93 � 0.56��
Gonadal (% BW) 0.48 � 0.08 0.65 � 0.06 1.96 � 0.19���
Mesenteric (% BW) 0.40 � 0.06 0.50 � 0.04 1.45 � 0.18���
Total WAT (% BW) 1.25 � 0.19 1.64 � 0.11 5.95 � 0.44���
Leptin (ng ⁄ ml) 1.59 � 0.24 1.52 � 0.11 3.23 � 0.16���
Insulin (ng ⁄ ml) 0.20 � 0.03 0.44 � 0.14 0.28 � 0.07
Triglycerides (mM) 0.16 � 0.03 0.17 � 0.02 0.28 � 0.04�
Values expressed as the mean � SEM. Data were analysed by one-way ANOVA followed by least significant difference. *P < 0.05 [small litter ⁄ consuming chow (CS)
versus normal litter ⁄ consuming chow (CN)]; �, ��, ���high-fat diet effect P < 0.05, 0.01, 0.001 [normal litter/ high-fat diet (HN) versus CN]. BW, body weight;
WAT, white adipose tissue.
40
50 800
600
400
200
0
30
20
10
00 3 6 9 12 15 18 21
CNCS
HN
CNC
CNHHNCCSC
CSH
HNH
Age (days)4 6 8 10 12 14 1816 20
Age (weeks)
Body
wei
ght
(g)
Body
wei
ght
(g)
†††####***
†††
†††#
†††#††
(A) (B)
Fig. 1. Offspring body weight (A) pre-weaning from day 1 to day 19 and (B) postweaning from 5 to 20 weeks from normal litter ⁄ consuming chow (CN, circle),
small litter ⁄ consuming chow (CS, triangle) and normal litter ⁄ high-fat diet (HFD) (HN, square) mothers. Results are expressed as the mean � SEM; n = 34–44
(A) or n = 10–11 (B). Data were analysed by one-way ANOVA with repeated measures, followed by least significant difference. (B) Clear and solid symbols refer
to offspring’s postweaning diet chow or HFD, respectively. ��, ���Maternal HFD effect: P < 0.01, 0.001 (HN versus CN offspring); #, ###Maternal small litter
size effect: P < 0.05, 0.001 (CS versus CN offspring); ***Overall postweaning HFD effect: P < 0.001 (HFD versus chow fed offspring across all mother groups).
908 S. Rajia et al.
ª 2010 The Authors. Journal Compilation ª 2010 Blackwell Publishing Ltd, Journal of Neuroendocrinology, 22, 905–914
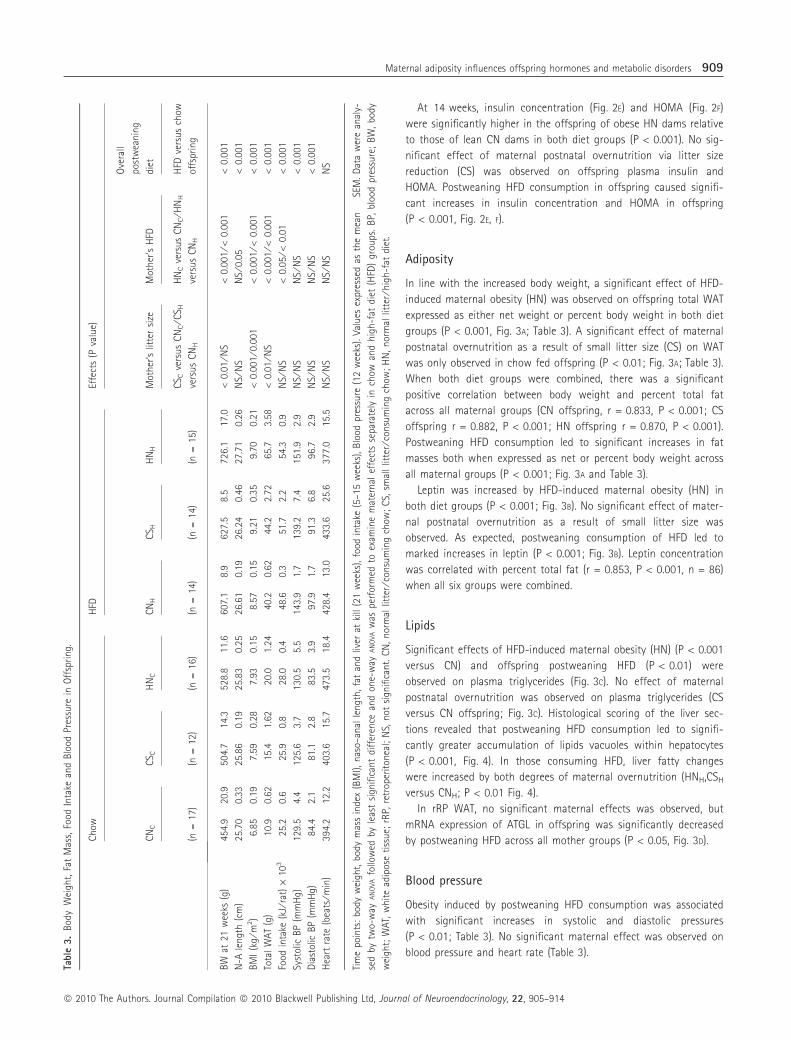
At 14 weeks, insulin concentration (Fig. 2E) and HOMA (Fig. 2F)
were significantly higher in the offspring of obese HN dams relative
to those of lean CN dams in both diet groups (P < 0.001). No sig-
nificant effect of maternal postnatal overnutrition via litter size
reduction (CS) was observed on offspring plasma insulin and
HOMA. Postweaning HFD consumption in offspring caused signifi-
cant increases in insulin concentration and HOMA in offspring
(P < 0.001, Fig. 2E, F).
Adiposity
In line with the increased body weight, a significant effect of HFD-
induced maternal obesity (HN) was observed on offspring total WAT
expressed as either net weight or percent body weight in both diet
groups (P < 0.001, Fig. 3A; Table 3). A significant effect of maternal
postnatal overnutrition as a result of small litter size (CS) on WAT
was only observed in chow fed offspring (P < 0.01; Fig. 3A; Table 3).
When both diet groups were combined, there was a significant
positive correlation between body weight and percent total fat
across all maternal groups (CN offspring, r = 0.833, P < 0.001; CS
offspring r = 0.882, P < 0.001; HN offspring r = 0.870, P < 0.001).
Postweaning HFD consumption led to significant increases in fat
masses both when expressed as net or percent body weight across
all maternal groups (P < 0.001; Fig. 3A and Table 3).
Leptin was increased by HFD-induced maternal obesity (HN) in
both diet groups (P < 0.001; Fig. 3B). No significant effect of mater-
nal postnatal overnutrition as a result of small litter size was
observed. As expected, postweaning consumption of HFD led to
marked increases in leptin (P < 0.001; Fig. 3B). Leptin concentration
was correlated with percent total fat (r = 0.853, P < 0.001, n = 86)
when all six groups were combined.
Lipids
Significant effects of HFD-induced maternal obesity (HN) (P < 0.001
versus CN) and offspring postweaning HFD (P < 0.01) were
observed on plasma triglycerides (Fig. 3C). No effect of maternal
postnatal overnutrition was observed on plasma triglycerides (CS
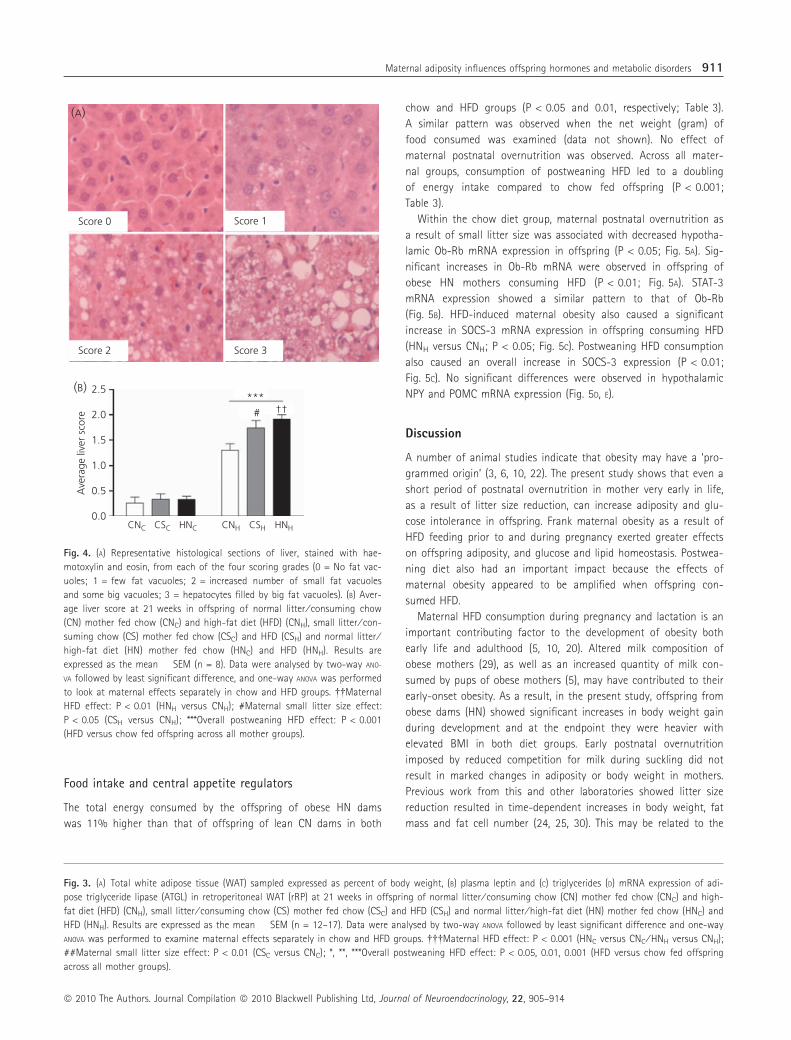
versus CN offspring; Fig. 3C). Histological scoring of the liver sec-
tions revealed that postweaning HFD consumption led to signifi-
cantly greater accumulation of lipids vacuoles within hepatocytes
(P < 0.001, Fig. 4). In those consuming HFD, liver fatty changes
were increased by both degrees of maternal overnutrition (HNH,CSH
versus CNH; P < 0.01 Fig. 4).
In rRP WAT, no significant maternal effects was observed, but
mRNA expression of ATGL in offspring was significantly decreased
by postweaning HFD across all mother groups (P < 0.05, Fig. 3D).
Blood pressure
Obesity induced by postweaning HFD consumption was associated
with significant increases in systolic and diastolic pressures
(P < 0.01; Table 3). No significant maternal effect was observed on
blood pressure and heart rate (Table 3).
Tabl
e3.
Bod
yW
eigh
t,Fa
tM
ass,
Food
Inta
kean
dB
lood
Pres
sure
inO
ffsp
rin
g.
Ch
owH
FDEf
fect
s(P
valu
e)
CN
CC
S CH
NC
CN
HC
S HH
NH
Mot
her
’slit
ter
size
Mot
her
’sH
FD
Ove
rall
post
wea
nin
g
diet
(n=
17)
(n=
12)
(n=
16)
(n=
14)
(n=
14)
(n=
15)
CS C
vers
us
CN
C⁄C
S Hve
rsu
sC
NH
HN
Cve
rsus
CN
C⁄H
NH
vers
usC
NH
HFD
vers
us
chow
offs
prin
g
BW
at21
wee
ks(g
)45
4.9�
20.9
504.
7�
14.3
528.
8�
11.6
607.
1�
8.9
627.
5�
8.5
726.
1�
17.0
<0.
01⁄N
S<
0.00
1⁄<
0.00
1<
0.00
1
N-A
len
gth
(cm
)25
.70�
0.33
25.8
6�
0.19
25.8
3�
0.25
26.6
1�
0.19
26.2
4�
0.46
27.7
1�
0.26
NS
⁄NS
NS
⁄0.0
5<
0.00
1
BM
I(k
g⁄m
2)
6.85�
0.19
7.59�
0.28
7.93�
0.15
8.57�
0.15
9.21�
0.35
9.70�
0.21
<0.
001
⁄0.0
01<
0.00
1⁄<
0.00
1<
0.00
1
Tota
lW
AT
(g)
10.9�
0.62
15.4�
1.62
20.0�
1.24
40.2�
0.62
44.2�
2.72
65.7�
3.58
<0.
01⁄N
S<
0.00
1⁄<
0.00
1<
0.00
1
Food
inta
ke(k
J⁄r
at)
·10
325
.2�
0.6
25.9�
0.8
28.0�
0.4
48.6�
0.3
51.7�
2.2
54.3�
0.9
NS
⁄NS
<0.
05⁄<
0.01
<0.
001
Syst
olic
BP
(mm
Hg)
129.
5�
4.4
125.
6�
3.7
130.
5�
5.5
143.
9�
1.7
139.
2�
7.4
151.
9�
2.9
NS
⁄NS
NS
⁄NS
<0.
001
Dia
stol
icB
P(m
mH
g)84
.4�
2.1
81.1�
2.8
83.5�
3.9
97.9�
1.7
91.3�
6.8
96.7�
2.9
NS
⁄NS
NS
⁄NS
<0.
001
Hea
rtra
te(b
eats
⁄min
)39
4.2�
12.2
403.
6�
15.7
473.
5�
18.4
428.
4�
13.0
433.
6�
25.6
377.
0�
15.5
NS
⁄NS
NS
⁄NS
NS
Tim
epo
ints
:bo
dyw
eigh
t,bo
dym
ass
inde
x(B
MI)
,n
aso–
anal
leng
th,
fat
and
liver
atki
ll(2
1w
eeks
),fo
odin
take
(5–1
5w
eeks
),B
lood
pres
sure
(12
wee
ks).
Val
ues
expr
esse
das
the
mea
n�
SEM
.D
ata
wer
ean
aly-
sed
bytw
o-w
ayA
NO
VA
follo
wed
byle
ast
sign
ifica
nt
diff
eren
cean
don
e-w
ayA
NO
VA
was
perf
orm
edto
exam
ine
mat
ern
alef
fect
sse
para
tely
inch
owan
dh
igh
-fat
diet
(HFD
)gr
oups
.B
P,bl
ood
pres
sure
;B
W,
body
wei
ght;
WA
T,w
hit
ead
ipos
eti
ssu
e;rR
P,re
trop
erit
onea
l;N
S,n
otsi
gnifi
can
t.C
N,
nor
mal
litte
r⁄co
nsu
min
gch
ow;
CS,
smal
llit
ter⁄
con
sum
ing
chow
;H
N,
nor
mal
litte
r⁄h
igh
-fat
diet
.
Maternal adiposity influences offspring hormones and metabolic disorders 909
ª 2010 The Authors. Journal Compilation ª 2010 Blackwell Publishing Ltd, Journal of Neuroendocrinology, 22, 905–914
20 Chow
15
10
5
0
5
4
2
0CNC CSC HNC CNH CSH HNH
CNC
†††
†††
†††
***†††
***2.0 12
9
6
3
0
1.5
1.0
0.5
0.0CSC HNC CNH CSH HNH
CNC
75 ***# †
60
45
20
0CSC HNC CNH CSH HNH
CNC CSC HNC CNH CSH HNH
**
Time (min)
15 30 45 60 75 90 105 120
HFD
##†
††††††
††
0
Time (min)
15 30 45 60 75 90 105 120
Glu
cose
(mM
)Ba
selin
e gl
ucos
e (m
M)
Insu
lin (n
g/m
l)
AU
C (m
M.m
in)
HO
MA
20
15
10
5Glu
cose
(mM
)
(A) (B)
(C) (D)
(E) (F)
Fig. 2. Blood glucose concentrations during i.p. glucose tolerance test (IPGTT) in offspring fed (A) chow or (B) high-fat diet (HFD) from normal litter ⁄ consum-
ing chow (CN, circle), small litter ⁄ consuming chow (CS, triangle) and normal litter ⁄ high-fat diet (HN, square) mothers; (C) Baseline glucose and (D) area under
the curve (AUC) of IPGTT at 16 weeks (E) Fasting insulin concentrations and (F) homeostasis model assessment (HOMA) at 14 weeks of CN-offspring fed chow
(CNC) and HFD (CNH), CS-offspring fed chow (CSC) and HFD (CSH) and HN-offspring fed chow (HNC) and HFD (HNH). Results are expressed as the mean � SEM
(n = 8–12). Data were analysed by one-way ANOVA with repeated measures, followed by least significant difference (LSD) in (A) and (B). Other data were analysed
by two-way ANOVA followed by LSD and one-way ANOVA was performed to examine maternal effects separately in chow and HFD groups. �, ��, ���Maternal
HFD effect: P < 0.05, 0.01, 0.001 (HNC versus CNC ⁄ HNH versus CNH); #, ##Maternal small litter size effect: P < 0.05, 0.01 (CSH versus CNH); **, ***Overall post-
weaning HFD effect: P < 0.05, 0.01, 0.001 (HFD versus chow fed offspring across all mother groups).
CNC CSC HNC CNH CSH HNH CNC CSC HNC CNH CSH HNH
CNC CSC HNC CNH CSH HNH CNC
*
5
4
3
2
1
0CSC HNC CNH CSH HNH
1.5
(A) (B)
(C) (D)
12
9
6
3
0
†††**
†††
†††
†††
†††30
20
10
0
†††*** ***
##
Trig
lyce
rides
(mM
)To
tal W
AT
(%BW
)
ATG
L m
RNA
in r
RPLe
ptin
(ng/
ml)
1.0
0.5
0.0
910 S. Rajia et al.
ª 2010 The Authors. Journal Compilation ª 2010 Blackwell Publishing Ltd, Journal of Neuroendocrinology, 22, 905–914
Food intake and central appetite regulators
The total energy consumed by the offspring of obese HN dams
was 11% higher than that of offspring of lean CN dams in both
chow and HFD groups (P < 0.05 and 0.01, respectively; Table 3).
A similar pattern was observed when the net weight (gram) of
food consumed was examined (data not shown). No effect of
maternal postnatal overnutrition was observed. Across all mater-
nal groups, consumption of postweaning HFD led to a doubling
of energy intake compared to chow fed offspring (P < 0.001;
Table 3).
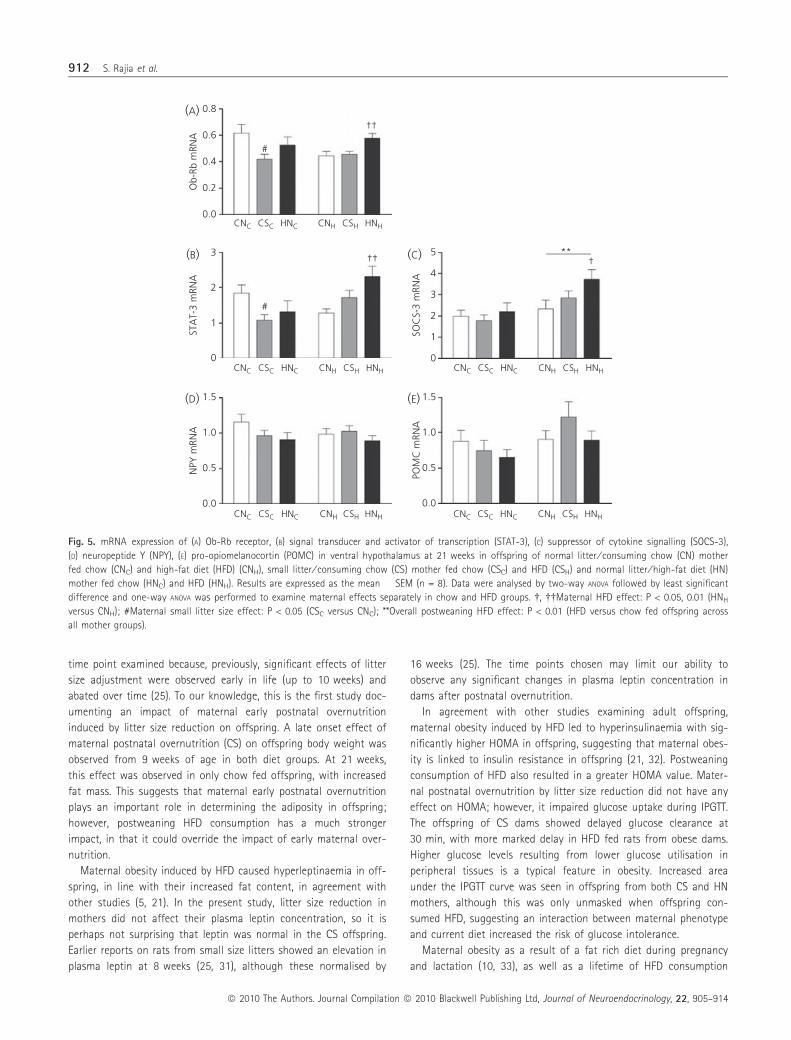
Within the chow diet group, maternal postnatal overnutrition as
a result of small litter size was associated with decreased hypotha-
lamic Ob-Rb mRNA expression in offspring (P < 0.05; Fig. 5A). Sig-
nificant increases in Ob-Rb mRNA were observed in offspring of
obese HN mothers consuming HFD (P < 0.01; Fig. 5A). STAT-3
mRNA expression showed a similar pattern to that of Ob-Rb
(Fig. 5B). HFD-induced maternal obesity also caused a significant
increase in SOCS-3 mRNA expression in offspring consuming HFD
(HNH versus CNH; P < 0.05; Fig. 5C). Postweaning HFD consumption
also caused an overall increase in SOCS-3 expression (P < 0.01;
Fig. 5C). No significant differences were observed in hypothalamic
NPY and POMC mRNA expression (Fig. 5D, E).
Discussion
A number of animal studies indicate that obesity may have a ‘pro-
grammed origin’ (3, 6, 10, 22). The present study shows that even a
short period of postnatal overnutrition in mother very early in life,
as a result of litter size reduction, can increase adiposity and glu-
cose intolerance in offspring. Frank maternal obesity as a result of
HFD feeding prior to and during pregnancy exerted greater effects
on offspring adiposity, and glucose and lipid homeostasis. Postwea-
ning diet also had an important impact because the effects of
maternal obesity appeared to be amplified when offspring con-
sumed HFD.
Maternal HFD consumption during pregnancy and lactation is an
important contributing factor to the development of obesity both
early life and adulthood (5, 10, 20). Altered milk composition of
obese mothers (29), as well as an increased quantity of milk con-
sumed by pups of obese mothers (5), may have contributed to their
early-onset obesity. As a result, in the present study, offspring from
obese dams (HN) showed significant increases in body weight gain
during development and at the endpoint they were heavier with
elevated BMI in both diet groups. Early postnatal overnutrition
imposed by reduced competition for milk during suckling did not
result in marked changes in adiposity or body weight in mothers.
Previous work from this and other laboratories showed litter size
reduction resulted in time-dependent increases in body weight, fat
mass and fat cell number (24, 25, 30). This may be related to the
Fig. 3. (A) Total white adipose tissue (WAT) sampled expressed as percent of body weight, (B) plasma leptin and (C) triglycerides (D) mRNA expression of adi-
pose triglyceride lipase (ATGL) in retroperitoneal WAT (rRP) at 21 weeks in offspring of normal litter ⁄ consuming chow (CN) mother fed chow (CNC) and high-
fat diet (HFD) (CNH), small litter ⁄ consuming chow (CS) mother fed chow (CSC) and HFD (CSH) and normal litter ⁄ high-fat diet (HN) mother fed chow (HNC) and
HFD (HNH). Results are expressed as the mean � SEM (n = 12–17). Data were analysed by two-way ANOVA followed by least significant difference and one-way
ANOVA was performed to examine maternal effects separately in chow and HFD groups. ���Maternal HFD effect: P < 0.001 (HNC versus CNC ⁄ HNH versus CNH);
##Maternal small litter size effect: P < 0.01 (CSC versus CNC); *, **, ***Overall postweaning HFD effect: P < 0.05, 0.01, 0.001 (HFD versus chow fed offspring
across all mother groups).
Score 0
Score 2 Score 3
Score 1
2.5
(A)
(B)
2.0
1.5
***
# ††
1.0
0.5
0.0
Ave
rage
live
r sc
ore
CNC CSC HNC CNH CSH HNH
Fig. 4. (A) Representative histological sections of liver, stained with hae-
motoxylin and eosin, from each of the four scoring grades (0 = No fat vac-
uoles; 1 = few fat vacuoles; 2 = increased number of small fat vacuoles
and some big vacuoles; 3 = hepatocytes filled by big fat vacuoles). (B) Aver-
age liver score at 21 weeks in offspring of normal litter ⁄ consuming chow
(CN) mother fed chow (CNC) and high-fat diet (HFD) (CNH), small litter ⁄ con-
suming chow (CS) mother fed chow (CSC) and HFD (CSH) and normal litter ⁄high-fat diet (HN) mother fed chow (HNC) and HFD (HNH). Results are
expressed as the mean � SEM (n = 8). Data were analysed by two-way ANO-
VA followed by least significant difference, and one-way ANOVA was performed
to look at maternal effects separately in chow and HFD groups. ��Maternal
HFD effect: P < 0.01 (HNH versus CNH); #Maternal small litter size effect:
P < 0.05 (CSH versus CNH); ***Overall postweaning HFD effect: P < 0.001
(HFD versus chow fed offspring across all mother groups).
Maternal adiposity influences offspring hormones and metabolic disorders 911
ª 2010 The Authors. Journal Compilation ª 2010 Blackwell Publishing Ltd, Journal of Neuroendocrinology, 22, 905–914
time point examined because, previously, significant effects of litter
size adjustment were observed early in life (up to 10 weeks) and
abated over time (25). To our knowledge, this is the first study doc-
umenting an impact of maternal early postnatal overnutrition
induced by litter size reduction on offspring. A late onset effect of
maternal postnatal overnutrition (CS) on offspring body weight was
observed from 9 weeks of age in both diet groups. At 21 weeks,
this effect was observed in only chow fed offspring, with increased
fat mass. This suggests that maternal early postnatal overnutrition
plays an important role in determining the adiposity in offspring;
however, postweaning HFD consumption has a much stronger
impact, in that it could override the impact of early maternal over-
nutrition.
Maternal obesity induced by HFD caused hyperleptinaemia in off-
spring, in line with their increased fat content, in agreement with
other studies (5, 21). In the present study, litter size reduction in
mothers did not affect their plasma leptin concentration, so it is
perhaps not surprising that leptin was normal in the CS offspring.
Earlier reports on rats from small size litters showed an elevation in
plasma leptin at 8 weeks (25, 31), although these normalised by
16 weeks (25). The time points chosen may limit our ability to
observe any significant changes in plasma leptin concentration in
dams after postnatal overnutrition.
In agreement with other studies examining adult offspring,
maternal obesity induced by HFD led to hyperinsulinaemia with sig-
nificantly higher HOMA in offspring, suggesting that maternal obes-
ity is linked to insulin resistance in offspring (21, 32). Postweaning
consumption of HFD also resulted in a greater HOMA value. Mater-
nal postnatal overnutrition by litter size reduction did not have any
effect on HOMA; however, it impaired glucose uptake during IPGTT.
The offspring of CS dams showed delayed glucose clearance at
30 min, with more marked delay in HFD fed rats from obese dams.
Higher glucose levels resulting from lower glucose utilisation in
peripheral tissues is a typical feature in obesity. Increased area
under the IPGTT curve was seen in offspring from both CS and HN
mothers, although this was only unmasked when offspring con-
sumed HFD, suggesting an interaction between maternal phenotype
and current diet increased the risk of glucose intolerance.
Maternal obesity as a result of a fat rich diet during pregnancy
and lactation (10, 33), as well as a lifetime of HFD consumption
CNC CSC HNC CNH CSH HNH
CNC
0.8
0.6
0.4
0.2
0.0
3
(A)
(B) (C)
(E)(D)
5
4
3
2
1
0
2
1
0
1.5
1.0
0.5
0.0
1.5
1.0
0.5
0.0
Ob-
Rb m
RNA
STA
T-3
mRN
AN
PY m
RNA
POM
C m
RNA
SOC
S-3
mRN
A
#
#
**
††
†† †
CSC HNC CNH CSH HNH
CNC CSC HNC CNH CSH HNH
CNC CSC HNC CNH CSH HNH CNC CSC HNC CNH CSH HNH
Fig. 5. mRNA expression of (A) Ob-Rb receptor, (B) signal transducer and activator of transcription (STAT-3), (C) suppressor of cytokine signalling (SOCS-3),
(D) neuropeptide Y (NPY), (E) pro-opiomelanocortin (POMC) in ventral hypothalamus at 21 weeks in offspring of normal litter ⁄ consuming chow (CN) mother
fed chow (CNC) and high-fat diet (HFD) (CNH), small litter ⁄ consuming chow (CS) mother fed chow (CSC) and HFD (CSH) and normal litter ⁄ high-fat diet (HN)
mother fed chow (HNC) and HFD (HNH). Results are expressed as the mean � SEM (n = 8). Data were analysed by two-way ANOVA followed by least significant
difference and one-way ANOVA was performed to examine maternal effects separately in chow and HFD groups. �, ��Maternal HFD effect: P < 0.05, 0.01 (HNH
versus CNH); #Maternal small litter size effect: P < 0.05 (CSC versus CNC); **Overall postweaning HFD effect: P < 0.01 (HFD versus chow fed offspring across
all mother groups).
912 S. Rajia et al.
ª 2010 The Authors. Journal Compilation ª 2010 Blackwell Publishing Ltd, Journal of Neuroendocrinology, 22, 905–914
(34), might cause a ‘malprogramming’ of hypothalamic neuropept-
idergic systems in offspring, leading to permanently altered appe-
tite regulatory function. Maternal junk food during gestation and
lactation has been linked to an exacerbated preference for fatty,
sugary and salty foods (20). This is possibly related to defective
leptin signalling in the hypothalamus. In the present study, hypo-
thalamic Ob-Rb was up-regulated in HFD-fed offspring from obese
dams (HN). Changes in mRNA expression of its downstream medi-
ator STAT-3 mirrored those in the Ob-Rb receptor. However, the
simultaneous up-regulation of the suppressor SOCS-3 may
counteract increased STAT-3 expression to cause central leptin
resistance (15). Although cafeteria diet and leptin are known to
modulate the hypothalamic appetite regulators NPY and POMC (5,
11, 23), central leptin resistance as a result of up-regulated
SOCS-3 may help to explain why, in the present study, elevated
leptin in HFD-fed rats failed to change hypothalamic NPY and
POMC expression in offspring from HN dams. Hyperphagia would
be consistent with SOCS-3 overexpression by HFD-induced mater-
nal obesity and offspring of HN dams ate more than the other
groups, especially when consuming HFD. This suggests that the
hypothalamic neuronal changes as a result of maternal obesity
led to transmission of increased susceptibility to hyperphagia and
obesity in offspring. An overall up-regulation of SOCS-3 was also
found with offspring following prolonged postweaning HFD con-
sumption, as shown previously (35). This may contribute to central
leptin resistance and thus lead to hyperphagia. Early postnatal
overnutrition led to hyperleptinaemia and down-regulation of
hypothalamic Ob-Rb receptor in rats, also suggesting leptin
resistance (31). In the present study, an effect of maternal early
postnatal overnutrition was also observed in the 21-week-old
chow fed offspring, with reduced expression of hypothalamic
Ob-Rb, which may reduce leptin binding and weaken its signalling.
This could further contribute to the downregulated STAT-3
observed in chow fed offspring. Overall, these data suggest that
different degrees of maternal overnutrition can alter offspring
appetite control differently.
Postweaning HFD caused increased fat mass with elevated leptin
and down-regulation of ATGL in rRP WAT. Adipose ATGL mRNA
expression has been shown to have strong negative correlations
with obesity and insulin resistance (36). There is some adaptive
increase in ATGL mRNA expression in chow fed offspring from HN
mothers, which was not sufficient to reverse adiposity and lipide-
mia. ATGL was down-regulated in insulin resistant HFD-fed off-
spring across all maternal groups in the present study, suggesting
a slower rate of lipolysis in HFD rats, contributing to concomitant
increases in plasma triglycerides and body fat mass.
Studies in human (2, 37) and animals (21) showed increased
blood pressure in offspring of obese mothers. Maternal obesity is
also associated with fatty liver (38, 39), which has been linked to
increased risk of cardiovascular disease (40). In the present study,
both degrees of maternal overnutrition led to increased hepatic
lipid content, but not on blood pressure, possibly as a result of the
tail-cuff methodology employed. Postweaning HFD caused an eleva-
tion in systolic and diastolic blood pressure, as shown previously
(25). Hyperleptinaemia and hyperinsulinaemia have both been linked
to sympathetic activation associated with obesity related hyperten-
sion (41, 42). This may explain our finding of an overall HFD effect
on blood pressure with increased leptin and insulin across all
mother groups. The HFD fed rats were also hyperphagic and most
likely leptin resistant, related to SOCS-3 overexpression. Selective
leptin resistance may contribute to the inability of leptin to activate
downstream signalling pathways in the arcuate nucleus but preser-
vation of leptin action in other cardiovascular-related hypothalamic
areas (41). Further investigation is needed to examine the cardio-
vascular consequences of maternal overnutrition and postweaning
HFD.
To conclude, the most important finding of the present study is
that even mild overnutrition of the mother early in life, as induced
by litter size reduction, led to increased adiposity, glucose intoler-
ance and altered brain appetite regulators in their offspring at
adulthood. A far greater impact of HFD-induced frank maternal
obesity was observed on offspring, who were at the highest risk of
metabolic disorders. Thus, the different degrees of maternal overnu-
trition differentially affected offspring adiposity, hormones, glucose
homeostasis and appetite regulators. Given the rising incidence of
obesity in women of childbearing age, maternal nutrition and body
weight prior to pregnancy has important implications for the health
of the next generation.
Acknowledgements
This work was supported by a project grant of the National Health and
Medical Research Council of Australia to MJ Morris and an Australian Post-
graduate Award to S Rajia. The authors declare that there are no competing
financial interests in relation to this work.
Received: 29 January 2010,
revised 25 March 2010,
accepted 5 April 2010
References
1 Sebire NJ, Jolly M, Harris JP, Wadsworth J, Joffe M, Beard RW, Regan L,
Robinson S. Maternal obesity and pregnancy outcome: a study of
287,213 pregnancies in London. Int J Obes Relat Metab Disord 2001;
25: 1175–1182.
2 Boney CM, Verma A, Tucker R, Vohr BR. Metabolic syndrome in child-
hood: association with birth weight, maternal obesity, and gestational
diabetes mellitus. Pediatrics 2005; 115: e290–e296.
3 Muhlhausler BS. Programming of the appetite-regulating neural network:
a link between maternal overnutrition and the programming of obesity?
J Neuroendocrinol 2007; 19: 67–72.
4 Cripps RL, Martin-Gronert MS, Archer ZA, Hales CN, Mercer JG, Ozanne
SE. Programming of hypothalamic energy balance gene expression in
rats by maternal diet during pregnancy and lactation. Clin Sci (Lond)
2009; 117: 85–93.
5 Chen H, Simar D, Lambert K, Mercier J, Morris MJ. Maternal and postna-
tal overnutrition differentially impact appetite regulators and fuel
metabolism. Endocrinology 2008; 149: 5348–5356.
6 Armitage JA, Khan IY, Taylor PD, Nathanielsz PW, Poston L. Developmen-
tal programming of the metabolic syndrome by maternal nutritional
imbalance: how strong is the evidence from experimental models in
mammals? J Physiol 2004; 561: 355–377.
Maternal adiposity influences offspring hormones and metabolic disorders 913
ª 2010 The Authors. Journal Compilation ª 2010 Blackwell Publishing Ltd, Journal of Neuroendocrinology, 22, 905–914
7 McMillen IC, Robinson JS. Developmental origins of the metabolic syn-
drome: prediction, plasticity, and programming. Physiol Rev 2005; 85:
571–633.
8 Breier BH, Vickers MH, Ikenasio BA, Chan KY, Wong WP. Fetal
programming of appetite and obesity. Mol Cell Endocrinol 2001; 185:
73–79.
9 Bouret SG, Simerly RB. Developmental programming of hypothalamic
feeding circuits. Clin Genet 2006; 70: 295–301.
10 White CL, Purpera MN, Morrison CD. Maternal obesity is necessary for
programming effect of high-fat diet on offspring. Am J Physiol Regul
Integr Comp Physiol 2009; 296: R1464–R1472.
11 Friedman JM, Halaas JL. Leptin and the regulation of body weight in
mammals. Nature 1998; 395: 763–670.
12 Schwartz MW, Woods SC, Porte D, Seeley RJ, Baskin DG. Central nervous
system control of food intake. Nature 2000; 404: 661–671.
13 Considine RV, Sinha MK, Heiman ML, Kriauciunas A, Stephens TW, Nyce
MR, Ohannesian JP, Marco CC, McKee LJ, Bauer TL, Caro JF. Serum
immunoreactive-leptin concentrations in normal-weight and obese
humans. N Engl J Med 1996; 334: 292–295.
14 Scarpace PJ, Zhang Y. Leptin resistance: a prediposing factor for diet-
induced obesity. Am J Physiol Regul Integr Comp Physiol 2009; 296:
R493–R500.
15 Bjørbæk C, Elmquist JK, Frantz JD, Shoelson SE, Flier JS. Identification of
SOCS-3 as a potential mediator of central leptin resistance. Mol Cell
1998; 1: 619–625.
16 Mark AL, Correia M, Morgan DA, Shaffer RA, Haynes WG. Obesity-
induced hypertension : new concepts from the emerging biology of
obesity. Hypertension 1999; 33: 537–541.
17 Budge H, Edwards LJ, McMillen IC, Bryce A, Warnes K, Pearce S, Ste-
phenson T, Symonds ME. Nutritional manipulation of fetal adipose tissue
deposition and uncoupling protein 1 messenger RNA abundance in the
sheep: differential effects of timing and duration. Biol Reprod 2004; 71:
359–365.
18 Ozanne SE, Lewis R, Jennings BJ, Hales CN. Early programming of weight
gain in mice prevents the induction of obesity by a highly palatable diet.
Clin Sci (Lond) 2004; 106: 141–145.
19 Bispham J, Gardner DS, Gnanalingham MG, Stephenson T, Symonds ME,
Budge H. Maternal nutritional programming of fetal adipose tissue
development: differential effects on messenger ribonucleic acid abun-
dance for uncoupling proteins and peroxisome proliferator-activated and
prolactin receptors. Endocrinology 2005; 146: 3943–3949.
20 Bayol SA, Farrington SJ, Stickland NC. A maternal ‘junk food’ diet in
pregnancy and lactation promotes an exacerbated taste for ‘junk food’
and a greater propensity for obesity in rat offspring. Br J Nutr 2007;
98: 843–851.
21 Samuelsson AM, Matthews PA, Argenton M, Christie MR, McConnell JM,
Jansen EHJM, Piersma AH, Ozanne SE, Twinn DF, Remacle C, Rowlerson
A, Poston L, Taylor PD. Diet-induced obesity in female mice leads to off-
spring hyperphagia, adiposity, hypertension, and insulin resistance. A
novel murine model of developmental programming. Hypertension 2008;
51: 383–392.
22 Morris MJ. Early life influences on obesity risk: maternal overnutrition
and programming of obesity. Expert Rev Endocrinol Metab 2009; 4:
625–637.
23 Hansen MJ, Jovanovska V, Morris MJ. Adaptive responses in hypotha-
lamic neuropeptide Y in the face of prolonged high-fat feeding in the
rat. J Neurochem 2004; 88: 909–916.
24 Plagemann A, Harder T, Rake A, Voits M, Fink H, Rohde W, Dorner G.
Perinatal elevation of hypothalamic insulin, acquired malformation
of hypothalamic galaninergic neurons, and syndrome x-like alterations
in adulthood of neonatally overfed rats. Brain Res 1999; 836: 146–
155.
25 Velkoska E, Cole TJ, Morris MJ. Early dietary intervention: long-term
effects on blood pressure, brain neuropeptide Y, and adiposity markers.
Am J Physiol Endocrinol Metab 2005; 288: E1236–E1243.
26 Schaalan M, El-Abhar HS, Barakat M, El-Denshary ES. Westernized-like-
diet-fed rats: effect on glucose homeostasis, lipid profile, and adipocyte
hormones and their modulation by rosiglitazone and glimepiride. J Dia-
betes Complications 2009; 23: 199–208.
27 Muniyappa R, Chen H, Muzumdar RH, Einstein FH, Yan X, Yue LQ, Barzi-
lai N, Quon MJ. Comparison between surrogate indexes of insulin sensi-
tivity ⁄ resistance and hyperinsulinemic euglycemic clamp estimates in
rats. Am J Physiol Endocrinol Metab 2009; 297: E1023–E1029.
28 Velkoska E, Warner FJ, Cole TJ, Smith I, Morris MJ. Metabolic effects of
low dose angiotensin converting enzyme inhibitor in dietary obesity in
the rat. Nutr Metab Cardiovasc Dis 2010; 20: 49–55.
29 Gorski JN, Dunn-Meynell AA, Hartman TG, Levin BE. Postnatal environ-
ment overrides genetic and prenatal factors influencing offspring obesity
and insulin resistance. Am J Physiol Regul Integr Comp Physiol 2006;
291: R768–R778.
30 Bassett DR, Craig BW. Influence of early nutrition on growth and adi-
pose tissue characteristics in male and female rats. J Appl Physiol 1988;
64: 1249–1256.
31 Lopez M, Seoane LM, Tovar S, Garcia MC, Nogueiras R, Dieguez C, Sen-
aris RM. A possible role of neuropeptide Y, agouti-related protein and
leptin receptor isoforms in hypothalamic programming by perinatal
feeding in the rat. Diabetologia 2005; 48: 140–148.
32 Nivoit P, Morens C, Van Assche FA, Jansen E, Poston L, Remacle C, Reu-
sens B. Established diet-induced obesity in female rats leads to offspring
hyperphagia, adiposity and insulin resistance. Diabetologia 2009; 52:
1133–1142.
33 Chang G-Q, Gaysinskaya V, Karatayev O, Leibowitz SF. Maternal high-fat
diet and fetal programming: increased proliferation of hypothalamic
peptide-producing neurons that increase risk for overeating and obesity.
J Neurosci 2008; 28: 12107–12119.
34 Howie GJ, Sloboda DM, Kamal T, Vickers MH. Maternal nutritional history
predicts obesity in adult offspring independent of postnatal diet. J Phys-
iol 2009; 15: 905–915.
35 Plut C, Ribiere C, Giudicelli Y, Dausse J-P. Hypothalamic leptin receptor
and signaling molecule expressions in cafeteria diet-fed rats. J Pharma-
col Exp Ther 2003; 307: 544–549.
36 Jocken JWE, Langin D, Smit E, Saris WHM, Valle C, Hul GB, Holm C, Ar-
ner P, Blaak EE. Adipose triglyceride lipase and hormone-sensitive lipase
protein expression is decreased in the obese insulin-resistant state. J Clin
Endocrinol Metab 2007; 92: 2292–2299.
37 Mamun AA, O’Callaghan M, Callaway L, Williams G, Najman J, Lawlor
DA. Associations of gestational weight gain with offspring body mass
index and blood pressure at 21 years of age: evidence from a birth
cohort study. Circulation 2009; 119: 1720–1727.
38 Elahi MM, Cagampang FR, Mukhtar D, Anthony FW, Ohri SK, Hanson
MA. Long-term maternal high-fat feeding from weaning through preg-
nancy and lactation predisposes offspring to hypertension, raised plasma
lipids and fatty liver in mice. Br J Nutr 2009; 102: 514–519.
39 McCurdy CE, Bishop JM, Williams SM, Grayson BE, Smith MS, Friedman
JE, Grove KL. Maternal high-fat diet triggers lipotoxicity in the fetal liv-
ers of nonhuman primates. J Clin Invest 2009; 119: 323–335.
40 Edens MA, Kuipers F, Stolk RP. Non-alcoholic fatty liver disease is asso-
ciated with cardiovascular disease risk markers. Obes Rev 2009; 10:
412–419.
41 Rahmouni K, Correia ML, Haynes WG, Mark AL. Obesity-associated hyper-
tension: new insights into mechanisms. Hypertension 2005; 45: 9–14.
42 Ferrannini E, Buzzigoli G, Bonadonna R, Giorico MA, Oleggini M, Grazia-
dei L, Pedrinelli R, Brandi L, Bevilacqua S. Insulin resistance in essential
hypertension. New Engl J Med 1987; 317: 350–357.
914 S. Rajia et al.
ª 2010 The Authors. Journal Compilation ª 2010 Blackwell Publishing Ltd, Journal of Neuroendocrinology, 22, 905–914