maternal mortality review update - university at albany, sunymarch 23, 2017 maternal mortality...
TRANSCRIPT
March 23, 2017
Maternal Mortality Review Update
Preliminary Findings from the Review of 2012-2013 Maternal DeathsVictoria Lazariu, PhDDivision of Family Health, New York State Department of Health

March 23, 2017 2
MMR TeamDr. Marilyn Kacica, MD MPH
Dr. Chris Kus, MD, MPH SPH:Sava Svirskiy Eva Williford, MSTim Eager, MS Kate Mishkin, MPHBrandi Wells, MPH
IPRO:Marilyn Zumbo and Deborah Phaff

March 23, 2017 3
Our PartnersMark Sharp, Vital Statistics
Lenny Kluz, Assistant Director Vital Records
Colleen Kewley, NYPORTS Coordinator

March 23, 2017 4
Outline• Background
• Recent Trends in Maternal Mortality Trends As Reported in Vital Records
• Findings from the Review of 2012-2013 Maternal Deaths
• What Did We Learn from Maternal Mortality Reviews?– Differences in Two Cohorts: 2006-2008 vs 2012-2013
• Next Steps
March 23, 2017 5
Background
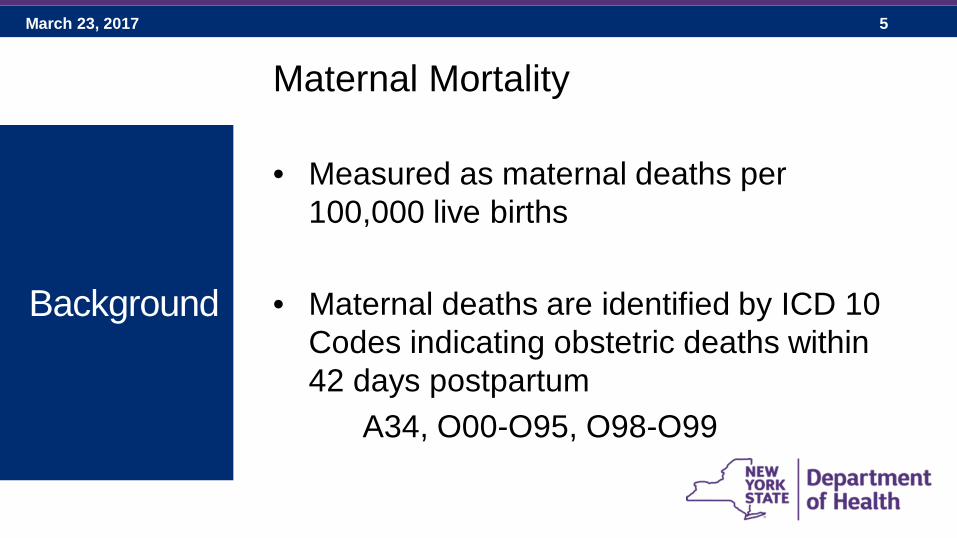
Maternal Mortality
• Measured as maternal deaths per 100,000 live births
• Maternal deaths are identified by ICD 10 Codes indicating obstetric deaths within 42 days postpartum
A34, O00-O95, O98-O99
March 23, 2017 6
Background
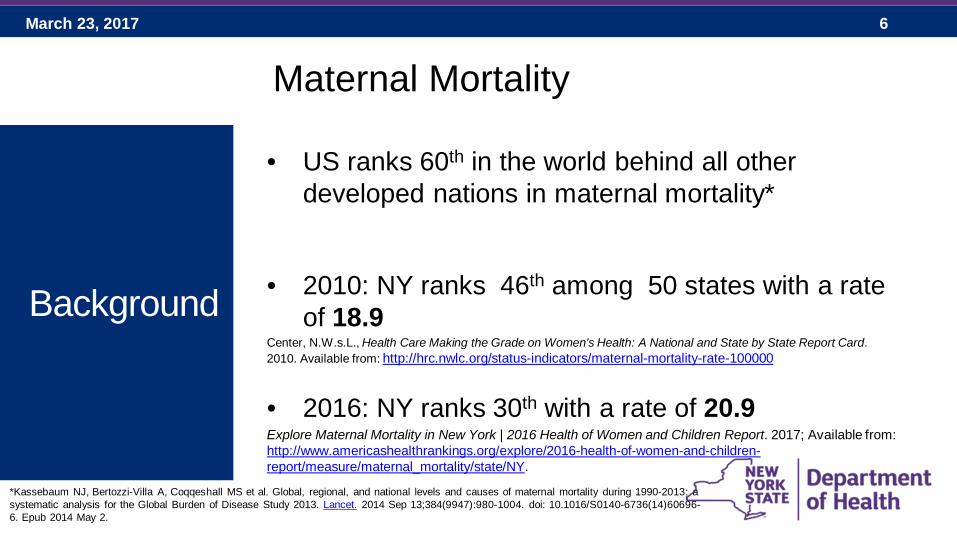
Maternal Mortality
• US ranks 60th in the world behind all other developed nations in maternal mortality*
• 2010: NY ranks 46th among 50 states with a rate of 18.9
Center, N.W.s.L., Health Care Making the Grade on Women's Health: A National and State by State Report Card. 2010. Available from: http://hrc.nwlc.org/status-indicators/maternal-mortality-rate-100000
• 2016: NY ranks 30th with a rate of 20.9Explore Maternal Mortality in New York | 2016 Health of Women and Children Report. 2017; Available from: http://www.americashealthrankings.org/explore/2016-health-of-women-and-children-report/measure/maternal_mortality/state/NY.
*Kassebaum NJ, Bertozzi-Villa A, Coqqeshall MS et al. Global, regional, and national levels and causes of maternal mortality during 1990-2013: a systematic analysis for the Global Burden of Disease Study 2013. Lancet. 2014 Sep 13;384(9947):980-1004. doi: 10.1016/S0140-6736(14)60696-6. Epub 2014 May 2.

March 23, 2017 7
Trends in Maternal Mortality as Reported in Vital Records*
*Causes of death from death records A34, O00-O95,O98-O99. 2000-2014 data from NY Vital Records. 2015 NY and national data from CDC Wonder database.

March 23, 2017 8
Trends in Maternal Mortality as Reported in Vital Records*
*Causes of death from death records A34, O00-O95,O98-O99.
March 23, 2017 9
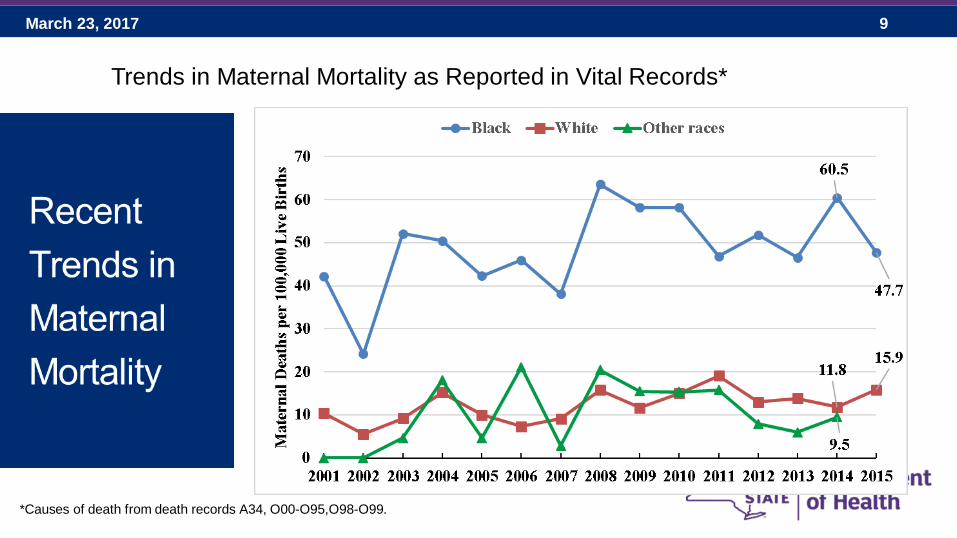
Trends in Maternal Mortality as Reported in Vital Records*
*Causes of death from death records A34, O00-O95,O98-O99.

March 23, 2017 10
Maternal MortalityReviews, 2012-2013
• Case identification
• Pregnancy-related deaths
• Pregnancy-associated, not related deaths
March 23, 2017 11
Maternal MortalityReviews, 2012-2013
Pregnancy-related death is the death of a woman while pregnant or within a year from termination of pregnancy, occurring as result of a pregnancy-related illness (i.e. preeclampsia) or as a result of an underlying illness exacerbated by the physiology of pregnancy (i.e. mitral stenosis.) • A pregnancy-related death that occurred within 42 days
of the termination of the pregnancy is a maternal death.
Pregnancy-associated, not related death is the death of a woman while pregnant or within one year of termination of pregnancy from any cause, not as a cause of pregnancy or illness exacerbated by pregnancy (i.e. motor vehicle accident.)

March 23, 2017 12
Identified 216 women of reproductive age who died within a year of the end of a pregnancy
• 99 deaths linked to a live birth record• 117 deaths not linked to a live birth records but
• With an obstetric cause of death or• With pregnancy indicated on death record or• Linked to hospital records with an indication of pregnancy
Maternal MortalityReviews, 2012-2013
Case Identification
March 23, 2017 13
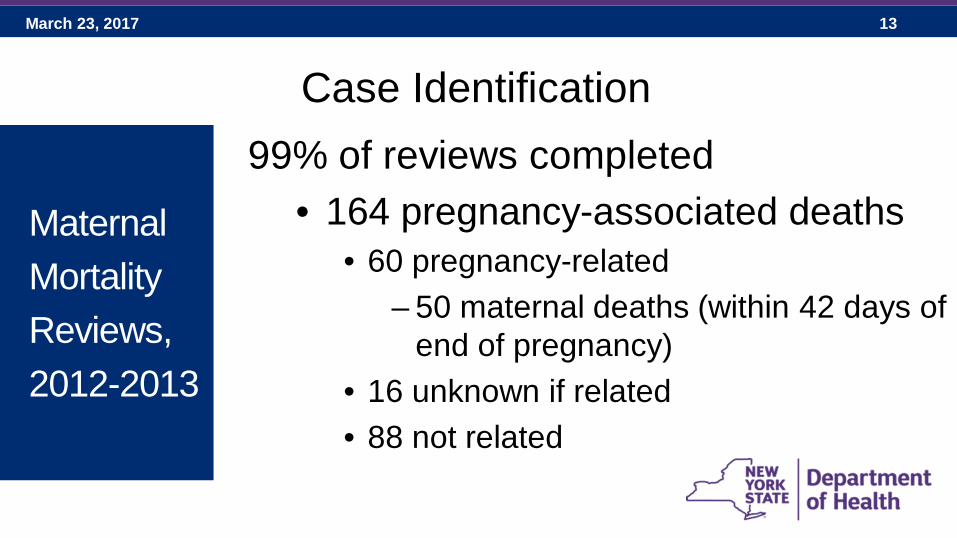
99% of reviews completed• 164 pregnancy-associated deaths
• 60 pregnancy-related– 50 maternal deaths (within 42 days of
end of pregnancy)• 16 unknown if related• 88 not related
Maternal MortalityReviews, 2012-2013
Case Identification

March 23, 2017 14
99% of reviews completed• 46 ‘false’ pregnancies
• 29 obstetric causes of death on death record (17 of them had pregnancy checked on death record)
• 2 pregnancy checked but no obstetric cause of death
• 15 indication of pregnancy on hospital record
Maternal MortalityReviews, 2012-2013
Case Identification
March 23, 2017 15
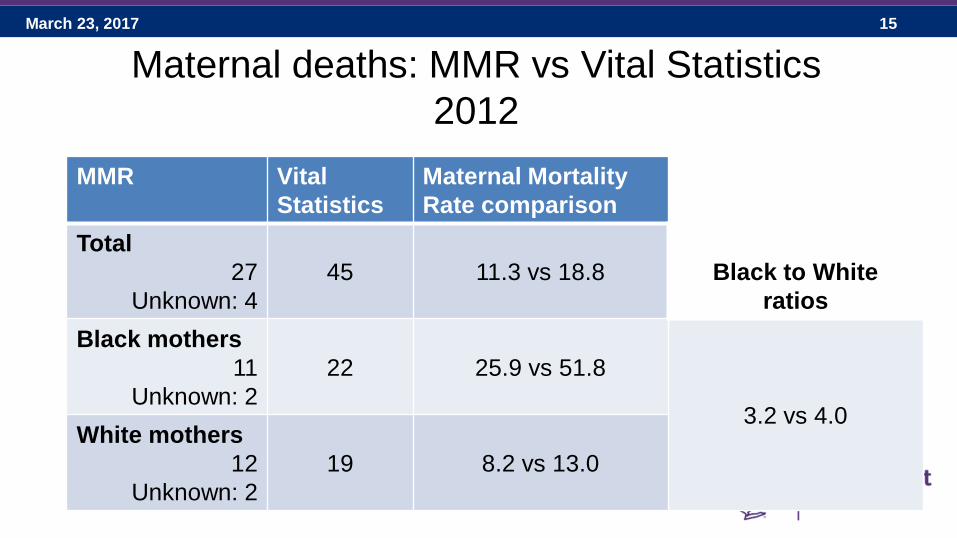
Maternal deaths: MMR vs Vital Statistics2012
MMR Vital Statistics
Maternal Mortality Rate comparison
Black to Whiteratios
Total27
Unknown: 445 11.3 vs 18.8
Black mothers11
Unknown: 222 25.9 vs 51.8
3.2 vs 4.0White mothers
12Unknown: 2
19 8.2 vs 13.0
March 23, 2017 16
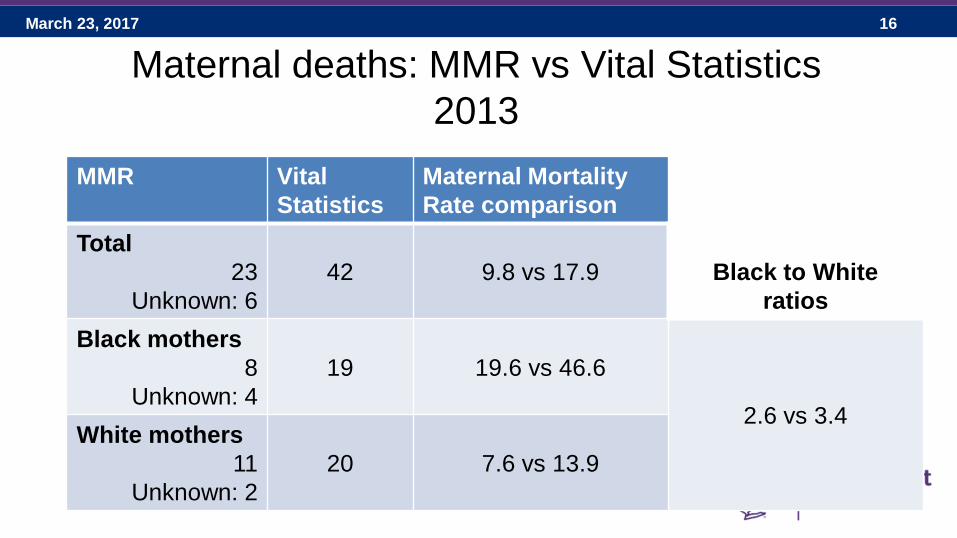
Maternal deaths: MMR vs Vital Statistics2013
MMR Vital Statistics
Maternal Mortality Rate comparison
Black to Whiteratios
Total23
Unknown: 642 9.8 vs 17.9
Black mothers8
Unknown: 419 19.6 vs 46.6
2.6 vs 3.4White mothers
11Unknown: 2
20 7.6 vs 13.9

March 23, 2017 17
Maternal MortalityReviews, 2012-2013
Pregnancy-Related Deaths, n=60

March 23, 2017 18
Maternal Demographics
Maternal MortalityReviews, 2012-2013
• Average age: 33 years old
• Primary language : English (63%)
• Marital status: even distribution between single and married
• Ethnicity: – Hispanic or Latino 17%, 10– Not Hispanic 73%, 44– Unknown 10%, 6

March 23, 2017 19
Demographics: Mother’s Race
Maternal MortalityReviews, 2012-2013

March 23, 2017 20
Maternal Demographics
Maternal MortalityReviews, 2012-2013
• Almost a half of the women in the cohort were employed during the index pregnancy
• Health insurance:– Medicaid 67%, 40– Private insurance 23%, 14
March 23, 2017 21
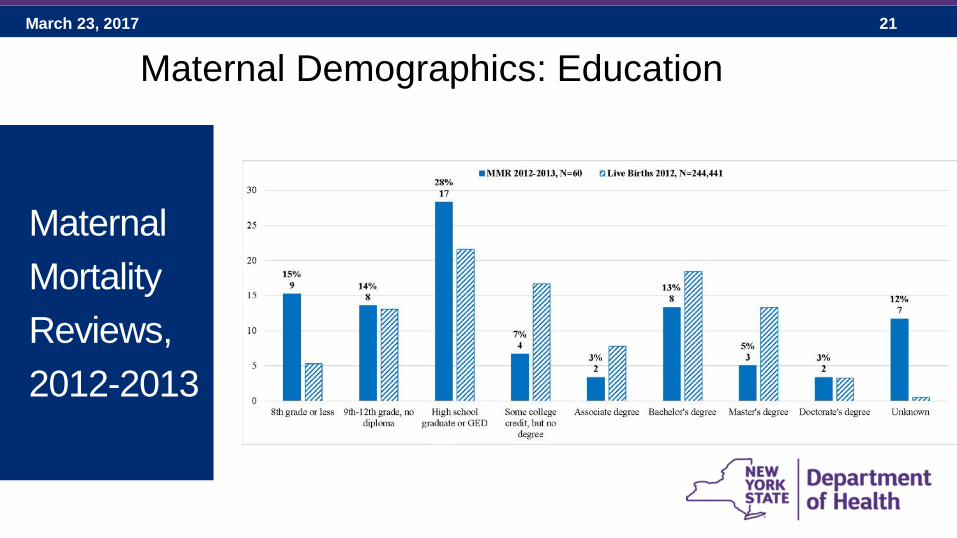
Maternal Demographics: Education
Maternal MortalityReviews, 2012-2013

March 23, 2017 22
Maternal MortalityReviews, 2012-2013
Prenatal history
Parity: • 32% no previous births • 13% had one previous birth• 28% 2 or more• 27% unknown

March 23, 2017 23
Maternal MortalityReviews, 2012-2013
Prenatal history
Prenatal care records: • 50% (n=30) prenatal care records• 12% (n=7) prenatal care summary
High risk or MFM care• 10% (n=6)

March 23, 2017 24
Maternal MortalityReviews, 2012-2013
Prenatal history
Prenatal care received: • Intensive care 3%, 2• Adequate care 28%, 17• Intermediate care 13%, 8• No prenatal care 3%, 2• Missing information 45%, 27
March 23, 2017 25
Maternal MortalityReviews, 2012-2013
Prenatally-Identified Risk Factors
Majority of women (85%) had at least one risk factor.
March 23, 2017 26
Maternal MortalityReviews, 2012-2013
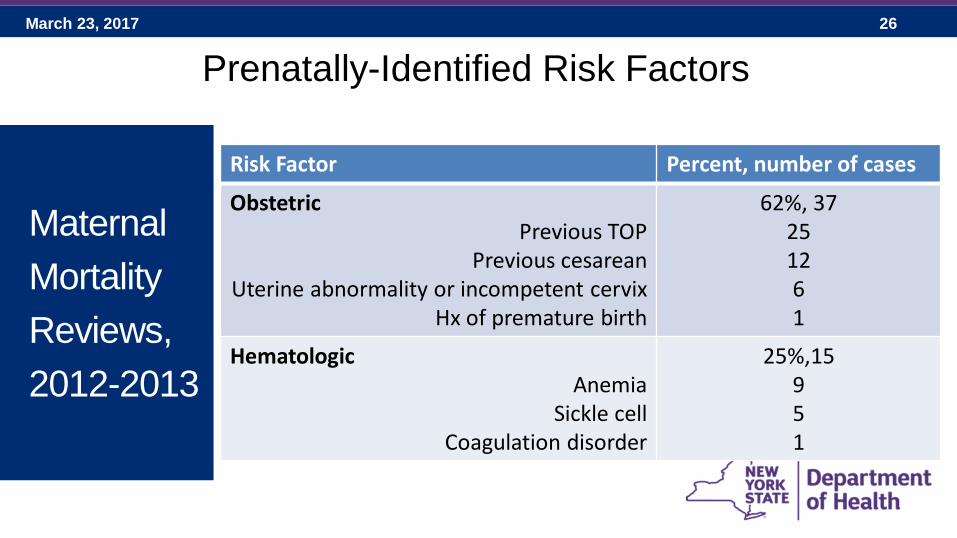
Prenatally-Identified Risk Factors
Risk Factor Percent, number of cases
ObstetricPrevious TOP
Previous cesareanUterine abnormality or incompetent cervix
Hx of premature birth
62%, 37251261
HematologicAnemia
Sickle cellCoagulation disorder
25%,15951

March 23, 2017 27
Maternal MortalityReviews, 2012-2013
Prenatally-Identified Risk Factors
Risk Factor Percent, number of cases
CardiacCardiomyopathy
Mitral valve prolapseMurmur
CHFCongenital heart defect
Dilated aortic rootIntraarterial septal aneurysm
Tachycardia arrthythmia
18%, 1122211111

March 23, 2017 28
Maternal MortalityReviews, 2012-2013
Prenatally-Identified Risk Factors
Risk Factor Percent, number of cases
PulmonaryAsthma
Tuberculosis+PPD
18%, 11722
EndocrineDiabetes
Type 2 (4), type 1(1), gestational (1)Thyroid disorder
Hypothyroidism (2), Hx of abnormal thyroid test (1)
17%,106
4

March 23, 2017 29
Maternal MortalityReviews, 2012-2013
Prenatally-Identified Risk Factors
Risk Factor Percent, number of cases
Hypertension 17%, 10
Psychiatric disordersDepression
AnxietyBipolar
Schizoaffective
12%,74311

March 23, 2017 30
Prenatally-Identified Risk Factors
Risk factorRace Ethnicity
Black White Asian Other Hispanic Not Hispanic Unknown
Obstetric 19 13 4 1 6 29 2
Hematologic 11 3 0 1 1 13 1
Cardiac 5 4 0 2 2 5 4
Pulmonary 6 4 1 0 4 7 0
Endocrine 6 4 0 0 0 6 4
Hypertension 8 2 0 0 0 7 3
Psychiatric disorder 2 5 0 0 3 4 0
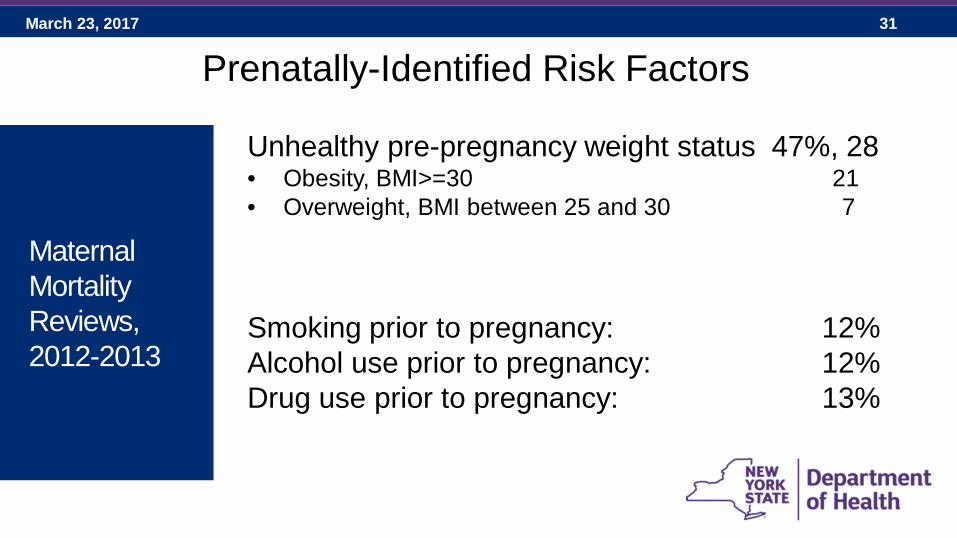
March 23, 2017 31
Unhealthy pre-pregnancy weight status 47%, 28• Obesity, BMI>=30 21• Overweight, BMI between 25 and 30 7
Smoking prior to pregnancy: 12% Alcohol use prior to pregnancy: 12%Drug use prior to pregnancy: 13%
Maternal MortalityReviews, 2012-2013
Prenatally-Identified Risk Factors

March 23, 2017 32
Maternal MortalityReviews, 2012-2013
Intrapartum Medical HistoryHospital of delivery or termination of pregnancy
• Regional Perinatal Center (35%, n=21)• Level 3 hospital (25%, n=15) • Level 2 hospital (17%, n=10)• Level 1 hospital (12%, n=7)
March 23, 2017 33
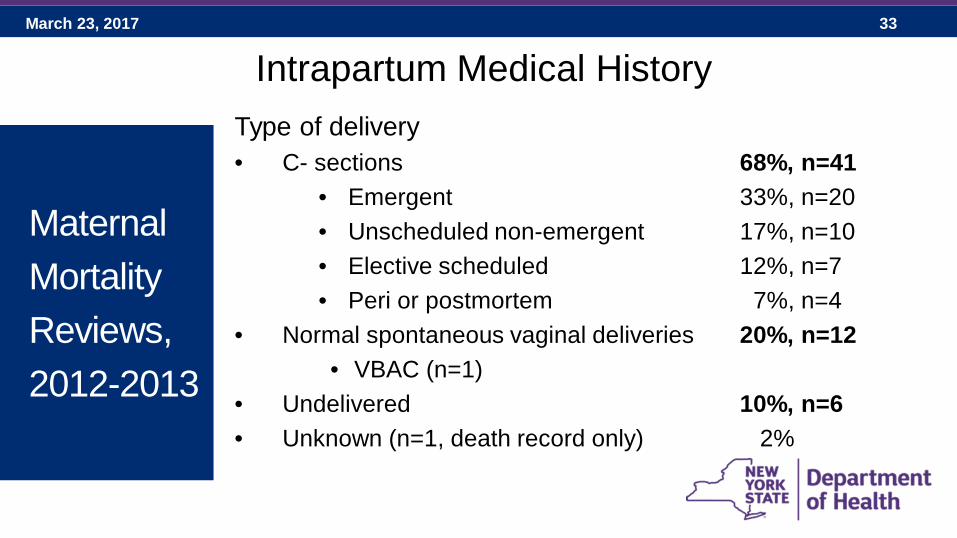
Maternal MortalityReviews, 2012-2013
Intrapartum Medical HistoryType of delivery• C- sections 68%, n=41
• Emergent 33%, n=20• Unscheduled non-emergent 17%, n=10• Elective scheduled 12%, n=7• Peri or postmortem 7%, n=4
• Normal spontaneous vaginal deliveries 20%, n=12• VBAC (n=1)
• Undelivered 10%, n=6• Unknown (n=1, death record only) 2%

March 23, 2017 34
• Embolism (not cerebral) 30% (n=18)• Hemorrhage 18% (n=11)• Infection 15% (n=9)• Cardiomyopathy 10% (n=6)• Hypertensive disorders 10% (n=6)• Cardiovascular problems 5% (n=3)• Cardiac arrest/failure 3% (n=2)• Hematopoietic (sickle cell, thalassemia, ITP) 3% (n=2)• Intracerebral hemorrhage (not associated with PIH) 3% (n=2)• Pulmonary problems 2% (n=1)
Maternal MortalityReviews, 2012-2013
Causes of Death Among Pregnancy-Related Deaths (n=60)
March 23, 2017 35
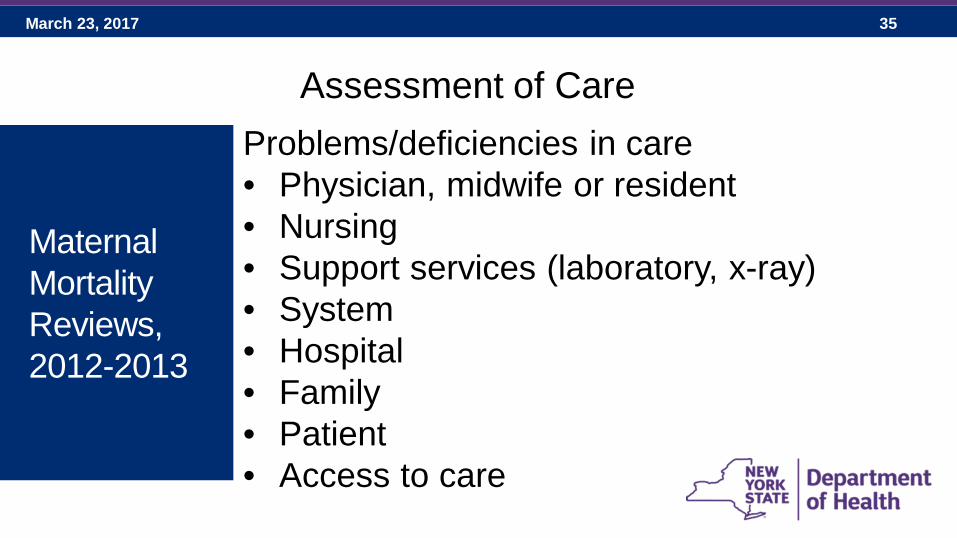
Maternal MortalityReviews, 2012-2013
Problems/deficiencies in care• Physician, midwife or resident• Nursing• Support services (laboratory, x-ray)• System• Hospital• Family• Patient• Access to care
Assessment of Care

March 23, 2017 36
Maternal MortalityReviews, 2012-2013
Failure to recognize and treat 9 cases• ‘failure to recognize maternal hemorrhage and to treat timely and
aggressively’
Delay in treatment 5 cases• ‘Delay in proceeding with D&C hysterectomy’
Lack of supervision 2 cases• ‘attending - lack of supervision’
Break in communication 2 cases• ‘Unrecognized hypovolemic shock/ unsupervised PACU patient/poor
communication’
Deficiency: Physician, midwife or resident (n=10)

March 23, 2017 37
Maternal MortalityReviews, 2012-2013
Not following protocols 4 cases• ‘ escalation policy which was in place was not adhered to’
Break in communication 4 cases• ‘Nursing should have reached out to on call attending if provider not
able to be contacted. Escalation policy which was in place was not adhere to.’
Failure to recognize severity 3 cases• ‘failure to recognize post operative infection’
Delay in administering treatment 1 case• ‘ delay in administering antibiotics’
Deficiency: Nursing (n=7)
March 23, 2017 38
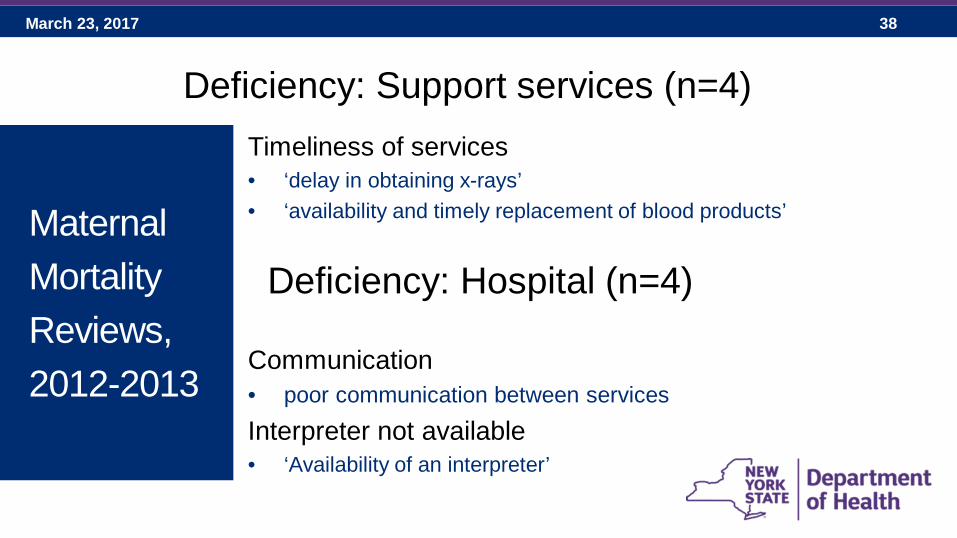
Maternal MortalityReviews, 2012-2013
Timeliness of services• ‘delay in obtaining x-rays’• ‘availability and timely replacement of blood products’
Deficiency: Support services (n=4)
Deficiency: Hospital (n=4)
Communication• poor communication between servicesInterpreter not available • ‘Availability of an interpreter’

March 23, 2017 39
Maternal MortalityReviews, 2012-2013
Protocols not in place or not followed 7 cases• ‘no availability of a comprehensive protocol for management of
post partum hemorrhage’
Inadequate resources (ICU beds, supplies) 3 cases• ‘unavailability of ICU beds, unavailability of thrombolytic agents in
a timely manner’
Inadequate staff (level and education) 2 cases• ‘provider not informed of patient’s relevant medical history’
Deficiency: System (n=10)

March 23, 2017 40
Maternal MortalityReviews, 2012-2013
Patient not following treatment/recommendations
• ‘termination of pregnancy was recommended, patient refused ‘
• ‘patient did not seek prenatal care, smoked, drunk and used illicit drugs’
• ‘patient discontinued anti seizure medication – thought would harm the baby’
• ‘mental illness may have played a role in patient seeking care - not clear but unlikely’
Deficiency: Patient (n=15)

March 23, 2017 41
Maternal MortalityReviews, 2012-2013
Lack of support to follow medical recommendations • ‘did the family tried to help patient quit smoking?’• ‘did not bring her for post operative care’ • ‘Patient has 6 children, unknown if failure to keep appointment is due
to lack of home help’
Domestic violence • ‘FOB assaulted the patient’
Deficiency: Family (n=6)
Deficiency: Access to care (n=2)• No health insurance
March 23, 2017 42
Maternal MortalityReviews, 2012-2013
Pregnancy-Associated Deaths, n=104

March 23, 2017 43
• Average age: 30 years old
• Race– White 59%, 61– Black 25%, 26– Asian 5%, 5– American Indian or Alaska Native 2%, 2– Other 10%, 10
• Ethnicity– Hispanic or Latino 18%, 19– Not Hispanic 49%, 51– Unknown 33%, 34
Maternal MortalityReviews, 2012-2013
Maternal Demographics (n=104)
March 23, 2017 44
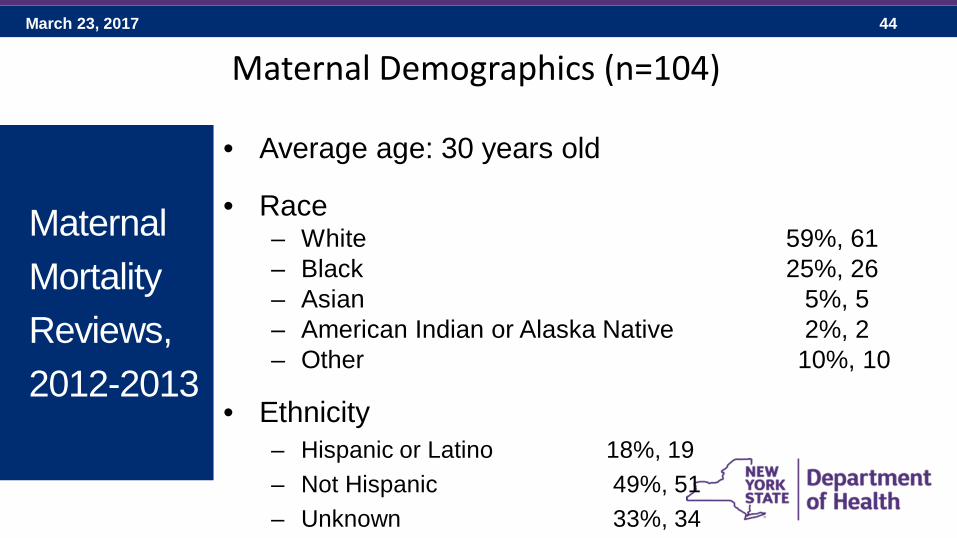
• Average age: 30 years old
• Race– White 59%, 61– Black 25%, 26– Asian 5%, 5– American Indian or Alaska Native 2%, 2– Other 10%, 10
• Ethnicity– Hispanic or Latino 18%, 19– Not Hispanic 49%, 51– Unknown 33%, 34
Maternal MortalityReviews, 2012-2013
Maternal Demographics (n=104)

March 23, 2017 45
Type of delivery• NVSD 28%, 29
• VBAC 3
• Cesarean delivery 23%, 24• Unscheduled not emergent 9• Elective/scheduled 8• Emergent 6• Peri or post-mortem 1
• Undelivered 18%, 19• Other 3%, 3• Unknown 28%, 29
Maternal MortalityReviews, 2012-2013
Intrapartum Medical History (n=104)

March 23, 2017 46
Place of delivery• Regional perinatal center 24%, 25• Level 3 hospital 15%, 16• Level 2 hospital 7%, 7• Level 1 hospital 5%, 5• Non-birthing facility 4%, 4• Home 1%, 1• Jail 1%, 1• Unknown 43%,45
Maternal MortalityReviews, 2012-2013
Intrapartum Medical History (n=104)
March 23, 2017 47
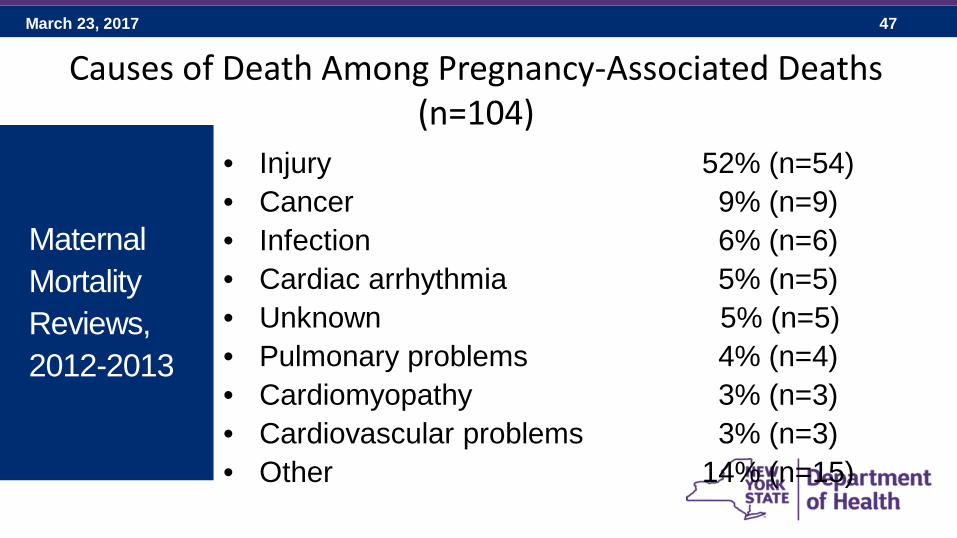
• Injury 52% (n=54)• Cancer 9% (n=9)• Infection 6% (n=6)• Cardiac arrhythmia 5% (n=5)• Unknown 5% (n=5)• Pulmonary problems 4% (n=4)• Cardiomyopathy 3% (n=3)• Cardiovascular problems 3% (n=3)• Other 14% (n=15)
Maternal MortalityReviews, 2012-2013
Causes of Death Among Pregnancy-Associated Deaths (n=104)
March 23, 2017 48
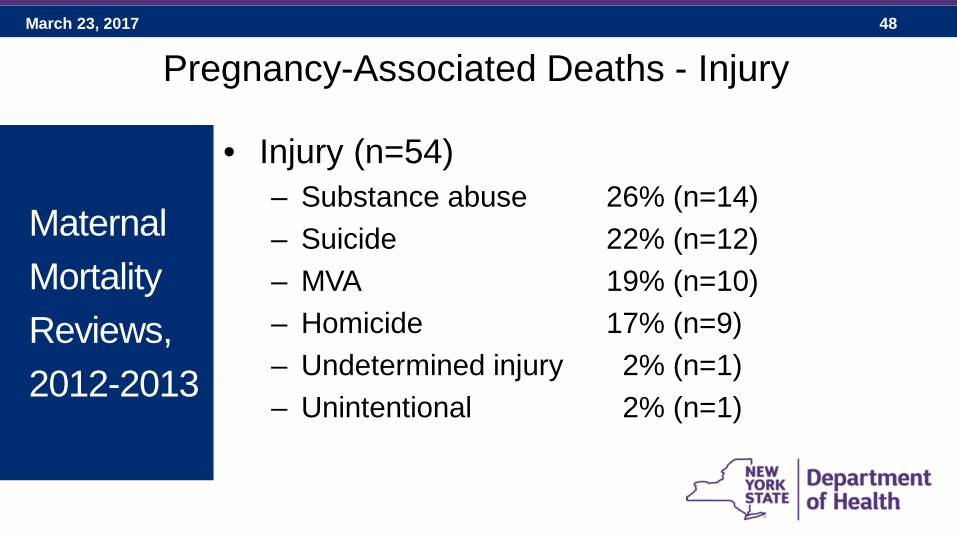
• Injury (n=54)– Substance abuse 26% (n=14)– Suicide 22% (n=12)– MVA 19% (n=10)– Homicide 17% (n=9)– Undetermined injury 2% (n=1)– Unintentional 2% (n=1)
Maternal MortalityReviews, 2012-2013
Pregnancy-Associated Deaths - Injury

March 23, 2017 49
What did we learn from Maternal Mortality Reviews
March 23, 2017 50
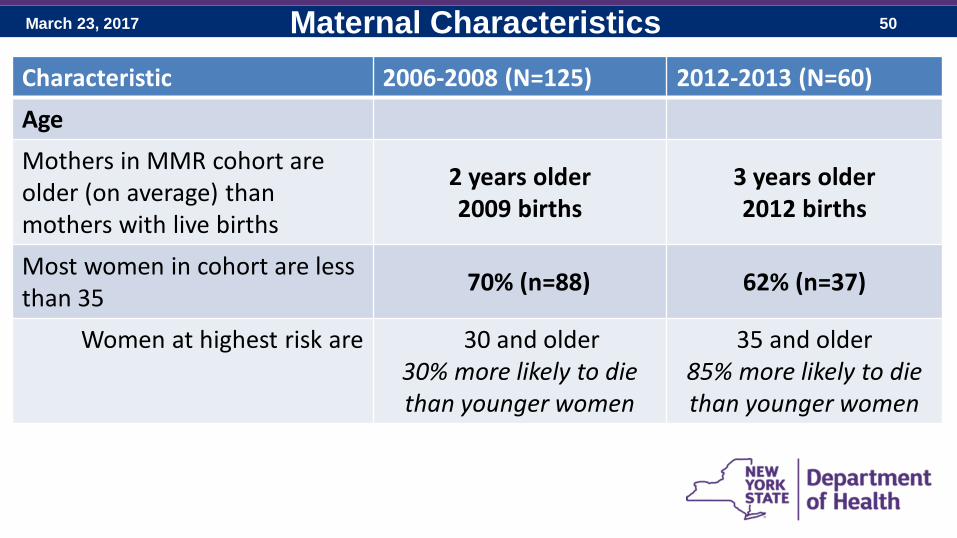
Characteristic 2006-2008 (N=125) 2012-2013 (N=60)AgeMothers in MMR cohort are older (on average) than mothers with live births
2 years older 2009 births
3 years older2012 births
Most women in cohort are less than 35 70% (n=88) 62% (n=37)
Women at highest risk are 30 and older 30% more likely to die than younger women
35 and older 85% more likely to die than younger women
Maternal Characteristics

March 23, 2017 51
Characteristic 2006-2008 (N=125) 2012-2013 (N=60)Race
BlackWhiteAsianOther
Native HawaiianUnknown
46%18%10%8%1%18%
42%43%10%5%0%0%
Maternal Characteristics

March 23, 2017 52
Characteristic 2006-2008 (N=125)
2012-2013 (N=60)
Pre-pregnancy weight statusOverweight (BMI between 25 and 30) 15% (n=19) 12% (n=7)
Obese (BMI of 30 or more) 30% (n=38) 35% (n=21)
Substance use prior to pregnancySmoking 12% (n=15) 12% (n=7)Alcohol 2% (n=3) 12% (n=7)
Drug use 6% (n=7) 13% (n=8)
Maternal Characteristics
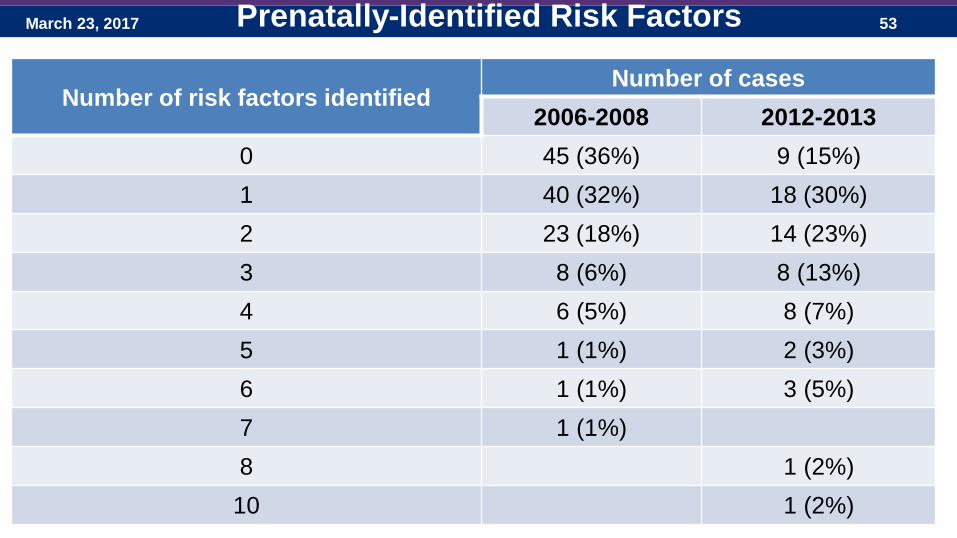
March 23, 2017 53Prenatally-Identified Risk Factors
Number of risk factors identifiedNumber of cases
2006-2008 2012-20130 45 (36%) 9 (15%)1 40 (32%) 18 (30%)2 23 (18%) 14 (23%)3 8 (6%) 8 (13%)4 6 (5%) 8 (7%)5 1 (1%) 2 (3%)6 1 (1%) 3 (5%)7 1 (1%)8 1 (2%)
10 1 (2%)
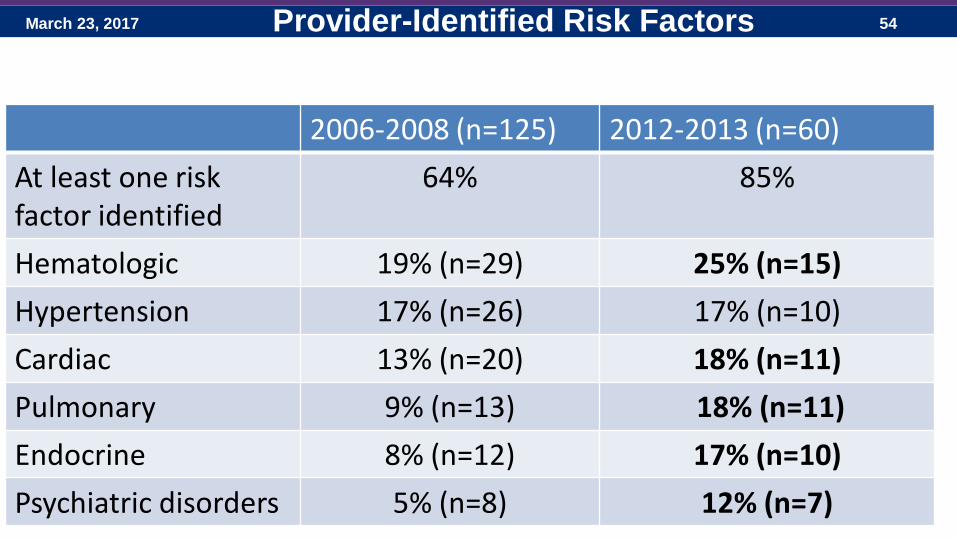
March 23, 2017 54
2006-2008 (n=125) 2012-2013 (n=60)At least one risk factor identified
64% 85%
Hematologic 19% (n=29) 25% (n=15)Hypertension 17% (n=26) 17% (n=10)Cardiac 13% (n=20) 18% (n=11)Pulmonary 9% (n=13) 18% (n=11)Endocrine 8% (n=12) 17% (n=10)Psychiatric disorders 5% (n=8) 12% (n=7)
Provider-Identified Risk Factors

March 23, 2017 55
2006-2008 (n=125) 2012-2013 (n=60)
Regional perinatal centerLevel 3Level 2Level 1
30%, 3046%, 5710%, 1310%, 12
35%, 2125%, 1517%, 1012%, 7
Place of delivery
Intrapartum Medical History

March 23, 2017 56
2006-2008 (n=125) 2012-2013 (n=60)Type of delivery
Cesarean birth 63% 68%
Outcome of pregnancyUndelivered 10% (n=13) 7% (n=4)
Stillborn 6% (n=8) 8% (n=5)Singleton 70% (n=89) 75% (n=45)
Multifetal, live births 2% (n=3) 3% (n=2)
Intrapartum Medical History

March 23, 2017 57
Pregnancy-Related Deaths
Cause of death 2006-2008 (n=125) 2012-2013 (n=60)Hemorrhage 23% (n=29) 18% (n=11)Hypertensive disorders 23% (n=29) 10% (n=6)Embolism 17% (n=21) 30% (n=18)Cardiovascular problems 10% (n=12) 5% (n=3)Infection 3% (n=4) 15% (n=9)Cardiomyopathy 2% (n=2) 10% (n=6)

March 23, 2017 58
Pregnancy-Associated Deaths
Top four causes of death2006-2008 (n=215) 2012-2013 (n=104)
Cancer 25%, 54 Injury 52%, 54
External causes of accidental injury 12%, 26 Cancer 9%, 9Auto accidents 11%, 24 Infection 6%, 6Assault 9%, 20 Cardiac arrhythmia 5%, 5

March 23, 2017 59
Next Steps• Report summarizing our findings
• Review the 2014 maternal deaths
• Early reviews of 2015 and 2016 death records