maternal health - sri lanka · maternal health 113 ninety-nine percent of ever-married women...
TRANSCRIPT

Maternal Health 111
MATERNAL HEALTH 9
The health care received by a woman during pregnancy, child birth and postpartum period decide the survival health and well-being of both the mother and the child. A well designed and implemented maternal care program facilitates the early identification and management of complications and em-
powers the women, families and communities to manage women and newborns at home. In the 2016 SLDHS, ever-married women who had given birth in the five years preceding the survey were asked many questions on antenatal care, delivery care and postnatal care.
9.1 AntenAtAl cAre
Antenatal Care aims to monitor the status of health of the mother and her baby to diagnose early any pregnancy-related problems. Regular antenatal Care throughout pregnancy contributes to positive out comes at delivery. Table 9.1 shows the percent distribution of ever-married women who had a birth in the five years preceding the survey by the source of antenatal clinic care received during pregnancy. However in the anal-ysis for ever-married women with two or more live births during the five-year period, data on antenatal care refer to the most recent birth only.
Key Findings• Antenatalcare: Ninety-nine percent of mothers received antenatal care
from a skilled provider. The median duration of pregnancy at the first ante-natal care visit is 7 weeks.
• Componentsofantenatalcare: Almost all ever-married women with a live birth during the five years before the survey received iron pills or cap-sules (98 percent) and intestinal parasite drugs (97 percent). Similarly, among those who received ANC, almost all had checked blood pressure and urine.
• Protectionagainsttetanus: Ninety-seven percent of mothers with a birth in the five years preceding the survey were protected against neonatal tetanus.
• Delivery: Nearly 100 percent (99.5%) of births were delivered in a health facility and a skilled provider assisted during the delivery.
• Postnatalcare: Ninety-nine percent of women received postnatal care for their last birth in the first two days after delivery.
• Well-WomenClinics(W-WC): Eighty percent of the ever-married women age 35-39 knew about W-WC. Fifty-six percent of them have attended a W-WC and 42 percent have had a PAP test.
• Well-WomenClinicsServices: Majority of ever married women (35-39)(84 percent) knew tests for cancers (breast & cervical )were provided at the W-WC, however 28 percent knew that family planning services offered in W-WC.

112 Demographic and Health Survey - 2016, Sri Lanka
Demography and Health Survey - 2016 113
9.1 ANTENATAL CARE
Table9.1Antenatalcare
Percent distribution of ever married women age 15-49 who had a live birth in the five years preceding the survey by antenatal care (ANC) provider during pregnancy for the most recent birth and the percentage receiving antenatal care from a skilled provider for the most recent birth, according to background characteristics, Sri Lanka 2016 Antenatal care provider
Background characteristic Obstetrici
an
Medical officer of
health (MOH)
Other doctor
Public health
midwife Other No ANC Total
Percentage
receiving antenatal care from
a skilled provider1
Number of
ever-married women
Mother'sageatbirth
<20 57.0 30.3 6.9 4.9 0.3 0.5 100.0 99.2 349 20-34 65.2 25.8 4.9 2.9 0.3 0.9 100.0 98.8 5,638 35-49 68.8 23.9 3.1 2.8 0.3 1.0 100.0 98.6 1,151
Birthorder
1 69.2 22.2 4.5 2.7 0.4 0.9 100.0 98.6 2,612 2-3 64.5 27.0 4.5 3.1 0.3 0.7 100.0 99.0 4,125 4-5 50.9 35.8 6.8 4.9 0.4 1.3 100.0 98.3 372 6+ (37.2) (35.2) (21.5) (0.3) (0.0) (5.8) (100.0) (94.2) 29
Residence
Urban 68.5 21.4 5.8 2.8 0.3 1.2 100.0 98.5 1,114 Rural 65.5 25.9 4.5 3.0 0.3 0.7 100.0 98.9 5,728 Estate 51.1 37.3 3.8 5.4 0.2 2.2 100.0 97.6 296
District
Colombo 80.8 11.6 4.8 2.2 0.0 0.6 100.0 99.4 631 Gampaha 68.1 23.8 4.5 1.6 0.2 1.8 100.0 98.0 666 Kalutara 84.0 9.8 4.5 1.1 0.0 0.6 100.0 99.4 443 Kandy 61.2 32.6 0.9 2.8 0.1 2.5 100.0 97.5 489 Matale 89.5 5.7 3.7 1.1 0.0 0.0 100.0 100.0 192 Nuwara Eliya 55.2 36.0 2.1 4.8 0.3 1.6 100.0 98.1 232 Galle 81.3 14.1 1.7 1.9 0.3 0.7 100.0 99.1 380 Matara 80.5 9.7 4.4 2.5 2.6 0.4 100.0 97.1 291 Hambantota 83.1 15.1 0.0 1.3 0.0 0.5 100.0 99.5 233 Jaffna 39.4 37.7 12.3 8.3 0.0 2.2 100.0 97.8 170 Mannar 23.6 25.9 12.2 36.9 0.0 1.4 100.0 98.6 35 Vavuniya 18.5 56.2 17.9 5.0 0.0 2.3 100.0 97.7 53 Mullaitivu 44.6 44.6 10.2 0.0 0.6 0.0 100.0 99.4 32 Kilinochchi 54.1 42.7 0.9 0.0 0.8 1.5 100.0 97.6 40 Batticaloa 44.4 44.3 6.4 4.9 0.0 0.0 100.0 100.0 217 Ampara 48.1 48.3 1.6 1.0 0.6 0.3 100.0 99.1 305 Trincomalee 20.6 35.2 33.1 9.0 0.0 2.1 100.0 97.9 168 Kurunegala 73.4 16.6 6.1 2.9 0.6 0.5 100.0 99.0 613 Puttlam 68.6 20.9 8.0 0.8 1.0 0.7 100.0 98.3 262 Anuradhapura 21.5 75.6 2.6 0.0 0.0 0.3 100.0 99.7 369 Polonnaruwa 80.7 17.5 1.1 0.6 0.0 0.0 100.0 100.0 167 Badulla 52.2 39.6 5.0 1.1 0.8 1.2 100.0 98.0 271 Moneragala 46.4 27.6 0.7 24.1 0.0 1.2 100.0 98.8 208 Ratnapura 74.7 18.5 4.4 2.0 0.3 0.0 100.0 99.7 393 Kegalle 80.0 17.7 1.7 0.6 0.0 0.0 100.0 100.0 275
Education
No education 44.9 36.2 11.9 3.3 0.0 3.7 100.0 96.3 51 Passed Grade 1-5 45.1 38.3 8.5 5.8 0.3 2.0 100.0 97.7 257 Passed Grade 6-10 61.4 27.8 5.9 3.9 0.2 0.8 100.0 98.9 3,104 Passed G.C.E.(O/L) or equivalent 61.3 30.7 4.3 2.6 0.4 0.7 100.0 98.9 1,608 Passed G.C.E.(A/L) or equivalent 75.8 18.1 2.9 2.1 0.3 0.7 100.0 99.0 1,706 Degree and above 83.7 12.9 0.8 0.5 0.7 1.3 100.0 97.9 413
Wealthquintile
Lowest 50.3 35.5 7.3 5.2 0.2 1.5 100.0 98.3 1,413 Second 59.6 30.3 5.8 3.5 0.2 0.6 100.0 99.2 1,457 Middle 66.8 25.8 3.9 2.2 0.5 0.7 100.0 98.8 1,463 Fourth 70.2 21.9 4.4 2.7 0.2 0.6 100.0 99.2 1,524 Highest 81.2 14.0 1.9 1.4 0.6 0.9 100.0 98.5 1,280
Total 65.4 25.7 4.7 3.0 0.3 0.9 100.0 98.8 7,138 Note: If more than one source of ANC was mentioned, only the provider with the highest qualifications is considered in this tabulation. Figures in parentheses are based on 25-49 unweighted cases. 1 Skilled provider includes doctor, nurse, midwife

Maternal Health 113
Ninety-nine percent of ever-married women received antenatal care from a skilled healthcare pro-vider (doctors, nurses and midwives) for their most recent birth. Only one percent of ever-married women did not receive antenatal care for a birth in the preceding five years. Of those who received antenatal care from a health provider, 65 percent received it from an obstetrician, 26 percent from a medical officer of health (MOH), 5 percent from another doctor and 3 percent from a public health midwife.
The proportion receiving antenatal care from a skilled health care provider is remarkably uniform across all background categories for mother’s age at birth, residence, district, woman’s education and house-hold wealth quintile. However, there are some differences by the provider of the ANC services across the background characteristics. In the estate sector, half of the ever-married women with a birth in the last five years received ANC (51 percent) from an obstetrician compared to 65 or more for those in the urban or rural sector. Given the high ANC coverage, the differences in access is more in terms of quality of service via the different providers described before. Access to obstetrician as the providers of ANC is much higher among older mothers, for first births, for women residing in the urban sector, women with the highest levels of ed-ucation and women belonging to the richest households. The ANC services provided by the medical officer of health (MOH) counterbalances the unequal access to obstetrician services for women with lower access to obstetrician (i.e. young mothers, second or higher birth order, estate sector, lower levels of education and within the poorest sixty percent of the households).
At the district level, significant differences are not observed in the global coverage of ANC servic-es. However, important differences can be observed at the district level on the provider of the services. For example, in the districts of Mannar and Matale the provision of ANC services is almost universal (99 and 100 percent respectively). However, in Mannar, 37 percent of these services were provided by a public health midwife (PHM) compared to only 1 percent in Matale. In Matale, on the other hand, 90 percent of the ANC services were provided by an obstetrician compared to only 24 percent in Mannar. These findings deserve a more detailed analysis to not only understand the differentials but also provide feedback to the current system of services.
9.2 timing of first visit
As complications can occur anytime during pregnancy, regular antenatal care is needed to be re-ceived from a skilled healthcare provider. Antenatal care needs to starts as soon as a pregnancy is suspected preferably before 12 weeks of pregnancy. In Sri Lanka antenatal care consists of two modalities of service delivery: Domiciliary care provided by PHM and clinic care provided by medical officers. As soon as the woman suspects a pregnancy, she needs to register with PHM and obtain pregnancy record. PHM refers them for antenatal clinic care. According to Sri Lankan antenatal care guidelines a woman with uncomplicated pregnancy, need to have at least 8 antenatal clinic visits with skilled healthcare provider and three or more home visit by PHM. A pregnant woman with complication needs more visits both clinic and domiciliary. The spacing of the visits is described in the maternal care guidelines of Sri Lanka.

114 Demographic and Health Survey - 2016, Sri Lanka
Table 9.2 presents information on antenatal care visit for the most recent birth, including the timing of the first visit, mean and median duration of pregnancy at the first visit by residential sector. Fifty-five per-cent of ever-married women with a birth during the five years preceding the survey made their first antenatal care visit, before the eighth weeks of pregnancy. Ninety-two percent of women having their first ANC visit before the 12 weeks of pregnancy as recommended.
The median duration of pregnancy at the first antenatal care visit was 7 weeks and mean duration of was 8.8 weeks. This indicates that, overall ever-married woman in Sri Lanka start antenatal care during the first trimester of their pregnancy. Estate women tend to start ANC later in pregnancy than urban and rural women where the median and mean duration of pregnancy are 8 weeks and 14.1 weeks respectively.
9.3 components of AntenAtAl cAre
Antenatal care consists of package of interventions which need to implement at various stages of the pregnancy to ensure the health and wellbeing of the mother and newborn. The package of intervention consists of screening early identification and management of diseases such as anemia, diabetes, hypertension, syphilis, HIV, monitoring of growth and well-being of the baby micronutrient supplementation and health education. To assess the ANC services they received, women in the 2016 SLDHS were asked a sereies of questions.
Table 9.3 presents information on the percentage of ever-married women who received these routine antenatal care services during the pregnancy for their most recent live birth in the five years before the survey. Nearly all ever-married women (98%) with a live birth during the five years before the survey took iron pills or capsules during pregnancy and 97 percent took intestinal parasite drugs. Three basic services provided by ANC are measuring blood pressure, testing urine sample for sugar and testing blood sample for HIV, and hemoglobin level. Data prove that all three services were provided for majority (90 percent or more). At these high levels of access and use of ANC services, it is not surprising to find only small variations by background characteristics, particularly by place of residence, level of education and wealth quintile. This is a good ex-ample of equity in the provision of ANC services across Sri Lanka.
Table9.2Timingoffirstvisit
Percent distribution of ever married women age 15-49 who had a live birth in the five years preceding the survey by the timing of the first visit, and among women with ANC, mean, and median weeks pregnant at first visit, according to residence, Sri Lanka 2016
Timing of ANC visits Urban Rural Estate Total
Number of weeks pregnant at the time of first ANC visit
No antenatal care 1.2 0.7 2.2 0.9
<8 57.8 54.9 42.1 54.98-12 33.2 37.8 39.9 37.113-16 4.0 2.9 4.1 3.117+ 2.5 2.6 5.7 2.7 Don't know/missing 1.3 1.1 6.0 1.3
Total 100.0 100.0 100.0 100.0
Number of women 1,114 5,728 296 7,138 Median weeks pregnant at first 7.0 7.0 8.0 7.0visit (for those with ANC)
Mean weeks pregnant at first 8.5 8.6 14.1 8.8visit (for those with ANC) 1,101 5,686 289 7,076 Number of women with ANC
Residence

Maternal Health 115
Demography and Health Survey - 2016 116
Table9.3Componentsofantenatalcare
Among ever-married women age 15-49 with a live birth in the five years preceding the survey, the percentage who took iron pills or capsules and drugs for intestinal parasites during the pregnancy of the most recent birth, and among women receiving antenatal care (ANC) for the most recent live birth in the five years preceding the survey, the percentage receiving specific antenatal services, according to background characteristics, Sri Lanka 2016 Among women with a live birth in the
past five years, the percentage who during the pregnancy of their last birth:
Among women who received antenatal care for their most recent live birth in the past five years, the
percentage with selected services
Background characteristic
Took iron pills or
capsules
Took intestinal parasite
drugs
Number of women with
a live birth in the past five years
Blood pressure
measured
Urine sample
taken
Blood sample
taken
Number of women with
ANC for their most
recent birth Mother'sageatbirth
<20 98.6 97.2 349 98.7 98.4 97.1 347 20-34 97.9 96.9 5,638 98.8 98.9 91.7 5,590 35-49 97.3 96.7 1,151 97.4 97.0 86.6 1,139
Birthorder 1 97.9 96.8 2,612 98.9 98.9 98.3 2,587 2-3 97.7 96.9 4,125 98.7 98.6 87.4 4,095 4-5 98.5 97.7 372 96.5 96.4 83.7 367 6+ (94.2) (94.2) 29 (87.3) (94.7) (78.0) 27
Residence Urban 98.2 95.4 1,114 98.7 98.4 91.9 1,101 Rural 97.9 97.3 5,728 98.8 98.8 91.0 5,686 Estate 95.8 95.9 296 94.0 95.6 90.3 289
District Colombo 98.9 94.0 631 98.9 98.7 93.3 627 Gampaha 96.7 95.9 666 100.0 99.9 88.3 654 Kalutara 98.8 98.1 443 98.8 99.0 90.2 440 Kandy 96.4 93.9 489 99.9 99.6 90.5 477 Matale 98.7 98.8 192 100.0 100.0 66.1 192 Nuwara Eliya 98.4 97.0 232 98.2 97.3 90.5 229 Galle 99.3 98.5 380 96.3 93.4 93.7 378 Matara 99.6 98.7 291 98.4 96.9 62.2 290 Hambantota 98.9 99.5 233 99.5 100.0 99.7 232 Jaffna 97.8 96.2 170 98.5 98.1 97.5 166 Mannar 98.6 98.0 35 100.0 100.0 100.0 35 Vavuniya 95.2 96.6 53 97.3 99.3 96.2 52 Mullaitivu 100.0 99.8 32 99.7 99.0 96.6 32 Kilinochchi 97.6 97.0 40 99.5 99.5 98.2 39 Batticaloa 100.0 98.9 217 95.3 95.2 94.1 217 Ampara 99.4 99.4 305 99.3 99.3 96.1 304 Trincomalee 96.5 97.8 168 95.0 96.2 91.2 165 Kurunegala 99.3 98.7 613 98.9 99.3 94.3 610 Puttlam 97.0 97.8 262 99.0 99.6 99.0 261 Anuradhapura 98.5 99.3 369 99.1 100.0 88.0 368 Polonnaruwa 100.0 100.0 167 97.9 98.2 92.0 167 Badulla 98.2 98.3 271 93.4 95.3 92.3 267 Moneragala 98.4 98.3 208 99.7 99.7 96.4 206 Ratnapura 100.0 99.5 393 99.4 99.8 93.5 393 Kegalle 81.6 80.9 275 99.3 100.0 98.8 275
Education No education 96.3 93.9 51 97.0 97.0 86.5 49 Passed Grade 1-5 96.4 97.4 257 95.2 96.1 89.6 252 Passed Grade 6-10 98.3 97.9 3,104 98.5 98.4 91.2 3,077 Passed G.C.E.(O/L) or equivalent 97.5 96.6 1,608 98.8 99.3 91.0 1,596 Passed G.C.E.(A/L) or equivalent 97.6 96.4 1,706 99.4 98.8 91.5 1,695 Degree and above 97.3 92.6 413 97.7 98.1 91.7 407
Wealthquintile Lowest 96.9 96.5 1,413 97.4 97.8 90.7 1,393 Second 98.0 97.4 1,457 98.8 98.7 92.9 1,449 Middle 98.2 98.0 1,463 98.8 98.4 91.3 1,452 Fourth 97.9 97.6 1,524 99.1 99.5 90.7 1,515 Highest 98.0 94.7 1,280 98.8 98.4 89.9 1,268
Total 97.8 96.9 7,138 98.6 98.6 91.1 7,076
Table 9.3 presents information on the percentage of ever-married women who received these routine antenatal care services during the pregnancy for their most recent live birth in the five years before the survey. Nearly all ever-married women (98%) with a live birth during the five years before the survey took iron pills or capsules during pregnancy and 97 percent took intestinal parasite drugs. Three basic

116 Demographic and Health Survey - 2016, Sri Lanka
9.4 tetAnus toxoid injections
Neonatal tetanus is a leading cause of death among infants in developing countries where a considerable proportion of deliveries take place at home or at locations where hygienic conditions may be poor. Tetanus toxoid (TT) vaccine is given to women during pregnancy to prevent infant deaths caused by neonatal tetanus, which can occur when sterile procedures are not followed during delivery. In Sri Lanka Tetanus Toxoid immunization for pregnant women is carried out based on the national immunization guidelines. In 2016, Sri Lanka is declared as a country which eliminated neonatal tetanus after in depth evaluation.
According to Table 9.4, Ninety-seven percent of mothers reported receiving TT injections during the pregnancy for her last live birth and that excludes mothers who have 5 or more births. The proportion of receiving TT injection is remarkably uniform across all categories for mother’s age at birth, birth order, residence, district, mother’s education and wealth quintile. The lowest percentage of protection about ninety-two percent occurs in two districts (Nuwara-Eliya and Mannar).
9.5 plAce of delivery
Skilled attendance at birth save thousands of lives and en-sure the health and wellbeing of the mother and the baby. Proper medi-cal attention and hygienic conditions during delivery can reduce the risks of complications and infections lead-ing to morbidity and mortality of ei-ther the mother or the baby.
Demography and Health Survey - 2016 118
According to Table 9.4, Ninety-seven percent of mothers reported receiving TT injections during the pregnancy for her last live birth and that excludes mothers who have 5 or more births. The proportion of receiving TT injection is remarkably uniform across all categories for mother’s age at birth, birth order, residence, district, mother’s education and wealth quintile. The lowest percentage of protection about ninety-two percent occurs in two districts (Nuwara-Eliya and Mannar).
Table9.4Tetanustoxoidinjections Among mothers age 15-49 with a live birth in the five years preceding the survey, the percentage receiving tetanus toxoid injections during the pregnancy for the last live birth, according to background characteristics, Sri Lanka 2016
Background characteristic
Percentage receiving tetanus toxoid injections during last
pregnancy 1 Number of mothers Mother'sageatbirth
<20 94.9 347 20-34 96.8 5,545 35-49 96.1 1,061
Birthorder 1 96.7 2,557 2 97.0 2,726 3 96.1 1,387 4 94.1 283
Residence Urban 94.7 1,077 Rural 97.2 5,592 Estate 92.5 284
District Colombo 93.8 618 Gampaha 96.4 647 Kalutara 95.8 436 Kandy 98.0 473 Matale 95.9 192 Nuwara Eliya 91.9 228 Galle 98.1 369 Matara 97.8 285 Hambantota 97.8 226 Jaffna 98.5 161 Mannar 92.0 33 Vavuniya 92.6 49 Mullaitivu 96.9 31 Kilinochchi 98.1 37 Batticaloa 96.0 211 Ampara 93.9 293 Trincomalee 95.3 154 Kurunegala 97.0 602 Puttalam 95.7 253 Anuradhapura 98.7 360 Polonnaruwa 96.9 167 Badulla 96.7 262 Moneragala 98.1 204 Ratnapura 98.8 388 Kegalle 99.2 274
Education No education 97.0 37 Passed Grade 1-5 96.2 230 Passed Grade 6-10 96.5 3,014 Passed G.C.E.(O/L) or equivalent 96.7 1,581 Passed G.C.E.(A/L) or equivalent 97.0 1,684 Degree and above 95.4 407
Wealthquintile Lowest 96.4 1,340 Second 96.5 1,418 Middle 97.5 1,435 Fourth 96.9 1,505 Highest 95.6 1,256
Total 96.6 6,953 1 Includes mothers who have tetanus injection during the pregnancy of her last live birth and excludes mothers who have 5 or more live births.

Maternal Health 117Demography and Health Survey - 2016 119
9.5 PLACEOFDELIVERY
Skilled attendance at birth save thousands of lives and ensure the health and wellbeing of the mother and the baby. Proper medical attention and hygienic conditions during delivery can reduce the risks of complications and infections leading to morbidity and mortality of either the mother or the baby.
Table9.5Placeofdelivery
Percent distribution of live births in the five years preceding the survey by place of delivery and percentage delivered in a health facility, according to background characteristics, Sri Lanka 2016 Health facility
Background characteristic Public sector Private sector Home Other Total
Percentage delivered in a health facility
Number of births
Mother'sageatbirth
<20 99.1 0.7 0.2 0.0 100.0 99.8 423 20-34 94.0 5.5 0.1 0.3 100.0 99.5 6,587 35-49 92.5 6.8 0.2 0.4 100.0 99.4 1,220
Birthorder 1 93.0 6.7 0.1 0.2 100.0 99.8 3,251 2-3 94.6 4.8 0.2 0.5 100.0 99.3 4,532 4-5 96.3 3.6 0.2 0.0 100.0 99.8 411 6+ (100.0) (0.0) (0.0) (0.0) (100.0) (100.0) 36
Residence Urban 84.1 14.9 0.2 0.9 100.0 99.0 1,298 Rural 95.8 3.9 0.1 0.3 100.0 99.6 6,568 Estate 98.9 0.4 0.7 0.0 100.0 99.3 363
District Colombo 78.6 20.0 0.0 1.3 100.0 98.7 721 Gampaha 86.6 11.9 0.5 1.0 100.0 98.5 769 Kalutara 88.3 11.7 0.0 0.0 100.0 100.0 520 Kandy 95.0 4.3 0.1 0.6 100.0 99.3 583 Matale 97.4 1.5 0.0 1.1 100.0 98.9 218 Nuwara Eliya 99.2 0.5 0.3 0.0 100.0 99.7 281 Galle 97.9 2.1 0.0 0.0 100.0 100.0 429 Matara 92.4 7.6 0.0 0.0 100.0 100.0 338 Hambantota 99.5 0.1 0.0 0.4 100.0 99.6 267 Jaffna 95.3 4.7 0.0 0.0 100.0 100.0 210 Mannar 99.6 0.4 0.0 0.0 100.0 100.0 42 Vavuniya 96.4 3.1 0.6 0.0 100.0 99.4 62 Mullaitivu 100.0 0.0 0.0 0.0 100.0 100.0 37 Kilinochchi 98.4 1.2 0.4 0.0 100.0 99.6 47 Batticaloa 95.9 4.1 0.0 0.0 100.0 100.0 249 Ampara 97.0 3.0 0.0 0.0 100.0 100.0 360 Trincomalee 98.3 0.8 0.4 0.5 100.0 99.1 195 Kurunegala 97.0 2.8 0.2 0.0 100.0 99.8 684 Puttlam 95.5 3.6 0.0 0.9 100.0 99.1 296 Anuradhapura 99.5 0.5 0.0 0.0 100.0 100.0 418 Polonnaruwa 99.0 1.0 0.0 0.0 100.0 100.0 188 Badulla 98.8 0.7 0.5 0.0 100.0 99.5 307 Moneragala 99.4 0.6 0.0 0.0 100.0 100.0 243 Ratnapura 98.0 1.7 0.3 0.0 100.0 99.7 452 Kegalle 98.0 1.8 0.3 0.0 100.0 99.7 315
Mother'seducation No education 97.6 0.0 2.4 0.0 100.0 97.6 55 Passed Grade 1-5 99.1 0.4 0.5 0.0 100.0 99.5 295 Passed Grade 6-10 98.7 1.0 0.1 0.2 100.0 99.7 3,558 Passed G.C.E.(O/L) or equivalent 96.3 3.3 0.1 0.4 100.0 99.5 1,838 Passed G.C.E.(A/L) or equivalent 87.8 11.7 0.1 0.5 100.0 99.4 2,003 Degree and above 74.3 24.6 0.3 0.8 100.0 98.9 481
Wealthquintile Lowest 99.3 0.3 0.4 0.1 100.0 99.5 1,653 Second 99.1 0.6 0.1 0.2 100.0 99.7 1,672 Middle 99.1 0.8 0.0 0.1 100.0 99.9 1,642 Fourth 96.0 3.5 0.1 0.4 100.0 99.6 1,771 Highest 74.8 24.0 0.1 1.1 100.0 98.8 1,491
Total 94.1 5.4 0.1 0.3 100.0 99.5 8,230 Note :Includes only the most recent birth in the five years preceding the survey Figures in parentheses are based on 25-49 unweighted cases.
Table 9.5 reveals the percent distribution of live births in the five years preceding the survey by place of delivery, according to background characteristics. Nearly hundred percent of births take place in a health facility: ninety-four percent were delivered in public-sector health facilities, five percent in private

118 Demographic and Health Survey - 2016, Sri Lanka
Table 9.5 reveals the percent distribution of live births in the five years preceding the survey by place of deliv-ery, according to background characteristics. Nearly hundred percent of births take place in a health facility: ninety-four percent were delivered in public-sector health facilities, five percent in private health facilities and only 0.5% at home or some other place. In estate sector nearly one percent (0.7 percent) of deliveries was outside the health facilities.
There is little variation in the proportion of births occurring in health facilities by background char-acteristics. However, the Colombo district shows the highest proportion of births delivered in a private health facility (20 percent), while in the Mullaitivu district, 100 percent of the babies were delivered in public health facilities. In two other districts, Gampaha and Kalutara, the percentage of births delivered at private health facilities is also substantial (12 percent in each). All three of the afore-mentioned districts belongs to the Western Province.
Background characteristics of the mothers also show considerable variations in the place of delivery. The highest percentages of births delivered in a private health facility are observed in the urban sector (15 percent), among the richest households (24 percent), and for mothers with the highest educational level (25 percent).
The delivery of births in private health facilities is higher for older mothers (7 percent vs 1 percent for younger counterparts) and those mothers of first births (7 percent vs 4 percent among those with a birth of order 4-5).
9.6 AssistAnce during delivery
Obstetric care by a trained provider during delivery is recognized as critical for the reduction of maternal and neonatal mortality. Table 9.6 shows the percentage distribution of live births in the five years before the survey by person providing assistance during birth delivery. Nearly hundred percent of births are delivered with the assistance of a trained health professional (i.e., specialist doctor, doctor, nurse, public health midwife). The majority (84 percent) of the birth deliveries were assisted by doctors (27 percent by a specialist doctor and 57 percent by another doctor), followed by a nurse (13 percent) and with a smaller percentage, by a public health midwife (only 2 percent). This composition is very much consistent with the fact that, as described before, the majority of the birth deliveries take place in health institutions. However, some differentials are observed in the person providing the services at the delivery of the birth according to place of residence and social and economic conditions of the mother.
The presence of a specialist doctor at the time of birth delivery follows a distribution similar to the one described for delivery at private health facilities. Specialist doctors assisted in greater percentages the delivery of births among older mothers, of first order births, among women with urban residence, and women in the higher wealth quintiles (see Table 9.6 below). Doctors and nurses are those more often providing the services for younger mothers, those with higher order births and the lower wealth quintiles. It is worth men-tioning that in Killinochchi and Baticaloa, one out of every four birth delivery was assisted by a nurse and in the Badulla district, 11 percent of the birth deliveries were assisted by a public health midwife.

Maternal Health 119
Demography and Health Survey - 2016 121
Table9.6Assistanceduringdelivery
Percent distribution of live births in the five years preceding the survey by person providing assistance during delivery, percentage of birth assisted by a skilled provider, according to background characteristics, Sri Lanka 2016 Person providing assistance during delivery
Background characteristic
Specialist doctor Doctor Nurse
Public health
midwife
Traditional birth
attendant Other No one Total
Percentage
delivered by a
skilled provider1
Number of births
Mother'sageatbirth
<20 20.9 59.8 15.6 3.0 0.3 0.1 0.2 100.0 99.3 422 20-34 26.7 57.2 13.3 2.3 0.1 0.1 0.3 100.0 99.5 6,557 35-49 31.0 55.7 11.9 1.0 0.0 0.3 0.1 100.0 99.6 1,212
Birthorder 1 29.3 56.3 11.9 2.1 0.1 0.0 0.3 100.0 99.6 3,243 2-3 25.8 57.9 13.5 2.2 0.1 0.2 0.2 100.0 99.4 4,501 4-5 23.7 54.5 19.3 2.3 0.0 0.3 0.0 100.0 99.7 410 6+ (17.0) (61.3) (21.7) (0.0) (0.0) (0.0) (0.0) (100.0) (100.0) 36
Placeofdelivery Health facility 27.0 57.1 13.2 2.2 0.1 0.2 0.2 100.0 99.5 8,191
Residence Urban 31.8 55.8 10.2 1.7 0.1 0.1 0.2 100.0 99.6 1,285 Rural 26.5 57.3 13.5 2.2 0.1 0.1 0.3 100.0 99.5 6,545 Estate 19.4 58.6 17.8 3.1 0.0 1.1 0.0 100.0 98.9 361
District Colombo 36.9 53.2 8.6 1.0 0.0 0.0 0.3 100.0 99.7 712 Gampaha 32.6 58.1 8.2 1.0 0.2 0.0 0.0 100.0 99.8 758 Kalutara 32.1 58.0 8.5 1.2 0.3 0.0 0.0 100.0 99.7 520 Kandy 27.6 51.2 17.5 3.4 0.0 0.0 0.3 100.0 99.7 578 Matale 28.8 54.7 15.9 0.6 0.0 0.0 0.0 100.0 100.0 216 Nuwara Eliya 21.7 59.3 16.3 1.3 0.0 1.4 0.0 100.0 98.6 280 Galle 19.3 62.6 12.9 4.1 0.5 0.3 0.3 100.0 98.9 429 Matara 33.0 59.2 7.8 0.0 0.0 0.0 0.0 100.0 100.0 338 Hambantota 23.4 63.7 9.1 3.4 0.0 0.4 0.0 100.0 99.6 266 Jaffna 40.9 42.6 10.1 0.7 0.9 0.7 4.1 100.0 94.3 210 Mannar 38.3 51.5 8.1 1.6 0.0 0.0 0.5 100.0 99.5 42 Vavuniya 17.8 63.2 15.1 2.9 0.0 0.0 1.0 100.0 99.0 62 Mullaitivu 18.5 62.2 18.2 0.0 0.0 1.1 0.0 100.0 98.9 37 Kilinochchi 41.1 31.9 25.2 1.8 0.0 0.0 0.0 100.0 100.0 47 Batticaloa 19.4 53.5 24.7 2.2 0.0 0.2 0.0 100.0 99.8 249 Ampara 36.2 46.7 16.0 1.1 0.0 0.0 0.0 100.0 100.0 360 Trincomalee 22.6 61.2 11.8 4.4 0.0 0.0 0.0 100.0 100.0 194 Kurunegala 33.5 48.0 17.8 0.8 0.0 0.0 0.0 100.0 100.0 683 Puttlam 23.2 61.1 14.7 0.6 0.0 0.0 0.4 100.0 99.6 294 Anuradhapura 12.2 66.9 16.0 5.0 0.0 0.0 0.0 100.0 100.0 418 Polonnaruwa 23.9 60.6 12.6 2.8 0.0 0.0 0.0 100.0 100.0 188 Badulla 10.7 55.7 21.0 10.8 0.4 1.3 0.0 100.0 98.2 305 Moneragala 18.6 66.3 11.2 3.9 0.0 0.0 0.0 100.0 100.0 243 Ratnapura 22.3 58.5 17.5 0.9 0.0 0.0 0.8 100.0 99.2 451 Kegalle 21.6 74.9 2.6 0.9 0.0 0.0 0.0 100.0 100.0 314
Mother'seducation No education 19.7 60.9 18.7 0.7 0.0 0.0 0.0 100.0 100.0 54 Passed Grade 1-5 19.0 59.7 18.3 2.7 0.0 0.3 0.0 100.0 99.7 293 Passed Grade 6-10 23.3 58.3 15.3 2.6 0.1 0.2 0.2 100.0 99.5 3,548 Passed G.C.E.(O/L) or equivalent 24.0 61.2 12.1 2.0 0.1 0.2 0.4 100.0 99.3 1,829 Passed G.C.E.(A/L) or equivalent 33.7 53.2 11.0 1.6 0.0 0.1 0.3 100.0 99.6 1,991 Degree and above 44.8 46.7 6.9 1.4 0.2 0.0 0.0 100.0 99.8 476
Wealthquintile Lowest 21.0 57.4 18.1 2.7 0.0 0.3 0.4 100.0 99.2 1,646 Second 22.4 60.0 14.9 2.3 0.1 0.1 0.0 100.0 99.7 1,667 Middle 24.0 60.4 12.4 2.8 0.1 0.0 0.3 100.0 99.6 1,641 Fourth 23.3 61.9 11.9 2.4 0.1 0.2 0.2 100.0 99.4 1,764 Highest 46.9 44.0 8.3 0.4 0.1 0.1 0.2 100.0 99.7 1,473
Total 27.0 57.1 13.2 2.2 0.1 0.2 0.2 100.0 99.5 8,191 Note: If the respondent mentioned more than one person attending during delivery, only the most qualified person is considered in this tabulation and Includes only the most recent birth in the five years preceding the survey Figures in parentheses are based on 25-49 unweighted cases.
1 Skilled provider includes specialist doctor, other doctor, nurse, midwife

120 Demographic and Health Survey - 2016, Sri Lanka
9.7 timing of first postnAtAl checkup for the mother
In Sri Lanka immediate and early postnatal care is provided at the hospital. The mothers need to keep at least two hours in the labour room and before handing over to the ward they need to be examined by a trained health officer (doctor, nurse or midwife). They need to keep at least 24 hours in the hospital after a normal delivery and need to monitor every 4 hourly. Before discharge from the ward they need to be exam-ined by a doctor.
After discharge from the hospital Public health midwife visit home to provide postnatal care accord-ing to the following regime.
• Within first 5 days of delivery-one visit
• 6-10 days of delivery – one visit
• 14 – 21 days of delivery – one visit
• Around 42 days one visit
• Other than that at the postnatal clinic both mother and baby examine by a doctor after one month of birth.
Postnatal care is a crucial component of safe motherhood and neonatal health. In postnatal health examinations, mothers should also receive information on how to care for herself and her child as well as counseling on nutrition, micronutrient supplementation and exclusive breastfeeding
Table 9.7 shows the timing of the first postnatal care for mothers giving birth in the two years preced-ing the survey. Ninety-nine percent of mothers received postnatal care within the crucial first two days of delivery, with 92 percent receiving assistances within the first four hours after delivery (see table 9.7 below).

Maternal Health 121Demography and Health Survey - 2016 123
Table9.7Timingoffirstpostnatalcheckupforthemother
Among women age 15-49 giving birth in the two years preceding the survey, the percent distribution of the mother's first postnatal check-up for the last live birth by time after delivery, and the percentage of women with a live birth in the two years preceding the survey who received a postnatal checkup in the first two days after giving birth, according to background characteristics, Sri Lanka 2016 Time after delivery of mother's first postnatal checkup
Background characteristic
Less than 4 hours
4-23 hours 1-2 days 3-6 days
7-41 days
Don't know/
missing
No postnatal checkup2 Total
Percentage of
women with a
postnatal checkup
in the first 2 days after
birth1 Number
of women Mother'sageatbirth
<20 87.4 6.8 5.6 0.0 0.0 0.0 0.2 100.0 99.8 152 20-34 91.5 6.2 1.7 0.0 0.1 0.0 0.5 100.0 99.4 2,433 35-49 92.6 3.9 1.5 0.1 0.0 0.5 1.4 100.0 98.0 482
Birthorder 1 91.5 6.2 2.0 0.0 0.0 0.1 0.1 100.0 99.8 1,184 2-3 91.4 5.7 1.8 0.0 0.1 0.1 1.0 100.0 98.8 1,719 4-5 92.5 5.4 1.4 0.3 0.0 0.0 0.5 100.0 99.3 153 6+ * * * * * * * * * 11
Placeofdelivery Health facility 91.8 5.9 1.9 0.0 0.1 0.1 0.3 100.0 99.6 3,056
Residence Urban 91.4 5.4 2.2 0.0 0.0 0.0 1.0 100.0 99.0 487 Rural 91.4 5.9 1.9 0.0 0.0 0.1 0.6 100.0 99.3 2,443 Estate 92.4 6.0 0.5 0.3 0.3 0.0 0.6 100.0 98.9 138
District Colombo 92.0 4.2 2.3 0.0 0.0 0.0 1.4 100.0 98.6 299 Gampaha 93.6 5.0 1.0 0.0 0.0 0.0 0.4 100.0 99.6 257 Kalutara 92.7 4.5 0.9 0.0 0.0 0.7 1.2 100.0 98.2 198 Kandy 94.9 3.0 0.7 0.0 0.0 0.5 1.1 100.0 98.5 211 Matale 68.7 23.9 5.0 0.6 0.0 0.0 1.9 100.0 97.6 69 Nuwara Eliya 93.2 5.5 1.0 0.0 0.3 0.0 0.0 100.0 99.7 107 Galle 90.9 8.3 0.7 0.0 0.0 0.0 0.0 100.0 100.0 157 Matara 91.9 5.8 1.4 0.0 0.0 0.0 0.9 100.0 99.1 129 Hambantota 74.0 8.1 16.8 0.0 1.1 0.0 0.0 100.0 98.9 105 Jaffna 97.4 1.2 1.3 0.0 0.0 0.0 0.0 100.0 100.0 73 Mannar 97.9 0.0 2.1 0.0 0.0 0.0 0.0 100.0 100.0 11 Vavuniya 96.0 4.0 0.0 0.0 0.0 0.0 0.0 100.0 100.0 20 Mullaitivu 97.6 2.4 0.0 0.0 0.0 0.0 0.0 100.0 100.0 13 Kilinochchi 85.9 13.1 1.1 0.0 0.0 0.0 0.0 100.0 100.0 15 Batticaloa 90.0 3.2 5.0 0.0 0.0 0.0 1.8 100.0 98.2 89 Ampara 93.6 5.5 0.0 0.0 0.0 0.0 0.9 100.0 99.1 125 Trincomalee 78.6 9.7 10.5 0.0 0.0 0.0 1.1 100.0 98.9 70 Kurunegala 94.7 4.8 0.0 0.0 0.0 0.0 0.5 100.0 99.5 274 Puttlam 86.8 12.4 0.0 0.0 0.0 0.0 0.8 100.0 99.2 110 Anuradhapura 97.5 2.5 0.0 0.0 0.0 0.0 0.0 100.0 100.0 153 Polonnaruwa 85.6 11.4 3.1 0.0 0.0 0.0 0.0 100.0 100.0 84 Badulla 93.3 3.0 2.7 0.0 0.0 0.0 1.0 100.0 99.0 97 Moneragala 99.1 0.9 0.0 0.0 0.0 0.0 0.0 100.0 100.0 91 Ratnapura 89.3 9.5 0.7 0.0 0.0 0.5 0.0 100.0 99.5 182 Kegalle 95.3 4.4 0.3 0.0 0.0 0.0 0.0 100.0 100.0 128
Education No education * * * * * * * * * 19 Passed Grade 1-5 89.8 1.5 6.9 0.0 0.0 0.0 1.8 100.0 98.2 86 Passed Grade 6-10 92.6 5.7 1.3 0.0 0.1 0.1 0.2 100.0 99.6 1,288 Passed G.C.E.(O/L) or equivalent 89.9 7.0 2.1 0.0 0.0 0.0 0.9 100.0 99.1 648 Passed G.C.E.(A/L) or equivalent 90.6 5.7 2.3 0.0 0.0 0.2 1.2 100.0 98.6 819 Degree and above 93.4 5.8 0.8 0.0 0.0 0.0 0.0 100.0 100.0 208 Wealth quintile Lowest 92.3 4.5 2.3 0.1 0.2 0.2 0.4 100.0 99.1 563 Second 90.2 7.3 2.1 0.0 0.1 0.1 0.2 100.0 99.6 599 Middle 92.0 5.7 1.7 0.0 0.0 0.2 0.4 100.0 99.4 641 Fourth 91.7 5.9 1.7 0.0 0.0 0.0 0.7 100.0 99.3 664 Highest 91.0 5.8 1.7 0.0 0.0 0.0 1.4 100.0 98.6 602
Total 91.5 5.9 1.9 0.0 0.1 0.1 0.6 100.0 99.2 3,068
Note : An asterisk indicated that a figure is based on fewer than 25 unweighted cases and has been suppressed 1 Includes women who received a checkup from a doctor, midwife, nurse, traditional birth attendant 2 Includes women who received a checkup after 41 days

122 Demographic and Health Survey - 2016, Sri Lanka
Figure9.1Percentdistributionbydurationofstayinthehealthfacilityforthelastlivebirth
According to figure 9.1, included 65 percent of mothers with vaginal delivery, stayed up to 2 days in the health facility for the last live birth where delivery took place, compared to 19 percent among those de-livering their birth via caesarean section. The majority of women delivering their birth via caesarean section (82 percent) stayed at the health facility for three or more days. Caesarean-section mothers typically have to stay in the health facility for at least 48 hours.
9.8 AwAreness of well-women clinic
The concept of Well-Women Clinic (W-WC) programme was introduced in 1996, as a result of the Repro-ductive Health Concept decided at the International Conference on Population Development (ICPD) held in Cairo in 1994. Sri Lanka stands as a pilot country in the whole of South Asia to successfully implement the W-WC programme at primary health care level with the aim of improving the health status of women. Family Health Bureau is the focal point at the national level in the Ministry of health for the W-WC programme. In its implementation, the Family Health Bureau works very closely with the National Cancer Control programme, Sri Lanka College of Pathologists and Sri Lanka College of Obstetricians and Gynaecologists. Over the last two decades the number of W-WCs have significantly risen to cover the whole country. W-WCs are mostly based at MOH offices and maternity hospitals. At the end of the year 2014, 873 Well-women clinics were functioning in Sri Lanka. These clinics provide services for women against common non-communicable diseases, including screening, detection and referral. The conditions screened in the W-WCs are hyperten-tion, diabetes, breast and cervical cancers, under nutrition and obesity. In addition W-WCs provide family planning services and health education. Because of the importance of these clinics, the 2016 SLDHS decid-ed to collect information on the awareness by ever-married women about the W-WCs, service availability, women’s participation and awareness and use of the PAP test which is the screening method used to identify cervical cancers.
9.8.1 knowledge of well-women clinic
In order to measure the basic knowledge of W-WC, all ever-married women were asked whether they have heard of a clinic called “Well-Women”. Seventy-one percent of them responded that they have heard of the W-WCs, and with some variation across background characteristics. In general, ever-married women from the urban and rural sectors have higher awareness about the W-WCs than those of estate sector (61 and 74 percent for urban and rural respectively, compared to only 32 percent for the estate sector).
By districts, 90 percent of the ever-married women in Moneragala have heard about W-WCs. com-pared to the lowest percentage observed in the Jaffna district (14 percent). In three additional districts (Man-nar, Mullaitivu and Kilinochchi), awareness about W-WCs is below 20 percent.
65
36
19
82
1-2 days more than 2 days0
10
20
30
40
50
60
70
80
90
Perc
enta
ge
Vaginal birth Caesarean section
Maternal Health 123
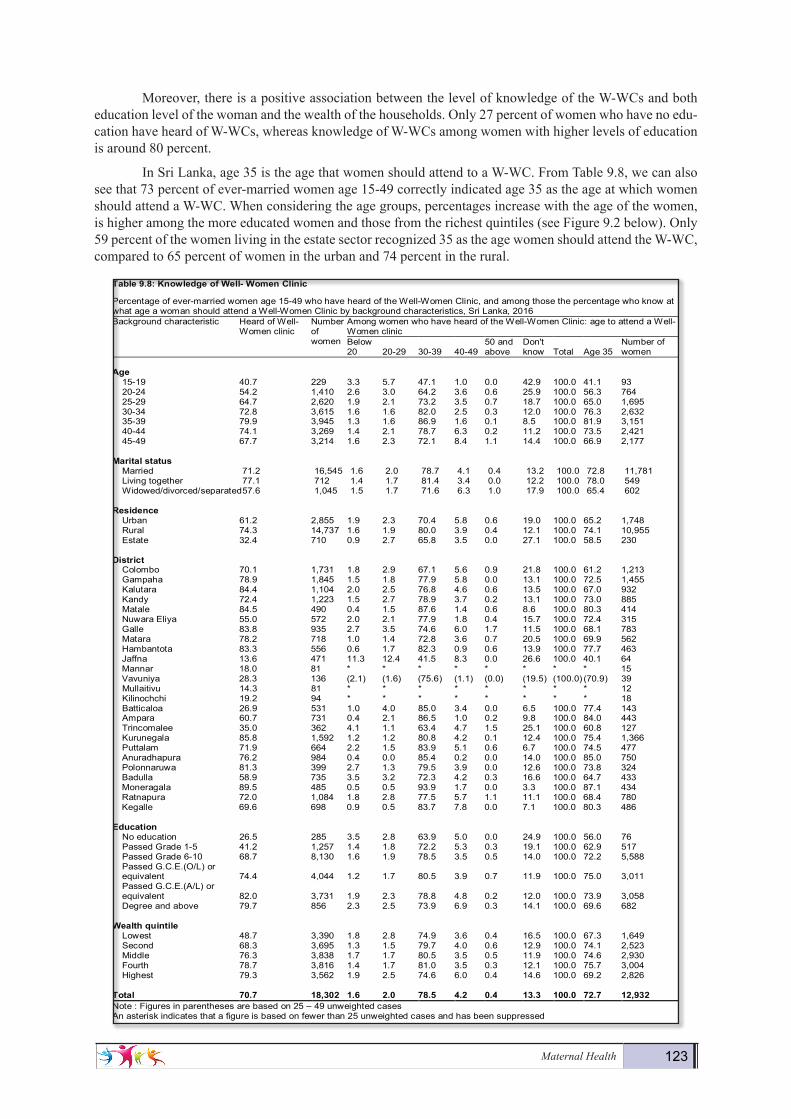
Moreover, there is a positive association between the level of knowledge of the W-WCs and both education level of the woman and the wealth of the households. Only 27 percent of women who have no edu-cation have heard of W-WCs, whereas knowledge of W-WCs among women with higher levels of education is around 80 percent.
In Sri Lanka, age 35 is the age that women should attend to a W-WC. From Table 9.8, we can also see that 73 percent of ever-married women age 15-49 correctly indicated age 35 as the age at which women should attend a W-WC. When considering the age groups, percentages increase with the age of the women, is higher among the more educated women and those from the richest quintiles (see Figure 9.2 below). Only 59 percent of the women living in the estate sector recognized 35 as the age women should attend the W-WC, compared to 65 percent of women in the urban and 74 percent in the rural.
Demography and Health Survey - 2016 126
Table9.8:KnowledgeofWell- WomenClinic
Percentage of ever-married women age 15-49 who have heard of the Well-Women Clinic, and among those the percentage who know at what age a woman should attend a Well-Women Clinic by background characteristics, Sri Lanka, 2016 Background characteristic Heard of Well-
Women clinic Number of women
Among women who have heard of the Well-Women Clinic: age to attend a Well-Women clinic Below 20 20-29 30-39 40-49
50 and above
Don't know Total Age 35
Number of women
Age
15-19 40.7 229 3.3 5.7 47.1 1.0 0.0 42.9 100.0 41.1 93 20-24 54.2 1,410 2.6 3.0 64.2 3.6 0.6 25.9 100.0 56.3 764 25-29 64.7 2,620 1.9 2.1 73.2 3.5 0.7 18.7 100.0 65.0 1,695 30-34 72.8 3,615 1.6 1.6 82.0 2.5 0.3 12.0 100.0 76.3 2,632 35-39 79.9 3,945 1.3 1.6 86.9 1.6 0.1 8.5 100.0 81.9 3,151 40-44 74.1 3,269 1.4 2.1 78.7 6.3 0.2 11.2 100.0 73.5 2,421 45-49 67.7 3,214 1.6 2.3 72.1 8.4 1.1 14.4 100.0 66.9 2,177
Maritalstatus
Married 71.2 16,545 1.6 2.0 78.7 4.1 0.4 13.2 100.0 72.8 11,781 Living together 77.1 712 1.4 1.7 81.4 3.4 0.0 12.2 100.0 78.0 549 Widowed/divorced/separated 57.6 1,045 1.5 1.7 71.6 6.3 1.0 17.9 100.0 65.4 602
Residence
Urban 61.2 2,855 1.9 2.3 70.4 5.8 0.6 19.0 100.0 65.2 1,748 Rural 74.3 14,737 1.6 1.9 80.0 3.9 0.4 12.1 100.0 74.1 10,955 Estate 32.4 710 0.9 2.7 65.8 3.5 0.0 27.1 100.0 58.5 230
District
Colombo 70.1 1,731 1.8 2.9 67.1 5.6 0.9 21.8 100.0 61.2 1,213 Gampaha 78.9 1,845 1.5 1.8 77.9 5.8 0.0 13.1 100.0 72.5 1,455 Kalutara 84.4 1,104 2.0 2.5 76.8 4.6 0.6 13.5 100.0 67.0 932 Kandy 72.4 1,223 1.5 2.7 78.9 3.7 0.2 13.1 100.0 73.0 885 Matale 84.5 490 0.4 1.5 87.6 1.4 0.6 8.6 100.0 80.3 414 Nuwara Eliya 55.0 572 2.0 2.1 77.9 1.8 0.4 15.7 100.0 72.4 315 Galle 83.8 935 2.7 3.5 74.6 6.0 1.7 11.5 100.0 68.1 783 Matara 78.2 718 1.0 1.4 72.8 3.6 0.7 20.5 100.0 69.9 562 Hambantota 83.3 556 0.6 1.7 82.3 0.9 0.6 13.9 100.0 77.7 463 Jaffna 13.6 471 11.3 12.4 41.5 8.3 0.0 26.6 100.0 40.1 64 Mannar 18.0 81 * * * * * * * * 15 Vavuniya 28.3 136 (2.1) (1.6) (75.6) (1.1) (0.0) (19.5) (100.0) (70.9) 39 Mullaitivu 14.3 81 * * * * * * * * 12 Kilinochchi 19.2 94 * * * * * * * * 18 Batticaloa 26.9 531 1.0 4.0 85.0 3.4 0.0 6.5 100.0 77.4 143 Ampara 60.7 731 0.4 2.1 86.5 1.0 0.2 9.8 100.0 84.0 443 Trincomalee 35.0 362 4.1 1.1 63.4 4.7 1.5 25.1 100.0 60.8 127 Kurunegala 85.8 1,592 1.2 1.2 80.8 4.2 0.1 12.4 100.0 75.4 1,366 Puttalam 71.9 664 2.2 1.5 83.9 5.1 0.6 6.7 100.0 74.5 477 Anuradhapura 76.2 984 0.4 0.0 85.4 0.2 0.0 14.0 100.0 85.0 750 Polonnaruwa 81.3 399 2.7 1.3 79.5 3.9 0.0 12.6 100.0 73.8 324 Badulla 58.9 735 3.5 3.2 72.3 4.2 0.3 16.6 100.0 64.7 433 Moneragala 89.5 485 0.5 0.5 93.9 1.7 0.0 3.3 100.0 87.1 434 Ratnapura 72.0 1,084 1.8 2.8 77.5 5.7 1.1 11.1 100.0 68.4 780 Kegalle 69.6 698 0.9 0.5 83.7 7.8 0.0 7.1 100.0 80.3 486
Education
No education 26.5 285 3.5 2.8 63.9 5.0 0.0 24.9 100.0 56.0 76 Passed Grade 1-5 41.2 1,257 1.4 1.8 72.2 5.3 0.3 19.1 100.0 62.9 517 Passed Grade 6-10 68.7 8,130 1.6 1.9 78.5 3.5 0.5 14.0 100.0 72.2 5,588 Passed G.C.E.(O/L) or equivalent 74.4 4,044 1.2 1.7 80.5 3.9 0.7 11.9 100.0 75.0 3,011 Passed G.C.E.(A/L) or equivalent 82.0 3,731 1.9 2.3 78.8 4.8 0.2 12.0 100.0 73.9 3,058 Degree and above 79.7 856 2.3 2.5 73.9 6.9 0.3 14.1 100.0 69.6 682
Wealth quintile
Lowest 48.7 3,390 1.8 2.8 74.9 3.6 0.4 16.5 100.0 67.3 1,649 Second 68.3 3,695 1.3 1.5 79.7 4.0 0.6 12.9 100.0 74.1 2,523 Middle 76.3 3,838 1.7 1.7 80.5 3.5 0.5 11.9 100.0 74.6 2,930 Fourth 78.7 3,816 1.4 1.7 81.0 3.5 0.3 12.1 100.0 75.7 3,004 Highest 79.3 3,562 1.9 2.5 74.6 6.0 0.4 14.6 100.0 69.2 2,826
Total 70.7 18,302 1.6 2.0 78.5 4.2 0.4 13.3 100.0 72.7 12,932 Note : Figures in parentheses are based on 25 – 49 unweighted cases An asterisk indicates that a figure is based on fewer than 25 unweighted cases and has been suppressed
9.8.2 KNOWLEDGEOFWELL-WOMENCLINICSSERVICES
In order to assess the respondents' knowledge about the standard services provided by the W-WCs, all ever-married women interviewed in 2016 SLDHS were asked about specific services. Almost eight out of ten ever-married women in Sri Lanka (77 percent) know about the test for cervical cancer and the test for breast cancer services provided by the W-WCs. However, from Table 9.9 we can see that only a

124 Demographic and Health Survey - 2016, Sri Lanka
9.8.2 knowledge of well-women clinics services
In order to assess the respondents’ knowledge about the standard services provided by the W-WCs, all ever-married women interviewed in 2016 SLDHS were asked about specific services. Almost eight out of ten ever-married women in Sri Lanka (77 percent) know about the test for cervical cancer and the test for breast cancer services provided by the W-WCs. However, from Table 9.9 we can see that only a relatively small percentage of ever married women in Sri Lanka knew about the W-WC services for high blood pres-sure (33 percent), the test for diabetes (34 percent), family planning (24 percent) and health education (15 percent).
Knowledge for the two tests for cancers (breast and cervical) increases with the age of the woman to a maximum of around 80 percent among women age 40-49. It shows similar increases by level of education and wealth quintile (see Table 9.9 below). The data provides enough evidence to develop interventions that increase the knowledge of family planning services offered by the W-WC, targeting in particular those geo-graphic areas in which knowledge is the lowest (i.e. districts of Matale and Polonnaruwa with only, 8 and 11 percent of women who know that the W-WCs provide family planning services.)

Maternal Health 125
Demography and Health Survey - 2016 128
Table9.9:KnowledgeofServices
Percentage of ever-married women age 15-49 among ever heard of well women clinic; who know about the services provided by the Well-Women clinic, by background characteristics, Sri Lanka, 2016 Background characteristic Percentage who know of specific services
The test for high
blood pressure
The test for
diabetes
The test for breast
cancer
The test for
cervical cancer
Family planning services
Health education Other
Don't know
Number of women
Age
15-19 15.1 19.1 40.7 38.1 10.6 8.3 1.5 50.6 93 20-24 21.0 21.9 59.7 56.4 16.2 10.0 0.2 33.5 764 25-29 23.7 25.4 68.3 67.9 17.9 11.6 0.4 23.2 1,695 30-34 29.8 30.6 76.0 76.5 23.1 13.8 0.3 16.0 2,632 35-39 39.6 41.4 83.9 84.9 28.2 17.1 0.3 9.4 3,151 40-44 35.9 38.1 81.3 83.2 25.7 16.4 0.4 11.6 2,421 45-49 34.4 35.6 77.5 78.9 23.9 15.5 0.4 14.7 2,177
Maritalstatus
Married 32.6 34.0 76.9 77.6 24.3 15.4 0.4 15.6 11,781 Living together 39.3 42.1 84.5 86.0 16.4 5.0 0.0 10.2 549 Widowed/divorced/separated 28.9 31.3 71.7 71.8 21.0 12.2 0.8 20.6 602
Residence
Urban 27.0 29.5 72.0 73.6 23.9 15.7 0.5 18.6 1,748 Rural 33.6 34.9 78.0 78.5 23.9 14.7 0.3 14.9 10,955 Estate 33.8 34.0 64.7 65.7 19.1 11.8 0.3 22.9 230
District
Colombo 20.9 25.2 67.8 73.5 21.4 12.5 0.6 19.8 1,213 Gampaha 37.3 40.6 83.1 83.7 22.3 10.7 0.0 12.8 1,455 Kalutara 37.5 39.2 78.6 79.1 25.2 18.5 0.1 17.8 932 Kandy 36.1 35.7 77.8 80.5 25.6 19.7 0.3 13.5 885 Matale 20.8 19.8 58.5 68.3 7.8 16.7 3.0 19.6 414 Nuwara Eliya 40.5 38.4 72.0 74.7 30.4 26.2 0.2 16.1 315 Galle 39.3 39.1 74.5 80.6 42.1 30.2 0.8 13.5 783 Matara 29.3 27.9 78.6 77.8 12.6 7.7 0.0 14.3 562 Hambantota 46.9 46.2 82.3 79.7 28.2 16.0 0.2 14.7 463 Jaffna 37.3 35.6 29.2 22.4 12.2 10.5 0.0 35.5 64 Mannar * * * * * * * * 15 Vavuniya (20.0) (33.0) (65.6) (62.7) (21.6) (9.7) (0.0) (25.8) 39 Mullaitivu * * * * * * * * 12 Kilinochchi * * * * * * * * 18 Batticaloa 17.9 14.7 65.8 59.9 16.7 3.3 0.0 17.1 143 Ampara 47.7 52.4 82.0 76.9 35.0 32.1 0.0 10.9 443 Trincomalee 17.7 15.9 66.3 57.4 19.4 6.1 0.0 24.4 127 Kurunegala 41.9 45.0 78.8 78.4 23.2 11.7 0.7 14.0 1,366 Puttalam 12.2 13.4 77.9 75.6 17.5 8.7 0.0 15.2 477 Anuradhapura 22.4 22.3 77.9 77.9 16.5 13.9 0.0 21.2 750 Polonnaruwa 19.8 22.7 72.7 72.0 11.0 12.7 0.0 19.5 324 Badulla 30.3 30.0 66.8 66.2 18.7 16.6 1.0 26.8 433 Moneragala 34.6 36.3 92.7 87.7 40.3 11.8 0.0 5.8 434 Ratnapura 41.1 41.7 78.6 78.6 17.7 7.4 0.0 15.4 780 Kegalle 19.0 23.0 91.2 89.4 39.1 13.1 0.0 5.5 486
Education
No education 29.0 29.4 63.3 62.6 22.9 17.4 1.0 29.4 76 Passed Grade 1-5 28.4 27.7 68.1 68.6 22.5 12.7 0.4 21.3 517 Passed Grade 6-10 30.8 32.5 74.0 74.2 20.6 12.4 0.4 18.4 5,588 Passed G.C.E.(O/L) or equivalent 32.7 34.6 77.9 79.5 24.2 15.5 0.3 14.6 3,011 Passed G.C.E.(A/L) or equivalent 36.4 37.0 82.0 82.4 28.2 18.3 0.4 11.1 3,058 Degree and above 35.5 38.7 82.7 84.9 29.0 16.9 0.2 10.9 682
Wealthquintile
Lowest 27.6 29.3 66.3 65.8 20.1 13.1 0.5 23.9 1,649 Second 31.7 32.5 75.0 74.8 22.1 12.9 0.3 16.7 2,523 Middle 32.8 33.8 77.5 79.2 22.5 14.0 0.4 14.9 2,930 Fourth 33.2 35.0 80.1 81.1 24.2 14.7 0.5 13.3 3,004 Highest 36.0 38.1 80.9 81.8 28.3 18.5 0.2 12.8 2,826
Total 32.7 34.2 77.0 77.6 23.8 14.8 0.4 15.6 12,932 Note : Figures in parentheses are based on 25 – 49 unweighted cases An asterisk indicates that a figure is based on fewer than 25 unweighted cases and has been suppressed

126 Demographic and Health Survey - 2016, Sri Lanka
9.8.3 pArticipAtion in well-women clinics
W-WCs normally provide their services to women who are 35 years of age and older. Table 9.10 shows that only 33 per-cent of ever-married women age 15-49 have ever attended to a W-WC. Howev-er, as expected, this percentage is consid-erable higher among women 35 and old-er (56 percent among 35-39) than among younger ones (less than 10 percent for ever-married age 15-34). By district, the participation in W-WCs is highest in the Kalutara district (39 percent) and the lowest in Jaffna district with only 16 percent.
9.8.4 use of pAp test
A revised Guideline for Cervi-cal cytology Screening and Reporting in Sri lanka was formulated in 2010 by a committee comprising of representa-tives from the College of Pathologists of Sri Lanka, College of Obstetricians and Gynaencologists of Sri Lanka and Fam-ily Health Bureau. The guideline recom-mends once in a life time screening using conventional Pap smear cytology for the women of 35 years of age. The single age cohort was selected considering the logistic convenience of identifying the eligible women of one particular age and feasibility of achieving a high coverage of the limited target population. Howev-er, the guideline also permits any wom-an (specially over 35 years) seeking the screening services voluntarily to have Pap smear through the same programme.
The Public Health Midwives (PHM) identify the women aged 35 years from the registers maintained at the of-fice of the PHM and invite them during the home visits to attend the W-WCs for cervical cancer screening. A letter of in-vitation from the MOH is also sent to each woman as she attains the age of 35 years, reminding her to undergo screen-ing.
In the 2016 SLDHS, all ev-er-married women age 15-49 were asked if they have ever had a PAP test. Twen-ty-one percent of them indicated that they
Demography and Health Survey - 2016 129
9.8.3 PARTICIPATION INWELL-WOMENCLINICS
W-WCs normally provide their services to women who are 35 years of age and older. Table 9.10 shows that only 33 percent of ever-married women age 15-49 have ever attended to a W-WC. However, as expected, this percentage is considerable higher among women 35 and older (56 percent among 35-39) than among younger ones (less than 10 percent for ever-married age 15-34). By district, the participation in W-WCs is highest in the Kalutara district (39 percent) and the lowest in Jaffna district with only 16 percent.
Table9.10:ParticipationofWell- WomenClinic
Percentage of ever-married women age 15-49 among ever heard of well women clinic; who have attended a Well-Women Clinic by background characteristics, Sri Lanka, 2016
Background characteristic Ever attended a
Well-Women ClinicNumber of
women Age
15-19 3.2 9320-24 2.6 76425-29 3.7 1,69530-34 9.5 2,63235-39 56.0 3,15140-44 47.9 2,42145-49 46.5 2,177
Maritalstatus Married 33.0 11,781Living together 35.1 549Widowed/divorced/separated 31.7 602
Residence Urban 29.1 1,748Rural 33.8 10,955Estate 28.5 230
District Colombo 30.0 1,213Gampaha 37.1 1,455Kalutara 38.6 932Kandy 32.1 885Matale 34.9 414Nuwara Eliya 38.2 315Galle 29.5 783Matara 34.8 562Hambantota 31.3 463Jaffna 15.8 64Mannar * 15Vavuniya (15.4) 39Mullaitivu * 12Kilinochchi * 18Batticaloa 21.5 143Ampara 38.2 443Trincomalee 18.3 127Kurunegala 32.6 1,366Puttalam 34.7 477Anuradhapura 31.9 750Polonnaruwa 31.6 324Badulla 33.0 433Moneragala 31.5 434Ratnapura 33.2 780Kegalle 30.0 486
Education No education 42.6 76Passed Grade 1-5 43.9 517Passed Grade 6-10 34.6 5,588Passed G.C.E.(O/L) or equivalent 33.6 3,011Passed G.C.E.(A/L) or equivalent 29.2 3,058Degree and above 25.7 682
Wealthquintile Lowest 30.3 1,649Second 33.4 2,523Middle 33.7 2,930Fourth 33.8 3,004Highest 32.7 2,826
Total 33.0 12,932Note : Figures in parentheses are based on 25 – 49 unweighted cases An asterisk indicates that a figure is based on fewer than 25 unweighted cases and has been suppressed

Maternal Health 127
have had the test in the past. This per-centage is substantially higher among older ever-married women (42 percent among women age 35-39), which indi-cates the national concentration on the women at age 35 since 2010 for the cer-vical cancer screening. The prevalence of the use of PAP tests increases with the level of education of the woman and by the wealth quintile of the household in which the woman resides (see Figure 9.2). By place of residence, the preva-lence of the use of the PAP test is higher in the rural areas (22 percent) than in the urban areas (18 percent) and in the estate sector (9 percent). Ever use of the PAP test presents a wide range varia-tion by district of residence, from just 2 percent in the Mullaitivu district to 32 percent in Kalutara.
Demography and Health Survey - 2016 131
Table9.11:EverhadPAPTest
Percentage of ever-married women age 15-49 who ever had a PAP test, by background characteristics, Sri Lanka, 2016
Background characteristic Ever had a PAP
testNumber of
women Age
15-19 0.0 22920-24 0.5 1,41025-29 1.6 2,62030-34 5.8 3,61535-39 41.7 3,94540-44 32.1 3,26945-49 29.3 3,214
Maritalstatus
Married 21.4 16,545Living together 26.9 712Widowed/divorced/separated 16.4 1,045
Residence
Urban 18.3 2,855Rural 22.4 14,737Estate 9.2 710
District
Colombo 24.6 1,731Gampaha 28.1 1,845Kalutara 31.5 1,104Kandy 21.3 1,223Matale 27.2 490Nuwara Eliya 14.9 572Galle 21.0 935Matara 24.6 718Hambantota 18.8 556Jaffna 2.8 471Mannar 3.4 81Vavuniya 3.0 136Mullaitivu 2.4 81Kilinochchi 5.2 94Batticaloa 4.3 531Ampara 14.7 731Trincomalee 7.4 362Kurunegala 25.8 1,592Puttalam 22.9 664Anuradhapura 17.8 984Polonnaruwa 23.4 399Badulla 16.5 735Moneragala 26.2 485Ratnapura 23.3 1,084Kegalle 19.0 698
Education
No education 9.0 285Passed Grade 1-5 15.4 1,257Passed Grade 6-10 21.1 8,130Passed G.C.E.(O/L) or equivalent 22.3 4,044Passed G.C.E.(A/L) or equivalent 23.3 3,731Degree and above 21.6 856
Wealthquintile
Lowest 12.1 3,390Second 20.0 3,695Middle 22.3 3,838Fourth 23.8 3,816Highest 27.6 3,562
Total 21.3 18,302

128 Demographic and Health Survey - 2016, Sri Lanka
Figure9.2KnowledgeofW-WCandPAPtestbyWealthQuintile
49
12
68
20
76
22
79
24
79
28
Heard of Well-Women Clinic Ever Had a PAP test0
10
20
30
40
50
60
70
80
90Pe
rcen
t
Lowest Second Middle Fourth Highest