materials science & engineering a · and the effect of biaxial tensile stress state on the...
TRANSCRIPT

Materials Science & Engineering A 674 (2016) 540–551
Contents lists available at ScienceDirect
Materials Science & Engineering A
http://d0921-50
n CorrE-m
journal homepage: www.elsevier.com/locate/msea
Deformation behavior of commercially pure (CP) titaniumunder equi-biaxial tension
Nedunchezhian Srinivasan a, R. Velmurugan b,n, Ravi Kumar a, Satish Kumar Singh c,Bhanu Pant c
a Department of Metallurgical and Materials Engineering, Indian Institute of Technology Madras, Chennai 600036, Indiab Department of Aerospace Engineering, Indian Institute of Technology Madras, Chennai 600036, Indiac Materials Processing Research Group, Vikram Sarabhai Space Centre, Trivandrum 695022, India
a r t i c l e i n f o
Article history:Received 17 May 2016Received in revised form3 August 2016Accepted 5 August 2016Available online 6 August 2016
Keywords:Biaxial tensile testingCruciform specimenStrain measurementTitaniumPlasticity
x.doi.org/10.1016/j.msea.2016.08.01893/& 2016 Elsevier B.V. All rights reserved.
esponding author.ail address: [email protected] (R. Velmuruga
a b s t r a c t
Biaxial tensile tests on commercially pure titanium were carried out using cruciform specimen geometryand the effect of biaxial tensile stress state on the mechanical properties was discussed. An optimumcruciform specimen geometry obtained using a commercial FE code was subjected to equi-biaxial tensileloading and the load-strain response was captured using data acquisition system. In addition, non-contact digital image correlation technique was employed for the measurement of failure strain. It isobserved that the ultimate tensile strength approximately doubled and the failure strain decreased incontrast to uniaxial mechanical properties of commercially pure titanium. Increased effective modulusunder biaxial condition is justified based on the generalized Hooke’s relation. Strong basal and split-basaltexture components of as-received sample resulted in biaxial strengthening effect. Significant texturalevolution observed upon biaxial deformation can be attributed to constrained deformation under suchstress state.
& 2016 Elsevier B.V. All rights reserved.
1. Introduction
Titanium and its alloys are extensively used in aerospace in-dustries because of their high strength to weight ratio and ex-cellent corrosion resistant properties [1]. More often, such struc-tural components (pressure vessels and propellant tanks) are de-signed based on their uniaxial properties, although they experi-ence biaxial loading condition during its service. In addition, metalforming operations such as deep drawing also involves complexbiaxial state of stress, and hence finite element (FE) simulationsof such operations demand experimental data under biaxialstress state to predict accurate failure strain during forming op-erations. Hence, biaxial tensile testing of materials seems moreappropriate for understanding the material response under suchstress state.
Several experimental methods offer the possibilities of testingmaterials under biaxial loading configuration such as hydraulicbulge test [2,3], Marciniak punch test [4], thin walled tubes sub-jected to combined axial loading and internal pressure [5], andcruciform (cross-shaped) specimen under biaxial loading [6–8].However, cruciform technique attracts interest because of its
n).
ability to test under in-plane configuration and also offers thepossibility for studying elastoplastic deformation behavior underany arbitrary chosen stress ratios [9,10]. Deng et al., [11] proposedcruciform geometry for testing of sheet metals under biaxial ten-sion, however, their geometry was primarily meant for yield lociconstruction but not designed for probing fracture and failure. Inaddition, strain experienced by the gage section of the cruciformspecimen was too low for characterizing the formability behaviorof sheet metals under biaxial stress state [12]. Hence, a cruciformspecimen was designed based on the following considerations:(1) homogenous strain distribution in the gage section (2) mini-mization of shear strain in gage section (3) specimen failure in thebiaxially loaded zone and (4) minimization of strain concentrationoutside the gage section [13,14]. Due to the complicated design ofcruciform specimen, load bearing area under biaxial stress state isnot properly defined [14] in contrast to uniaxial tensile testing.Each loading arm in cruciform specimen is common to two prin-cipal loading directions, hence, by-pass correction factor (BCF)proposed by Welsh et al., [15] is used for the estimation of effec-tive cross-sectional area.
As a direct implication of indirect estimation of load bearingarea, the need for the accurate estimation of strain increases [16].Hence, a non-contact digital image correlation technique (DIC) [17]is essential for strain mapping of the entire gage section. The non-contact method also offers the possibility to capture the entire

Table 1Chemical composition of as-received CP titanium (Grade 2).
Element Nitrogen Carbon Hydrogen Iron Oxygen Titanium
wt% 0.03 0.08 0.015 0.30 0.25 Bal.
N. Srinivasan et al. / Materials Science & Engineering A 674 (2016) 540–551 541
strain response till failure, since it is difficult to measure strainusing foil gages beyond yielding.
Though yielding and deformation behavior of aluminum alloys[18,19] and magnesium [20,21] under biaxial tensile stress arestudied extensively, biaxial tensile properties of titanium and ti-tanium alloys are relatively unexplored with very limited litera-ture available. Ishiki et al., [22] reported the work hardening be-havior of pure titanium under biaxial tension to a maximumplastic strain of 0.002 using cruciform geometry. In addition, thework hardening behavior of pure titanium was measured usingtubular specimens for various linear stress/strain paths, but theirstudy was limited to a maximum plastic strain of 0.085. This is dueto detachment of strain gages during testing, hence, biaxial stress-strain curves up to failure were not reported [23].
Here, we report equi-biaxial tensile testing of commerciallypure (CP) titanium using an optimized cruciform specimen, pri-marily designed to facilitate large deformation in the gage sectionof cruciform specimen. Non-contact strain measurement techni-que was employed to obtain biaxial stress-strain curves up tofailure. Also, the effect of biaxial stress state on mechanicalproperties of CP titanium such as ductility, strength, effectivemodulus and strain hardening exponent was discussed in relationto its uniaxial properties. Fractographic features, X-ray diffracto-grams of deformed samples under uniaxial and biaxial stress statewas compared and discussed. Texture evolution upon biaxial de-formation of CP titanium was correlated with its mechanicalproperties and such a study has not been reported earlier to thebest of our knowledge.
2. Material and methods
2.1. Material
Commercially pure (CP) titanium Grade 2 (annealed) waschosen for this study with the following chemical composition asper the supplier is shown in Table 1. The thickness of the as-re-ceived plate is around 12 mm.
2.2. Uniaxial tensile testing
Uniaxial tensile specimens along the rolling direction (RD),transverse direction (TD) and 45° degree to the rolling direction(DD) were fabricated using wire-cut electrical discharge machin-ing (EDM) as per ASTM E8M standard (sub-sized coupons). Thethickness of each specimen is around 2.5 mm and key dimensionsof the specimen are shown in the Fig. 1. Quasi-static uniaxial
Fig. 1. Uniaxial specimen as per ASTM E8M
testing was carried out at room temperature until failure, at across-head speed of 0.5 mm/min (nominal strain rate of2.6�10�4 s�1) using Instron 25 kN test frame. Non-contact DICtechnique was employed to measure strain in addition to in-builtdisplacement sensor readings. Also, strain gages were pasted alongthe loading direction for the accurate measurement of elasticstrain.
2.3. Biaxial tensile testing
An in-plane biaxial test rig of 250 kN capacity was customdesigned in-house to carry out equi-biaxial tensile testing of me-tallic specimens till failure. The test rig consists of hydraulic powerpack, loading frames, specimen holding fixtures and four double-acting hydraulic actuators for applying any desired tensile forcealong each direction. Load cells of 220 kN capacity (HBM-RTN)were used to measure the applied load along each direction. Allthe load cells were calibrated against the standard load cell priorto its installation into the test machine. Cruciform specimens ofoptimized geometry (Fig. 2) obtained with the help of FEM ana-lysis [24] were machined using Computer Numeric Controlled(CNC) machine.
The overall dimension of the sample is 250�250�8 mm withtwo step thickness transition from a gripping area thickness of8 mm to gage area thickness of 1 mm with 3 mm intermediatethickness. These dimensional modifications were carried out toensure homogenous strain distribution in the gage section and alsoto facilitate failure in the gage section. All machined samples weredimensionally inspected using Coordinate Measuring Machine(CMM) before being subjected to testing. Foil type strain gages werepasted over the mid-portion of cruciform specimen gage section,both in X and Y directions (each loading direction) to capture strainresponse. The strain gage readings, as well as load cell readings,were recorded at a scan rate of 5 data points per second usingstrain-smart system 5000 Data Acquisition System (DAQ). Fourcruciform specimens were tested till failure and representativestrain contour plots and stress-strain relations are reported.
2.4. Non-contact strain measurement technique
Prior to testing, uniaxial and biaxial test specimens weresprayed using white and black acrylic aerosol paints to createrandom, isotropic speckle pattern on the surface for the non-contact strain measurements. Specimen surface with specklepattern was captured using a CCD camera under zero load con-figuration (reference image). Subsequently, images of deformedspecimen were captured continuously till the specimen fails. CCDcamera (2/3″ Sony ICX625 sensor, PGR solutions) with 5-megapixelresolution (2448�2048) corresponding to pixel size of 3.45 mm2
and 15 frames per second (fps) capability along with high-re-solution mega-pixel lens (Edmund Optics) was employed to cap-ture images at every 100 ms interval until failure.
VIC-2D correlation software (Correlated Solutions, Inc., USA) wasused to obtain displacement as well as strain contour by correlating
standard (all dimensions are in mm).

Fig. 2. Biaxial cruciform specimen (top view and front view).
Fig. 3. Optical micrograph of as-received CP titanium.
Fig. 4. Uniaxial stress-strain responses of CP titanium at various orientations torolling direction (RD).
N. Srinivasan et al. / Materials Science & Engineering A 674 (2016) 540–551542
reference image (undeformed) under zero load configuration withimages of deformed specimen. Subset size and step size used for theanalysis was 25�25 pixels and 4 pixels respectively. The afore-mentioned post-processing parameters were chosen based on thegenerated speckle pattern. The entire gage area was chosen for thecorrelation analysis to obtain principal strain contour plots as wellas strain contours in X and Y directions respectively.
2.5. Characterization of as-received and deformed samples
Standard metallographic polishing techniques were carried outfor probing the microstructure of the samples. Prior to microscopic
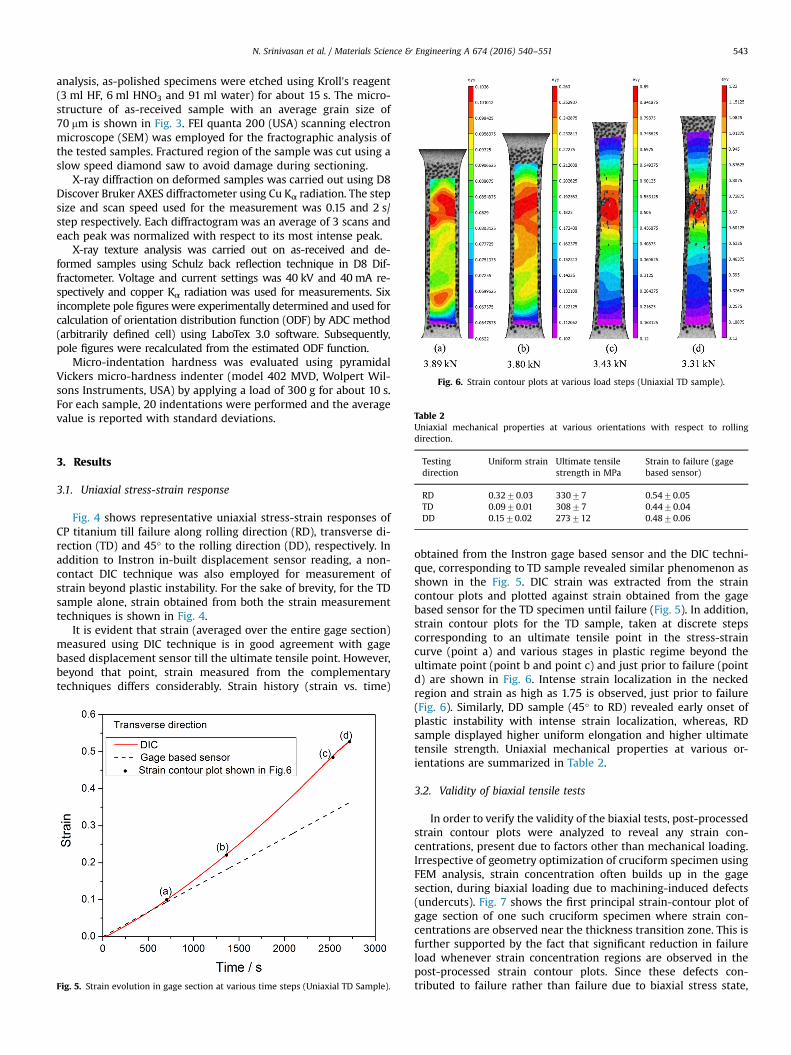
Fig. 6. Strain contour plots at various load steps (Uniaxial TD sample).
Table 2
N. Srinivasan et al. / Materials Science & Engineering A 674 (2016) 540–551 543
analysis, as-polished specimens were etched using Kroll’s reagent(3 ml HF, 6 ml HNO3 and 91 ml water) for about 15 s. The micro-structure of as-received sample with an average grain size of70 mm is shown in Fig. 3. FEI quanta 200 (USA) scanning electronmicroscope (SEM) was employed for the fractographic analysis ofthe tested samples. Fractured region of the sample was cut using aslow speed diamond saw to avoid damage during sectioning.
X-ray diffraction on deformed samples was carried out using D8Discover Bruker AXES diffractometer using Cu Kα radiation. The stepsize and scan speed used for the measurement was 0.15 and 2 s/step respectively. Each diffractogram was an average of 3 scans andeach peak was normalized with respect to its most intense peak.
X-ray texture analysis was carried out on as-received and de-formed samples using Schulz back reflection technique in D8 Dif-fractometer. Voltage and current settings was 40 kV and 40 mA re-spectively and copper Kα radiation was used for measurements. Sixincomplete pole figures were experimentally determined and used forcalculation of orientation distribution function (ODF) by ADC method(arbitrarily defined cell) using LaboTex 3.0 software. Subsequently,pole figures were recalculated from the estimated ODF function.
Micro-indentation hardness was evaluated using pyramidalVickers micro-hardness indenter (model 402 MVD, Wolpert Wil-sons Instruments, USA) by applying a load of 300 g for about 10 s.For each sample, 20 indentations were performed and the averagevalue is reported with standard deviations.
Uniaxial mechanical properties at various orientations with respect to rollingdirection.
Testingdirection
Uniform strain Ultimate tensilestrength in MPa
Strain to failure (gagebased sensor)
RD 0.3270.03 33077 0.5470.05TD 0.0970.01 30877 0.4470.04DD 0.1570.02 273712 0.4870.06
3. Results
3.1. Uniaxial stress-strain response
Fig. 4 shows representative uniaxial stress-strain responses ofCP titanium till failure along rolling direction (RD), transverse di-rection (TD) and 45° to the rolling direction (DD), respectively. Inaddition to Instron in-built displacement sensor reading, a non-contact DIC technique was also employed for measurement ofstrain beyond plastic instability. For the sake of brevity, for the TDsample alone, strain obtained from both the strain measurementtechniques is shown in Fig. 4.
It is evident that strain (averaged over the entire gage section)measured using DIC technique is in good agreement with gagebased displacement sensor till the ultimate tensile point. However,beyond that point, strain measured from the complementarytechniques differs considerably. Strain history (strain vs. time)
Fig. 5. Strain evolution in gage section at various time steps (Uniaxial TD Sample).
obtained from the Instron gage based sensor and the DIC techni-que, corresponding to TD sample revealed similar phenomenon asshown in the Fig. 5. DIC strain was extracted from the straincontour plots and plotted against strain obtained from the gagebased sensor for the TD specimen until failure (Fig. 5). In addition,strain contour plots for the TD sample, taken at discrete stepscorresponding to an ultimate tensile point in the stress-straincurve (point a) and various stages in plastic regime beyond theultimate point (point b and point c) and just prior to failure (pointd) are shown in Fig. 6. Intense strain localization in the neckedregion and strain as high as 1.75 is observed, just prior to failure(Fig. 6). Similarly, DD sample (45° to RD) revealed early onset ofplastic instability with intense strain localization, whereas, RDsample displayed higher uniform elongation and higher ultimatetensile strength. Uniaxial mechanical properties at various or-ientations are summarized in Table 2.
3.2. Validity of biaxial tensile tests
In order to verify the validity of the biaxial tests, post-processedstrain contour plots were analyzed to reveal any strain con-centrations, present due to factors other than mechanical loading.Irrespective of geometry optimization of cruciform specimen usingFEM analysis, strain concentration often builds up in the gagesection, during biaxial loading due to machining-induced defects(undercuts). Fig. 7 shows the first principal strain-contour plot ofgage section of one such cruciform specimen where strain con-centrations are observed near the thickness transition zone. This isfurther supported by the fact that significant reduction in failureload whenever strain concentration regions are observed in thepost-processed strain contour plots. Since these defects con-tributed to failure rather than failure due to biaxial stress state,
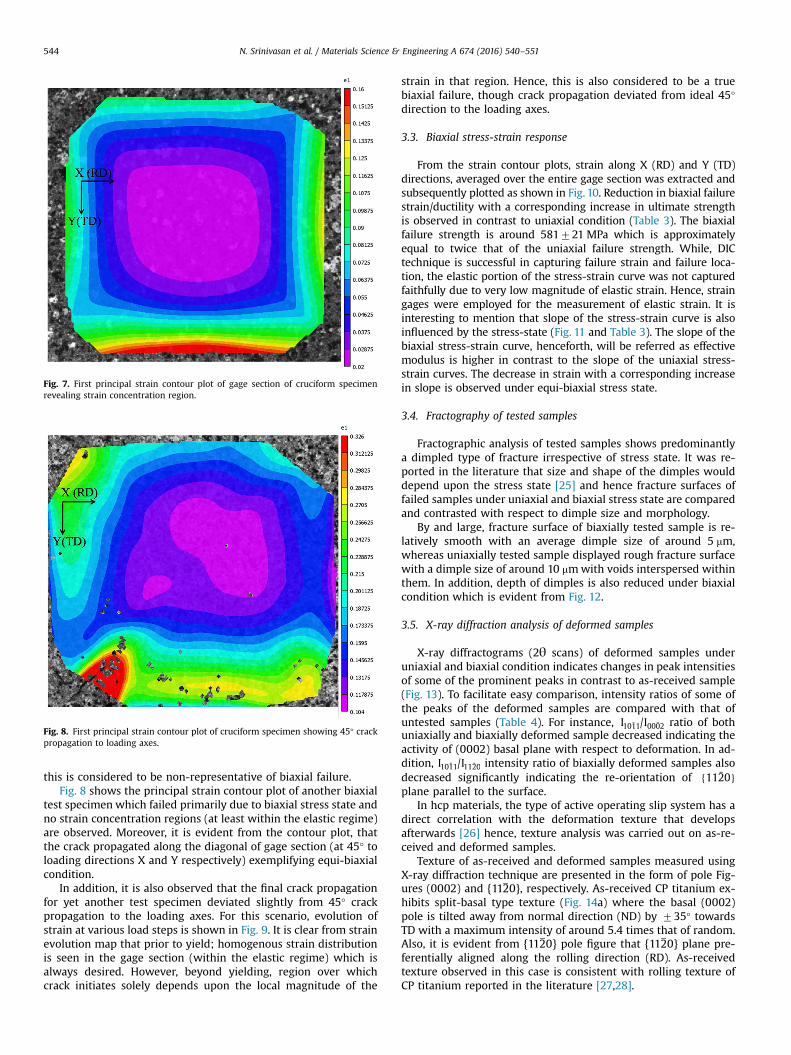
Fig. 7. First principal strain contour plot of gage section of cruciform specimenrevealing strain concentration region.
Fig. 8. First principal strain contour plot of cruciform specimen showing 45° crackpropagation to loading axes.
N. Srinivasan et al. / Materials Science & Engineering A 674 (2016) 540–551544
this is considered to be non-representative of biaxial failure.Fig. 8 shows the principal strain contour plot of another biaxial
test specimen which failed primarily due to biaxial stress state andno strain concentration regions (at least within the elastic regime)are observed. Moreover, it is evident from the contour plot, thatthe crack propagated along the diagonal of gage section (at 45° toloading directions X and Y respectively) exemplifying equi-biaxialcondition.
In addition, it is also observed that the final crack propagationfor yet another test specimen deviated slightly from 45° crackpropagation to the loading axes. For this scenario, evolution ofstrain at various load steps is shown in Fig. 9. It is clear from strainevolution map that prior to yield; homogenous strain distributionis seen in the gage section (within the elastic regime) which isalways desired. However, beyond yielding, region over whichcrack initiates solely depends upon the local magnitude of the
strain in that region. Hence, this is also considered to be a truebiaxial failure, though crack propagation deviated from ideal 45°direction to the loading axes.
3.3. Biaxial stress-strain response
From the strain contour plots, strain along X (RD) and Y (TD)directions, averaged over the entire gage section was extracted andsubsequently plotted as shown in Fig. 10. Reduction in biaxial failurestrain/ductility with a corresponding increase in ultimate strengthis observed in contrast to uniaxial condition (Table 3). The biaxialfailure strength is around 581721 MPa which is approximatelyequal to twice that of the uniaxial failure strength. While, DICtechnique is successful in capturing failure strain and failure loca-tion, the elastic portion of the stress-strain curve was not capturedfaithfully due to very low magnitude of elastic strain. Hence, straingages were employed for the measurement of elastic strain. It isinteresting to mention that slope of the stress-strain curve is alsoinfluenced by the stress-state (Fig. 11 and Table 3). The slope of thebiaxial stress-strain curve, henceforth, will be referred as effectivemodulus is higher in contrast to the slope of the uniaxial stress-strain curves. The decrease in strain with a corresponding increasein slope is observed under equi-biaxial stress state.
3.4. Fractography of tested samples
Fractographic analysis of tested samples shows predominantlya dimpled type of fracture irrespective of stress state. It was re-ported in the literature that size and shape of the dimples woulddepend upon the stress state [25] and hence fracture surfaces offailed samples under uniaxial and biaxial stress state are comparedand contrasted with respect to dimple size and morphology.
By and large, fracture surface of biaxially tested sample is re-latively smooth with an average dimple size of around 5 mm,whereas uniaxially tested sample displayed rough fracture surfacewith a dimple size of around 10 mmwith voids interspersed withinthem. In addition, depth of dimples is also reduced under biaxialcondition which is evident from Fig. 12.
3.5. X-ray diffraction analysis of deformed samples
X-ray diffractograms (2θ scans) of deformed samples underuniaxial and biaxial condition indicates changes in peak intensitiesof some of the prominent peaks in contrast to as-received sample(Fig. 13). To facilitate easy comparison, intensity ratios of some ofthe peaks of the deformed samples are compared with that ofuntested samples (Table 4). For instance, ¯ ¯I /I1011 0002 ratio of bothuniaxially and biaxially deformed sample decreased indicating theactivity of (0002) basal plane with respect to deformation. In ad-dition, ¯ ¯I /I1011 1120 intensity ratio of biaxially deformed samples alsodecreased significantly indicating the re-orientation of { ¯ }1120plane parallel to the surface.
In hcp materials, the type of active operating slip system has adirect correlation with the deformation texture that developsafterwards [26] hence, texture analysis was carried out on as-re-ceived and deformed samples.
Texture of as-received and deformed samples measured usingX-ray diffraction technique are presented in the form of pole Fig-ures (0002) and {112̅0}, respectively. As-received CP titanium ex-hibits split-basal type texture (Fig. 14a) where the basal (0002)pole is tilted away from normal direction (ND) by 735° towardsTD with a maximum intensity of around 5.4 times that of random.Also, it is evident from {112̅0} pole figure that {112̅0} plane pre-ferentially aligned along the rolling direction (RD). As-receivedtexture observed in this case is consistent with rolling texture ofCP titanium reported in the literature [27,28].

Fig. 9. First principal strain contour plots of gage section of cruciform specimen at various load steps (a) 42 kN (b) 62 kN (c) 72 kN (d) 77 kN.
Fig. 10. Biaxial stress-strain response CP titanium until failure.
Table 3Uniaxial and biaxial mechanical properties of CP titanium.
Stress state 0.2% yieldstrength inMPa
Modulus/Effec-tive modulus inGPa
Failurestrength inMPa
Equivalent fail-ure strain (DIC)
Uniaxial(DD)
181713 105 273712 0.5870.05
Biaxial 320720 163 581721 0.3670.08
N. Srinivasan et al. / Materials Science & Engineering A 674 (2016) 540–551 545
Uniaxial samples deformed along RD revealed basal pole(0002) intensity maximum at 720° away from the ND but tiltedtowards TD, whereas, not much difference is observed in the caseof {112̄0} pole figure when compared to as-received texture(Fig. 14b). Uniaxial samples deformed along 45° to rolling direction(DD) shows texture similar to uniaxial RD samples, however,texture components are rotated by 45° since the samples areextracted and tested along 45° to the rolling direction. (Fig. 15a).
Texture of biaxially deformed samples revealed a weakening ofbasal texture as shown in the Fig. 15b. The split-type basal texture

Fig. 11. Elastic stress-strain response of CP titanium tested under uniaxial andbiaxial condition.
Fig. 13. X-ray diffractograms of as-received and deformed samples.
Table 4Intensity ratios of prominent peaks of as-received and deformed samples.
Intensity ratio As-received Uniaxial Biaxial
N. Srinivasan et al. / Materials Science & Engineering A 674 (2016) 540–551546
is lost completely along with development of new texture com-ponent {112̅0} oriented along the ND direction. Texture results arein good agreement with normal X-ray diffractogram of biaxiallydeformed samples with an increased intensity of {112̅0} plane asshown in Fig. 13.
¯I /I1011 0002 1.3 0.83 0.80
¯ ¯I /I1011 1120 12.5 16.6 3.22
4. Discussion
It is clear from Fig. 4 that CP titanium displayed in-plane ani-sotropic response under uniaxial stress state with variation inmechanical properties along RD, DD and TD, respectively. Suchorientation dependent mechanical properties of commerciallypure titanium were also reported in the recent literature [29–31].
Fig. 12. Fractography of uniaxial
Since hcp materials such as titanium possess only four in-dependent active slip systems [32], deformation is primarily gov-erned by favorable orientation of the operating slip system withthat of stress-axis [33]. Unfavorable orientation with respect tostress axis always results in increased yield strength whereas
and biaxial tested samples.
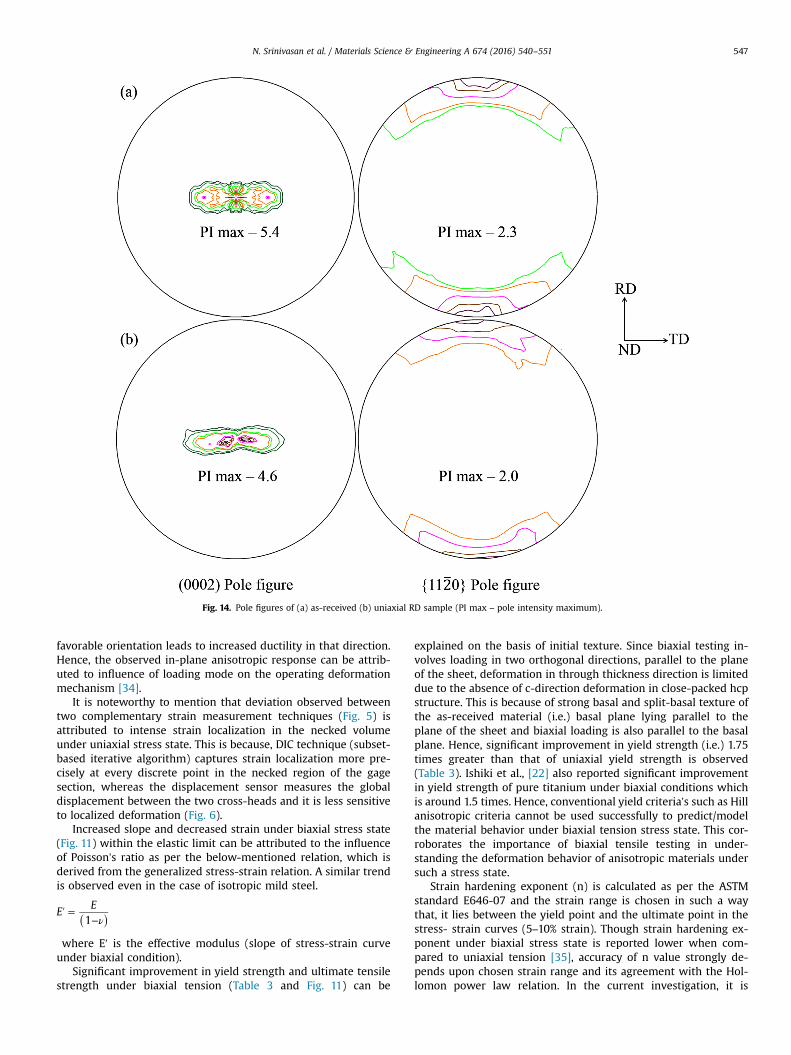
Fig. 14. Pole figures of (a) as-received (b) uniaxial RD sample (PI max – pole intensity maximum).
N. Srinivasan et al. / Materials Science & Engineering A 674 (2016) 540–551 547
favorable orientation leads to increased ductility in that direction.Hence, the observed in-plane anisotropic response can be attrib-uted to influence of loading mode on the operating deformationmechanism [34].
It is noteworthy to mention that deviation observed betweentwo complementary strain measurement techniques (Fig. 5) isattributed to intense strain localization in the necked volumeunder uniaxial stress state. This is because, DIC technique (subset-based iterative algorithm) captures strain localization more pre-cisely at every discrete point in the necked region of the gagesection, whereas the displacement sensor measures the globaldisplacement between the two cross-heads and it is less sensitiveto localized deformation (Fig. 6).
Increased slope and decreased strain under biaxial stress state(Fig. 11) within the elastic limit can be attributed to the influenceof Poisson’s ratio as per the below-mentioned relation, which isderived from the generalized stress-strain relation. A similar trendis observed even in the case of isotropic mild steel.
( )ν′ =
−E
E1
where E′ is the effective modulus (slope of stress-strain curveunder biaxial condition).
Significant improvement in yield strength and ultimate tensilestrength under biaxial tension (Table 3 and Fig. 11) can be
explained on the basis of initial texture. Since biaxial testing in-volves loading in two orthogonal directions, parallel to the planeof the sheet, deformation in through thickness direction is limiteddue to the absence of c-direction deformation in close-packed hcpstructure. This is because of strong basal and split-basal texture ofthe as-received material (i.e.) basal plane lying parallel to theplane of the sheet and biaxial loading is also parallel to the basalplane. Hence, significant improvement in yield strength (i.e.) 1.75times greater than that of uniaxial yield strength is observed(Table 3). Ishiki et al., [22] also reported significant improvementin yield strength of pure titanium under biaxial conditions whichis around 1.5 times. Hence, conventional yield criteria’s such as Hillanisotropic criteria cannot be used successfully to predict/modelthe material behavior under biaxial tension stress state. This cor-roborates the importance of biaxial tensile testing in under-standing the deformation behavior of anisotropic materials undersuch a stress state.
Strain hardening exponent (n) is calculated as per the ASTMstandard E646-07 and the strain range is chosen in such a waythat, it lies between the yield point and the ultimate point in thestress- strain curves (5–10% strain). Though strain hardening ex-ponent under biaxial stress state is reported lower when com-pared to uniaxial tension [35], accuracy of n value strongly de-pends upon chosen strain range and its agreement with the Hol-lomon power law relation. In the current investigation, it is

Fig. 15. Pole figures of (a) uniaxial 45° to RD sample (b) biaxially deformed sample (PI max – pole intensity maximum).
Table 5Strain hardening exponent and Vickers indentation hardness of as-received anddeformed samples.
Stress state Strain hardening exponent(strain range � 5 to 10%)
Vicker's indentationhardness HV0.3
As-received – 15875Uniaxial (TD) 0.12 15876Uniaxial (DD) 0.14 16975Uniaxial (RD) 0.18 17077Biaxial 0.21 21277
N. Srinivasan et al. / Materials Science & Engineering A 674 (2016) 540–551548
observed that biaxial strain hardening exponent is higher thanuniaxial strain hardening exponent, which is contradictory toprevious literature [35] (Table 5). Considering the fact that higherstrain hardening exponent is beneficial for formability, betterstretchability and formability can be achieved under biaxial ten-sion. However, fracture intervenes much earlier due to loss ofpost-uniform elongation/ductility in contrast to uniaxialcounterpart.
In addition, higher strain hardening exponent also means thatmaterial strain hardens to a greater extent before fracture. Tocorroborate this, Vickers indentation was performed near the
fracture surface of uniaxial and biaxial tested samples. It is ob-served that the hardness of biaxially deformed samples is higherthan uniaxially deformed samples (Table 5), which is concomitantto higher strain hardening exponent observed under biaxial con-dition. Also, intense strain localization is observed in the case ofuniaxial samples (Fig. 6) but not in biaxially deformed samples(i.e.) absence of localized deformation (Figs. 8 and 9).
SEM images of neck profiles (Fig. 16) of uniaxial tested samplesat various orientations revealed sharp localized necking (largereduction in area) in the case of TD samples, whereas less pro-nounced necking is observed in RD and DD samples, respectively.Observed differences in necking profile are in good agreementwith calculated strain hardening exponents and indentationhardness taken close to the fracture surface (Table 5).
Decreased dimple size under biaxial condition (Fig. 12) can beexplained on the basis of void nucleation and link up prior tofracture. It was reported by Kestner and Koss [36] that void nu-cleation, growth and void linking would depend upon stress stateand strain path history. Similarly, stress-based fracture criterion byA.K. Ghosh [37] also postulated accelerated shear linking of voidsunder the presence of high tri-axial stresses. Since higher tri-axi-ality is normally encountered under biaxial condition, void-link upis enhanced more in contrast to uniaxial stress state which led tosmaller dimples.

Fig. 16. Neck profiles of uniaxial tested samples at various orientations with respect to RD.
Fig. 17. ODF φ1 sections of as-received, uniaxial and biaxially deformed samples.
N. Srinivasan et al. / Materials Science & Engineering A 674 (2016) 540–551 549
Texture evolution upon biaxial deformation revealed dramaticchanges in contrast to uniaxially deformed samples (Fig. 15b).Though the observed biaxial strengthening effect can be attributedto split-basal texture, significant textural changes and loss inductility under biaxial tension needs further explanation. It is
reported that for basal textured material under uniaxial stressstate, straining in thickness direction is largely avoided but notunder biaxial condition due to nature of loading [20].
Due to this additional constraint during biaxial loading as wellas absence of c-axis deformation (thickness direction) resulted in

Table 6Important texture components of as-received and deformed samples.
Sample Texture component φ1 (°) Φ (°) φ2 (°) ODF value(Max)
As-received ( )01215 [ ]71141 50 4 30 7
( )0001 [ ]1100 0/360 5 60 8
Uniaxial RD ( )0001 [ ]1010 350 29 10 10
( )1127 [ ]1100 180 24 60 9
Uniaxial DD ( )0001 [ ]1010 349 30 10 13
( )0113 [ ]132111 155 29 25 12
Biaxial ( )1238 [ ]88169 94 30 50 6
( )0001 [ ]2110 350 15 45 4
( )0115 [ ]2110 360 20 30 4
N. Srinivasan et al. / Materials Science & Engineering A 674 (2016) 540–551550
reduced ductility with significant improvement in tensile strengthof about 76%. Furthermore, loss of split-basal texture is manifesteditself in the form of orientation rotation of (0002) basal pole to-wards TD, thereby resulting in development of new texture com-ponent {11 2̅0} pole oriented parallel to ND direction. Transfor-mation from strong basal type to {11 2̅0} type observed uponbiaxial deformation could be due to operation of specific type oftwinning system during loading. Important texture components ofas-received, uniaxial and biaxially deformed samples are outlinedin ODF φ1 sections (Fig. 17). As-received samples revealed thepresence of strong basal texture components (φ1¼0°, Φ¼5°,φ2¼0–60°), whereas, upon deformation, basal components areprogressively weakened. In addition, biaxially deformed samplesrevealed distinct texture components developed at the expense ofbasal component (Table 6). Such a texture transition could be dueto imposed mode of deformation and absence of c-axis deforma-tion of basal textured material during biaxial loading.
5. Conclusions
Cruciform specimens were machined based on optimizedgeometry obtained using FEM simulation and biaxial testing wascarried out to understand the influence of stress state on themechanical properties of CP titanium. The decrease in ductilitywith an increase in strength is observed under biaxial conditions.Increased slope under biaxial stress state is explained based on thegeneralized Hooke's relation. The increased indentation hardnessof biaxially tested sample in contrast to uniaxially tested sample isattributed to differences in strain hardening behavior. Albeit si-milarities in fracture mode, decreased dimple size and depth inbiaxially tested samples is evidenced through fractographic stu-dies. Strengthening effect under biaxial tension is attributed tosplit-basal texture of as-received samples and texture analysis ofbiaxial deformed samples indicated alignment of {112̅0} pole withthe normal direction.
Acknowledgments
This work was sponsored by ISRO-IITM (Grant number - ISRO-IITM/ASE/11-12/RVEL/139) cell and the financial support is grate-fully acknowledged. Dr. Satyam Suwas and Sumit Bahl are ac-knowledged for their help in carrying out texture measurementsat IISc Bangalore.
References
[1] R.R. Boyer, An overview on the use of titanium in the aerospace industry,Mater. Sci. Eng. 213 (1–2) (1996) 103–114.
[2] J. Liu, M. Ahmetoglu, T. Altan, Evaluation of sheet metal formability, viscouspressure forming (VPF) dome test, J. Mater. Process. Technol. 98 (1) (2000)1–6.
[3] M. Atkinson, An investigation of hydraulic bulging as a biaxial straining test forsheet metal, J. Test. Eval. 33 (1) (2005) 19–26.
[4] T. Foecke, M.A. Iadicola, A. Lin, S.W. Banovic, A method for direct measurementof multiaxial stress-strain curves in sheet metal, Metall. Mater. Trans. A 38 (2)(2007) 306–313.
[5] S.R. Swanson, A.P. Christoforou, G.E. Colvin Jr., Biaxial testing of fiber compo-sites using tubular specimens, Exp. Mech. 28 (3) (1988) 238–243.
[6] A. Hannon, P. Tiernan, A review of planar biaxial tensile test systems for sheetmetal, J. Mater. Process. Technol. 198 (1–3) (2008) 1–13.
[7] Xiang-Dong Wu, Min Wan, Xian-Bin Zhou, Biaxial tensile testing of cruciformspecimen under complex loading, J. Mater. Process. Technol. 168 (1) (2005)181–183.
[8] F. Abbassi, S. Mistou, A. Zghal, Failure analysis based on microvoid growth forsheet metal during uniaxial and biaxial tensile tests, Mater. Des. 49 (2013)638–646.
[9] Y. Hanabusa, H. Takizawa, T. Kuwabara, Numerical verification of a biaxialtensile test method using a cruciform specimen, J. Mater. Process. Technol. 213(6) (2013) 961–970.
[10] ISO 16842, Metallic Materials – Sheet and Strip – Biaxial Tensile TestingMethod Using a Cruciform Test Piece.
[11] N. Deng, T. Kuwabara, Y.P. Korkolis, Cruciform specimen design and verifica-tion for constitutive identification of anisotropic sheets, Exp. Mech. 55 (6)(2015) 1005–1022.
[12] Lionel Leotoing, Dominique Guines, Investigations of the effect of strain pathchanges on forming limit curves using an in-plane biaxial tensile test, Int. J.Mech. Sci. 99 (2015) 21–28.
[13] S. Demmerle, J.P. Boehler, Optimal design of biaxial tensile cruciform speci-mens, J. Mech. Phys. Solids 41 (1) (1993) 143–181.
[14] A. Smits, D.V. Hemelrijck, T.P. Philippidis, A. Cardon, Design of a cruciformspecimen for biaxial testing of fibre reinforced composite laminates, Compo-sites Sci. Technol. 66 (7–8) (2006) 964–975.
[15] J.S. Welsh, D.F. Adams, Biaxial and triaxial failure strengths of 6061-T6 alu-minum and AS4/3501-6 carbon/epoxy laminates obtained by testing thick-ness-tapered cruciform specimens, J. Composites Technol. Res. 23 (2) (2001)111–121.
[16] C. Ramault, A. Makris, D.V. Hemelrijck, E. Lamkanfi, W.V. Paepegem, Com-parison of different techniques for strain monitoring of a biaxially loadedcruciform specimen, Strain 47 (Suppl. 2) (2011) s210–s217.
[17] H. Schreier, J.-J. Orteu, M.A. Sutton, Image Correlation for Shape, Motion andDeformation Measurements: Basic Concepts, Theory and Applications,Springer, US, 2009.
[18] D.E. Green, K.W. Neale, S.R. Mac Ewen, A. Makinde, R. Perrin, Experimentalinvestigation of the biaxial behavior of an aluminum sheet, Int. J. Plast. 20 (8–9) (2004) 1677–1706.
[19] A.S. Taylor, M. Weiss, T. Hilditch, N. Stanford, P.D. Hodgson, Formability ofcryo-rolled aluminum in uniaxial and biaxial tension, Mater. Sci. Eng. A 555(2012) 148–153.
[20] Y. Chino, K. Kimura, M. Mabuchi, Deformation characteristics at room tem-perature under biaxial tensile stress in textured AZ31 Mg alloy sheets, ActaMater. 57 (5) (2009) 1476–1485.
[21] P. Tomlinson, H. Azizi-Alizamini, W.J. Poole, C.W. Sinclair, M.A. Gharghouri,Biaxial deformation of the magnesium alloy AZ80, Metall. Mater. Trans. A 44(7) (2013) 2970–2983.
[22] M. Ishiki, T. Kuwabara, Y. Hayashida, Measurement and analysis of differentialwork hardening behavior of pure titanium sheet using spline function, Int. J.Mater. Form. 4 (2) (2011) 193–204.
[23] T. Kuwabara, F. Sugawara, Multiaxial tube expansion test method for mea-surement of sheet metal deformation behavior under biaxial tension for alarge strain range, Int. J. Plast. 45 (2013) 103–118.
[24] S. Sambamurthy, Biaxial Study of Liner Materials in Composite Pressure Bot-tles (MS thesis), Indian Institute of Technology Madras, 2008.
[25] C.D. Beachem, The effects of crack tip plastic flow directions upon microscopicdimple shapes, Metall. Trans. A 6 (2) (1975) 377–383.
[26] Y.N. Wang, J.C. Huang, Texture analysis in hexagonal materials, Mater. Chem.Phys. 81 (2003) 11–26.
[27] N. Bozzolo, N. Dewobroto, H.R. Wenk, F. Wagner, Microstructure and micro-texture of highly cold-rolled commercially pure titanium, J. Mater. Sci. 42 (7)(2007) 2405–2416.
[28] Y.B. Chun, S.H. Yu, S.L. Semiatin, S.K. Hwang, Effect of deformation twinning onmicrostructure and texture evolution during cold rolling of CP-titanium, Ma-ter. Sci. Eng. A 398 (1–2) (2005) 209–219.
[29] Weixin Yu, Yifan Lv, Shikai Li, Yang Wang, Bobo Li, Zhiqian Liao, Mechanism ofthe anisotropy of yield ratio in TA5 titanium alloy plates, Mater. Sci. Eng. A 639(2015) 314–319.
[30] A. Roth, M.A. Lebyodkin, T.A. Lebedkina, J.-S. Lecomte, T. Richetona, K.E.K. Amouzou, Mechanisms of anisotropy of mechanical properties of α-tita-nium in tension conditions, Mater. Sci. Eng. A 596 (2014) 236–243.
[31] S. Panda, S.K. Sahoo, A. Dash, M. Bagwan, G. Kumar, S.C. Mishra, S. Suwas,

N. Srinivasan et al. / Materials Science & Engineering A 674 (2016) 540–551 551
Orientation-dependent mechanical properties of commercially pure (cp) ti-tanium, Mater. Charact. 98 (2014) 93–101.
[32] M.H. Yoo, Slip, twinning, and fracture in hexagonal close-packed metals,Metall. Trans. A 12 (3) (1981) 409–418.
[33] M.R. Bache, W.J. Evans, Impact of texture on mechanical properties in an ad-vanced titanium alloy, Mater. Sci. Eng. A 319–321 (2001) 409–414.
[34] H. Nasiri-Abarbekoh, A. Ekrami, A.A. Ziaei-Moayyed, M. Shohani, Effects ofrolling reduction on mechanical properties anisotropy of commercially pure
titanium, Mater. Des. 34 (2012) 268–274.[35] Feliks Stachowicz, Effects of microstructure on the mechanical Properties and
limit strains in uniaxial and Biaxial stretching, J. Mech. Working Technol. 19(3) (1989) 305–317.
[36] S.C. Kestner, D.A. Koss, On the influence of strain-path changes on fracture,Metall. Trans. A 18 (5) (1987) 637–639.
[37] Amit K. Ghosh, A criterion for ductile fracture in sheets under biaxial loading,Metall. Trans. A 7 (4) (1976) 523–533.