materials and methods - pingry school
TRANSCRIPT
Materials and Methods Investigating the eIF4E4EBP1 Signaling Axis
This year, we worked to isolate EIF4E and ligate it into the plasmid pBABE, a bacterial expression vector. cDNA coding for wildtype eIF4E cloned into the PTXB1 mammalian expression vector was obtained from the Schneider Laboratory at NYU. This plasmid was reconstituted in distilled water, then transformed into competent DH5α Escherichia Coli Cells, which were grown up on LB/Agar/Ampicilllin plates. These bacteria were then inoculated in liquid LB/Ampicillin and incubated overnight to amplify levels of the plasmid. (Additionally, glycerol stocks were made of this bacterial construct to preserve the original plasmid for later use.) The inoculate was extracted from the cells and then purified via a plasmid DNA miniprep. A PCR reaction using customdesigned primers was performed on the purified plasmid in order to purify the eIF4E gene out of its vector. cDNA for 4EBP1 (obtained from Sino Biological Incorporated in the pMUD simple vector) was also cloned in the same manner. Barefoot Running
To conduct our experiment, we used a GoPro Hero 3+, the Pingry track, a long field of grass, and a gymnasium floor. We used 15 test subjects, all of whom consented to participate. However, to ensure our results were not skewed, we did not inform our subjects about our experiment, meaning they did not know why or for what reason we were filming them. In this way, we ensured that the subjects would not subconsciously or consciously change their foot strike for the camera. For our first trial, we individually filmed 15 female runners between the ages of 1418 on the Hauser Auditorium carpet surface. The carpet was thin, yet softer than a hardwood floor. First, each girl ran a set distance of approximately 50 meters in her own personal sneakers. We asked them to run at a relaxed, natural jog pace (not a sprint but not a walk either). We positioned the GoPro so it was aimed at their feet as they ran in front of us. We set the GoPro on 30 frames per second in order to capture multiple snapshots of their stride and their feet striking the ground. We made sure we could determine by our footage whether each girl was running with a toe strike, a midfoot strike, or a heel strike. For our second trial, we filmed each girl on the track. We repeated the exact same steps as shown above in order to ensure accuracy. For our third trial, we filmed the same individuals on a long field of grass using the same method as previously stated with the GoPro taking 30 shots per second. To analyze our data, we uploaded our frames to Google Drive and observed each one. We discerned the foot strike of each individual runner in sneakers versus barefoot, on the carpet, the track, and the grass. Using Microsoft Excel, we created a table and graphs to organize and analyze our data.
The Effects of Different Agar Media on Sporulation of Sordaria fimicola Plate Making: We made 200 mL of each type of agar. We then poured 9 original Sordaria growth agar plates and 16 more plates of each type of agar.

Growth agar Crossing Agar NaAc Agar KAc Agar
4 g growth agar 200 mL water
35.1 (7.02) g agar 1 L (200 mL) water
2 g K Acetate .5 g yeast extract .2 dextrose 6 g agar 200 mL water
1.671 g Na Acetate .5 g yeast extract .2 dextrose 6 g agar 200 mL water
Each type of fungus (black, gray, and tan) was individually added to the 9 Sordaria growth agar plates (3 plates each). The plates were covered with parafilm and incubated at approximately 25 degrees Celsius for 56 days. Sordaria Transference: Using a sterile cork borer we made holes in the Sordaria growth agar. We used inoculating loops to transfer 2 holes from the growth agar onto each plate. We then transferred each type of Sordaria onto 4 of each type of agar plate. Spore Counting: We pipetted 1000 uL of distilled water onto the plate and used an inoculating loop to try to detach the spores from the agar. Once it seems all the spores were floating, we used the pipette to transfer the water with spores into a 1.5 mL tube. We inverted the test tube 4 times to mix the solution in the tube and pipetted 100 uL onto a microscope slide. We used a Leica BME microscope at the zoom level of 10X to count the number of spores /100 uL. Social Defeat in Zebrafish
Previous research has shown that fish will often swim to the bottom of a tank environment when anxious. With this information in mind, we studied behavior as a phenotype by measuring the amount of time fish spent at the top and bottom of a novel tank. Fish were divided into two aquariums, of five fish each, with one subset acting as a control group and the other being routinely exposed to social defeat using the “residentintruder” paradigm for 6 hours a day, 5 days a week, for one week. The residentintruder paradigm involves showing the experimental group a computer simulation of other fish, which when in the wild, would be the aggressive predators to the zebrafish. Stress response was then measured by the defensive diving of each fish upon introduction to the novel tank for ten minutes. This process was recorded and subsequently indexed by human observers. Purification of Agrobacterium tumefaciens from Grapevines Experiment 1: Obtaining and Purifying Agrobacterium tumefaciens
In early November we got a vinet grape vine from Unionville Vineyard with several samples of crown gall to extract a sample of A. tumefaciens. In order to ensure that the masses were crown gall, we took samples of the masses and placed them 10 cm agar plates. We followed a procedure for Selective Medium for Biovar 3, on which colonies of A. tumefaciens will grow as white dots with red centers (6). We obtained cycloheximide, triphenyltetrazolium
chloride, Dcycloserine, and trimethoprin from SigmaAldrich, and had the other reagents (Adonitol, K2HPO4, KH2PO4, NaCl, MgSO4, Yeast extract, Boric acid, and agar) in our stock room. While making the media we ran into a problem with dissolving trimethoprim into water and had to use 5 mL of DMSO and .1g of trimethoprim. After a week of incubation at 28°C, the plates with masses from the vine had grown a few colonies that appeared to be A. tumefaciens. To be sure, we chose single colonies from the plate and streaked them on three new plates of Biovar 3 media to obtain more colonies. After 4 days of incubation at 28°C, the growth was successful and the plates were taken out of the incubator, parafilmed, and placed in the refrigerator to prevent overgrowth. Experiment 2: Inoculating Host Plants
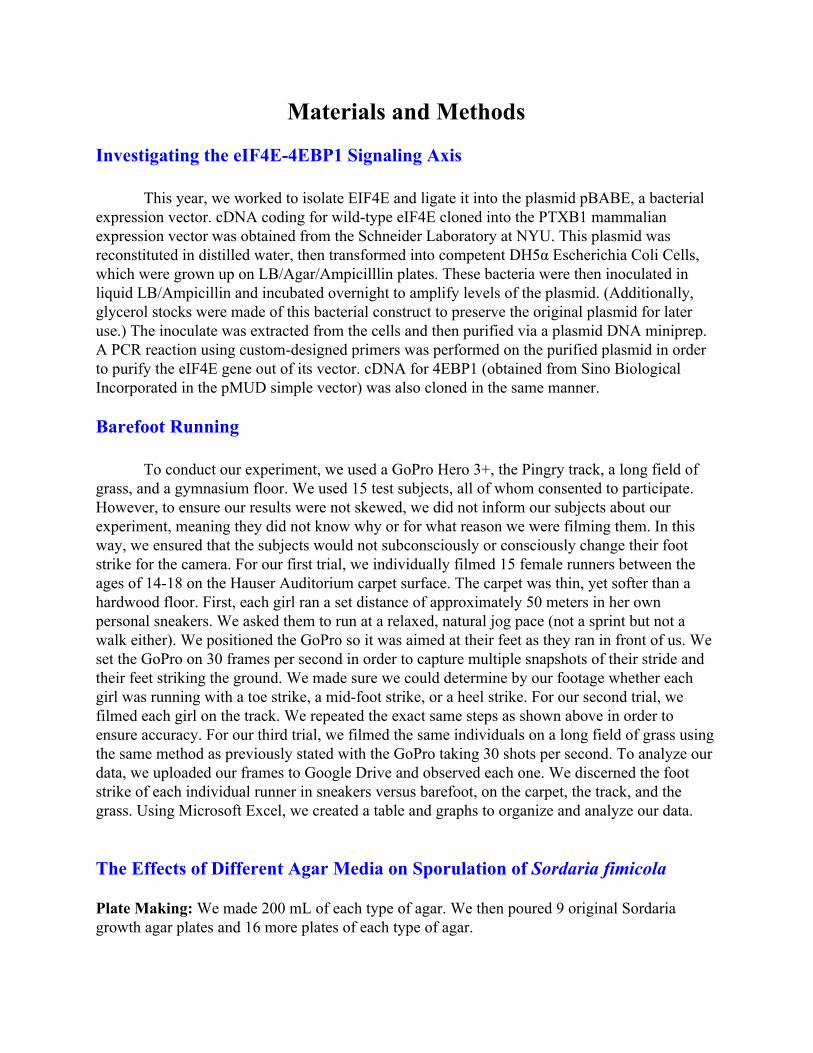
With carrots bought from Shoprite, we aimed to inoculate and infect them with A. tumefaciens to see if this was, in fact, the bacteria responsible for forming our tumor sample from the vineyard. First, we cut carrot disks with a width of 1 cm and placed three of them on a Biovar 3 plate. We then took a colony from the streaked plates and placed one on each piece of carrot and placed plate in incubator at 28°C. In the second half of the experiment, we placed 2 carrot disks in water agar (made with deionized water and agar solution) and inoculated one of the disks. The plate was parafilmed to maintain the moisture and stored at 28°C for two weeks. Feasibility Study of the Aquaponics Home System
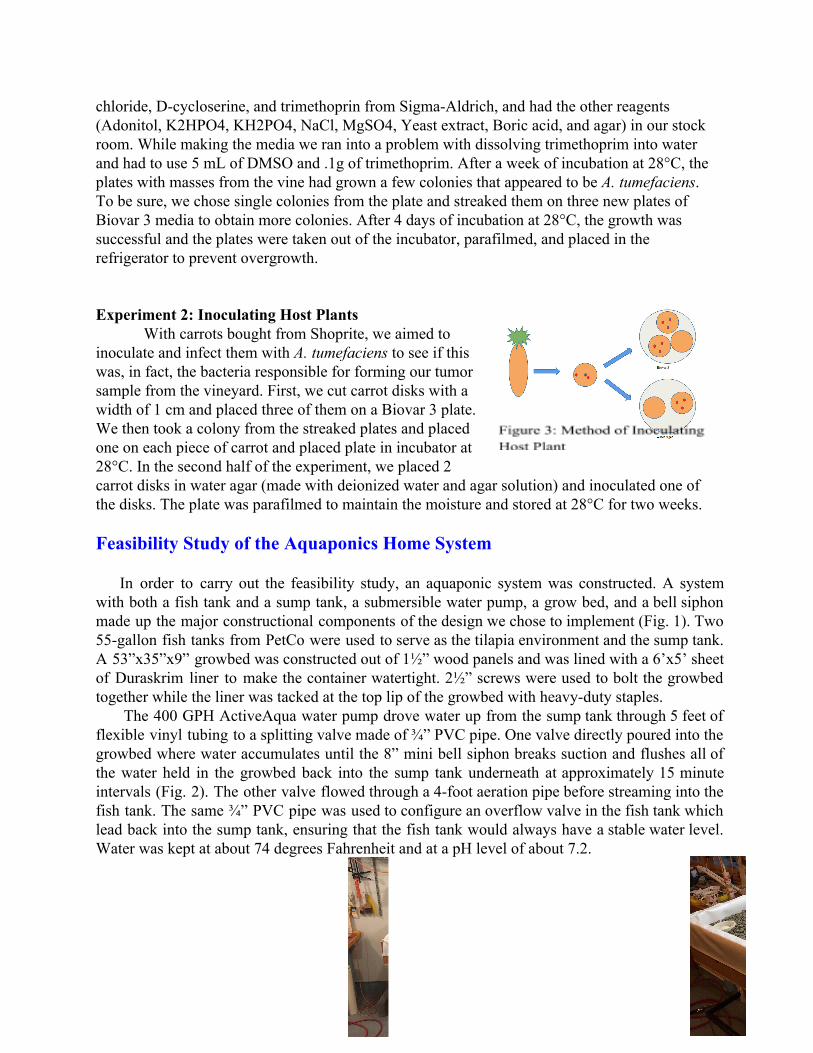
In order to carry out the feasibility study, an aquaponic system was constructed. A system with both a fish tank and a sump tank, a submersible water pump, a grow bed, and a bell siphon made up the major constructional components of the design we chose to implement (Fig. 1). Two 55gallon fish tanks from PetCo were used to serve as the tilapia environment and the sump tank. A 53”x35”x9” growbed was constructed out of 1½” wood panels and was lined with a 6’x5’ sheet of Duraskrim liner to make the container watertight. 2½” screws were used to bolt the growbed together while the liner was tacked at the top lip of the growbed with heavyduty staples. The 400 GPH ActiveAqua water pump drove water up from the sump tank through 5 feet of flexible vinyl tubing to a splitting valve made of ¾” PVC pipe. One valve directly poured into the growbed where water accumulates until the 8” mini bell siphon breaks suction and flushes all of the water held in the growbed back into the sump tank underneath at approximately 15 minute intervals (Fig. 2). The other valve flowed through a 4foot aeration pipe before streaming into the fish tank. The same ¾” PVC pipe was used to configure an overflow valve in the fish tank which lead back into the sump tank, ensuring that the fish tank would always have a stable water level. Water was kept at about 74 degrees Fahrenheit and at a pH level of about 7.2.

PVC pipe glue was applied to the plumbing to make the system airtight. By 10/27/14 the system was fully assembled. On 11/5/14 twelve Tomato Bush Better seeds and thirty Bloomsdale Organic Spinach seeds were planted in egg cartons with Miracle Grow and watered daily until germinated (Fig. 3). By 11/7/14 four bags of 50 liter ViaStone Hydroponic Gardening Grow Rock Medium from ViaGrow were added to the growbed and approximately 90 gallons of filtered water filled the now fully functioning system. On 11/24/14 nine 2” tall tomato sprouts and twentythree 2” tall spinach sprouts were delicately transplanted from the egg cartons and into the growbed under two 200watt growlights. Approximately 250 red wrigglers were also introduced into this medium. On 12/4/14 nine Silver Nile Tilapia survived through the night after installation. The fish tanks, API Freshwater Master Test Kits, Aqueon Mini Cichlid food pellets (34% crude protein), PH down, air check valve, 300watt water heater, water thermometer, and nitrifying bacteria colonies were obtained from Petco. The wood, PVC piping, PVC pipe fittings, overflow valve screen, hydroclay pebbles, flexible tubing, two dual outlet heavy duty timers, a powerstrip, and all other screws and glue were bought at Home Depot. The Duraskrim liner, bell siphon, water pump, plant seeds, and tilapia fingerlings were all purchased from the online Aquaponics Store. Red Wrigglers were ordered from Uncle Jim’s Worm Farm. Surveying Biology Knowledge in Pingry Students The survey is a multiplechoice instrument that can be readily administered and scored. The uniformity of the multiplechoice questions eliminates the possibility of bias based on question type. This instrument has been designed not only to assess Pingry students’ biological literacy, but also to assist the development of the science department’s teaching methodology. Survey development is substantiated by literature regarding the testing of scientific literacy skills and students’ misconceptions. Each item on the survey covers a basic unit of Biology I. Survey Process

1) Examined literature on student’s scientific literacy skills 2) Established interest and background with Mr. Maxwell 3) Developed a survey (basic biology knowledge) 4) Tested the survey on a sample upperclassmen group to gauge difficulty 5) Administered the survey to upper school students 6) Analyzed the results During the last week of March 2015 through the first week of April 2015, the 8 item multiple choice assessment was distributed to Upper School students via SurveyMonkey, a platform for survey creation and distribution. The survey was designed to reach as many students as possible in a time effective manner. Mean differences in survey scores between freshman and sophomores, then juniors and seniors were examined using total scores for each class as well as a comparative study of results for sample questions between upperclassmen and freshmen. It should be noted that these results may be somewhat skewed based on surveys completed by students in AP Biology classes. In addition, these results reflecting differences in students’ biology literacy do not take into account general academic standing or prior/extracurricular science education. Purification of Salmonella typhimurium Transcription Factors HilC and HilD
We originally received SPI1 genes HilC and HilD from the Kull Lab at Dartmouth College in vector pET19b. All bacterial cultures were grown in Luria broth with 100x ampicillin. All protocols used are listed below. We isolated the plasmid through a standard Qiagen miniprep protocol and using polymerase chain reaction, amplified HilC and HilD and then purified the PCR results. We digested both genes and the expression vector pTXB1 with restriction enzymes NdeI and SapI. We then purified the digested vector and insert. We separately ligated HilC and HilD into pTXB1 at ratios of 3:1 and 9:1 of insert to vector. Using highefficiency DH5a E.coli cells from NEB, we transformed the ligated vector. To test whether the ligation worked properly we grew up cultures and isolated the plasmid using the same protocol as before. With restriction enzymes NdeI and SapI, we test digested the plasmid and ran the digested plasmid through a 1% agarose gel. If the gel had bands of DNA at the proper weights (one at ~6.7 kb and one at ~1 kb), then we would know the ligation succeeded. Miniprep Protocol
● Grow up 5 mL LB amp bacterial culture overnight ● Pellet at 4 °C, 6000 rpm for 10 min ● Resuspend in 250 μl Buffer P1 and transfer to 1.5 mL tube ● Add 250 μl Buffer P2 and invert tube 46 times ● Add 350 μl Buffer N3 and invert tube (immediately) 46 times ● Centrifuge 10 min 13000 rpm ● Apply supernatant to spin column and centrifuge 1 min ● Discard flow through ● Add 750 μl Buffer PE and centrifuge 1 min ● Discard flow through and centrifuge 1 min more ● Place spin column in 1.5 mL tube
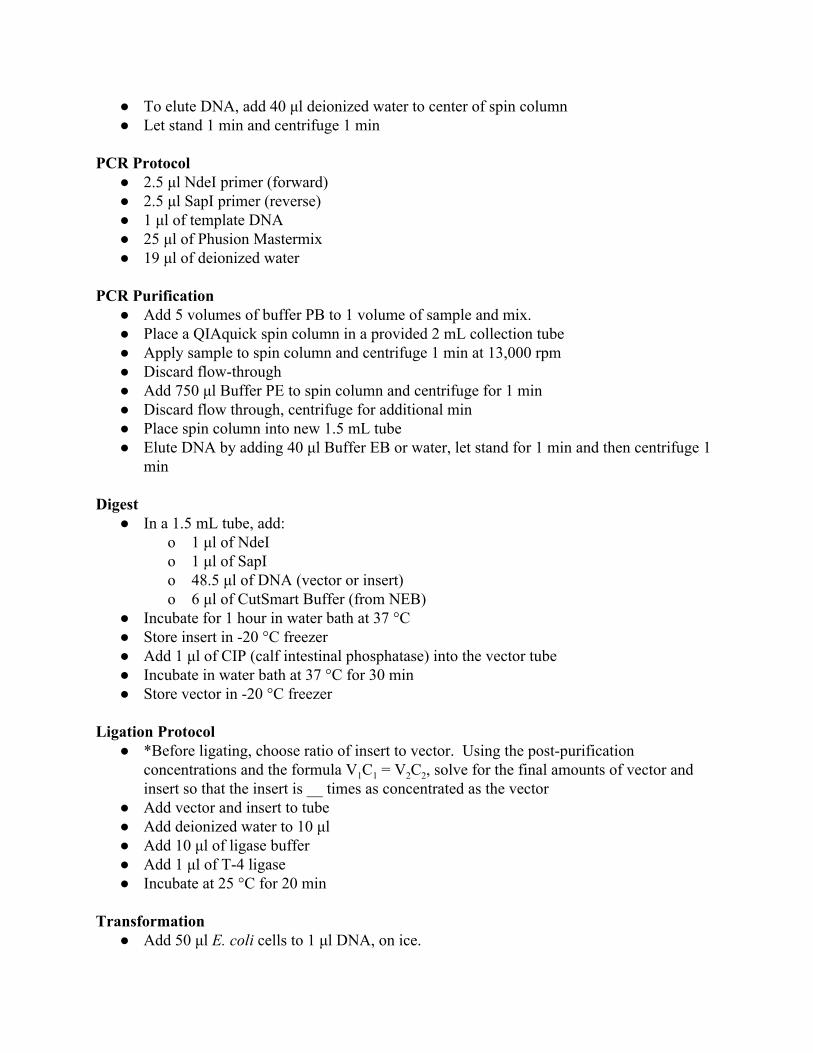
● To elute DNA, add 40 μl deionized water to center of spin column ● Let stand 1 min and centrifuge 1 min
PCR Protocol
● 2.5 μl NdeI primer (forward) ● 2.5 μl SapI primer (reverse) ● 1 μl of template DNA ● 25 μl of Phusion Mastermix ● 19 μl of deionized water
PCR Purification
● Add 5 volumes of buffer PB to 1 volume of sample and mix. ● Place a QIAquick spin column in a provided 2 mL collection tube ● Apply sample to spin column and centrifuge 1 min at 13,000 rpm ● Discard flowthrough ● Add 750 μl Buffer PE to spin column and centrifuge for 1 min ● Discard flow through, centrifuge for additional min ● Place spin column into new 1.5 mL tube ● Elute DNA by adding 40 μl Buffer EB or water, let stand for 1 min and then centrifuge 1
min Digest
● In a 1.5 mL tube, add: o 1 μl of NdeI o 1 μl of SapI o 48.5 μl of DNA (vector or insert) o 6 μl of CutSmart Buffer (from NEB)
● Incubate for 1 hour in water bath at 37 °C ● Store insert in 20 °C freezer ● Add 1 μl of CIP (calf intestinal phosphatase) into the vector tube ● Incubate in water bath at 37 °C for 30 min ● Store vector in 20 °C freezer
Ligation Protocol
● *Before ligating, choose ratio of insert to vector. Using the postpurification concentrations and the formula V1C1 = V2C2, solve for the final amounts of vector and insert so that the insert is __ times as concentrated as the vector
● Add vector and insert to tube ● Add deionized water to 10 μl ● Add 10 μl of ligase buffer ● Add 1 μl of T4 ligase ● Incubate at 25 °C for 20 min
Transformation
● Add 50 μl E. coli cells to 1 μl DNA, on ice.

● Leave on ice for 1530 min ● Heat shock at 42 °C for 30 sec ONLY ● Leave on ice for 2 min ● Add 450 μl LB/SOC (no antibiotics) ● Shake at 225 rpm, 37 °C, 1 hr ● Pipet 100 μl transformation reaction onto LB agar plates with appropriate antibiotic ● Incubate plates at 37 °C overnight
Test Digest ● In 1.5mL tube add: ● 1 μl of vector (pTXB1) ● .5 μl of NdeI ● .5 μl of SapI ● 1 μl of Cut Smart Buffer (from NEB) ● 7 μl of dH2O ● Incubate at 37 °C for 1 hour ● Freeze samples at 20 °C
The effect of food concentration on Physarum polycephalum Growing mold:
The dormant physarum sclerotia were initially activated by placing them on 2% agar plates with 34 oats for nourishment. After about 12 days, the molds began to spread out in search of food, and were then transferred to a larger 1% agar plate with 5% w/v (weight per volume) oat powder added (4). The mold grew on these larger cultures for about 3 days before being moved once again to plain agar plates to be starved for 1224 hours (3). The purpose of starving the molds was to give the mold time to clear any remaining undigested food in its system, which could interfere with the results of the experiment. All of these cultures were kept in the dark at 23° Celsius. Setting up mazes:
Initially, I had planned to use mazes similar to the ones used by Nakagaki et al. (1), with dead ends and narrow pathways. However, the mold was able to grow over the narrow barriers between pathways, so the mazes used in this experiment were changed to simple triangular designs with one short path and one long path between the two food sources. They were cut out of Grafix® transparency paper, sheets of polyester plastic with a coating to help printer ink stick (7). These mazes, sterilized with 91% isopropyl alcohol, were placed in petri dishes with 2% agar, and coated in Vaseline petroleum jelly, which helped contain by preventing it from growing on the plastic surface (5). The mazes were placed in petri dishes while the agar was still cooling, which created a better seal between the bottom of the maze and the surface of the agar to prevent the mold from growing underneath the plastic (7). Starved mold from the growing edge of the cultures was loaded into these dishes and allowed to grow and fill up its maze for 10 hours. When loading the mazes with mold, it was important to avoid squishing the mold into a ball, and instead to try and lift portions of the mold off of the growing surface intact, so that the mold could continue to grow as it had been previously (4).
Experimental procedure: After the molds had grown to completely fill the mazes, two 1cm x 1cm x 0.5cm blocks
of 1% agar with either 0%, 2.5%, 5%, or 10% w/v oat powder were placed in two corners of the triangle. Using blocks of oat agar allowed for more precise control over the concentration of food that using oatmeal flakes. The molds were then allowed to grow in the dark for 24 hours, and were taken out hourly to be photographed. The photographs were then binarized into black and white images using GIMP Image Manipulation Program to make the mold more visible, and the number of connections between the two food sources in each image was recorded. Use of Percentage Body Fat to Assess Body Health in Children Children from a New Jersey school had their body measurements taken. In total, 25 boys and 29 girls participated in the study. Measurements were obtained in the morning to avoid possible dehydration. One scale was used, placed on a solid floor to avoid discrepancies. Before being measured, all of the children’s ages were recorded. On May 14, 2014, each subject’s height and weight were measured. PBF was then obtained using bioelectrical impedance via an InBody machine. The results were recorded along with gender, age, height, and weight. These methods were performed again on September 14, 2014. Initial and final BMIs were calculated using the formula ((lb)/(in)2)*703. In addition, initial and final FMs and LBMs were calculated using the PBF numbers measured. Statistical analysis was performed on the data, and pvalues of 0.000 were calculated for the BMIs and PBFs of both boys and girls. Development of a Novel Protocol to Study SelfAdministration of Alcohol in Zebrafish Zebrafish maintenance: Adult wildtype zebrafish were obtained from Petsmart or Petco. All fish were raised and maintained in 3L tanks in a fish vivarium in Pingry’s biology lab adapted from Rockefeller University. The water in the system was initially treated with Top Fin® Bacteria Supplement. The water is filtered through a reservoir containing Kaldnes media, activated carbon, a cartridge filter, and a UV filter. The water is maintained at a temperature between 2327 degrees Celsius. When not being used for an experiment, fish were housed with males and females together. The zebrafish were fed a high protein diet of dried bloodworms and algae flakes when they were not being used for an experiment. The amount of food given is not measured, but excess is added to the system. They are fed five days a week, usually during weekdays, for 5 minutes. EtOH SelfAdministration: 4 adult zebrafish were divided into separate tanks (labeled AD), with fish D as the control fish. Tanks were filled with system water. Each tank was set up with 2 columns. Days 1 and 2 of the experiment were food training. About 2 large pieces of dried blood worms were inserted into both columns of each tank. Each fish was then placed in its respective tank for 25 minutes. After
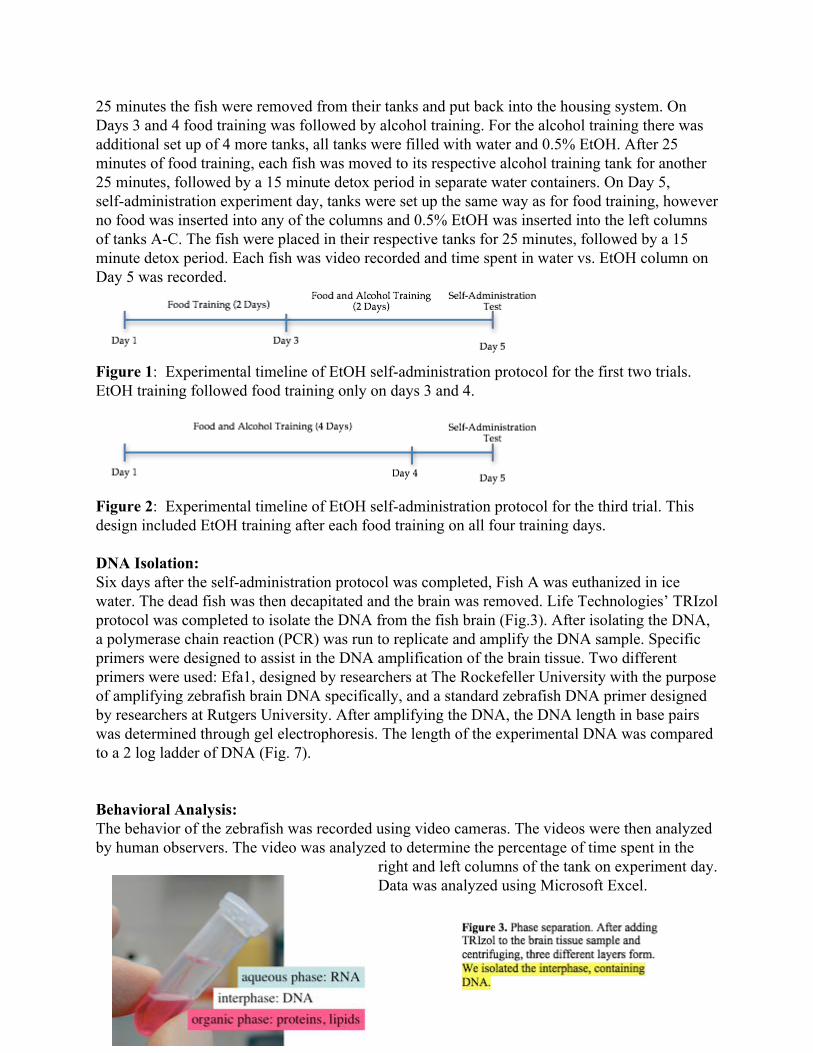
25 minutes the fish were removed from their tanks and put back into the housing system. On Days 3 and 4 food training was followed by alcohol training. For the alcohol training there was additional set up of 4 more tanks, all tanks were filled with water and 0.5% EtOH. After 25 minutes of food training, each fish was moved to its respective alcohol training tank for another 25 minutes, followed by a 15 minute detox period in separate water containers. On Day 5, selfadministration experiment day, tanks were set up the same way as for food training, however no food was inserted into any of the columns and 0.5% EtOH was inserted into the left columns of tanks AC. The fish were placed in their respective tanks for 25 minutes, followed by a 15 minute detox period. Each fish was video recorded and time spent in water vs. EtOH column on Day 5 was recorded.
Figure 1: Experimental timeline of EtOH selfadministration protocol for the first two trials. EtOH training followed food training only on days 3 and 4.
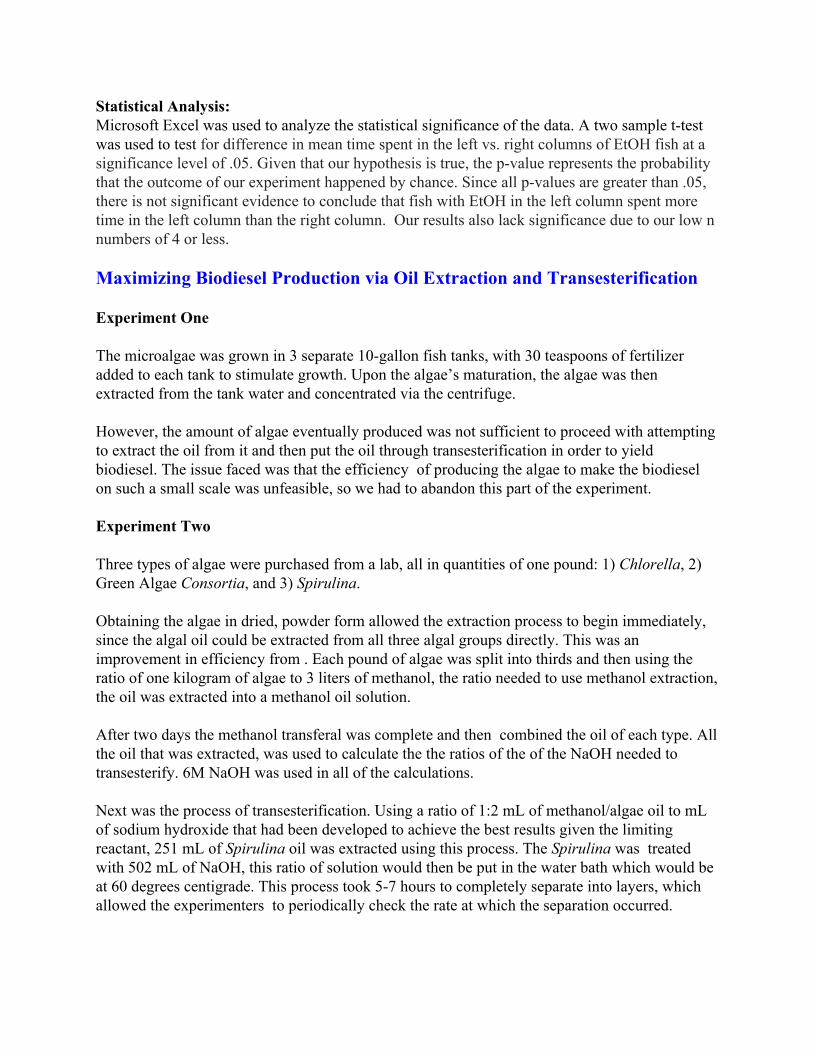
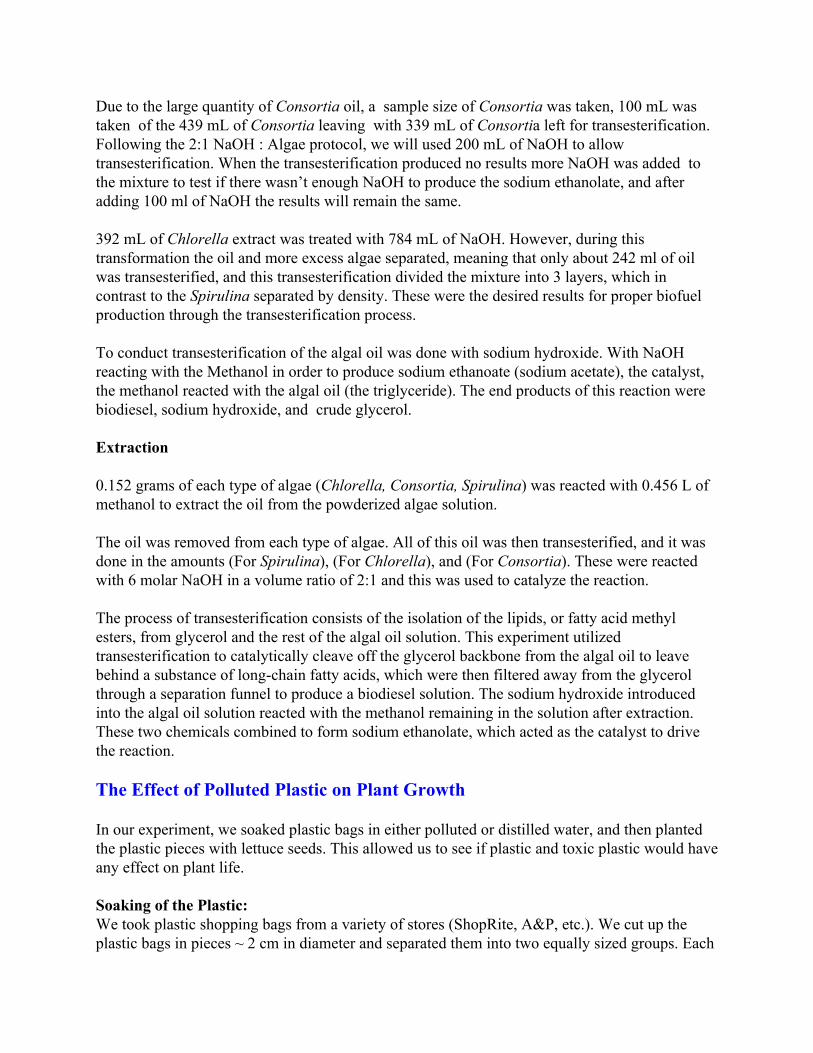
Figure 2: Experimental timeline of EtOH selfadministration protocol for the third trial. This design included EtOH training after each food training on all four training days. DNA Isolation: Six days after the selfadministration protocol was completed, Fish A was euthanized in ice water. The dead fish was then decapitated and the brain was removed. Life Technologies’ TRIzol protocol was completed to isolate the DNA from the fish brain (Fig.3). After isolating the DNA, a polymerase chain reaction (PCR) was run to replicate and amplify the DNA sample. Specific primers were designed to assist in the DNA amplification of the brain tissue. Two different primers were used: Efa1, designed by researchers at The Rockefeller University with the purpose of amplifying zebrafish brain DNA specifically, and a standard zebrafish DNA primer designed by researchers at Rutgers University. After amplifying the DNA, the DNA length in base pairs was determined through gel electrophoresis. The length of the experimental DNA was compared to a 2 log ladder of DNA (Fig. 7). Behavioral Analysis: The behavior of the zebrafish was recorded using video cameras. The videos were then analyzed by human observers. The video was analyzed to determine the percentage of time spent in the
right and left columns of the tank on experiment day. Data was analyzed using Microsoft Excel.
Statistical Analysis: Microsoft Excel was used to analyze the statistical significance of the data. A two sample ttest was used to test for difference in mean time spent in the left vs. right columns of EtOH fish at a significance level of .05. Given that our hypothesis is true, the pvalue represents the probability that the outcome of our experiment happened by chance. Since all pvalues are greater than .05, there is not significant evidence to conclude that fish with EtOH in the left column spent more time in the left column than the right column. Our results also lack significance due to our low n numbers of 4 or less. Maximizing Biodiesel Production via Oil Extraction and Transesterification Experiment One The microalgae was grown in 3 separate 10gallon fish tanks, with 30 teaspoons of fertilizer added to each tank to stimulate growth. Upon the algae’s maturation, the algae was then extracted from the tank water and concentrated via the centrifuge. However, the amount of algae eventually produced was not sufficient to proceed with attempting to extract the oil from it and then put the oil through transesterification in order to yield biodiesel. The issue faced was that the efficiency of producing the algae to make the biodiesel on such a small scale was unfeasible, so we had to abandon this part of the experiment. Experiment Two Three types of algae were purchased from a lab, all in quantities of one pound: 1) Chlorella, 2) Green Algae Consortia, and 3) Spirulina. Obtaining the algae in dried, powder form allowed the extraction process to begin immediately, since the algal oil could be extracted from all three algal groups directly. This was an improvement in efficiency from . Each pound of algae was split into thirds and then using the ratio of one kilogram of algae to 3 liters of methanol, the ratio needed to use methanol extraction, the oil was extracted into a methanol oil solution. After two days the methanol transferal was complete and then combined the oil of each type. All the oil that was extracted, was used to calculate the the ratios of the of the NaOH needed to transesterify. 6M NaOH was used in all of the calculations. Next was the process of transesterification. Using a ratio of 1:2 mL of methanol/algae oil to mL of sodium hydroxide that had been developed to achieve the best results given the limiting reactant, 251 mL of Spirulina oil was extracted using this process. The Spirulina was treated with 502 mL of NaOH, this ratio of solution would then be put in the water bath which would be at 60 degrees centigrade. This process took 57 hours to completely separate into layers, which allowed the experimenters to periodically check the rate at which the separation occurred.
Due to the large quantity of Consortia oil, a sample size of Consortia was taken, 100 mL was taken of the 439 mL of Consortia leaving with 339 mL of Consortia left for transesterification. Following the 2:1 NaOH : Algae protocol, we will used 200 mL of NaOH to allow transesterification. When the transesterification produced no results more NaOH was added to the mixture to test if there wasn’t enough NaOH to produce the sodium ethanolate, and after adding 100 ml of NaOH the results will remain the same. 392 mL of Chlorella extract was treated with 784 mL of NaOH. However, during this transformation the oil and more excess algae separated, meaning that only about 242 ml of oil was transesterified, and this transesterification divided the mixture into 3 layers, which in contrast to the Spirulina separated by density. These were the desired results for proper biofuel production through the transesterification process. To conduct transesterification of the algal oil was done with sodium hydroxide. With NaOH reacting with the Methanol in order to produce sodium ethanoate (sodium acetate), the catalyst, the methanol reacted with the algal oil (the triglyceride). The end products of this reaction were biodiesel, sodium hydroxide, and crude glycerol. Extraction 0.152 grams of each type of algae (Chlorella, Consortia, Spirulina) was reacted with 0.456 L of methanol to extract the oil from the powderized algae solution. The oil was removed from each type of algae. All of this oil was then transesterified, and it was done in the amounts (For Spirulina), (For Chlorella), and (For Consortia). These were reacted with 6 molar NaOH in a volume ratio of 2:1 and this was used to catalyze the reaction. The process of transesterification consists of the isolation of the lipids, or fatty acid methyl esters, from glycerol and the rest of the algal oil solution. This experiment utilized transesterification to catalytically cleave off the glycerol backbone from the algal oil to leave behind a substance of longchain fatty acids, which were then filtered away from the glycerol through a separation funnel to produce a biodiesel solution. The sodium hydroxide introduced into the algal oil solution reacted with the methanol remaining in the solution after extraction. These two chemicals combined to form sodium ethanolate, which acted as the catalyst to drive the reaction. The Effect of Polluted Plastic on Plant Growth In our experiment, we soaked plastic bags in either polluted or distilled water, and then planted the plastic pieces with lettuce seeds. This allowed us to see if plastic and toxic plastic would have any effect on plant life. Soaking of the Plastic: We took plastic shopping bags from a variety of stores (ShopRite, A&P, etc.). We cut up the plastic bags in pieces ~ 2 cm in diameter and separated them into two equally sized groups. Each
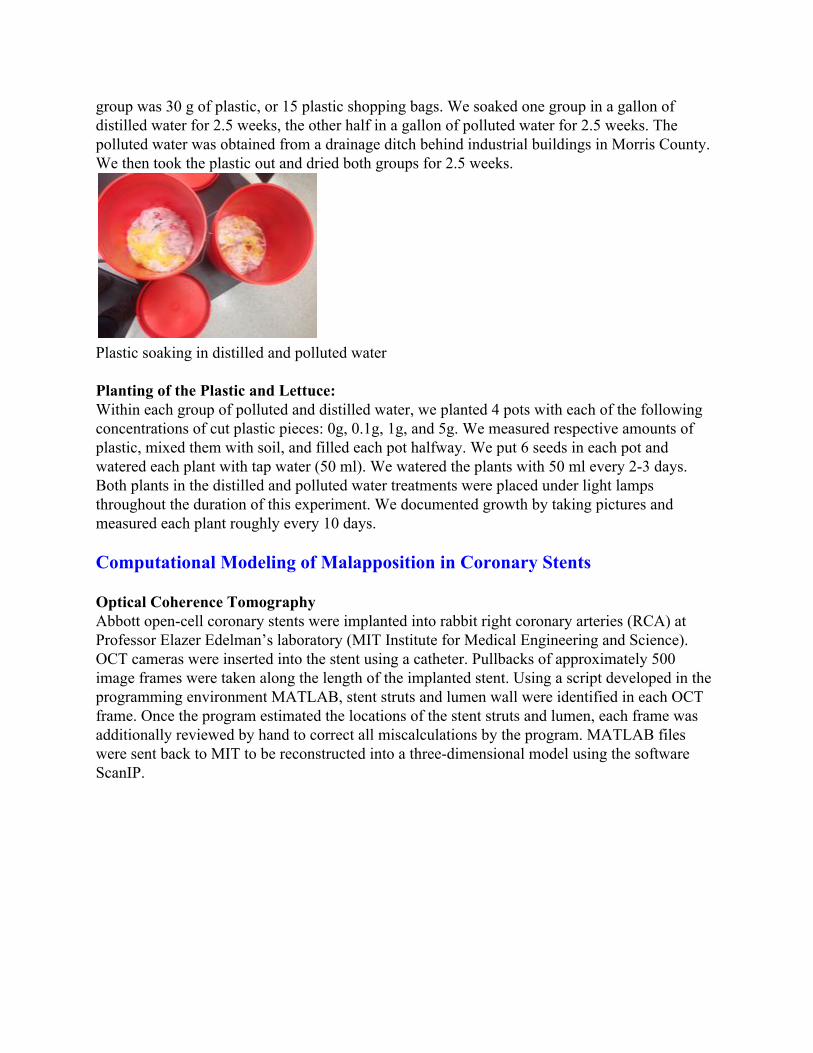
group was 30 g of plastic, or 15 plastic shopping bags. We soaked one group in a gallon of distilled water for 2.5 weeks, the other half in a gallon of polluted water for 2.5 weeks. The polluted water was obtained from a drainage ditch behind industrial buildings in Morris County. We then took the plastic out and dried both groups for 2.5 weeks.
Plastic soaking in distilled and polluted water Planting of the Plastic and Lettuce: Within each group of polluted and distilled water, we planted 4 pots with each of the following concentrations of cut plastic pieces: 0g, 0.1g, 1g, and 5g. We measured respective amounts of plastic, mixed them with soil, and filled each pot halfway. We put 6 seeds in each pot and watered each plant with tap water (50 ml). We watered the plants with 50 ml every 23 days. Both plants in the distilled and polluted water treatments were placed under light lamps throughout the duration of this experiment. We documented growth by taking pictures and measured each plant roughly every 10 days. Computational Modeling of Malapposition in Coronary Stents Optical Coherence Tomography Abbott opencell coronary stents were implanted into rabbit right coronary arteries (RCA) at Professor Elazer Edelman’s laboratory (MIT Institute for Medical Engineering and Science). OCT cameras were inserted into the stent using a catheter. Pullbacks of approximately 500 image frames were taken along the length of the implanted stent. Using a script developed in the programming environment MATLAB, stent struts and lumen wall were identified in each OCT frame. Once the program estimated the locations of the stent struts and lumen, each frame was additionally reviewed by hand to correct all miscalculations by the program. MATLAB files were sent back to MIT to be reconstructed into a threedimensional model using the software ScanIP.
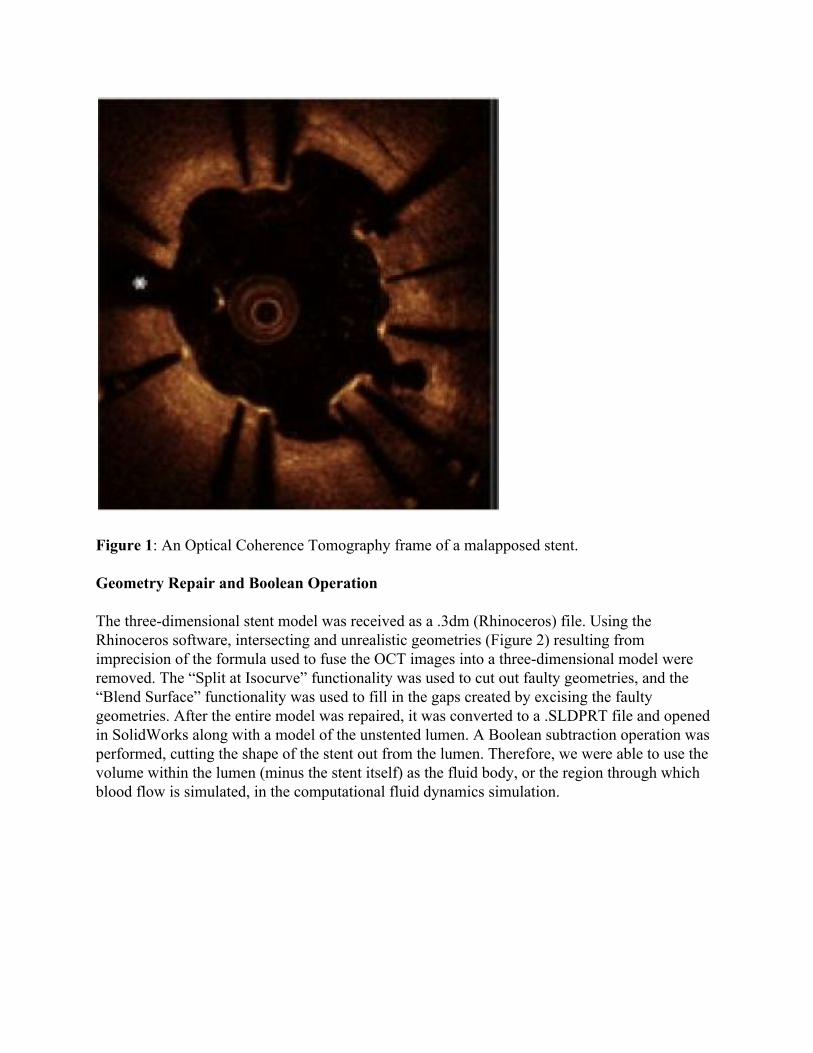
Figure 1: An Optical Coherence Tomography frame of a malapposed stent. Geometry Repair and Boolean Operation The threedimensional stent model was received as a .3dm (Rhinoceros) file. Using the Rhinoceros software, intersecting and unrealistic geometries (Figure 2) resulting from imprecision of the formula used to fuse the OCT images into a threedimensional model were removed. The “Split at Isocurve” functionality was used to cut out faulty geometries, and the “Blend Surface” functionality was used to fill in the gaps created by excising the faulty geometries. After the entire model was repaired, it was converted to a .SLDPRT file and opened in SolidWorks along with a model of the unstented lumen. A Boolean subtraction operation was performed, cutting the shape of the stent out from the lumen. Therefore, we were able to use the volume within the lumen (minus the stent itself) as the fluid body, or the region through which blood flow is simulated, in the computational fluid dynamics simulation.
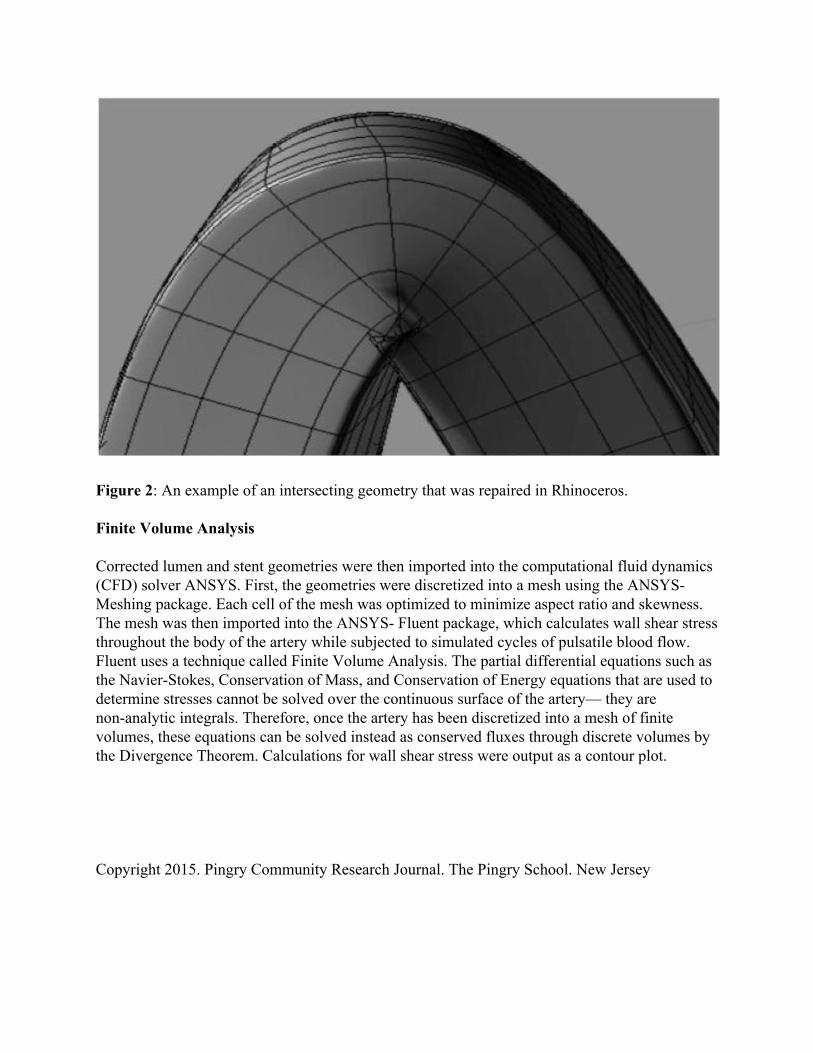
Figure 2: An example of an intersecting geometry that was repaired in Rhinoceros. Finite Volume Analysis Corrected lumen and stent geometries were then imported into the computational fluid dynamics (CFD) solver ANSYS. First, the geometries were discretized into a mesh using the ANSYS Meshing package. Each cell of the mesh was optimized to minimize aspect ratio and skewness. The mesh was then imported into the ANSYS Fluent package, which calculates wall shear stress throughout the body of the artery while subjected to simulated cycles of pulsatile blood flow. Fluent uses a technique called Finite Volume Analysis. The partial differential equations such as the NavierStokes, Conservation of Mass, and Conservation of Energy equations that are used to determine stresses cannot be solved over the continuous surface of the artery— they are nonanalytic integrals. Therefore, once the artery has been discretized into a mesh of finite volumes, these equations can be solved instead as conserved fluxes through discrete volumes by the Divergence Theorem. Calculations for wall shear stress were output as a contour plot. Copyright 2015. Pingry Community Research Journal. The Pingry School. New Jersey
