materials and design - technology ed
TRANSCRIPT

Materials and Design 45 (2013) 487–496
Contents lists available at SciVerse ScienceDirect
Materials and Design
journal homepage: www.elsevier .com/locate /matdes
Mechanical and structural behavior of a swelling elastomer undercompressive loading
Sayyad Zahid Qamar ⇑, Maaz Akhtar, Tasneem Pervez, Moosa S.M. Al-KharusiMechanical and Industrial Engineering Department, Box 33, Sultan Qaboos University, Al Khoudh 123, Oman
a r t i c l e i n f o
Article history:Received 12 July 2012Accepted 11 September 2012Available online 21 September 2012
Keywords:Swelling elastomerCompression testingBulk testingNumerical simulationMechanical responseStructural behavior
0261-3069/$ - see front matter � 2012 Elsevier Ltd. Ahttp://dx.doi.org/10.1016/j.matdes.2012.09.020
⇑ Corresponding author. Tel.: +968 24141349; fax:E-mail address: [email protected] (S.Z. Qamar).
a b s t r a c t
Swelling elastomers are a new breed of advanced polymers, and over the last two decades they havefound increasing use in drilling of difficult oil and gas wells, remediation of damaged wells, and rejuve-nation of abandoned wells. It is important to know whether an elastomer type or a certain seal design willfunction properly and reliably under a given set of oil or gas well conditions. This paper reports theresults of an experimental and numerical study conducted to analyze how compressive and bulk behav-ior of an actual oilfield elastomer changes due to swelling. Tests were carried out on ASTM-standard com-pression and bulk samples (discs) before swelling and after different swelling periods. Elastic and bulkmodulii were experimentally determined under different swelling conditions. Shear modulus and Pois-son’s ratio were estimated using derived isotropic relations. Cross-link chain density and number averagemolecular weight were obtained using predictive equations of polymer physics. Mechanical testing wasalso modeled and simulated using the nonlinear finite element package ABAQUS, material model beingOgden hyperelastic model with second strain energy potential.
Values of elastic and shear modulus dropped by more than 90% in the first few days, and then remainedalmost constant during the rest of the 1-month period. Poisson’s ratio, as expected, showed a mirrorbehavior of a sharp increase in the first few days. Bulk modulus exhibited a fluctuating pattern; rapid ini-tial decrease, then a slightly slower increase, followed by a much slower decrease. Salinity shows somenotable effect in the first 5 or 6 days, but has almost no influence in the later days. As swelling progresses,chain density decreases, much more sharply in the first week and then showing almost a steady-statebehavior. In contrast, cross-link average molecular weight increases with swelling (as expected), but ina slightly fluctuating manner. Very interestingly, Poisson’s ratio approaches the limiting value of 0.5within the first 10 days of swelling, justifying the assumption of incompressibility used in most analyticaland numerical models. In general, simulations results are in good agreement with experimental ones.Results presented here can find utility in selection of swelling elastomers suitable for a given set of fieldconditions, in improvement of elastomer-seal and swell-packer design, and in modeling and simulationof seal performance.
� 2012 Elsevier Ltd. All rights reserved.
1. Introduction
Many new and ground-breaking technologies are closely associ-ated with advances made in the area of materials science and engi-neering. Swelling elastomer, a recently developed advancedpolymer, is an apt example. Elastomers are highly elastic rubber-like materials that can stretch up to 500% of their original length[1]. Swelling elastomers swell when they interact with fluids likewater or oil [2]. Swelling results in changes in volume, thickness,density, hardness and mechanical properties [3,4]. Swelling ratefor a specific elastomer depends on the temperature and composi-tion of the swelling medium. Water-swelling elastomers swell
ll rights reserved.
+968 24141316.
through absorption of saline water following the mechanism ofosmosis, while oil-swelling elastomers swell by absorption ofhydrocarbons through a diffusion process [5]. Elastomers havelow modulus of elasticity (E) ranging from 10 MPa to 4 GPa (E-va-lue for most metals is in the 50–400 GPa range), but very highelongation reaching up to 1000% (elongation for metals is alwaysless than 100%).
Maintaining the profitability of old wells and economicallyexploiting new reservoirs (that were previously inaccessible) aretwo of the main challenges facing the oil and gas industry. Also, zo-nal isolation and optimization of the hole-size with economic pro-duction for both conventional and deep water wells are ongoingproblems [6,7]. Swelling elastomers have found extensive use inhighly sophisticated new well applications where other materialsfail to work [8]. Their successful applications include solution ofdrilling problems in deep shelf high-pressure high-temperature

Nomenclature
E Elastic/Young’s modulus (N/m2)K bulk modulus (N/m2)G shear modulus (N/m2)m Poisson’s ratior engineering stress (N/m2)e engineering strain (normal)c engineering strain (shear)s shear stress (N/m2)p hydrostatic stress (N/m2)d volume dilatation (cm3)
N chain density (mol/cm3)MC number average chain molecular weight (g/mol)k Boltzmann constant (J/K)T absolute temperature (K)n number of crosslink chainsm mass (kg)V volume (m3)q density (kg/m3)R general gas constant (J/K-mol)NA Avogadro’s number (#/mol)
Fig. 1. A body under a state of pure shear, and its Mohr circle representation.
488 S.Z. Qamar et al. / Materials and Design 45 (2013) 487–496
(HP/HT) wells [9]; use in conjunction with expandable tubulartechnology (SET) for improved well production [10,11]; watershutoff and other types of zonal isolation [12]; use in horizontalwells and in tandem with coiled tubing for better reservoir man-agement [13,14]; optimization of multizone fractured wellbores[15]; etc.
Investigation of the swelling and mechanical behavior of theseelastomers is essential in resolving application and design issues.When an elastomer seal is positioned in the well, environmentalconditions initiate the swelling and the material may continue toswell throughout its life. Swelling results in the alteration ofmechanical properties and sealing response. If elastomer sealsare put into use without thoroughly studying these changes,resulting seal failure may cause loss of time, money, and other re-sources. Rework is not only time consuming but at times not pos-sible at all. Failures may even cause the oil or gas production fromthe well to stop.
One critical aspect of good design is appropriate material selec-tion. This cannot be done without reliable knowledge of how thematerial will behave when exposed to different loads, tempera-tures, and other environmental conditions. As swelling elastomersare basically used as sealing elements in petroleum applications,and as seals are under compressive loading, investigation of themechanical behavior of elastomers under compression is veryimportant.
Contemporary elastomer seal design is usually based on labora-tory tests and trial-and-error method. To test all possible combina-tions of field parameters (elastomer material, water salinity, oiltype, temperature, pressure, etc.) in the laboratory is almostimpossible, especially for extended swelling periods. Numericalmodeling and simulation of seal design, validated by experimentalresults, may provide answers for all possible scenarios, which can-not be attempted experimentally. Numerical simulations (FEMbased, for example) can shorten the lead time for development ofrobust sealing applications in difficult or new oil and gas wells,offering an accurate and cost effective alternative to extensivetesting.
This paper discusses four key mechanical properties of swellingelastomers (elastic modulus E, bulk modulus K, shear modulus G,and Poisson’s ratio m) and two polymer characteristics (cross-linkchain density N, and average molecular weight MC) needed for de-sign improvement and performance analysis of elastomer seals.These parameters were experimentally determined for an elasto-mer being currently used by the petroleum industry, before andafter various stages of swelling. To strengthen the experimentalresults, compression and bulk tests were also simulated using acommercial FEM package. After rigorous evaluation, the mostappropriate hyperelastic material model (currently available inFEM packages) was used for these simulations. Simulation resultsare generally in good agreement with experimental values.
2. Theoretical background
As mentioned above, the paper discusses the effect of swellingon four mechanical properties that describe the macroscopic-levelbehavior of the elastomer, and on two microscopic-level character-istics that are related to polymer structure. Brief theoretical back-ground and inter-relationships of these quantities are presented inthis section.
2.1. Macroscopic behavior: isotropic relationships
Once the values of E and K are established experimentally, shearmodulus (G) and Poisson’s ratio (m) can be determined using theisotropic relations derived below. The elastic behavior of any iso-tropic material is completely described by Hooke’s law [16]:
ex ¼1E½rx � mðry þ rzÞ�; ey ¼
1E½ry � mðrz þ rxÞ�;
ez ¼1E½rx � mðrz þ ryÞ�;
ð1Þ
where r is the engineering stress and e is the strain. Being in theelastic region, engineering shear strain (c) is obviously proportionalto shear stress (s):
cyz ¼1Gsyz; czx ¼
1Gszx; cxy ¼
1Gsxy: ð2Þ
Fig. 1 shows a body under a state of pure shear and its Mohr cir-cle representation giving the principal stresses:
r1 ¼ sxy r2 ¼ �sxy r3 ¼ 0 s12 ¼ 0: ð3Þ
We can use Eq. (1) (Hooke’s law) to find the principal strains:
e1 ¼sxyð1þ mÞ
E; e2 ¼
sxyð1þ mÞE
: ð4Þ
Shear strain cxy can also be expressed in terms of the principalstrains:
cxy ¼ e1 � e2 ¼2sxyð1þ mÞ
E: ð5Þ

S.Z. Qamar et al. / Materials and Design 45 (2013) 487–496 489
Comparing Eqs. (2) and (5), shear modulus becomes
G ¼ E2ð1þ mÞ : ð6Þ
For determination of bulk modulus (K), we need to consider thevolume dilatation (volumetric strain) d ¼ DV=V and the hydro-static stress �p ¼ 1
3 ðrx þ ry þ rzÞ, giving
d ¼ �pK: ð7Þ
For a body undergoing linear strains, it can be easily shown that
dVV¼ dex þ dey þ dez: ð8Þ
This in turn yields
d ¼ ex þ ey þ ez: ð9Þ
Comparing this result with Eq. (1), and simplifying, we get
d ¼ 1� 2mE
� �ðrx þ ry þ rzÞ: ð10Þ
Recalling the definition of hydrostatic pressure p, and compar-ing with Eq. (7), we obtain the relationship between bulk modulusand Poisson’s ratio
K ¼ E3ð1� 2mÞ : ð11Þ
Eqs. (6) and (11) have been used in this work to find the valuesof shear modulus and Poisson’s ratio for the elastomeric materialunder study.
2.2. Structural behavior
2.2.1. Chain densityFor any rubber-like material, network strands are formed both by
cross-linking and molecular entanglement. As the degree of cross-linking increases, the cross-link chain density increases, makingthe elastomer more rigid, ultimately giving higher values of stiffnessand shear modulus G [17]. Chain density can therefore be used as ameasure of the swelling capability of an elastomer. For elastomerssubjected to small strains, shear modulus is directly related to thenumber of cross-link chains per unit volume (chain density) N:
G ¼ NkT; ð12Þ
where k is the Boltzmann’s constant, and T is the temperature inKelvin.
2.2.2. Number average chain molecular weightLength of the network chains decreases due to an increase in
the degree of cross-linking. In any polymer, chain density is closelyrelated to the average molecular weight, and this property can alsobe used to explain the mechanics of swelling [18]. Multiplying anddividing Eq. (12) by Avogadro’s number NA, and recalling thatR = NAk, we can obtain
G ¼ NRT=NA; ð13Þ
If n is the number of chains, Avogadro’s number can also be writtenas
NA ¼ nMC=m: ð14Þ
Combining the definition of chain density (N = n/V) with Eq. (14)yields
N=NA ¼ q=MC : ð15Þ
Comparing this result with Eq. (13), we get the expression forthe number average chain molecular weight
MC ¼ qRT=G: ð16Þ
Once the values of shear modulus G are determined experimen-tally, these structural properties of the elastomer (N and MC) can beeasily evaluated using Eqs. (12) and (16) and their behavior due toswelling can be studied.
3. Experimental work
3.1. Swelling test
To replicate actual field conditions in many regional oil wells,samples of a water-swelling elastomer (used in various petroleumdevelopment applications) were subjected to swelling in salinewater of 0.6% (6.000 ppm) and 12% (120,000 ppm) concentrationmaintained at a temperature of 50 �C. To investigate the effect ofswelling, samples were taken out for mechanical testing after 1,2, 4, 7, 10, 16, 23, and 30 days of swelling. The elastomer was afast-swell type, so readings were initially taken after almost eachday, and later on a weekly basis. Density is calculated from massand volume measurements of each sample.
3.2. Mechanical testing
Two types of experiments have been performed to determinerelevant material parameters: compression tests for Young’s mod-ulus (E), and bulk tests for bulk modulus (K). Compression and bulktests are performed on elastomer samples before swelling, and arerepeated after various stages of swelling over the 1-month test per-iod. As elastomers in all sealing applications are under compres-sion, Young’s modulus determined through compression testingis the more relevant parameter, therefore behavior under tensileloading has not been studied.
Various researchers have investigated the behavior of rubber-like materials under compression [19], but not for swelling elasto-mers. For this study, ASTM standard test method (ASTM: D575) isfollowed during compression testing. As no standard is availablefor bulk testing of elastomers, a special test rig is used for bulkexperiments, designed and fabricated in-house. Both compressionand bulk tests use disc samples. As discs undergo significant vol-ume change due to swelling, specimen dimensions are reworked(trimmed) prior to mechanical testing in order to match the ASTMstandard. To ensure repeatability and consistency, all reported val-ues are average of readings from three samples.
3.3. Sample preparation
Disc samples were cut using a die-and-punch set, with somesurface grinding needed for final trimming. As prescribed by ASTM:D575, disc dimensions for compression testing are 28.6 mm diam-eter and 12.5 mm thickness. Due to reasons of confidentiality, ac-tual identification number of swelling-elastomer material is notmentioned.
3.4. Compression testing
Compression tests are performed on a Tinius Olsen universaltesting machine in the compression mode, using a 50-kN load cell;Fig. 2. Disc specimen is placed on a fixed bottom plate while thetop plate applies a compressive load on the specimen. Elastomersample is free to expand in the radial direction. Top surface ofthe disc moves downward with the compression load, while bot-tom surface is not allowed to move in the axial direction. Load isapplied at a rate of 12 mm/min (ASTM: D575) until the specimenthickness is compressed to 10 mm. Force–deformation and

Fig. 2. Experimental setup for compression testing.
Fig. 3. Designed and fabricated test rig for bulk experiments.
490 S.Z. Qamar et al. / Materials and Design 45 (2013) 487–496
stress–strain data are recorded. A small barreling effect can be ob-served in the compressed sample.
3.5. Bulk testing
The test rig that was designed and fabricated in-house for bulktesting is shown in Fig. 3. The rig is designed in such a way that un-der compressive loading the specimen is constrained to move onlyin the axial direction (no radial expansion allowed). To match withcompression testing, load is applied at the rate of 12 mm/min untilthe specimen fails. Force–deformation results are recorded and la-ter converted into pressure–volumetric strain data.
3.6. Numerical investigation
FEM-based numerical simulation has been done to lendstrength to experimental results. Just as in experiments, simula-tions are run before swelling and after every swelling period. Thecommercial finite element package ABAQUS is used for all model-ing and simulation work. Swelling elastomer specimen is modeledusing 8-noded linear brick element with reduced integration(C3D8R). As mentioned above, Ogden hyper-elastic material model[20] with second strain energy potential is used for all simulationssince it gives the closest results [21]. Coefficients for the materialmodel are extracted (internally by the software) for all simulationsfrom the experimental stress–strain data and values of Poisson’sratio and density.
3.7. Simulation of compression test
ASTM standard disc geometry is modeled for simulation of com-pression tests. Deformed and undeformed geometry is shown in
Fig. 4. Same compressive loads and boundary conditions are ap-plied as in the experiments. Simulations are conducted beforeswelling and after each swelling period (total 1 month period) un-der both salinity conditions. For each simulation, material proper-ties are extracted from the experimental results. Stress–straincurves are plotted based on the simulation results.
3.8. Simulation of bulk test
Same sample geometry is modeled as in compression simula-tions, but the boundary conditions are different for simulation ofbulk behavior. Disc is still under compression but restricted frommovement in any direction. Only the top surface can move down-ward (z-axis) under the compressive load; Fig. 5. Same number ofsimulations is run as in the case of compression, for both the salin-ities. Simulation results are used to plot graphs of pressure againstvolumetric strain.
4. Results and discussion
All reported values from experimental work are average ofreadings taken from three samples. Stress–strain graphs are plot-ted for each of the compression tests. A 3-sample graph for onecase (0.6% salinity, 30 days of swelling) is shown in Fig. 6. As dis-cussed by Gent [17], only the initial 10% data from a stress–straincurve should be used to determine the Young’s modulus for rub-ber-like materials. This small-strain approach has been followedin this work, guaranteeing the best straight-line fit, giving a maxi-mum variation of 8% from the true modulus. Bulk modulus isdetermined by fitting a straight line to the linear portion of thepressure vs volumetric strain curve. A 3-sample graph is shownin Fig. 7 for elastomer exposed to 12% salinity, after 23 days ofswelling. Regression for both elastic and bulk moduli shows agoodness of fit of more than 99%. Sample density is determinedfrom mass and volume readings. Shear modulus and Poisson’s ratioare calculated from experimental values of elastic and bulk modu-lus using isotropic relations for elastic materials (Eqs. (6) and (11)).Chain density and average molecular weight are determinedthrough polymer structure relations (Eqs. (12) and (16)).
4.1. Effect of swelling on material behavior
Stress–strain graphs under compression (Fig. 6) exhibit signifi-cant non-linear behavior (as expected for elastomers). Samples oflinear curve fitting to stress–strain data (first 10% of the data only,as explained above) and linear portion of bulk data are shown inFigs. 8 and 9 for extraction of the elastic and bulk modulii, respec-tively. A very high goodness of fit of 99.7% is quite reassuring.Fig. 10 shows stress–strain behavior before swelling and after 1,

Fig. 4. Finite element model of compression test specimen; undeformed and deformed states.
Fig. 5. Finite element model of bulk test specimen; undeformed and deformed states.
Fig. 6. Three-sample stress–strain curves for compression experiment; 0.6%salinity; 30 days of swelling.
Fig. 7. Three-sample pressure–strain (volumetric) curves for bulk test; 12% salinity;23 days of swelling.
Fig. 8. Linear curve fitting to experimental stress–strain data; 12% salinity; 2 daysof swelling.
Fig. 9. Linear curve fitting to experimental data of pressure vs volumetric strain;12% salinity; 7 days of swelling.
S.Z. Qamar et al. / Materials and Design 45 (2013) 487–496 491

Fig. 10. Stress–strain behavior before swelling and after 1, 7, and 30 days ofswelling.
Fig. 11. Pressure vs volumetric–strain behavior before swelling and after 7 and30 days of swelling.
Fig. 13. Pressure–volumetric strain behavior for the two salinities after 1-day and30-days of swelling.
Fig. 14. Experimental and numerical results for Young’s modulus under bothsalinities for the full 30-day test period.
492 S.Z. Qamar et al. / Materials and Design 45 (2013) 487–496
7 and 30 days of swelling. It can be easily observed that compres-sive stress values decrease sharply after 1 day of swelling, and alittle less noticeably at the end of the first week (day-7). After thatthere is hardly any change for the rest of the 1-month swelling per-iod. Similarly, Fig. 11 shows the variation of pressure against volu-metric strain (volume dilatation) before swelling and after specificswelling times. We again observe a sharper decrease in the earlydays, and a much slower variation in the later stages of swelling.This behavior is due to the fast-swell nature of this elastomer type
Fig. 12. Stress–strain behavior for the two salinities after 1-day and 30-days ofswelling.
(swelling rate very high in the first few days, then slowing downgradually). Engineering the elastomer in this way is intended toprovide good sealing early on in petroleum development applica-tions, so that the rig can go into production quickly. Higher amountof swelling makes the elastomer softer, resulting in large strains atmuch lower loads, thus the trend [2].
Figs. 12 and 13 illustrate stress–strain and pressure–volumetricstrain behavior for the two salinities after 1-day and 30-days ofswelling. It can be seen that stress (or pressure) values are higherfor 12% salinity as compared to 0.6% (though only marginally),but become almost identical with more swelling. As expected, itis a consistent observation that these elastomers swell more whenexposed to lower-salinity brine, since more concentrated solutionswould not swell the elastomer as much as the diluted solutions,whether swelling happens due to diffusion or due to osmosis [4].Under 12% salinity elastomer swells by a lesser amount, and theharder samples need larger stress to deform and fracture. Withlonger swelling period, amount of swelling under both salinitiesbecomes roughly the same, thus the samples break at near-identi-cal loads.
The following graphs show both experimental and simulationresults for the full 30-day test period for different materialparameters.
4.2. Variation of elastic modulus
As shown in Fig. 14, value of Young’s modulus drops by morethan 90% in the first few days, and then remains nearly constant
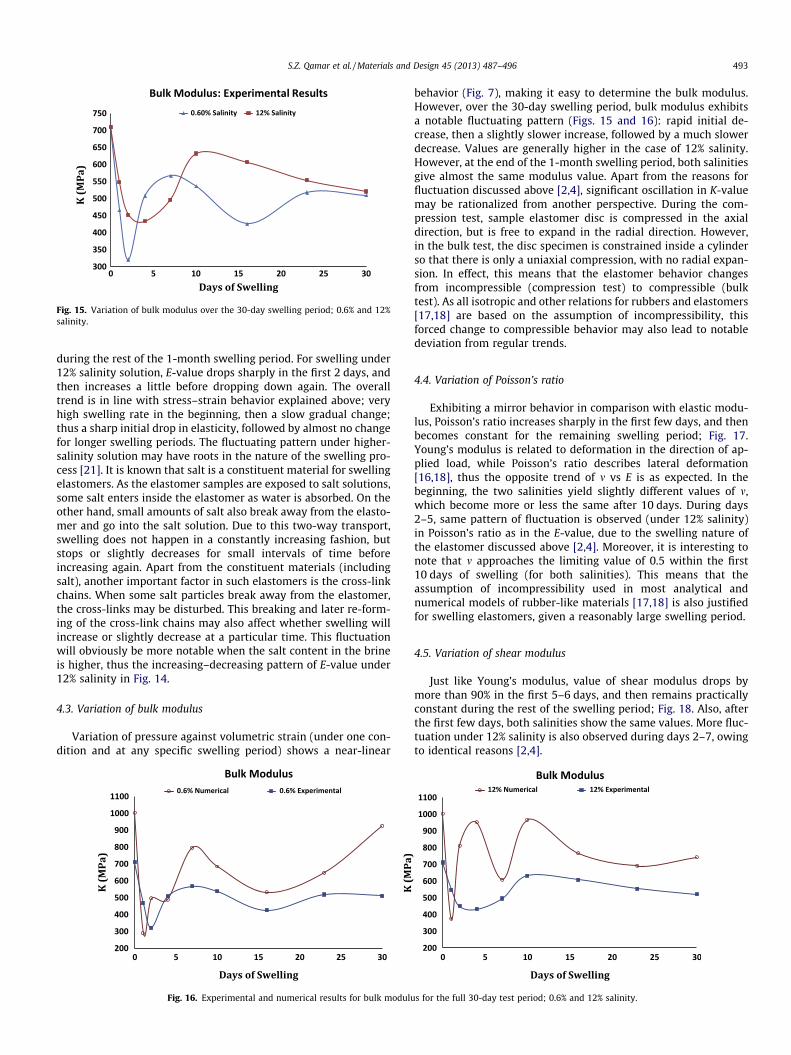
Fig. 15. Variation of bulk modulus over the 30-day swelling period; 0.6% and 12%salinity.
S.Z. Qamar et al. / Materials and Design 45 (2013) 487–496 493
during the rest of the 1-month swelling period. For swelling under12% salinity solution, E-value drops sharply in the first 2 days, andthen increases a little before dropping down again. The overalltrend is in line with stress–strain behavior explained above; veryhigh swelling rate in the beginning, then a slow gradual change;thus a sharp initial drop in elasticity, followed by almost no changefor longer swelling periods. The fluctuating pattern under higher-salinity solution may have roots in the nature of the swelling pro-cess [21]. It is known that salt is a constituent material for swellingelastomers. As the elastomer samples are exposed to salt solutions,some salt enters inside the elastomer as water is absorbed. On theother hand, small amounts of salt also break away from the elasto-mer and go into the salt solution. Due to this two-way transport,swelling does not happen in a constantly increasing fashion, butstops or slightly decreases for small intervals of time beforeincreasing again. Apart from the constituent materials (includingsalt), another important factor in such elastomers is the cross-linkchains. When some salt particles break away from the elastomer,the cross-links may be disturbed. This breaking and later re-form-ing of the cross-link chains may also affect whether swelling willincrease or slightly decrease at a particular time. This fluctuationwill obviously be more notable when the salt content in the brineis higher, thus the increasing–decreasing pattern of E-value under12% salinity in Fig. 14.
4.3. Variation of bulk modulus
Variation of pressure against volumetric strain (under one con-dition and at any specific swelling period) shows a near-linear
Fig. 16. Experimental and numerical results for bulk modulu
behavior (Fig. 7), making it easy to determine the bulk modulus.However, over the 30-day swelling period, bulk modulus exhibitsa notable fluctuating pattern (Figs. 15 and 16): rapid initial de-crease, then a slightly slower increase, followed by a much slowerdecrease. Values are generally higher in the case of 12% salinity.However, at the end of the 1-month swelling period, both salinitiesgive almost the same modulus value. Apart from the reasons forfluctuation discussed above [2,4], significant oscillation in K-valuemay be rationalized from another perspective. During the com-pression test, sample elastomer disc is compressed in the axialdirection, but is free to expand in the radial direction. However,in the bulk test, the disc specimen is constrained inside a cylinderso that there is only a uniaxial compression, with no radial expan-sion. In effect, this means that the elastomer behavior changesfrom incompressible (compression test) to compressible (bulktest). As all isotropic and other relations for rubbers and elastomers[17,18] are based on the assumption of incompressibility, thisforced change to compressible behavior may also lead to notabledeviation from regular trends.
4.4. Variation of Poisson’s ratio
Exhibiting a mirror behavior in comparison with elastic modu-lus, Poisson’s ratio increases sharply in the first few days, and thenbecomes constant for the remaining swelling period; Fig. 17.Young’s modulus is related to deformation in the direction of ap-plied load, while Poisson’s ratio describes lateral deformation[16,18], thus the opposite trend of m vs E is as expected. In thebeginning, the two salinities yield slightly different values of m,which become more or less the same after 10 days. During days2–5, same pattern of fluctuation is observed (under 12% salinity)in Poisson’s ratio as in the E-value, due to the swelling nature ofthe elastomer discussed above [2,4]. Moreover, it is interesting tonote that m approaches the limiting value of 0.5 within the first10 days of swelling (for both salinities). This means that theassumption of incompressibility used in most analytical andnumerical models of rubber-like materials [17,18] is also justifiedfor swelling elastomers, given a reasonably large swelling period.
4.5. Variation of shear modulus
Just like Young’s modulus, value of shear modulus drops bymore than 90% in the first 5–6 days, and then remains practicallyconstant during the rest of the swelling period; Fig. 18. Also, afterthe first few days, both salinities show the same values. More fluc-tuation under 12% salinity is also observed during days 2–7, owingto identical reasons [2,4].
s for the full 30-day test period; 0.6% and 12% salinity.

Fig. 17. Experimental and numerical results for Poisson’s ratio under both salinitiesfor the full 30-day test period.
Fig. 18. Experimental and numerical results for shear modulus under bothsalinities for the full 30-day test period.
Fig. 19. Variation of chain density against swelling period under both salinities.
Fig. 20. Variation of average molecular weight against swelling period under bothsalinities.
494 S.Z. Qamar et al. / Materials and Design 45 (2013) 487–496
4.6. Variation of chain density
Variation in cross-link chain density (N) against amount ofswelling (swelling period) is plotted in Fig. 19. Chain density dropsdrastically during the first few days, and then becomes nearly stea-dy state. During days 2–7, N is higher for higher-salinity (12%)solution, otherwise response under both salinities is almost the
same. As explained above, decrease in number of chains or cross-linking density (occurring here due to swelling) will make the elas-tomer softer [2,4,21], thereby contributing to a decrease in stiff-ness, elastic modulus, and rigidity (shear modulus). This changein polymer structure due to swelling is a direct explanation ofthe variation pattern observed in the mechanical properties.
4.7. Variation of number-average chain molecular weight
Fig. 20 shows the variation in number-average chain molecularweight (MC) against swelling time over the 30-day test period. Thisaverage molecular weight of cross-link chains shows an overallincreasing behavior with higher swelling amount, but with a some-what fluctuating pattern; a much sharper increase in the first tendays or so, and then a slightly slower increase. It can be clearlyseen from Eqs. (12) and (16) [17,18] that N and MC are inversely re-lated, so an increase of average molecular weight with swelling asagainst a corresponding decrease in chain density should be ex-pected. As for fluctuation, the various reasons discussed above(including two-way transport of salt, forming and breaking ofcross-link chains, etc.) are equally applicable in explanation ofthe observed variation in average molecular weight [2,4].
4.8. Comparison of experimental and numerical results
Overall there is very good agreement between experimentaland simulation results. Stress–strain plots in the 10% strain regionfor experimental and numerical results of the compression test forone case (12% salinity, 23 days of swelling) are shown in Fig. 21,verifying the close conformity between test and simulation results.
Over the 30-day swelling period Young’s modulus, Poisson’s ra-tio, and shear modulus show almost perfect match between exper-imental and simulation results; Figs. 14, 17 and 18, respectively).There are minor differences between numerical and experimentalvalues in the first few days, especially in the case of higher salinity(12%), but the results become identical upon further swelling.
Comparison between experimental and numerical results forbulk properties test for one case (0.6% salinity, 4 days of swelling)is given in Fig. 22. Numerical results are slightly higher than exper-imental ones (leading to slightly more conservative seal design),but the difference is reasonably small and the trend is the same.Over the entire 30-day swelling period (Fig. 16), there is a notice-able difference between simulation and experimental curves,though the trends are almost similar. As discussed above, reasonsmay include salt transport, cross-link alterations [2,4,21], orchange from near-incompressible to compressible behavior.

Fig. 21. Experimental and numerical stress–strain results; 12% salinity; 23 days ofswelling.
Fig. 22. Experimental and numerical pressure-strain (volumetric) results; 0.6%salinity; 4 days of swelling.
S.Z. Qamar et al. / Materials and Design 45 (2013) 487–496 495
5. Conclusions
Experimental and numerical investigation of changes in com-pressive and bulk behavior of a water-swelling elastomer has beencarried out. Major changes in both mechanical and structural prop-erties are observed within the first two days of swelling under bothsalinities, agreeing well with the fast-swell nature of the elastomer.Young’s and shear modulii drop to about 10% of their original valuein the first week, and then show almost no variation during theremaining swelling period. Poisson’s ratio exhibits the oppositetrend of a sharp increase in the first few days, and then becomingalmost constant with further swelling. Bulk modulus shows a fluc-tuating pattern, but decreases overall with swelling: relativelylarge initial decrease, then a somewhat slower increase, and thena much slower decrease to a nearly constant value. Salinity has al-most no influence on material properties after the first week. Afterthe first 10 days of swelling, Poisson’s ratio approaches the limitingvalue of 0.5, providing a good justification for the assumption ofincompressibility used in analytical and numerical models for rub-ber-like materials. Chain density decreases with swelling, sharplyin the first week, and then showing almost no change. As expected,cross-link average molecular weight shows the opposite trend ofan increase with swelling, but in a slightly fluctuating manner.
Salt is one of the constituents of any swelling elastomer. Whenexposed to saline water, some salt can enter into the elastomermaterial (together with absorbed water), while some salt can breakaway from the elastomer and go into the salt solution. Rather than
a consistent increase, this two-way salt transport cause slight fluc-tuations in the amount of swelling. Another important factor inswelling of such elastomers is the density of cross-link chains. Saltaddition and breakaway can produce breaking and later re-formingof cross-link chains, causing increase or decrease of swelling at aparticular time. As both these mechanisms are dependent on salttransport, fluctuation is more significant in higher concentrationbrine. After some time, a sort of equilibrium is reached, inflowand outflow of salt almost balancing out, and swelling starts toshow a near steady-state behavior. Slight fluctuations during thefirst week of swelling in the values of material and structural prop-erties studied are due to this two-pronged variation in swellingamount. Compared to bulk tests, fluctuation is almost insignificantin compression tests due to the simple uniaxial nature of the loadapplied.
In general, simulation results are in good agreement withexperimental ones, reinforcing the tests conducted. As testingcan be costly and time-consuming, simulated values of materialproperties can be used for a wider range of field conditions, etc.As significant variation in material properties occurs only in thefirst 10 days, these values can serve as reasonable design proper-ties for future applications, removing the need for material testingbeyond 10 days of swelling. The knowledge of mechanical andstructural behavior of swelling elastomer gained from this investi-gation can be used by oilfield engineers for selection of appropriateswelling elastomers for a given set of conditions, by developmentengineers to improve swell packer design, and by researchers tomodel and simulate elastomer seal performance.
Acknowledgments
The authors acknowledge the support of Sultan Qaboos Univer-sity (SQU) and Petroleum Development Oman (PDO) for this work.
References
[1] Findik F, Yilmaz R, Köksal T. Investigation of mechanical and physicalproperties of several industrial rubbers. Mater Des 2004;25(4):269–76.
[2] Qamar SZ, Pervez T, Akhtar M, Al-Kharusi MSM. Design and manufacture ofswell packers: influence of material behavior. Mater Manuf Processes2012;27(7):721–6.
[3] Pervez T, Qamar SZ, van de Velden M. Comparison between fresh and exposedswelling elastomer. J Elastomers Plast 2012;44(3):237–50.
[4] Qamar SZ, Al-Hiddabi SA, Pervez T, Marketz F. Mechanical testing andcharacterization of a swelling elastomer. J Elastomers Plast2009;41(5):415–31.
[5] Herold BH, Edwards JE, Kulich RV, Froehlich B, Marketz F, Welling RWF,Leuranguer C. Evaluating expandable tubular zonal and swelling elastomerisolation using wireline ultrasonic measurements. In: IADC/SPE Asia PacificDrilling Technology Conference and Exhibition. Bangkok, Thailand; 2006.
[6] Kumar N, Marker R, Rune C, Erik GR, Statoil ASA. Mono diameter expandabledrilling liner applications in deepwater drilling. In: SPE/IADC DrillingConference and Exhibition, Paper # SPE/IADC 128175. Amsterdam,Netherlands; 2010.
[7] Campo D, Charlie W, Filippov A, Lance C, David B, Bill D, Lev R. Mono-diameterdrill liner-from concept to reality. In: SPE/IADC Drilling Conference, Paper #SPE/IADC 79790. Amsterdam; 2003.
[8] Young I, Austin E, Tunde A, Adedeji O, Philip O. All-in-one concept withexpandable tubular and swellable elastomer technology: a systems approachto well design. In: SPE Annual Technical Conference and Exhibition, Paper #SPE 124591. Louisiana, USA; 2009.
[9] Jay N, Sarah F, Kristaq M. Power of design: solid expandable installation setsmultiple new records in deep shelf HP/HT well. In: IADC/SPE DrillingConference, Paper # SPE/IADC 128366. Louisiana, USA; 2010.
[10] Doug G, Neven R. Expandable tubular facilitate improved well simulation andwell production. In: SPE Western Regional Meeting, Paper # SPE 121147.California, USA; 2009.
[11] Robert D, Jerry F, Greg N. Combined technologies offer time-saving andefficient alternatives for zonal isolation. In: SPE Annual Technical Conferenceand Exhibition, Paper # SPE 125701. Bahrain; 2009.
[12] Al-Saiid KA, Abdalla E, Cherif M, Elliot SP. Practical uses of swellable packertechnology to reduce water cut: case studies from the Middle East and otherareas. Offshore Europe, Paper # 108613-MS. SPE Aberdeen, Scotland, UK; 2007.

496 S.Z. Qamar et al. / Materials and Design 45 (2013) 487–496
[13] Thomas BR. Merging coiled tubing and swellable packer technologies. In: SPE/ICoTA Coiled Tubing & Well Intervention Conference and Exhibition, Paper #SPE 143037-MS. The Woodlands, Texas, USA; 2011.
[14] Al-Mahrooqi MA, Franz M, Ghaliba H, Improved well and reservoirmanagement in horizontal wells using swelling elastomers. In: SPE AnnualTechnical Conference and Exhibition, Paper # SPE 107882-MS. Anaheim,California, USA; 2007.
[15] Glenn DD. Integrating solid expandables, swellables, and hydra jet perforatingfor optimized multizone fractured wellbores. In: SPE Tight Gas CompletionsConference, Paper # SPE 125345-MS. San Antonio, Texas, USA; 2009.
[16] Hosford WF. Mechanical behavior of materials. Cambridge, UnitedKingdom: Cambridge University Press; 2005.
[17] Gent AN. Engineering with rubbers: how to design rubbercomponents. Munich, Germany: Carl Hanser Verlag Publishers; 2012.
[18] Treloar LRG. The physics of rubber elasticity. Oxford: Oxford University Press;2005.
[19] Ronan S, Alshuth T, Jerrams S. Long-term stress relaxation prediction forelastomers using the time–temperature superposition method. Mater Des2007;26(5):1513–23.
[20] Aidy A, Hosseini M, Sahari BB. A review of constitutive models for rubber-likematerials. Am J Eng Appl Sci 2010;3(1):232–9.
[21] Akhtar M, Qamar SZ, Pervez T, Khan R, Al-Kharusi MSM. Elastomer seals in coldexpansion of petroleum tubulars: comparison of material models. MaterManuf Processes 2012;27(7):715–20.