materi tugas 5 (velocity and acceleration)
DESCRIPTION
Materi Tugas 5 (Velocity and Acceleration)TRANSCRIPT

205: Theory of Vibration Measurement
Peter H. SydenhamGSEC Pty Ltd, Adelaide, South Australia, Australia
1 Definition of Vibration 1391
2 Physical Features of Vibration 1391
3 Mathematical Description 1394
4 Amplitude and Frequency of Vibration 1394
5 Importance of Damping 1395
6 Application to Vibration Measurement 1396
7 Data Processing 1396
8 The Literature on Vibration 1397
Related Articles 1397
References 1397
1 DEFINITION OF VIBRATION
Vibration here is the oscillatory mechanical motion of anobject. It is a dynamic state. Several other measurableparameters fit under the term vibration.
• Relative position• Velocity• Acceleration• Jerk (the derivative of acceleration)• Dynamic force.
For each parameter it may be the instantaneous value,average value, or some other descriptor that is needed.
Vibration, in the general sense, occurs as a periodicoscillation, a random movement, or as a transient motion,the latter more normally being referred to as shock whenthe transient is large in amplitude and brief in duration.
2 PHYSICAL FEATURES OF VIBRATION
Vibration can occur in linear or rotational forms of motion,the two being termed translational or torsional vibrationsrespectively. In many ways, the basic understanding ofeach is similar because a rotational system also concernsdisplacements in space. Translational forms are outlined inthe following description. An equivalent rotational systemusually exists for all arrangements described.
In vibration measurement, it is important to decidewhether a mechanical sensor can be physically attachedto the test object – called a contacting or intrusive method.
If mass cannot be added, then a noncontacting techniqueis necessary.
Detailed measurement of vibration can be a most com-plex measuring task. The basic requirement is to determinefeatures of the motion of a point, or more practically anextended object in a three-dimensional space relative to areference framework; see Figure 1.
A point in space has three degrees of freedom. It cantranslate in one or more of the three directions whenreferred to the x, y, z Cartesian coordinate system shown.Rotation has no meaning for a purely point measure-ment. To monitor free motion of a theoretical point objectthree measurement-sensing channels are required to cap-ture all three motions so that the vector of direction can bereconstructed.
If the object of interest has significant physical size, itmust be treated as an extended object in which the rotationsabout each of the three axes described above provide afurther three rotational degrees of freedom. Thus, to monitorthe free motion of a realistic object we may need up to sixsensor channels, one for each degree of freedom. Thesemay be built into a single sensor housing and processed togive absolute values.
Handbook of Measuring System Design, edited by Peter H. Sydenham and Richard Thorn. 2005 John Wiley & Sons, Ltd. ISBN: 0-470-02143-8.

1392 Common Measurands
−y
+z
−z
+x
−x+y
Object atcenter of Cartesiancoordinateframework
Translationcomponents
Rotationalcomponents
xyza
a
f
f
q
q
0
Figure 1. Possible motions of an extended object in space rela-tive to a Cartesian framework.
In practice, some degrees of freedom can be nominallyconstrained (but are they really?) possibly eliminating the
need for some of the six sensor channels. Practical installa-tion should always contain a test that evaluates the degreeof actual constraint possible because vibration sensors willusually produce some level of output for the directions ofvibration they are not primarily seeking to measure. Thisis called their cross-axis coupling , transverse response, orsome such terminology.
In many installations, the resultant direction of themotion vector might lie in a constant fixed direction withtime. In such cases, in principle, only one sensor will berequired provided it can be mounted to sense in exactly thatdirection. If not, as is often the case, more than one unitwill be required, the collective signals then being combinedto produce the single resultant.
The potentially available frequency spectrum of vibra-tion parameters extends, as shown in Figure 2, from veryslow motions through frequencies experienced in machinetools and similar mechanical structures to the supersonicmegahertz frequencies of ultrasound.
100 000
10 000
1000
100
10
1.0
10 m
1.0
m0.
1 m
0.01
m0.
1 m
m0.
01 m
m1.
0 µm
0.1
µm0.
01 µ
m0.
001
µm0.
0001
µm
0.00
001
µm0.
0000
01 µ
m0.
0000
001
µmDisp
lace
men
t
1.0
mm 100 000
0.1
0.01
0.001
0.0001
0.00001
0.00000110 1000 10 0001001.00.1
1000 m s
−1
100 m s
−1
10 m s
−1
1.0 m s
−1
0.1 m s
−1
0.01 m s
−1
0.1 mm s
−1
0.01 mm s
−1
1.0 µm s−1
0.1 µm s−1
0.01 µm s−1
0.0001
0.00001
Velocity
Frequency Hz
Acc
eler
atio
n 'g
'
Acc
eler
atio
n m
s−2
100 000
10 000
1000
100
10
1.0
0.1
0.01
0.001
1000 000
1.0 mm s
−1
Figure 2. Frequency spectrum and magnitude of vibration parameters. (Reproduced by permission of Bruel & Kjaer.)

Theory of Vibration Measurement 1393
It is not possible to cover this range with a singlegeneral-purpose sensor. Each application will need carefulconsideration of its many parameters to decide which kindand model of sensor should be applied in order to make theneeded measurement.
The complicating factor in vibration measurement is thedistributed nature of mechanical systems that enables theenergy causing a vibration to flow from a point. Thisleads to complex patterns of vibration, requiring care inthe positioning of sensors.
Head (axial model)(ca. 25 Hz)
Eyeball, intraocularstructures (30–80 Hz)
Shouldergirdle
(4–5 Hz)
Lungvolume
Lower arm(16–30 Hz)
Spinalcolumn(axial
model)(10–12 Hz)
Hand grip(50–200Hz)
Seated person
Legs(variable fromca. 2 Hz withknees flexingto over 20 Hz
with rigid posture)
Chest wall(ca. 60 Hz)
Hand–arm
Abdominalmass (4–8 Hz)
Standing person
Figure 3. Mechanical systems can be modeled in terms of springs, masses, and dampers; model of the human body. (Reproduced bypermission of Bruel & Kjaer.)

1394 Common Measurands
3 MATHEMATICAL DESCRIPTION
Mechanical systems, including the human body given as anexample in Figure 3, comprise mass, spring compliance (orstiffness), and damping components.
In the simplest case, where only one degree of freedomexists, linear behavior of this combination can be welldescribed using linear mathematical theory to model thetime behavior as the result of continuous force excitation, orsome initial position displacement – see Article 60, Zero-order System Dynamics, Volume 1; Article 61, First-order System Dynamics, Volume 1; Article 62, Second-order System Dynamics, Volume 1 for a general analysisof linear motion.
Vibration can be measured by direct comparison ofinstantaneous dimensional parameters relative to some ade-quately fixed datum point in space. The fixed point canbe on an independent measurement framework (fixed ref-erence method) or can be a place that remains suffi-ciently stationary because of its high mechanical iner-tia (seismic system) that holds it relatively constant inposition.
The accelerometer is the main vibration sensor – seeArticle 207, Acceleration Measurement, Volume 3. It isformed with a mass, and a spring having some damping.If operating in its linear range, it will exhibit a second-order linear system output response, qo, that is relatedto an input function, qi, by the generalized differentialequation
a2d2qo
dt2+ a1dqo
dt+ aoqo = qi (1)
For the specific mechanical vibratory system given inFigure 4, this becomes
md2x0
dt2+ cdx0
dt− ksx0 = qi (2)
where m is the effective mass (which may need to includepart of the mass of the spring element or be composedentirely of it), c the viscous damping factor, and ks thespring compliance (expressed here as length change perunit of force applied).
In practice, these three components may be distributedto a varying extent across an object. Often, they can beadequately considered using the lumped model shown.Where the degree of distribution is significant, then analysisbecomes much more complex and is studied using suchcomputer-based methods as the Finite Element Method(FEM).
Fixed framework
Springcomplianceks
Dampingdevicec
Effective mass m
Motion of massof distance xo
Force exerted F
Inputfunctionqi
Figure 4. One degree of freedom, spring-mass-damper systemmodel.
4 AMPLITUDE AND FREQUENCY OFVIBRATION
Where the damping effect is negligible, the system willhave a frequency at which it will naturally vibrate if excitedby a pulse input. This natural frequency ωn is given by
ωn =√
ks
m(3)
Presence of damping will alter this vibration frequencyvalue, but as the damping rises the system is less able toprovide continuous oscillation.
The static sensitivity is given by the spring constant,either as ks, the spring compliance, or as its reciprocal termstiffness that is expressed as force per unit extension.
The influence of damping is readily described by adimensionless number, called the damping ratio, given by
ξ = c
2√
ks × m(4)
It is usually quoted in a ratio form that relates its magnitudewith respect to that at ξ = 1.
These three important parameters are features of a springsystem as a whole formed from the object under test, plusany contributions from an added sensor, any protectivecover, and its wiring. The parameters are independent ofthe input driving function.
Such systems have been extensively analyzed whenexcited by the commonly seen input forcing functions, thestep, impulse, ramp, and sinusoid. A general theory for han-dling any input function other than these is also available.
In practice the step, impulse, and continuous sinusoidalresponses are used in analyses, as they are reasonably easyto apply in theory and in practical use.

Theory of Vibration Measurement 1395
5 IMPORTANCE OF DAMPING
From the plots of different damping ratios for a step inputgiven in Figure 5, it can be seen that as the damping factorξ increases the response to a transient step force input(applied to the mass) can vary from a sinusoidal oscillationat one extreme (called underdamped ) to a very sluggishclimb to the final value (overdamped ). The nominal valueof ξ = 0.7 is called the critical damping state as this is thefastest rise to its final value.
In the case of a continuous sinusoidal force being appliedto the input, the system frequency response varies as shownin Figure 6.
Note the resonance buildup point at ωn, and that itis limited by the existing degree of damping. Thus,the damping of the system to be measured by addi-tion of the sensor itself, if it is of the seismic kind,can be of importance as a modifier of likely systemresponses.
A well-known measurement error situation is where anoscillatory response is being plotted with a mechanical chartrecorder. If the response of the chart drive mechanism(itself a second-order system) is not adequate, the recordis attenuated as the oscillation frequency of the measuredinput rises. The same effect can arise with poorly set upvibration-measuring systems.
2.0
1.0
1.8
1.6
1.4
1.2
0.8
0.6
0.4
0.2
0 1 2 3 4 5 6 7 8 9 10
Outputdisplacement
x0
Initial value
Normalized time wn t
Increasingdamping
Dampingratio
0
0.25
0.5
0.751.0
5.0
2.01.5
2.5
Finalvalue
ζ
Figure 5. Displacement responses of a second-order system to an input force step.
ζDamping ratio
Increasingdamping
2.0
1.0
0.5
0.2
0.10.1 0.2 0.5 2wwn
wn
Naturalfrequency
0
1
2
5
10
0.5
0.7
0.40.3
1.0
Theoretical peakat ∞
Inst
anta
neou
sam
plitu
de x
0
Figure 6. Displacement responses of a second-order system to a continuous sinusoidal force input.

1396 Common Measurands
As damping increases, the system response takes on theform of the lower first-order exponential response system,and it cannot oscillate.
The above discussion, with respect to vibration of themeasurand is also the basis of understanding the operationof seismic vibration sensors – see Article 208, Amplitudeand Velocity Measurement, Volume 3.
Second-order measuring systems, therefore, will have anatural frequency of vibration. This is the frequency atwhich they vibrate when given impulse energy that is notoverridden by continuous forced vibrations. Thus, a sensingsystem that is second order and not damped will (becauseof noise energy inputs) produce outputs at its natural fre-quency that are not correlated with frequencies occurringin the system of interest. Use of vibration sensors must,therefore, recognize these limitations by selecting designsthat position their resonant frequency correctly, and thatpossess the right degree of damping. Such issues are cov-ered in Article 206, Practice of Vibration Measurement,Volume 3.
6 APPLICATION TO VIBRATIONMEASUREMENT
In practice, it is also often more convenient to sense vibra-tion by an indirect means and obtain the desired unit bymathematical processing. For example, accelerometers areconveniently used to obtain motional forces (from force =mass × acceleration) and hence stresses and strains. Accel-eration signals can be twice integrated with respect to timeto yield displacement. Sensors that operate as velocity trans-ducers can yield displacement by single integration.
Integration of data is generally preferred to differentiationas the former averages random noise present to a smallervalue compared to the signal, whereas the latter, in reverse,will deteriorate the signal-to-noise ratio.
7 DATA PROCESSING
Signals obtained in vibration measurements will take manyforms depending on the vibration characteristics of theobject under test. These will include
• repeating pulses,• sine waves,• complex waveforms,• noise.
Their nature can be
• continuous, having the same signal waveform,• varying waveforms with time,
• modulated amplitudes,• modulated frequencies,• short bursts,• random.
The kinds of information to be extracted from the rawsignal can
• be frequency and magnitude of an oscillation;• be identification of the source of pulses and unwanted
noises;• impact behavior as objects collide or are deliberately
impacted;• be the frequency spectrum of a signal that establishes
relative amplitudes and energy distributions; in vibra-tion, spectral analysis is also taken on a spectrum;
• be a prediction of the future condition of equipment.
These signals are used to establish such things as
• wear in bearings,• noise inside a vehicle,• dangerous vibrations that can cause mechanical failure,• response of loud speakers,• where to attach balancing weights,• machine health monitoring,• earthquake research,• building vibration in wind,• where to apply noise dampening materials, and so on.
Thus, the signal processing of vibration signals often hasto use the full power of signal processing in both the analogand digital domain.
The methods used for general analog and digital signalprocessing, in general, are applicable – see Article 142,Z-transforms, Volume 3; Article 143, DFT and FFTs,Volume 3; Article 144, DSP Chip Sets, Volume 3; andArticle 145, DSP Tools, Volume 3.
Texts devoted to vibration measurement cover the spe-cial methods used, Harris and Piersol (2001), McConnell(1995), Thomsen (2003), and Wowk (1991).
Today, as much as possible this signal processing is car-ried out in the Digital Signal Processing, DSP domain.These methods are very powerful and make use of dedi-cated DSP chips and processors. Tool kits are commonlyavailable and have become so widespread that many of theanalysis tools are now routinely built into equipment, testsets, and into the vibration sensor system itself.
The sensor, however, is usually analog by nature sothe extraction of signals in high noise environments isoften essential – see Article 176, Signals and Signal-to-noise Ratio, Volume 3; Article 178, Noise Matching andPreamplifier Selection, Volume 3; Article 180, Band-width Reduction of Baseband DC Signals, Volume 3;

Theory of Vibration Measurement 1397
Article 181, Amplitude Modulated Signals: The Lock-in Amplifier, Volume 3; Article 182, Boxcar and SignalAveragers, Volume 3; Article 183, Correlators in SignalExtraction, Volume 3; and Article 184, Photon Count-ing, Volume 3.
8 THE LITERATURE ON VIBRATION
There exist many general books on the kinds of transduc-ers that are used to measure the various vibration vari-ables. Some of the titles published have become standardsources carrying forward considerable unchanging knowl-edge, Bruel and Kjaer (1982), Trampe-Broch (1980), andHarris and Piersol (2001).
Whereas the data processing has changed greatly overthe past decades, the sensing principles and nature ofvibration remain the same, making older works valid formany aspects of vibration.
Few general instrument reference texts, such as Webster(1999), Dyer (2001), address the subject of vibration as adistinct topic. Relevant material will be found there undersuch headings as velocity and acceleration measurement,accelerometers, position sensing, and piezoelectric systems.
There are, as would be expected, works entirely devotedto vibration and related measurands. The following willbe of value to those who require more than the limitedintroduction that an article such as this can provide,Crandall (1959), Harris and Piersol (2001), Ling andShabana (1996), McConnell (1995), Mobley (1999), Smith(1989), Steinberg (2000), Thomsen (2003), Timar (1989),and Trampe-Broch (1980).
The various trade houses that manufacture vibration-measuring and testing equipment often provide extensiveliterature and other forms of training aids to assist the uncer-tain user. Their application engineers also offer assistancein vibration system design and set up.
RELATED ARTICLES
Article 180, Bandwidth Reduction of Baseband DC Sig-nals, Volume 3; Article 206, Practice of Vibration Mea-surement, Volume 3; Article 207, Acceleration Measure-ment, Volume 3; Article 208, Amplitude and VelocityMeasurement, Volume 3.
REFERENCES
Bruel & Kjaer. (1982) Measuring Vibration-Elementary Introduc-tion, Bruel & Kjaer, Naerum.
Crandall, S.H. (1959) Random Vibration, Wiley, New York.
Dyer, S.A. (2001) Survey of Instrumentation and Measurement,Wiley, New York.
Harris, C.M. and Piersol, A.G. (2001) Harris’ Shock and Vibra-tion Handbook, McGraw-Hill, New York.
Ling, F.F. and Shabana, A.A. (1996) Theory of Vibration: AnIntroduction, Springer Verlag, Berlin.
McConnell, K.G. (1995) Vibration Testing: Theory and Practice,Wiley Interscience, New York.
Mobley, R.K. (1999) Vibration Fundamentals, Butterworth-Heinemann, Oxford.
Smith, J.D. (1989) Vibration Measurement and Analysis, Butter-worth-Heinemann, Oxford.
Steinberg, D.S. (2000) Vibration Analysis for Electronic Equip-ment, Wiley Interscience, New York.
Thomsen, J.J. (2003) Vibrations and Stability: Advanced Theory,Analysis, and Tools, Springer Verlag, Berlin.
Timar, P.L. (1989) Noise and Vibration of Electrical Machines,North-Holland, Amsterdam.
Trampe-Broch, J. (1980) Mechanical Vibration and Shock Mea-surements, Bruel & Kjaer, Naerum.
Webster, J.G. (1999) The Measurement, Instrumentation, andSensors Handbook, CRC Press, Boca Raton, FL.
Wowk, V. (1991) Machinery Vibration, McGraw-Hill, New York.

206: Practice of Vibration Measurement
Peter H. SydenhamGSEC Pty Ltd, Adelaide, South Australia, Australia
1 Mass-spring Sensors 1398
2 Areas of Application 1402
3 Cross Coupling, Cabling, and Amplifiers 1402
4 Influence Effects on the Sensor 1404
5 Loading by the Sensor 1404
6 Duration of use of Sensor in Tests 1404
7 Amplitude Calibration 1405
8 Accelerometer Calibration 1406
9 Shock Calibration 1406
10 Force Calibration 1406
Related Articles 1406
References 1406
1 MASS-SPRING SENSORS
Many vibration measurements make use of the mass-spring, seismic, sensor system. The seismic sensor is mostlydescribed in the literature as the accelerometer, but this useis not the general case.
Other methods of vibration measurement used includeinductive, capacitive, and optical methods that are primarilynoncontact displacement measuring methods having a fastresponse and small range capability – see Article 191, Dis-placement and Angle Sensors Performance and Selec-tion, Volume 3. The strain gauge, a contact method ofdisplacement measurement, is also able to deliver vibra-tion data; this is discussed in Article 192, Strain Sensors,Volume 3.
Given the appropriate design of spring-mass-dampingcombination a seismic sensor attached to a vibrating sur-face can yield displacement, velocity, or acceleration data.
The principles and theory of this kind of sensor are coveredin Article 205, Theory of Vibration Measurement, Vol-ume 3. Unfortunately, the conflicting response needs of thethree do not enable a single design to be used for all threecases. It is, however, often possible to derive one variablefrom another by mathematical integration or differentiationof the data.
The design of vibration sensors can be most sophis-ticated. Fortunately, the user of vibration sensors rarelybecomes involved in its design but must appreciate thedesign features in order to avoid incorrect use. Minordigressions from best practice can lead to metrological errorthat is not easy to detect.
Two forms of seismic sensor exist. The first, calledthe open-loop sensor makes use of the motion of a massmoving relative to the support case to operate either a dis-placement or a velocity sensing transducer. These possesssome undesirable properties that often rule them out of prac-tical use.
The second form closes the loop (and is, therefore,referred to as a closed-loop or servo seismic sensor) usingthe output signal to produce an internal force that retainsthe mass in the same relative position with respect to thecase, the magnitude of the force needed to effect balancebeing a measure of the vibration parameter. As will beexplained, this method while being more sophisticated ismuch more effective.
1.1 Open-loop sensors
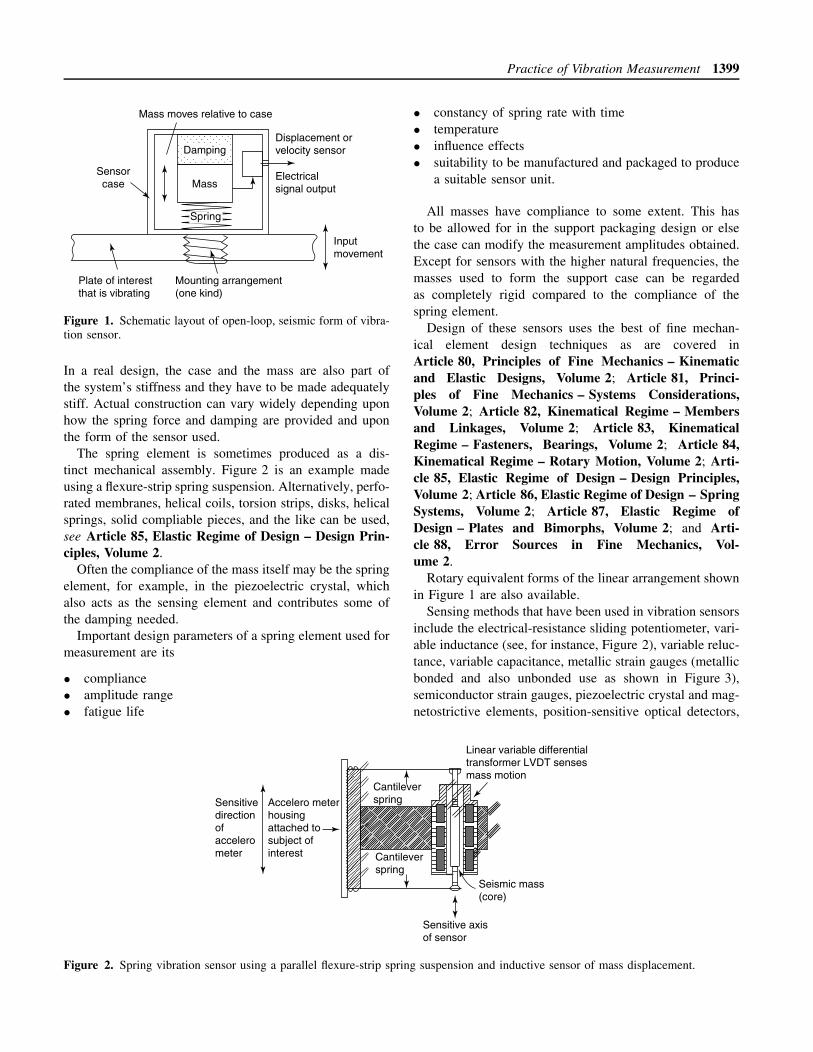
The fundamental schematic arrangement of the open-loopseismic sensor form is as given in Figure 1. There the mass,spring, damper, and sensing element are clearly identified.
Handbook of Measuring System Design, edited by Peter H. Sydenham and Richard Thorn. 2005 John Wiley & Sons, Ltd. ISBN: 0-470-02143-8.
Practice of Vibration Measurement 1399
Mass moves relative to case
MassSensorcase
Inputmovement
Electricalsignal output
Displacement orvelocity sensor
Mounting arrangement(one kind)
Plate of interestthat is vibrating
Spring
Damping
Figure 1. Schematic layout of open-loop, seismic form of vibra-tion sensor.
In a real design, the case and the mass are also part ofthe system’s stiffness and they have to be made adequatelystiff. Actual construction can vary widely depending uponhow the spring force and damping are provided and uponthe form of the sensor used.
The spring element is sometimes produced as a dis-tinct mechanical assembly. Figure 2 is an example madeusing a flexure-strip spring suspension. Alternatively, perfo-rated membranes, helical coils, torsion strips, disks, helicalsprings, solid compliable pieces, and the like can be used,see Article 85, Elastic Regime of Design – Design Prin-ciples, Volume 2.
Often the compliance of the mass itself may be the springelement, for example, in the piezoelectric crystal, whichalso acts as the sensing element and contributes some ofthe damping needed.
Important design parameters of a spring element used formeasurement are its
• compliance• amplitude range• fatigue life
• constancy of spring rate with time• temperature• influence effects• suitability to be manufactured and packaged to produce
a suitable sensor unit.
All masses have compliance to some extent. This hasto be allowed for in the support packaging design or elsethe case can modify the measurement amplitudes obtained.Except for sensors with the higher natural frequencies, themasses used to form the support case can be regardedas completely rigid compared to the compliance of thespring element.
Design of these sensors uses the best of fine mechan-ical element design techniques as are covered inArticle 80, Principles of Fine Mechanics – Kinematicand Elastic Designs, Volume 2; Article 81, Princi-ples of Fine Mechanics – Systems Considerations,Volume 2; Article 82, Kinematical Regime – Membersand Linkages, Volume 2; Article 83, KinematicalRegime – Fasteners, Bearings, Volume 2; Article 84,Kinematical Regime – Rotary Motion, Volume 2; Arti-cle 85, Elastic Regime of Design – Design Principles,Volume 2; Article 86, Elastic Regime of Design – SpringSystems, Volume 2; Article 87, Elastic Regime ofDesign – Plates and Bimorphs, Volume 2; and Arti-cle 88, Error Sources in Fine Mechanics, Vol-ume 2.
Rotary equivalent forms of the linear arrangement shownin Figure 1 are also available.
Sensing methods that have been used in vibration sensorsinclude the electrical-resistance sliding potentiometer, vari-able inductance (see, for instance, Figure 2), variable reluc-tance, variable capacitance, metallic strain gauges (metallicbonded and also unbonded use as shown in Figure 3),semiconductor strain gauges, piezoelectric crystal and mag-netostrictive elements, position-sensitive optical detectors,
Accelero meterhousingattached tosubject ofinterest
Sensitivedirectionof accelerometer Cantilever
spring
Cantileverspring
Linear variable differentialtransformer LVDT sensesmass motion
Seismic mass(core)
Sensitive axisof sensor
Figure 2. Spring vibration sensor using a parallel flexure-strip spring suspension and inductive sensor of mass displacement.
1400 Common Measurands
Sensing axis
Seismic mass
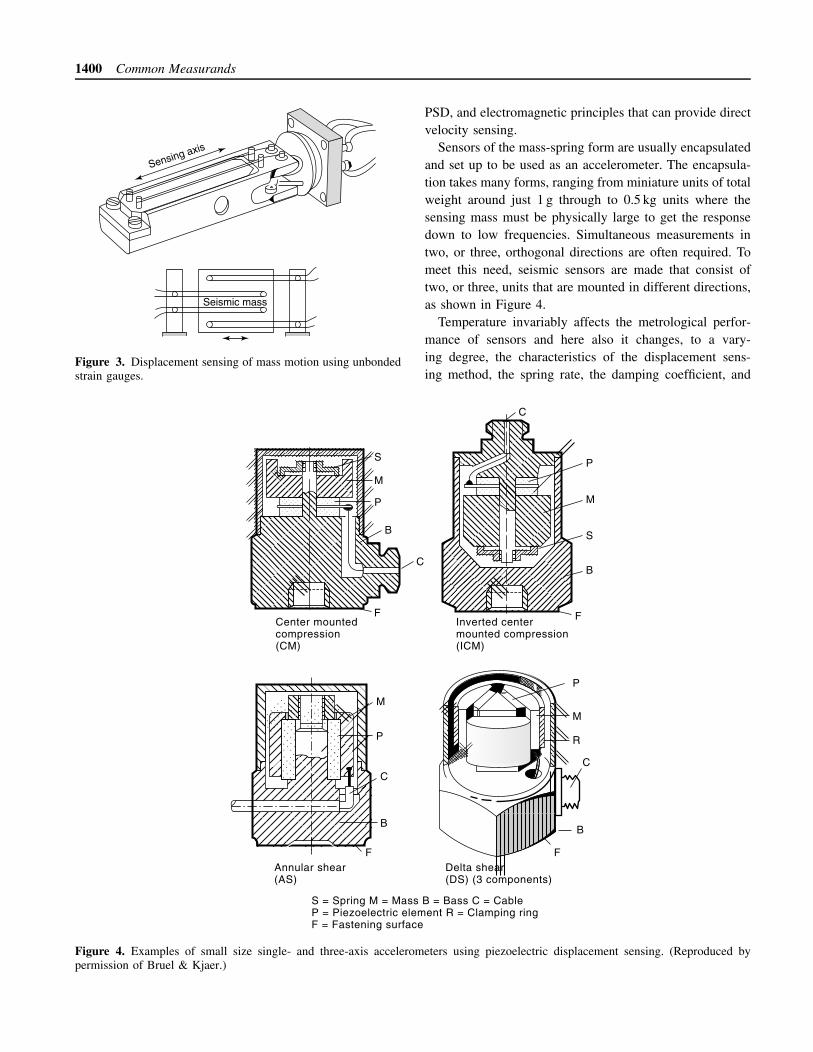
Figure 3. Displacement sensing of mass motion using unbondedstrain gauges.
PSD, and electromagnetic principles that can provide directvelocity sensing.
Sensors of the mass-spring form are usually encapsulatedand set up to be used as an accelerometer. The encapsula-tion takes many forms, ranging from miniature units of totalweight around just 1 g through to 0.5 kg units where thesensing mass must be physically large to get the responsedown to low frequencies. Simultaneous measurements intwo, or three, orthogonal directions are often required. Tomeet this need, seismic sensors are made that consist oftwo, or three, units that are mounted in different directions,as shown in Figure 4.
Temperature invariably affects the metrological perfor-mance of sensors and here also it changes, to a vary-ing degree, the characteristics of the displacement sens-ing method, the spring rate, the damping coefficient, and
S
M
P
B
C
F F
F F
B
C
R
M
P
B
C
P
M
B
S
M
P
C
Center mountedcompression(CM)
Annular shear(AS)
Delta shear(DS) (3 components)
S = Spring M = Mass B = Bass C = CableP = Piezoelectric element R = Clamping ringF = Fastening surface
Inverted centermounted compression(ICM)
Figure 4. Examples of small size single- and three-axis accelerometers using piezoelectric displacement sensing. (Reproduced bypermission of Bruel & Kjaer.)

Practice of Vibration Measurement 1401
the case dimensions. Effective design – see Article 85,Elastic Regime of Design – Design Principles, Volume 2and Article 88, Error Sources in Fine Mechanics, Vol-ume 2 – can reduce these effects considerably, but to getthe best from a design of high performance vibration sen-sors can require compensation for temperature change.
This is either performed in the electronic circuitryas a correction to the data using a temperature sensorplaced accordingly or by incorporating some form ofthermomechanical device into the spring-layout to reducethe error at source.
1.2 Servo vibration sensors
The performance of open-loop seismic sensors can beimproved with respect to their sensitivity, accuracy, band-width, and output signal amplitude by forming the designinto a closed-loop operation.
Figure 5 gives the schematic diagram of a simple formof closed-loop system, which is based upon a moving-coilactuator and a capacitance position sensor. This particularkind is described here, as the elements of the closed-loopsystem are clearly evident.
The inertial mass upon which the acceleration is to beexerted is able to rotate on the end of a freely supportedarm. This is attached to the electrical coil placed in thepermanent magnetic field supplied by the magnet assembly.Acceleration applied to the mass attempts to rotate the armthereby causing displacement of the arm. This unbalancesthe capacitive displacement sensor monitoring the relativeposition of the pendulous mass. The displacement signalproduces an input to the difference-sensing amplifier. Theamplifier drives a corresponding electric current into thecoil, causing the arm to rotate back to the null displacementposition. Provided the loop response is rapid enough, themass will be retained in a nearly constant place relativeto the displacement sensor. Acceleration variations are,thereby, converted to variations in coil current.
In this way, the displacement sensor is used in thepreferred null-balance mode – see Article 126, ElectricalBridge Circuits – Basic Information, Volume 2 andArticle 127, Unbalanced DC Bridges, Volume 2 –wherein error of linearity and temperature shift are muchreduced. In this design, only the more easily achievedproportionality between coil current and force is important.Servo instruments are further described in Article 113,
Accelerationinput
Inertialmass
Positionsensor Demodulator DC amp
RLEO
Electricaloutput
Dampingnetwork
Position
(a)
(b)
Restoring force
Feedback currentTorquegenerator
Positionsensor
Accelerationinput
Pendulousinertialmass
Jewelbearing
Inputcurrent tomoving coil
Pivot axis
Supportingarm
Pivot
Permanentmagnetof torque generator
Figure 5. Component layout of a simple form of closed-loop accelerometer.
1402 Common Measurands
Force-feedback Sensors, Volume 2, in Jones (1982), andsections in Webster (1999).
Microminiaturization has provided considerable scope toform mass-spring systems in microelectro mechanical sys-tems (MEMS) devices – see Article 85, Elastic Regimeof Design – Design Principles, Volume 2; Article 163,Uses and Benefits of MEMS, Volume 3; and Article 164,Principles of MEMS Actuators, Volume 3. The com-plete seismic spring system can be formed at microme-ter dimensions, meaning that the mass is very much lessthan constructions formed of mixed materials as shown inFigure 4.
The spring element is made in many forms – cantilever,double-ended supported beam, vibrating strings, and disks.With such small masses, these are able to operate atmuch higher vibration frequencies and shock rates thantraditional forms.
They are used in many applications such as airbagsensors and also in accelerometer sensors for general-purpose use. Solid-state manufacture, however, is not ableto fully compete with the performance of the best traditionalforms of sensor because of production variations andparameter drift over time.
2 AREAS OF APPLICATION
When searching for information about a measurementtechnique, it is often helpful to have an appreciation ofthe allied fields that use the same equipment. Vibrationwill be of interest in many different applications, but somecan be singled out as the main areas to which commercialmarketing forces have been directed to enhance certainsensor characteristics.
2.1 Machine health monitoring
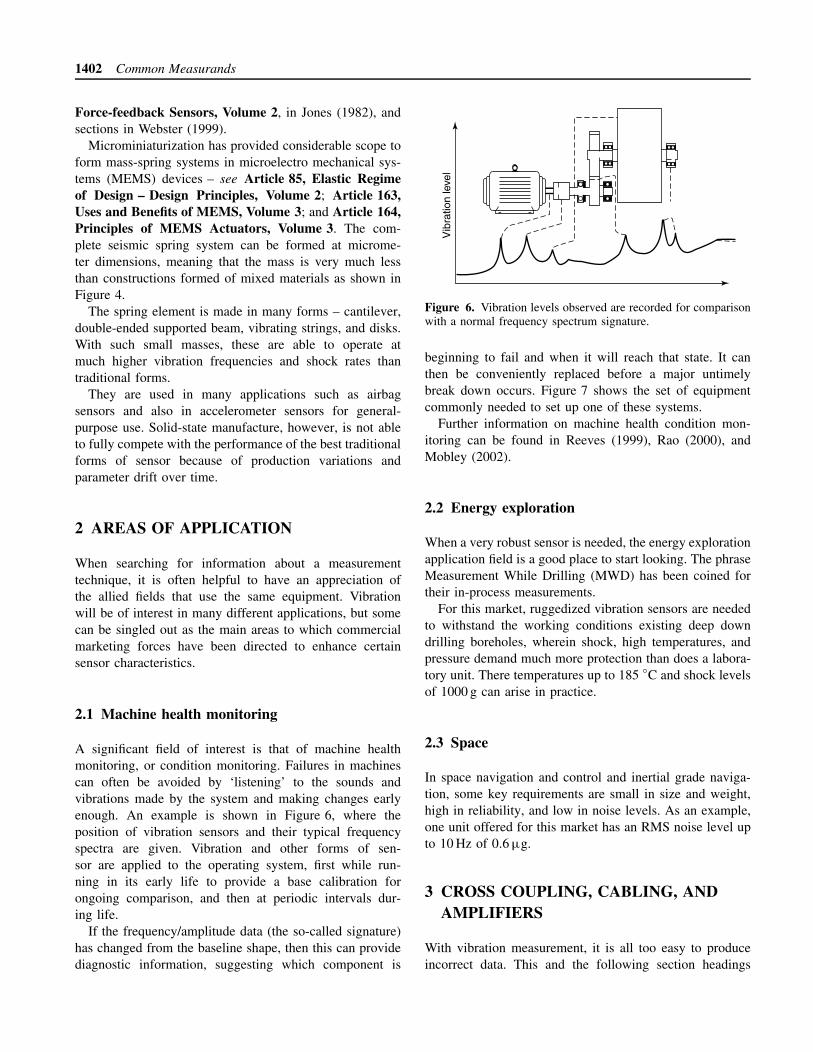
A significant field of interest is that of machine healthmonitoring, or condition monitoring. Failures in machinescan often be avoided by ‘listening’ to the sounds andvibrations made by the system and making changes earlyenough. An example is shown in Figure 6, where theposition of vibration sensors and their typical frequencyspectra are given. Vibration and other forms of sen-sor are applied to the operating system, first while run-ning in its early life to provide a base calibration forongoing comparison, and then at periodic intervals dur-ing life.
If the frequency/amplitude data (the so-called signature)has changed from the baseline shape, then this can providediagnostic information, suggesting which component is
Vib
ratio
n le
vel
Figure 6. Vibration levels observed are recorded for comparisonwith a normal frequency spectrum signature.
beginning to fail and when it will reach that state. It canthen be conveniently replaced before a major untimelybreak down occurs. Figure 7 shows the set of equipmentcommonly needed to set up one of these systems.
Further information on machine health condition mon-itoring can be found in Reeves (1999), Rao (2000), andMobley (2002).
2.2 Energy exploration
When a very robust sensor is needed, the energy explorationapplication field is a good place to start looking. The phraseMeasurement While Drilling (MWD) has been coined fortheir in-process measurements.
For this market, ruggedized vibration sensors are neededto withstand the working conditions existing deep downdrilling boreholes, wherein shock, high temperatures, andpressure demand much more protection than does a labora-tory unit. There temperatures up to 185 ◦C and shock levelsof 1000 g can arise in practice.
2.3 Space
In space navigation and control and inertial grade naviga-tion, some key requirements are small in size and weight,high in reliability, and low in noise levels. As an example,one unit offered for this market has an RMS noise level upto 10 Hz of 0.6 µg.
3 CROSS COUPLING, CABLING, ANDAMPLIFIERS
With vibration measurement, it is all too easy to produceincorrect data. This and the following section headings

Practice of Vibration Measurement 1403
Vibration transmitter Transmitter/monitors Human-machine interface and A to Dconverters
Low-cost accelerometers BNC junction boxesand switch boxes
4 Channel vibration monitoringsystem
Figure 7. Range of equipment needed to instrument a machine health monitoring system. (Courtesy STI, Sales Technology Inc.)
address several important installation conditions that shouldbe carefully studied for each new application.
3.1 Cross-coupling and cross-axis sensitivity
A vibration sensor is usually designed with one princi-pal measuring axis that is perpendicular to its mount-ing surface.
Transducers will exhibit cross-axis coupling to someextent. This arises because the sensing system will alsobe partially sensitive to components of transverse motion.This means maximum sensitivity is not exactly alignedwith the axis of symmetry of the mounting case butwill be the resultant vector of the cross-axis sensitiv-ity for two orthogonal planes through the center of thesensor.
Best practice measurements include a test that vibratesthe sensor in a direction perpendicular to the direction ofnormal use.
Once the cross-axis sensitivity is established, a valuejudgment is needed to decide if this error exceeds theallowable limit for the application to hand; special careis needed where complex vibration is involved.
Rotational (torsional) sensitivity may also be important.These tests can be avoided each time they are used if
the sensors are precalibrated for this source of error and, ofcourse, are still within calibration. An upper limit of 3 to
5% is offered by suppliers as the upper bound; most sensorswill calibrate under this magnitude.
Sensors that have no cross-axis sensitivity quoted shouldnot be used until it is established that it does not impacton the measurement needed. For example, conductinga comparison test of two objects placed into the samevibratory conditions will not be influenced much by anycross-axis sensitivity, unless its value is way above the 5%level, whereupon the signal could become saturated andthus limited.
In the case of a triaxial accelerometer (three unitsmounted together on each of the three-dimensional axes),any high magnitude cross-axis output sensitivity can corruptdata if the principal motion is at right angles to thebase.
A quality sensor will be calibrated and usually markedon the sensor with a red spot placed at the point ofmaximum transverse sensitivity. A polar plot of the outputmight also be supplied that is tied into the position of thespot.
3.2 Coupling compliance
The compliance of the bond made between the sensor andthe surface it is mounted on must be adequately stiff. If not,the surface and the sensor form a system that can vibrate inunpredictable ways. As an example, an insufficiently stiff

1404 Common Measurands
mounting can give results that produce much lower fre-quency components than truly exist. In extreme cases, thesensor can be shaken free as it builds up the unexpectedlylow-resonance frequency of the joint to dangerous ampli-tude levels. As a guide, the joint should be at least tentimes stiffer than the sensor mounting so that the resonantfrequency of the joint is well above that of the sensor.
3.3 Cables and preamplifiers
Certain types of sensors, notably the piezoelectric (PZT)kind, are sensitive to spurious variations in capacitance andcharge. Sources of such charges include the tribo-electriceffect occurring in the bending motion of the vibrating con-necting cables; mechanical stress in the material produceselectrical signals as the cable bends. Special kinds of con-necting cable are used that allow for movement of the cable.
Another source of potential error arises from any varyingrelative humidity, as this can alter electric field leakage; thisbecomes important when designing long-term installations.
The preamplifier stage is also important to get right forthe PZT sensing element has very high output impedance.Such issues are largely overcome by integrating the preampwith the sensor unit.
4 INFLUENCE EFFECTS ON THESENSOR
Ideally, the sensor should operate in a perfect environ-ment wherein sources of external error, called influenceparameters , are insignificant – see Article 16, Reductionof Influence Factors, Volume 1.
In vibration sensing, possible influence effect errorsources include temperature variation of the sensor, possiblemagnetic field fluctuations (especially at radio frequency),and existing background acoustic noise vibrations. Each ofthese might induce erroneous signals.
A good test for influence parameters is to fully connectthe sensor system, observing the output when the measur-and of interest is known to be at zero level, such as byclamping it in a very stiff manner. The output will thencomprise internal noise of the sensing channel and internaldefects, such as system mains supply hum, plus contribu-tions of any impacting influence effect. If the sensing noiseis not observable, then more gain is needed to ensure thetest is valid.
Where practical, the important error inputs can besystematically varied to see the sensor response. Manya vibration measurement has finally been seen to beworthless because some form of influence error turnedout to be larger than the true signal from the measurand.
Vibrations apparently occurring at electric mains frequency(50–60 Hz) and harmonics, thereof, are most suspect.Measurement of mechanical vibration at these frequenciesis particularly difficult because of the need to separate truesignal from influence error noise signals.
5 LOADING BY THE SENSOR
Vibration sensors contain mass. As this mass is madesmaller, the sensitivity of the sensor usually will be reduced,so units with larger mass are more desirable. However,addition of mass to a vibrating system can load the massof that system, causing shifts in frequency and amplitudesfrom the normal state of operation.
For this reason, manufacturers offer a wide range ofattached type sensors. Provided the mass added is, say, 5%or less of the mass of interest, then the results will usuallybe acceptable.
Cables can reduce the overall mechanical complianceby forming a mechanical bridge from its holding downpoint to the sensor case. This can corrupt the true signalmagnitude. They can also increase the damping, therebyshifting frequencies.
Where a system is particularly sensitive to externalloading, the use of noncontact, fixed-reference methods maybe the only way to make a satisfactory measurement.
6 DURATION OF USE OF SENSORIN TESTS
When damping of a structure is very small, as in manymechanical structures, the time taken for a resonance tobuild up to its peak value is long. When using forcedvibration frequency scanning to seek resonances, it isimportant not to sweep the excitation input frequencytoo rapidly.
As the Q Factor rises, the time to reach full amplitudeof the resonance can take many minutes in large-sizemechanical systems.
One often-used test is that for obtaining the vibrationfrequency spectrum of a machine tool as its tool postis excited, as it would be when machining metal. Thetime taken to sweep through the complete spectrum cantake many tens of hours. The issue then is to be certainthat the scanning and measuring equipment maintains itsdeclared specifications over such long continuous periodsof operation.
Some tests are best done in the time domain using animpulse or a step increase, the time domain data resultingbeing transformed into the frequency domain. Impulse testsneed special care to avoid occurrence of zero shift and

Practice of Vibration Measurement 1405
ringing errors, caused by nonlinearities, in electrical aspectsof amplifiers and the sensor for which residual mechanicalstrain can also arise if the spring element is overloadedduring such shocks.
7 AMPLITUDE CALIBRATION
Here, attention is drawn to the issue of sensor calibration.Whereas the fixed-reference methods do have some rele-vance in the practical measurement of vibration, the needfor a convenient fixed datum is very often not met.
Static amplitude (displacement) is easily calibrated usinga standardized micrometer, displacement sensor, or opticalinterferometer. The motional element of the sensor isdeflected a known amount and the output measured.
Note that some types of accelerometer, such as thePZT type, are not DC-connected and thus have zero staticoutput at any position; there has to be motion present, at arelatively rapid rate, to generate an output.
Dynamic calibrations may be made either by compari-son, using a technique of known accuracy and frequencyresponse, or by using a calibrated vibration generator.
Dynamic amplitude of the non-DC-connected types re-quires use of a noncontacting method of measuring the
Accelerometerto becalibrated
Accelerometerto becalibrated
Accelerometerto becalibrated
Referenceaccelerometer
Actuate
(a)
(b)
(c)
Sense
DrivecoilVelocitycoil
Measuredsignal
ComparatorReferencesignal
Mirror
Helium neon laser
Frequency counter
10 000
l = 632.8 nm
Beamsplitter
Photodetector
True RMS voltmeter
VibrationAg sin wt
VibrationAg sin wt
Vibration exciterComparatorVibration control
generator
Figure 8. Calibrating accelerometers. (a) Calibrated vibration exciter shaking accelerometer at calibrated levels; reciprocity method.(b) Back-to-back calibration of a calibrated accelerometer against one to be calibrated; comparison method. (c) Absolute measurementusing optical interferometry.

1406 Common Measurands
displacement taking place. This is viewed on a displayscreen along with the sensor output. Viewing the signal isrecommended as this allows the wave shape to be checked.Once the nature of the signal has been validated, thedata can be processed into more directly useful charts ornumerical values.
8 ACCELEROMETER CALIBRATION
Figure 8 shows outlines of three methods of calibratingaccelerometers and other vibration-measuring sensors. Cal-ibration is normally performed at 500 rad s−1. Figure 8(a)is the reciprocity method. A calibrated vibration excitershakes the accelerometer at calibrated levels. Figure 8(b)shows the comparison method. This uses back-to-back cal-ibration of a calibrated accelerometer against the one tobe calibrated. Figure 8(c) is a noncontact method usingoptical interferometry; this gives an absolute not relativedetermination.
Other methods that can be used are to subject theaccelerometer to accelerations produced by the Earth’sforce. Simple pseudostatic rotation of an accelerometer inthe vertical plane will produce accelerations in the 0 to±1 g range (g is used here for the Earth’s accelerationvalue). Larger values can be obtained by whirling theaccelerometer on the extremity of a rotating arm of acalibrating centrifuge. Alternatively, it can be mounted onthe end of a hanging pendulum.
9 SHOCK CALIBRATION
Short-duration acceleration, as produced by impact, requiresdifferent approaches to calibration. Accelerations in suchapplications as explosive devices can exceed 10 000 g andlast for only a few milliseconds.
A commonly used method is to produce a calibratedshock by allowing a steel ball to free-fall on to an anvilon which is mounted the sensor. This method providesan absolute calibration but, as with all of the methodsdescribed, has uncertainties associated with the practice ofthe method. In this case, one source of error is caused bythe difficulty of releasing a ball to begin its downward pathwithout imparting a small negative or positive velocity attime zero.
Another method uses a long pendulum carrying a largemass. This is allowed to swing down to impact on theobject carrying the sensor under test. Physical considerationallows the rate of energy release to be calculated and thusthe impact forces, but it is not that accurate. It is usefulfor relative calibrations where the sensor under test and astandardized unit are mounted in the same impacted object.
10 FORCE CALIBRATION
Static forces can be calibrated by applying dead weights tothe force sensor, the weights being calibrated masses.
Dynamic forces arising in vibration can more eas-ily be determined using the relationship force = mass ×acceleration. A shaking table is used to produce knownaccelerations on a known mass. In this way, the forcesexerted on the accelerometer can be determined along withthe corresponding output voltage or current needed to pro-duce transducer sensitivity constants.
At the completion of any calibration, the determinationand support data about the method of calibration must berecorded according to the organizations policy. This ensurestraceable results in the event of dispute arising later – seeArticle 45, Calibration Process, Volume 1. The periodbetween calibrations is covered in Article 46, CalibrationInterval, Volume 1.
Space does not permit greater explanation; detailedaccounts of vibration sensors are available in the literature,Trampe-Broch (1980), Bruel and Kjaer (1982), Smith(1989), Timar (1989), Wowk (1991), McConnell (1995),Ling and Shabana (1996), Mobley (1999), Steinberg (2000),Dyer (2001), Harris and Piersol (2001).
RELATED ARTICLES
Article 57, Static Considerations of General Instru-mentation, Volume 1; Article 59, Introduction to theDynamic Regime of Measurement Systems, Volume 1;Article 205, Theory of Vibration Measurement, Vol-ume 3; Article 207, Acceleration Measurement, Vol-ume 3; Article 208, Amplitude and Velocity Measure-ment, Volume 3.
REFERENCES
Bruel & Kjaer (1982) Measuring Vibration-Elementary Introduc-tion, Bruel & Kjaer, Naerum.
Dyer, S.A. (2001) Survey of Instrumentation and Measurement,Wiley, New York.
Harris, C.M. and Piersol, A.G. (2001) Harris’ Shock and Vibra-tion Handbook, McGraw-Hill, New York.
Jones, B.E. (1982) Feedback in Instruments and its Applications,in Instrument Science and Technology, (ed. B.E. Jones), AdamHilger, Bristol.
Ling, F.F. and Shabana, A.A. (1996) Theory of Vibration: AnIntroduction, Springer Verlag, Berlin.
McConnell, K.G. (1995) Vibration Testing: Theory and Practice,Wiley Interscience, New York.

Practice of Vibration Measurement 1407
Mobley, R.K. (1999) Vibration Fundamentals, Butterworth-Heinemann, Oxford.
Mobley, R.K. (2002) An Introduction to Predictive Maintenance,Butterworth-Heinemann.
Reeves, C.W. (1999) The Vibration Monitoring Handbook, (Cox-moor’s Machine and Systems Condition Monitoring Series),Coxmoor Publishing Co., Oxford.
Rao, J.S. (2000) Vibratory Condition Monitoring of Machines,CRC Press.
Smith, J.D. (1989) Vibration Measurement and Analysis, Butter-worth-Heinemann, Oxford.
Steinberg, D.S. (2000) Vibration Analysis for Electronic Equip-ment, Wiley Interscience, New York.
Timar, P.L. (1989) Noise and Vibration of Electrical Machines,North-Holland, Amsterdam.
Trampe-Broch, J. (1980) Mechanical Vibration and Shock Mea-surements, Bruel & Kjaer, Naerum.
Webster, J.G. (1999) The Measurement, Instrumentation, andSensors Handbook, CRC Press, Boca Raton, FL.
Wowk, V. (1991) Machinery Vibration, McGraw-Hill, NewYork.

207: Acceleration Measurement
Peter H. SydenhamGSEC Pty Ltd, Adelaide, South Australia, Australia
1 Use of Seismic Sensors 14082 Optimal use of Seismic Sensor for
Acceleration Measurement 1408
3 Typical Accelerometers 1409
4 Response to Complex Waveforms 1409
5 The Piezoelectric Sensor 1410
6 Amplifiers for Piezoelectric Sensors 1411
7 Microaccelerometers 1411
8 Signal Conditioning in Microaccelerometers 1411
9 Measurement of Shock 1412
Related Articles 1413
References 1413
1 USE OF SEISMIC SENSORS
Of the many measurands that appear under the heading ofvibration – see Article 205, Theory of Vibration Mea-surement, Volume 3 – the most measured is acceleration.
The fixed-reference method of measuring acceleration israrely used, determinations being made more easily withthe mass-spring, seismic form of sensor. This method usesthe inertial mass as a short-term fixed reference: the testobject moves whilst the mass stays sufficiently stationaryin space for short periods of time.
For the seismic sensor system, the mass and the springcompliance are both fixed entities. Consideration of theF = m × a (force = mass × acceleration) law with springcompliance being linear shows that displacement of themass relative to the sensor case is proportional to theacceleration of the case.
The curves, plotted in Figures 5 and 6 of Article 205,Theory of Vibration Measurement, Volume 3 for sinu-soidal input of force to a second-order system, are applica-ble for obtaining the output response curves of accelerom-eters using displacement sensing. In this case, the verticalaxis is interpreted as the relative displacement of the massfor a given acceleration.
2 OPTIMAL USE OF SEISMIC SENSORFOR ACCELERATION MEASUREMENT
The curves, Figure 6 in Article 205, Theory of VibrationMeasurement, Volume 3, show that a seismic sensor willprovide a relatively constant output sensitivity representingsensor acceleration from very low vibration frequenciesup to around 0.5 of the natural frequency of the spring-mass arrangement used. Further, the damping ratio can beoptimized at around 0.5–0.6 and electronic compensationadded (if needed) to raise the upper limit a little furtherthan the undamped resonance point.
At first sight it might, therefore, appear that a single,general-purpose design could be made having a very highresonant frequency. This, however, is not the case for thedeflection of the spring (which is a major factor decidingthe system output sensitivity) is proportional to 1/ω2
n. Inpractice, this means that as the upper useful frequencylimit is extended, the sensor sensitivity falls off rapidly.Electronic amplification allows low signal output to be usedbut with additional cost to the total measuring system. Asthe signal level falls, added amplification will also increasethe noise level.
At the very low frequency end of the accelero-meter response, the transducers become ineffective as
Handbook of Measuring System Design, edited by Peter H. Sydenham and Richard Thorn. 2005 John Wiley & Sons, Ltd. ISBN: 0-470-02143-8.

Acceleration Measurement 1409
accelerometers because the accelerations produce too smalla displacement to be observed against the background noiselevel. By increasing the mass, the units can be made torespond to lower frequencies – see Article 208, Amplitudeand Velocity Measurement, Volume 3.
3 TYPICAL ACCELEROMETERS
As a guide to the range of capability available, onemajor manufacturer’s catalog for traditional accelerome-ters not made in the more recent microminiature form,offers accelerometers with sensitivities ranging from asmall 30 µV ms−2 through to 1 V ms−2 with correspond-ing sensor masses of 3 g and 500 g and useful frequencyranges of 1000 Hz and 0.2 Hz. As the mass increases,the frequency range falls or, conversely, to get low fre-quency response the mass has to increase. Sensors havebeen constructed for higher frequencies using the MEMS,microelectro mechanical system technology as is discussedin Section 7. A selection of traditional accelerometers isshown in Figure 1.
The many constraints placed upon the various perfor-mance parameters of a particular seismic sensor can berepresented in numerical terms on a single chart, Figure 2,Harris and Crede (1976).
It is not always appreciated that all materials exhibitsome degree of mechanical compliance and that the mod-ulus of elasticity is a property of the material, not the wayit is used. Elastic structures, such as helical springs, areused to increase the compliance to suit a particular task –see Article 85, Elastic Regime of Design – Design Prin-ciples, Volume 2.
To obtain the stiffness needed, accelerometer springsmay occur as stamped rigid plates, as flat cusped springwashers, or even as a sufficiently compliant clamping bolt.In applications of piezo-sensitive materials, use is oftenmade of the compliance of the material itself.
Figure 1. A range of accelerometers is required to cover the fullneeds of vibration measurement. (Courtesy, Honeywell Sensingand Control.)
103
102
102 103 104 105
10
10
1.0
1
1
10−1
10−1
10−2
10−2
10−3
10−3
10−4
10 410 3
10 210
101
10−5
10−6
10−4
10−5
Frequency
Vel
ocity
am
plitu
de Pea
k-to
-pea
kdi
spla
cem
ent
Acc
eler
atio
n, g
Max
imum
displa
cem
ent
Low
er fr
eque
ncy
limit
Upp
er fr
eque
ncy
limit
Minim
um acceleration
Maxim
um
acceleration
Operatingrange
Figure 2. Useful linear operating range of an individual seismicvibration sensor can be characterized with this type of chart.
4 RESPONSE TO COMPLEXWAVEFORMS
The response curves given in Figures 5 and 6 of Arti-cle 205, Theory of Vibration Measurement, Volume 3relate to seismic sensors excited by sinusoidal signals.To predict the behavior of a certain sensor, such as anaccelerometer, used to measure other kinds of continu-ous or discrete waveforms, it is first necessary to breakdown the waveform into its Fourier components – see Arti-cle 29, Relationship Between Signals in the Time andFrequency Domain, Volume 1. The response, in terms ofamplitude and phase, to each of these is then added to formthe resultant response.
It has been stated above that damping can be added toextend the useful bandwidth of a seismic sensor. However,where this is done it can increase the phase-shift variationwith frequency; that is, the components are sensed withdifferent phase shifts to the undamped case and thus thereconstructed signal is no longer a fully faithful replica ofthe original motion.
A signal comprising many frequencies will, therefore,produce an output that depends largely on the dampingand natural frequency values of the sensor. A number ofresponses can be plotted, such as shown in Figure 3 fromHarris and Crede (1976). Generally, the damping value forbest all-round results is that near the critical damping valueof 0.7.

1410 Common Measurands
1.0
1.0t
0
0
1.0
2.0
Time
Sei
smom
eter
indi
cate
dac
cele
ratio
n ou
tput
Max
imum
acc
eler
atio
nof
inpu
t
Seismometeroutput responsesfor varying degreesof damping
Half-sine inputpulse
Dampingfactorz
0
0.1
0.70.4
Natural period of seismometer durationof half-sine pulse
~~
Figure 3. Example of response, at various damping-factor levels,of a seismic accelerometer to a complex forcing input-half-sinewave of similar period to that of the natural resonance period ofthe sensor.
5 THE PIEZOELECTRIC SENSOR
Numerous sensing methods have been devised to measurethe motion of the mass in a seismic sensor. Discussed hereis the most commonly used PZT, piezoelectric transducermethod: others are described in Norton (1969), Oliver(1971), Webster (1999).
Force applied to certain crystalline substances such asquartz produces, between two surfaces of a suitably shapedcrystal, an electric charge that is proportional to that force.This charge is contained in the internal electrical capaci-tance formed by the electrically insulating, high-dielectricmaterial and its two conducting surfaces deposited on eachface.
The first approximation descriptive mathematical relationfor this effect is
q = a × F × Ks (1)
where q is the electrical charge generated by force, F (inNewtons), applied across the faces of a piezoelectric devicehaving a mechanical compliance of spring rate Ks (mN−1)and a material constant a (of dimensions C m−1).
The constant a, depends on many factors including thegeometry of the crystal, position of electrodes, and materialused. Typical materials now used (natural quartz is lesssensitive and, therefore, less applicable) include barium
titanate with controlled impurities, lead zirconate, leadniobate; many others are available but their compositionis a trade secret.
The usual PZT sensing material is made from loose pow-der that, after shaping, is fired at a very high temperature.While cooling, the blocks are subject to an electric fieldthat traps a polarization.
Sensitivity of PZT materials is temperature-dependenton the charge sensitivity and the capacitance value, bothof which alter with temperature. These effects do notfollow simple linear laws. Such materials have a criticaltemperature, called the Curie point . They must never betaken above it for it will then destroy the properties ascalibrated.
The Curie point varies from 120 ◦C for the simpler bar-ium titanate forms ranging up to values close to 600 ◦C. Forthe interested reader, detailed explanation can be found inArticle 118, Ultrasonic Sensors, Volume 2, Bruel & Kjaer(1976), Endevco (1980), Harris and Crede (1976), Trampe-Broch (1980), and in the detailed information provided bythe makers of PZT materials in application notes, and manyInternet Web sites.
To read the charge of a PZT sensor as it is vibratedby the subject under test, an electronic amplifier is usedthat converts charge magnitude to a voltage equivalent. Itis the nature of this sensing system that it provides no DCresponse; when stationary there will be no output other thansystem noise.
In practice, the PZT sensors used to measure accelerationcan be operated down to around 0.1 Hz, dependent onthe amplitude to be measured. With a natural resonantfrequency that can be made relatively very high (up to100 000 Hz in some designs), PZT sensors provide a usefulfrequency range that can cover most vibration needs. Thesystem response, however, relies not only on the sensorbut also upon the cables and the preamplifier used withthe PZT unit – see Article 206, Practice of VibrationMeasurement, Volume 3.
To produce the charge, the PZT material can be usedin its pure compression, shear, or bending modes. Thismethod of sensor design is amenable to the combinationof three units giving the three translation components ofvibration. Figure 4 in Article 206, Practice of VibrationMeasurement, Volume 3 gives some examples of com-mercially available PZT accelerometers.
The PZT material itself contributes only of the order of0.03 of the required critical damping factor. Without addi-tional damping being added, PZT transducers should not beused too close to their resonant frequency – see Figure 6in Article 205, Theory of Vibration Measurement, Vol-ume 3 – or an error will arise.

Acceleration Measurement 1411
Integrator(velocity
&displace-
ment)
Chargeamplifier
High-passfilter
Low-passfilter
Amplifier Amplifier
External filter
Detector(peak-peak orRMS)
ACoutput
DC linoutput
DC logoutput
Meter
Lin-logconverter
Accelerometer
Calibrationgenerator
Batterypowersupply
External battery charge
External power supply
Input
Figure 4. Block diagram of vibration measuring system showing functions that may be required. (Reproduced by permission of Bruel& Kjaer.)
Mounting arrangements within the case also can addadditional damping. Some use an additional spring to pre-compress the PZT element so that it remains biased incompression under all working amplitudes: this makes formore linear operation.
Typical sensor element charge sensitivities range from0.003 up to 1000 pC m s−2, implying that the followingpreamplifier units will also need to vary considerably.
6 AMPLIFIERS FOR PIEZOELECTRICSENSORS
An amplifier for reading out the state of the PZT sensoris one that has very high input impedance, an adequatefrequency response, and low output impedance. Adjustmentof the gain, filtering action and integration time variouslyyield velocity and displacement sensing – see Article 208,Amplitude and Velocity Measurement, Volume 3.
Figure 4 is a typical analog conditioning system incor-porating most features that might be needed. Some of theblock functions often use digital processing methods, butthe charge amplifier still needs to be analog.
The charge amplifier could be designed to see the sensoreither as a voltage or a charge (current) source. The latteris preferred for, using modern electronic-feedback opera-tional amplifier techniques, the effect of cable, sensor, andamplifier capacitances can be made negligible (which in thevoltage-reading method, is not the case). Cable length is,therefore, of little consequence. This is justified as follows.
Figure 5 is the relevant equivalent circuit for a PZTaccelerometer connected to an operational amplifier (thepreamplifier) via a cable. It includes the dominant capaci-tances that arise in practice.
It can be shown (see Trampe-Broch (1980), for example)that the use of feedback in this way with a very highamplifier gain A gives
e0 = Sqa
Cf
(2)
This shows that the user need only define the sensor chargesensitivity Sq and the feedback capacitance Cf in order tobe able to relate output voltage from the preamplifier to theacceleration of the sensor.
If the preamplification shown here is carried out in thesensor housing, then a special connection cable havingreduced triboelastic effect is not needed from the sensorto the fixed cable support. Many cases, however, cannotplace the preamplifier in the sensor housing as that addsmass to the accelerometer, which may not be acceptable.
7 MICROACCELEROMETERS
Microelectronic forms of the accelerometer made bythe MEMS technology – see Article 162, Principles ofMEMS, Volume 3; Article 163, Uses and Benefits ofMEMS, Volume 3; and Article 164, Principles of MEMSActuators, Volume 3 – can be remarkably small comparedwith traditional forms.
For example, one unit reported at the R&D stage byresearchers at Seoul University, Kwang et al. (2003), hasa proof mass of 15 µg that is 870 × 1027 × 50-µm thick.The accelerometer’s natural frequency at 14 kHz impliesoperation up to 7 kHz or a little more if compensation isused. The spring elements supporting the lateral capacitivecomb type sensor are 4-µm thick and 250-µm long. Thesensing gap is 3 µm.
Another development unit, Figure 6, shows one of themany forms of suspension used to support the proof mass,LLNL (2000).
8 SIGNAL CONDITIONING INMICROACCELEROMETERS
The signal processing used in the MEMS forms of accelero-meter can be very sophisticated as it allows integration ofthe system blocks needed to produce a ready to use robustoutput signal. These are

1412 Common Measurands
Input acceleration a
PZT accelerometer
Ca Cc C1
C1
Ii
A
q = Sq × a
Where Sq is accelerometer charge sensitivitya is acceleration
System transfercoefficient
= =eo
eo
aSq
Charge q
Feedbackpreamplifier
Feedbackcapacitance
C1
Output
Figure 5. Equivalent circuit for piezoelectric sensor when interrogated, as a charge-generating device, by an operational amplifiertechnique.
15 mm
Figure 6. An experimental microaccelerometer sensor.
• seismic sensing element,• voltage regulator,• A–D converter,• sample and hold,• microprocessor,• switching,• noise reduction,
• computer controlled settings,• smart features – see Article 160, Smart Sensor Sys-
tem Features, Volume 3.• bias voltages,• wireless link interface.
A good study, readily available to consult on the Internetis Kulah et al. (2004). Their account shows the intricaciesand level of achievement possible with fully integratedMEMS units.
Further details of MEM systems are found inArticle 162, Principles of MEMS, Volume 3; Article 163,Uses and Benefits of MEMS, Volume 3; and Article 164,Principles of MEMS Actuators, Volume 3.
Signal conditioning is covered in the Section on DataAcquisition Systems starting at Article 132, Data Acqui-sition Systems (DAS) in General, Volume 3.
9 MEASUREMENT OF SHOCK
Shock is a sudden short impulse of applied force that cangenerate very large acceleration (100 000 g can arise) that isnot recurrent. It can be regarded as a once-only occurrence

Acceleration Measurement 1413
of a vibration waveform, although sometimes it is used todescribe a short burst of oscillation. Examples are objectssubject to explosions and impacts arising because of acollision.
Understanding the formalized behavior of a given vibra-tion sensor to a shock situation requires Fourier analy-sis of its response to a truncated wave shape, that is,a discontinuous wave. The mathematics becomes morecomplex.
Theoretical considerations lead to the generalization thatas the waveform becomes more like a single pulse of highmagnitude and very short duration, the frequency bandof the sensor must be widened if the delivered output isto be a satisfactory replica of the actual input vibrationparameter.
Thus, the accelerometer used to measure shock mustpreferably possess sufficient flat bandwidth below its natu-ral frequency point. Special DSP, digital signal processingmethods allow measurement signal extraction beyond thiscriterion using advanced algorithms.
Fidelity of output increases as the period of the naturalfrequency of the sensor becomes shorter than the pulselength. An idea of the variation of responses with naturalfrequency and damping is available in graphs given inHarris and Crede (1961). An example can be found inFigure 3.
Here also the very large force exerted on the transducer(force = g × mass of sensor) requires a total design thatrecognizes the need to withstand large transient forceswithout altering the mechanical residual strains in the sensorsystem during measurement. Mounting circuitry on thesensor itself adds more room for induced shock error, forthe silicon chips can be shock sensitive.
Well-designed shock sensors can accurately measuresingle half-sine-wave pulses as short as 5 µs. Some amountof ringing in the output is usually tolerated in orderto provide measurement of very short duration shocks.Compensation to increase the bandwidth is also useful inextending the range of operation.
RELATED ARTICLES
Article 59, Introduction to the Dynamic Regime of Mea-surement Systems, Volume 1; Article 61, First-orderSystem Dynamics, Volume 1; Article 62, Second-orderSystem Dynamics, Volume 1; Article 205, Theory ofVibration Measurement, Volume 3; Article 206, Prac-tice of Vibration Measurement, Volume 3; Article 208,Amplitude and Velocity Measurement, Volume 3.
REFERENCES
Bruel & Kjaer. (1976) Piezoelectric Accelerometer and VibrationPreamplifier Handbook, Bruel & Kjaer, Naerum.
Endevco. (1980) Shock and Vibration Measurement Technology,Endevco Dynamic Instrument Division, San Juan Capistrano,CA.
Harris, C.M. and Crede, C.E. (1976) Shock and Vibration Hand-book Vol. 1, Basic Theory and Measurements, McGraw-Hill,New York, (1961, reprinted in 1976).
Kulah, H., Salian, A., Yazdi, N. and Najafi, K. (2004) A 5Vclosed-loop second-order sigma-delta, micro-g micro-accelero-meter, Center for Wireless Integrated Microsystems , Universityof Michigan, http://www.eecs.umich.edu/∼hkulah/pdfs/HH-02-Kulah.pdf.
Kwang, Y., Yeon, J.C., Kim, Y.H., Rhee, S.W. and Oh, S.H.(2003) High Resolution Silicon Accelerometer Using EutecticBonding, in Nanotech Conference 2003 , abstract http://www.nsti.org/procs.
LLNL. (2000) MEMS microaccelerometer , Lawrence LivermoreNational Laboratory, http://microtechnology.llnl.gov/Devices.html.
Norton, H.N. (1969) Handbook of Transducers for ElectronicMeasuring Systems, Prentice Hall, Englewood Cliffs, NJ.
Oliver, F.J. (1971) Practical Instrumentation Transducers, Pit-man, London.
Trampe-Broch, J. (1980) Mechanical Vibration and Shock Mea-surements, Bruel & Kjaer, Naerum.
Webster, J.G. (1999) The Measurement, Instrumentation and Sen-sors Handbook, CRC Press, Boca Raton, FL.
208: Amplitude and Velocity Measurement
Peter H. SydenhamGSEC Pty Ltd, Adelaide, South Australia, Australia
1 Measurement of Displacement with a SeismicForm of Sensor 1414
2 Theory of Displacement Measurement Usinga Seismic Sensor 1414
3 Practice of Displacement Measurement Usinga Seismic Sensor 1415
4 Measurement of Velocity 1415
5 Theory of Velocity Measurement 1415
6 Practice of Velocity Measurement 1416
Related Articles 1416
References 1417
1 MEASUREMENT OF DISPLACEMENTWITH A SEISMIC FORM OF SENSOR
Where a fixed reference method is inconvenient, one ofseveral forms of seismic sensor system can be employed asfollows.
It is sometimes more convenient to mathematically inte-grate the signal from a velocity transducer making use of afixed reference framework.
Integration is a sound process, for the noise present isreduced by the integration, averaging process. The inte-gral of an acceleration measurement is velocity and thesecond integral is then displacement. Thus, an accelerom-eter can be used to measure displacement under certainconditions.
2 THEORY OF DISPLACEMENTMEASUREMENT USING A SEISMICSENSOR
The second-order equations of motion, given in Arti-cle 205, Theory of Vibration Measurement, Volume 3,for a mass that is moving relative to a fixed referenceframe (the mode for studying the movement of vibratingobjects) can be reworked to provide response curves relat-ing the displacement amplitude of the seismic mass to thatof its case.
Figure 1 is the family of response curves showing theeffects of different operating frequency and the degree ofdamping. Given that the case is moving in sympathy withthe surface of interest, it can be seen, from the curves,that for input vibration frequencies that are at least twicethe natural frequency of the seismic sensor, the measuredoutput displacements will be a true indication (within apercent or so) of the movements of the surface. Thisform of seismic displacement sensor is also often calleda vibrometer .
It is possible to lower the frequency of operation byusing a damping factor with a nominal value of 0.5. This,however, does introduce more rapidly changing phase-shift error with frequency, which may be important. Thelowest frequency of use above which the response remainsvirtually flat is seen to be where the various damping factorcurves approach the horizontal line equal to unity ratio, towithin the allowable signal tolerance.
Given that the chosen damping remains constant and thata system does follow the second-order response, it is alsopossible to provide electronic frequency compensation thatcan further lower the useful frequency of operation by auseful amount.
Handbook of Measuring System Design, edited by Peter H. Sydenham and Richard Thorn. 2005 John Wiley & Sons, Ltd. ISBN: 0-470-02143-8.

Amplitude and Velocity Measurement 1415
2.0
1.0
0.5
Dis
plac
emen
t am
plitu
de o
f sei
smic
mas
s re
lativ
e to
cas
eD
ispl
acem
ent a
mpl
itude
of c
ase
0.2
0.10.3 0.5 0.81.0
Naturalfrequency
2 5w
z
wn
10
10
0.7
0.50.40.3
5
Damping ratio
2
1
0
Figure 1. Responses relevant to displacement and velocity sens-ing with seismic sensors.
Thus, to directly measure displacement amplitudes witha seismic sensor, it must have a natural frequency setto be below the lowest frequency of interest in the sub-ject’s vibration spectrum. In this mode, the seismic massvirtually remains stationary in space acting as a fixedreference point. It is also clear that the seismic sen-sor cannot measure very low frequencies, for it is notpossible to construct an economical system having alow enough resonant frequency, as that needs massivemasses and very springy suspensions; these are the fea-tures of the large strong motion seismometers that mea-sure ground and building motion and displacement duringearthquakes.
3 PRACTICE OF DISPLACEMENTMEASUREMENT USING A SEISMICSENSOR
The curves are theoretical perfections and would appar-ently indicate that the seismic sensor, in this case, willhave flat response to infinite frequency. This is notthe case in practice, for, as the frequency of vibra-tion rises, the seismic sensor structure begins to resonateat other frequencies caused by such mechanisms as thespring vibrating in modes other than the fundamental ofthe system.
Given that the low frequency range of accelerometerscan extend down to less than 1 Hz (see Article 207,Acceleration Measurement, Volume 3), it may often bemore practical to twice integrate an accelerometer signal,in order to derive displacement amplitude, rather than
to make use of a direct-reading displacement seismicsensor design.
4 MEASUREMENT OF VELOCITY
This section covers simple traditional forms of velocitysensor used to measure the short motions of solid objectsthat will possibly also need acceleration determination.
The many other forms for measuring velocity (i.e. flowspeeds) of gases, liquids, solids, and mixed-phase flows arecovered in the following articles:
• Laser Doppler velocimeters and other flowmeters –Article 187, Flowmeter Selection and Application,Volume 3
• Angular and displacement devices in general – Arti-cle 191, Displacement and Angle Sensors Perfor-mance and Selection, Volume 3; Article 192, StrainSensors, Volume 3; Article 193, Specialty Displace-ment and Angle Sensors, Volume 3.
Other methods, such as digital encoders, Hall-effecttoothed wheel sensing, tuning forks, magnetohydrodynam-ics, and optical correlation are variously covered in Webster(1999), Norton (1969), and Dyer (2001).
5 THEORY OF VELOCITYMEASUREMENT
The prime method used to generate a direct velocity signalmakes use of the law of electromagnetic induction. Thisgives the electrical voltage e generated as N turns of anelectric coil to cut magnetic flux φ over time t as
e = −Ndφ
dt(1)
Velocity sensors are thus self-generating; they produce avoltage output that is proportional to the velocity at whicha set of turns moves through a constant and uniformmagnetic field.
Many forms of this kind of sensor exist. The commonlyused, moving-coil arrangement comprises a cylindrical coilvibrating inside a magnetic field that is produced by apermanent electromagnet. A commonly seen arrangement,Figure 2(a), is that typified by the reversible-role, moving-coil, loudspeaker movement. For this form, the outputvoltage Vout is given by
Vout = −Blv × 10−9 (2)

1416 Common Measurands
N
Fixedcoil
Magnet moving in coilin vibration direction
Electricaloutput
S
(c)
Cylindricalairgap Generated
electricaloutput
Fixed coaxialpermanentmagnetstructure
Movingcoil in magneticfield
S NN
(a)
Velocityinput
Electricaloutput
MagneticcircuitVibrating input
Ferro-magneticmaterial
(b)
Variable airgap modulates magnetic circuit
N
S
Figure 2. Forms of velocity sensor. (a) Moving coil, (b) variablereluctance, (c) moving permanent magnet.
where B is the flux density in Tesla, l the effectivelength of conductor contributing in total flux-cutting, andv the instantaneous velocity, expressed in ms−1, of thecoil relative to the magnet. Given that the design ensuresthat the magnetic field is uniform in the path of thefixed conductor length, the sensor can provide very linearoutput.
6 PRACTICE OF VELOCITYMEASUREMENT
These were the sensors adopted in early seismology studiesbecause of their inherently high output at relatively lowvelocities. The coil impedance will generally be low,
enabling signals with good signal-to-noise ratios to begenerated along with reduction of error caused by variationsin lead length and type. They are, however, large withresultant mass and rigidity problems. Many of the formstend to have relatively low resonant frequencies (tens ofhertz), which restricts use to the lower frequencies. It willbe apparent that these sensors cannot produce signals at zerovelocity because no relative movement occurs to generateflux-cutting.
A second variation of the self-generating velocity sensor,the variable-reluctance method, uses a series magneticcircuit containing a permanent magnet to provide permanentmagnetic bias. A part of this circuit, the armature, is madeso that the effective air gap is varied by the motion to bemonitored. Around the magnetic circuit is placed a pickupcoil. As the armature moves, the resulting flux variationcuts the coil, generating a signal that can be tailored byappropriate design to be linear with vibration amplitude.This form of design has the advantage that the armaturecan readily be made a part of the structure to be monitored,as shown in Figure 2(b). This version is not particularlysensitive, for the air gap must be at least as large as thevibration amplitude. As an example, a unit of around 12-mm diameter, when used with a high magnetic permeabilitymoving disc set at a 2-mm distance, will produce an outputof around 150 mV ms−1.
A third method uses a permanent magnet as the masssupported on springs. One example is shown in Figure 2(c).Vibration causes the magnet to move relatively to the fixedcoil, thereby generating a velocity signal. This form canproduce high outputs, one make having a sensitivity ofaround 5 V ms−1.
Where a fixed reference cannot be used, this form ofsensor, instead of a displacement sensor, can be builtinto the seismic sensor arrangement. In such cases, thevibrating seismic sensor will then directly produce velocitysignals. These will follow the general responses given inFigure 1. From those curves, it can be seen that there is areasonably flat response above the natural frequency, whichis inherently quite low.
RELATED ARTICLES
Article 187, Flowmeter Selection and Application, Vol-ume 3; Article 191, Displacement and Angle SensorsPerformance and Selection, Volume 3; Article 192,Strain Sensors, Volume 3; Article 193, Specialty Dis-placement and Angle Sensors, Volume 3; Article 205,Theory of Vibration Measurement, Volume 3; Arti-cle 207, Acceleration Measurement, Volume 3.

Amplitude and Velocity Measurement 1417
REFERENCES
Dyer, S.A. (2001) Survey of Instrumentation and Measurement,Wiley, New York.
Norton, H.N. (1969) Handbook of Transducers for ElectronicMeasuring Systems, Prentice Hall, Englewood Cliffs, NJ.
Webster, J.G. (1999) The Measurement, Instrumentation and Sen-sors Handbook, CRC Press, Boca Raton, FL.