matching beef genetics with production environment t. g. jenkins and c. l. ferrell usda, ars, u.s....
Post on 22-Dec-2015
212 views
TRANSCRIPT

Matching Beef Genetics with Production EnvironmentT. G. Jenkins and C. L. Ferrell
USDA, ARS, U.S. Meat Animal Research CenterClay Center NE

CYCLING
BREEDING
PREGNANT
CALVING
COW HER
D
CULLS
CALVES
REPLACEMENT HEIFERS
STOCKERS
FEEDER CATTLE
MARKET CATTLE
LiveweightGridNiche
$
$


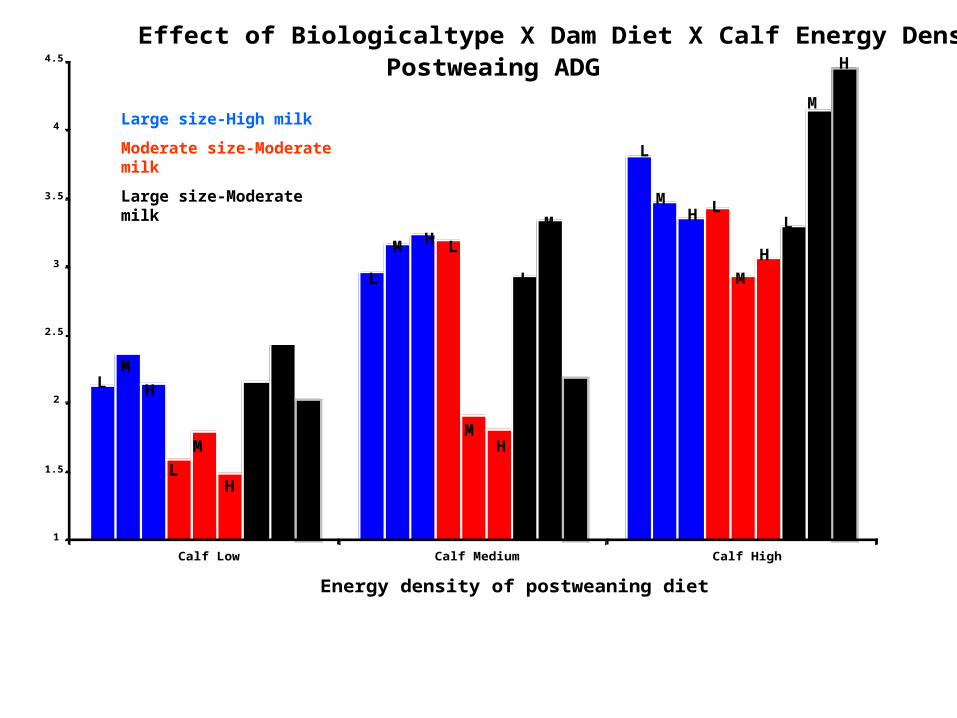
Effect of Biologicaltype X Dam Diet X Calf Energy Density on Postweaing ADG
1
1.5
2
2.5
3
3.5
4
4.5
Calf Low Calf Medium Calf High
Energy density of postweaning diet
ADG, lbs
LM
H
L
M
M
M
M
M
M
M
L
L
L
L
L
LL
H
H
H
H
H
H
H
M
H
Large size-High milk
Moderate size-Moderate milk
Large size-Moderate milk

An Approach to “Matching Beef Cattle Genetics”:1) Identify the product to be merchandised.
2) Identify the most limiting environmental feature (constraint or bottleneck)
3) Identify phenotype(s) that directly or indirectly provide an advantage
4) Define an objective measure of the identified phenotype(s) to overcome the constraint
5) Identify breed(s) or animals with phenotypes that overcome the constraint
6) Determine if trait is under genetic control7) Design and implement a breeding program to increase the frequency of the desired
genotypes in the inventory 8) Utilize and Sustain genetic diversity

Utilizing Genetic Diversity to Meet Environmental Challenges
Cross Breeding Systems
Mating Systems
Rotation
Composite
Specialized dam and sire lines
terminal sire systems?
Utilizing breed diversity, heterosis effects, and complementarity

Cundiff et al, 1986
Mating Systems to Match Beef Cattle Genetics to Environment
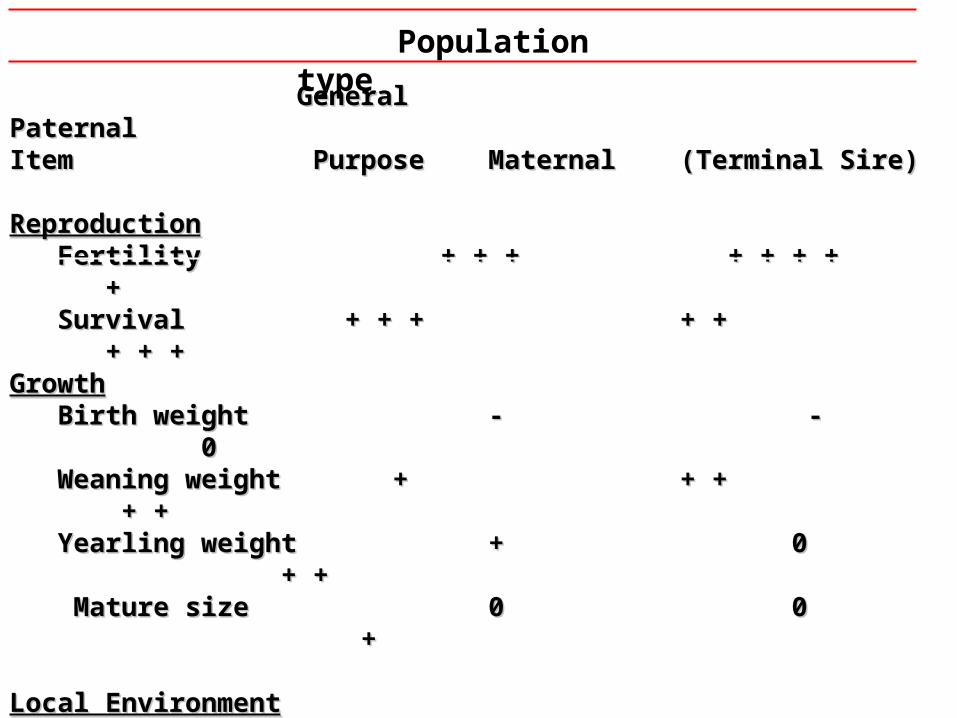
GeneralGeneral Paternal PaternalItemItem Purpose Purpose MaternalMaternal (Terminal Sire)(Terminal Sire)
ReproductionReproduction FertilityFertility + + + + + + + + + + + + + + ++ SurvivalSurvival + + + + + + + + + + + + + + + +GrowthGrowth Birth weightBirth weight - - - - 00 Weaning weightWeaning weight + + + + + + + + + + Yearling weightYearling weight + + 0 0 + + + + Mature sizeMature size 0 0 0 0 + +
Local EnvironmentLocal EnvironmentAdaptationAdaptation ++++ ++++ ++++ ++++Adaptability Adaptability +++ +++
Population type

SIRE BREEDS USED TO PRODUCE FI CROSSES WITH ANGUS AND HEREFORD DAMS IN THE GERMPLASM EVALUATION
PROGRAM AT MARCa
Cycle I Cycle II Cycle III Cycle IV Cycle V Cycle VI Cycle VII Cycle VIII 70-72 73-74 75-76 86-90 92-94 97-98 99-00 01-02
Hereford Hereford Hereford Hereford Hereford Hereford Hereford HerefordAngus Angus Angus Angus Angus Angus Angus AngusJersey Red Poll Brahman Longhorn Tuli Wagyu Red Angus BeefmasterS. Devon Braunvieh Sahiwal Salers Boran Norweg. Red Limousin BrangusLimousin Gelbvieh Pinzgauer Galloway Belg. Blue Sw. Red&Wh. Charolais BonsmaraSimmental Maine Anj. Tarentaise Nellore Brahman Friesian Simmental RomosinuanoCharolais Chianina Shorthorn Piedmontese Gelbvieh
PiedmonteseCharolaisGelbviehPinzgauer
Sire breeds mated to Angus and Hereford females, Composite MARC III (1/4 Angus, Hereford, Red Poll and Pinzgauer) cows were also included in Cycles V, VI, and VII. (http://www.ars.usda.gov/npa/marc)

Losing Genetic Diversity?

Sire breed deviations from Hereford-Angus crosses for height, weight, and Sire breed deviations from Hereford-Angus crosses for height, weight, and weight adjusted for condition score of Fweight adjusted for condition score of F
11 cows cows aa
CowCow CowCow CowCow
BreedBreed
HeightHeightinin
Weight Weight lblb
Adj. WeightAdj. Weightlblb
CycleCycle I & II VII I & II VII I & II VII
HAxHAx 0.0 0.0 0 0 0 0
SimmentalSimmental 6.3 1.0 +23 +19 +29 + 27
GelbviehGelbvieh 6.0 0.1 +23 -76 +34 - 55
LimousinLimousin 5.0 1.0 +11 + 5 +15 + 15
CharolaisCharolais
Cont. avg. Cont. avg.
6.2 0.9
+5.9 0.8
+ 51 + 17
+27 - 9
+ 53 + 18
+33 + 1
aa Data for Cycles I and II are averaged over cow ages 2 – 8 yr of ageData for Cycles I and II are averaged over cow ages 2 – 8 yr of age
(Arango et al.,2004). Data for cycle VII are for 5-yr-old cows.(Arango et al.,2004). Data for cycle VII are for 5-yr-old cows. Cundiff(2005)

Utilizing Genetic Diversity to Meet Environmental Challenges
Within breed improvement
Single trait selection
Selection index
Utilizing within breed diversity
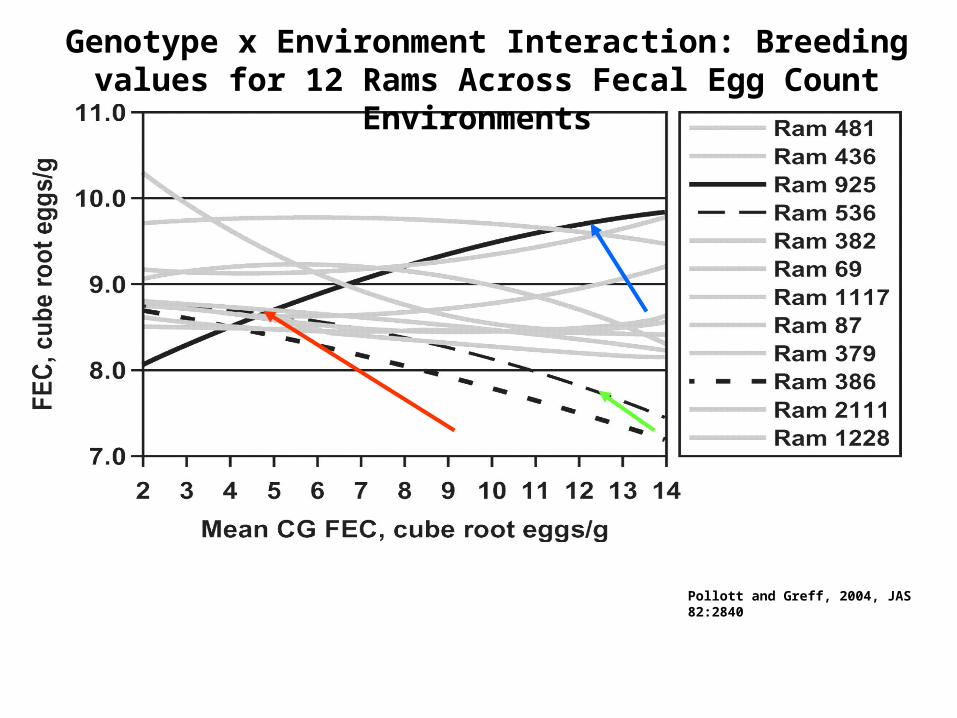
Pollott and Greff, 2004, JAS 82:2840
Genotype x Environment Interaction: Breeding values for 12 Rams Across Fecal Egg Count Environments

Need for Diversity: Nutritional GEI

Nutritional Effect on Weight Maintenance for
Diverse Breeds
60
65
70
75
80
85
<3 3.0-5.0 5.0-6.5 7.0+
Weight maintained/ unit DMI, lb/lb
Angus
Hereford
Red Poll
Simmental
Charolais
Gelbvieh
Body condition scores
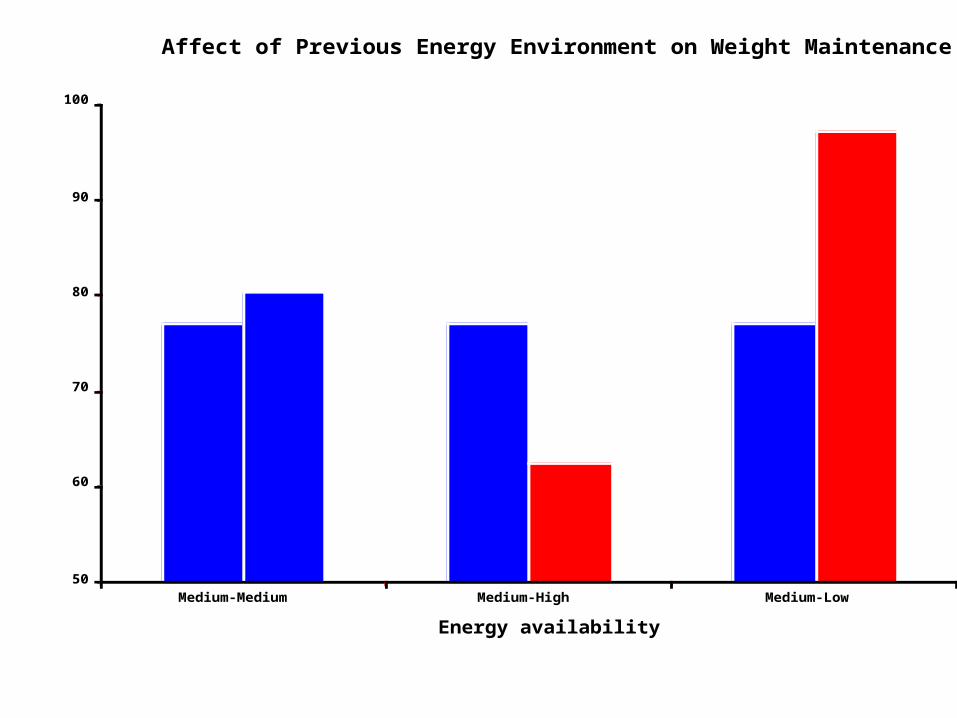
Affect of Previous Energy Environment on Weight Maintenance
50
60
70
80
90
100
Medium-Medium Medium-High Medium-Low
Energy availability
Weight maintenance lb/lb

Relationship Between Genetic Potential for Peak Milk Yield and Maintenance
0.02
0.022
0.024
0.026
0.028
0.03
0.032
0.034
15 20 25 30 35
Pounds of milk
Maintenance requirement
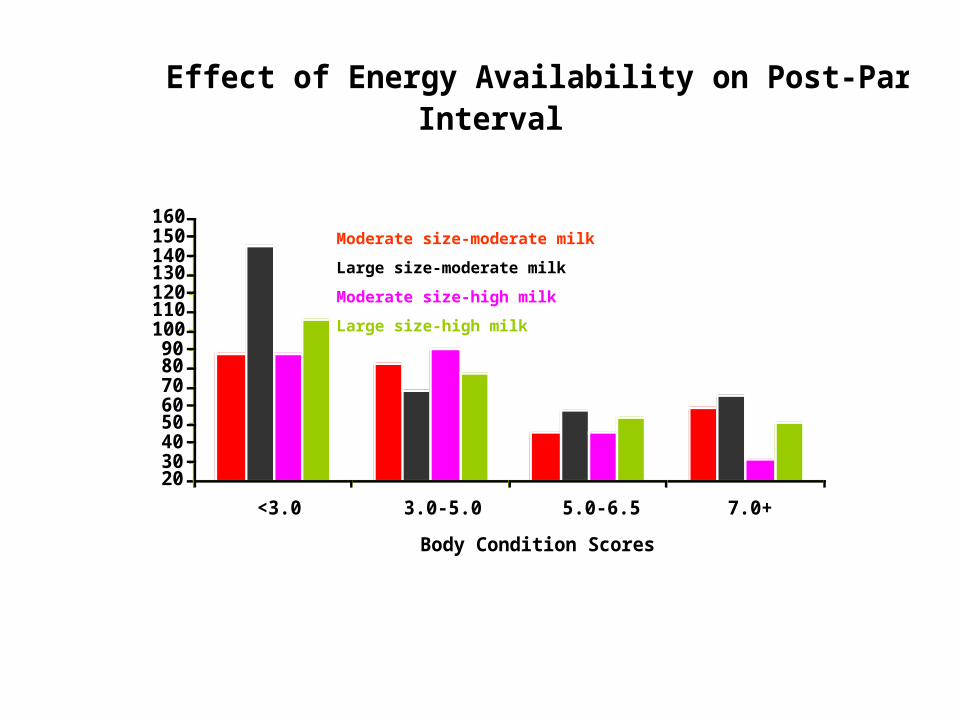
Effect of Energy Availability on Post-Partum Interval
2030405060708090
100110120130140150160
<3.0 3.0-5.0 5.0-6.5 7.0+
Body Condition Scores
Day
s
Moderate size-moderate milk
Large size-moderate milk
Moderate size-high milk
Large size-high milk
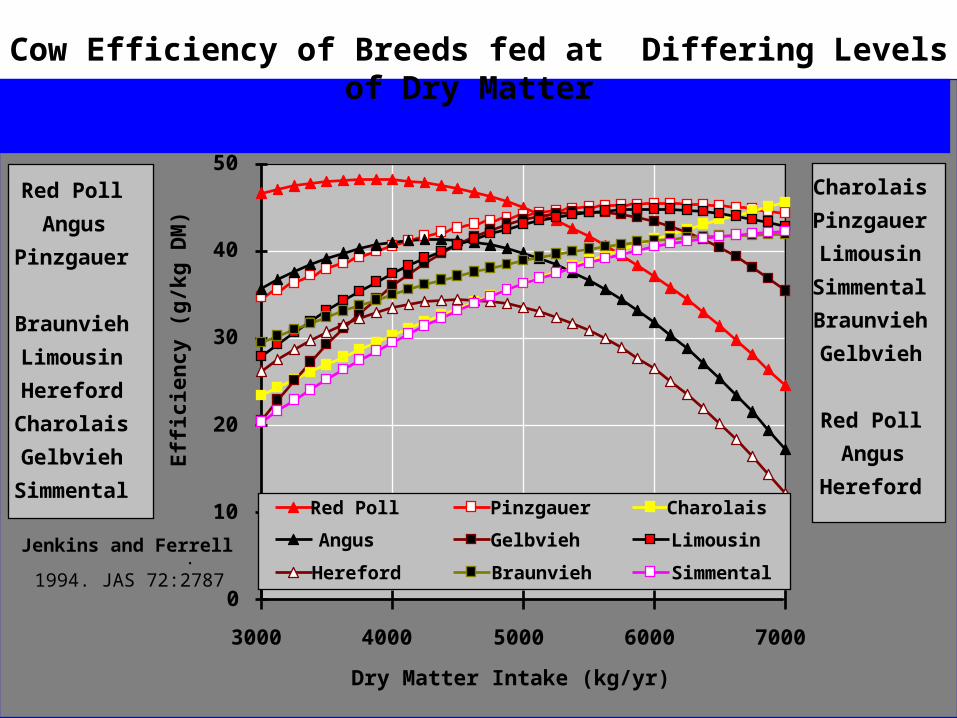
0
10
20
30
40
50
3000 4000 5000 6000 7000
Dry Matter Intake (kg/yr)
Eff
icie
ncy
(g
/kg
DM
)
Red Poll Pinzgauer Charolais
Angus Gelbvieh Limousin
Hereford Braunvieh Simmental
Charolais
Pinzgauer
Limousin
Simmental
Braunvieh
Gelbvieh
Red Poll
Angus
Hereford
Red Poll
Angus
Pinzgauer
Braunvieh
Limousin
Hereford
Charolais
Gelbvieh
Simmental
Jenkins and Ferrell.
1994. JAS 72:2787
Cow Efficiency of Breeds fed at Differing Levels of Dry Matter

Marketing Options:Marketing Options:
WeaningWeaning
BackgroundBackground
StockStock
FinishFinish
Live weightLive weight
CarcassCarcass
GridGrid
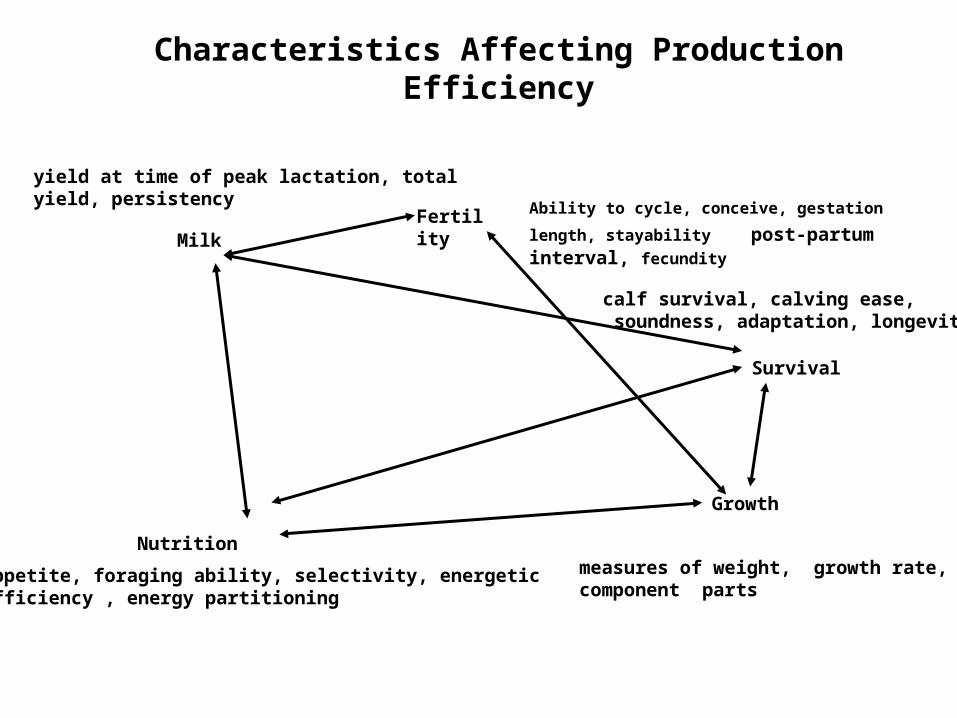
Characteristics Affecting Production Efficiency
Ability to cycle, conceive, gestation length, stayability post-partum interval, fecundity
calf survival, calving ease, soundness, adaptation, longevity
measures of weight, growth rate, component parts
appetite, foraging ability, selectivity, energetic efficiency , energy partitioning
yield at time of peak lactation, total yield, persistency
FertilityMilk
Survival
Nutrition
Growth

Breed Data BaseBreed Data Base
Angus Jersey SalersAngus Jersey Salers
Brahman Limousin ShorthornBrahman Limousin Shorthorn
Braunvieh Longhorn Simmental Braunvieh Longhorn Simmental
Charolais Maine Anjou South DevonCharolais Maine Anjou South Devon
Chianina Nellore TarentaiseChianina Nellore Tarentaise
Galloway Pinzgauer Generic IGalloway Pinzgauer Generic I
Gelbvieh Red Poll Generic IIGelbvieh Red Poll Generic II
Hereford Sahiwal Generic IIIHereford Sahiwal Generic III
Generic IVGeneric IV
Use of DECI requires producers to have:
1. Financial and production records.
Revenue
Costs
2. Feed resources (Quality, amount, when presented to animal)
Grazing
Harvested
Purchased

0
5
10
15
20
25
30
35
40
45
Jan Feb Mar Apr May Jun Jul Aug Sep Oct Nov Dec
Month
Dry matter availability, lbs/d
45
50
55
60
65
70
75
80
TDN of forage
Forage Environment
Daily Dry Matter and TDN Availability

Genetic Potentials of Adjusted Cows Genetic Potentials Birth Mature Condition Milk Weight, lb Weight, lb Score* Peak, lb/d
Adjusted
91.0
1390
7.0
23.0
*Body condition score at 25% empty body fat

Genetic Potentials Birth Mature Condition Milk Weight, Weight, Score* Peak, Biological Type lb lb lb/d
Adjusted Enhanced
91
91
1390
1600
7.0
7.0
23.0
29.0
*Body condition score at 25% empty body fat

Production Parameters to Identify Energy requirements of Cow Herd
Body condition scores
Cow age Calving Breeding Weaning
Cow 5+ 5.0 4.8 4.1
Cow 4 6.0 5.4 5.2
Cow 3 6.1 5.9 5.7
Cow 2 6.1 6.3 6.1
/4.6 /4.5 /4.0
/5.6 /5.2 /5.0
/5.6 /5.6 /5.6
/6.2 /6.0 /6.1
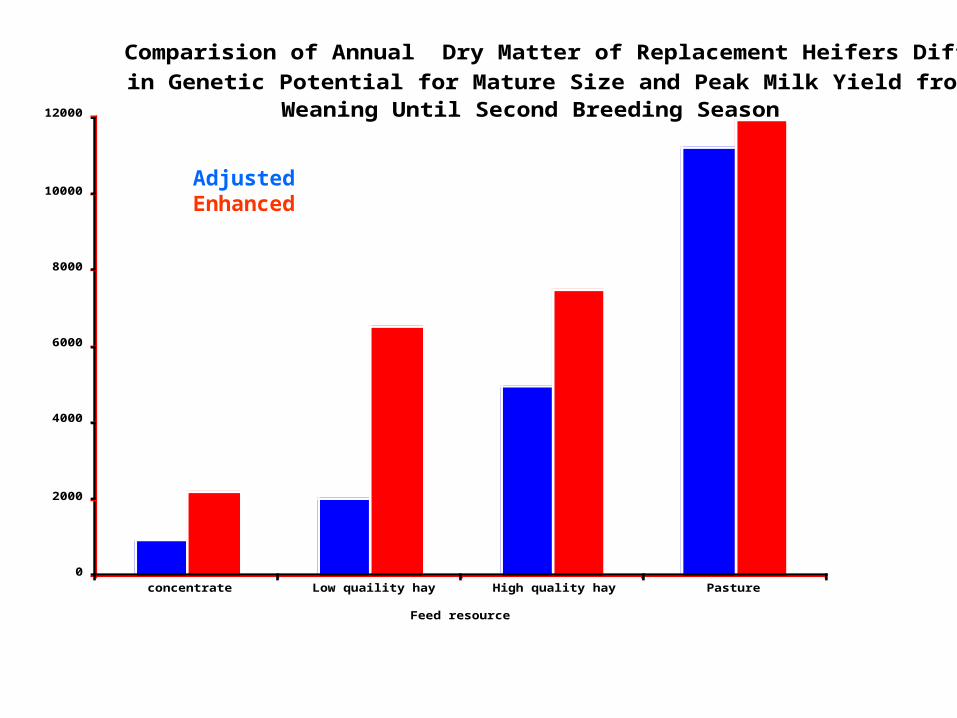
Comparision of Annual Dry Matter of Replacement Heifers Differing
in Genetic Potential for Mature Size and Peak Milk Yield from Their Weaning Until Second Breeding Season
0
2000
4000
6000
8000
10000
12000
concentrate Low quaility hay High quality hay Pasture
Feed resource
Pounds of dry matter annualy
AdjustedEnhanced

Comparison of Annual Dry Matter Requirements of Mature Cows
Differing in Genetic Potential for Mature Weight and Peak Milk Yield
0
1000
2000
3000
4000
5000
6000
7000
8000
9000
10000
Low quality hay High quality hay Pasture
Feed resource
Pounds of drymatter
AdjustedEnhanced

Mature Condition Conception Average Weight, Score* rate weaningTypes lb % weight, lb
Adjusted 1145 5.0 86 450
Enhanced 1414 4.6 87 507
Nine point condition score, at calving
Predicted Performance of Two Types

Production Summary
Predicted Production Inventory Number Weaning Calves Weight Type Weaned Sold, lb
Adjusted 150 Enhanced 120
141 113
63,558 57,279
*Body condition score 9 point scale

Altering the production environment to sustain genetic improvement
Per cow milk yields have more than doubled in the last 40 years, due largely (55%) to genetics. During the same time interval noticeable trends in a reduction to reproduce, increase in the incidence of health problems, and reduced herd life longevity have occurred.
Dr. Toni Oltenacu, Professor, Cornell University
“…. thus environmental conditions existing at any given time will lead the natural selection of genes giving rise to characters in harmony with the environment concerned”Hammond, 1947
Altering the production environment to sustain genetic improvement
Greatest production problem facing cooperate swine producers is sow longevity. Changes in production environment and management protocol (e.g., all in all out management system) has increased the incidence of failure to return to estrus among sows resulting in an industry average of 3 parities per gilt identified for replacement.
Dr. Tom Wise, Research Physiologist, MARC
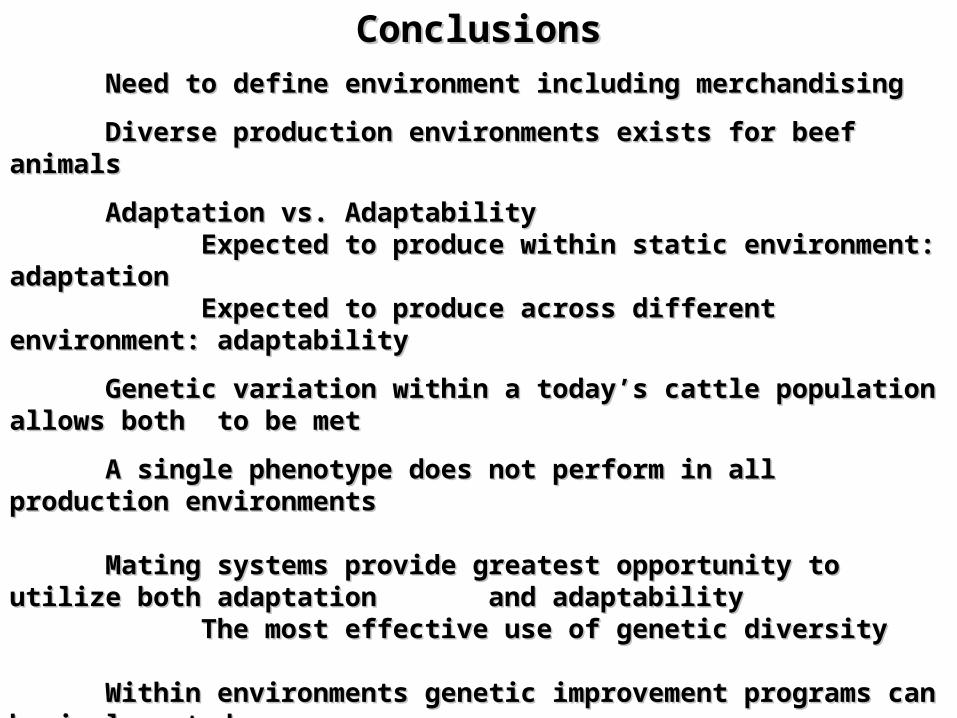
ConclusionsConclusions
Need to define environment including merchandising Need to define environment including merchandising
Diverse production environments exists for beef animals Diverse production environments exists for beef animals
Adaptation vs. AdaptabilityAdaptation vs. AdaptabilityExpected to produce within static environment: adaptationExpected to produce within static environment: adaptationExpected to produce across different environment: adaptabilityExpected to produce across different environment: adaptability
Genetic variation within a today’s cattle population allows both to be metGenetic variation within a today’s cattle population allows both to be met
A single phenotype does not perform in all production environments A single phenotype does not perform in all production environments
Mating systems provide greatest opportunity to utilize both adaptation Mating systems provide greatest opportunity to utilize both adaptation and adaptabilityand adaptability
The most effective use of genetic diversityThe most effective use of genetic diversity
Within environments genetic improvement programs can be implementedWithin environments genetic improvement programs can be implemented
Increasing genetic potential is warrented if cost:benefit ratio associated Increasing genetic potential is warrented if cost:benefit ratio associated with environmental modifications are favorable with environmental modifications are favorable
Consider long term costs to the production environmentConsider long term costs to the production environment

Chic-Filet, 2005