masters thesis: predicting vulnerable files by using
TRANSCRIPT

Delft Center for Cyber Security
Predicting vulnerable files byusing machine learning method
Xiwei Shen
Mas
tero
fScie
nce
Thes
is


Predicting vulnerable files by usingmachine learning method
Master of Science Thesis
For the degree of Master of Science in Computer Science at DelftUniversity of Technology
Xiwei Shen
September 20, 2018
Faculty of Electrical Engineering, Mathematics and Computer Science(EWI) · DelftUniversity of Technology

The work in this thesis was supported by eBay classified group Incorporated. Their cooperationis hereby gratefully acknowledged.
Copyright c© Delft Center for Cyber Security GroupAll rights reserved.

Table of Contents
1 INTRODUCTION 11-1 BACKGROUND INFORMATION . . . . . . . . . . . . . . . . . . . . . . . . . . 11-2 PROBLEMS . . . . . . . . . . . . . . . . . . . . . . . . . . . . . . . . . . . . . 21-3 RESEARCH QUESTION . . . . . . . . . . . . . . . . . . . . . . . . . . . . . . 21-4 RESEARCH SCOPE . . . . . . . . . . . . . . . . . . . . . . . . . . . . . . . . . 31-5 RESEARCH CONTRIBUTION . . . . . . . . . . . . . . . . . . . . . . . . . . . 31-6 READING GUIDE . . . . . . . . . . . . . . . . . . . . . . . . . . . . . . . . . . 4
2 LITERATURE REVIEW 52-1 MACHINE LEARNING . . . . . . . . . . . . . . . . . . . . . . . . . . . . . . . 52-2 MACHINE LEARNING FOR SOFTWARE FAULT PREDICTION . . . . . . . . . 62-3 IMBALANCED DATA LEARNING . . . . . . . . . . . . . . . . . . . . . . . . . 72-4 VULNERABILITY PREDICTION AND DETECTION . . . . . . . . . . . . . . . 8
2-4-1 Code File Level Static Analysis . . . . . . . . . . . . . . . . . . . . . . . 82-4-2 Program Statement Level Analysis . . . . . . . . . . . . . . . . . . . . . 10
3 DATASET AND FEATURES 153-1 DATA RESOURCE . . . . . . . . . . . . . . . . . . . . . . . . . . . . . . . . . 15
3-1-1 Source Code File . . . . . . . . . . . . . . . . . . . . . . . . . . . . . . 163-1-2 GitHub Repository . . . . . . . . . . . . . . . . . . . . . . . . . . . . . . 17
3-2 FEATURE DEFINITION . . . . . . . . . . . . . . . . . . . . . . . . . . . . . . 183-3 FEATURE COLLECTION . . . . . . . . . . . . . . . . . . . . . . . . . . . . . . 19
3-3-1 Code Complexity Metrics . . . . . . . . . . . . . . . . . . . . . . . . . . 193-3-2 Developer Metrics . . . . . . . . . . . . . . . . . . . . . . . . . . . . . . 19
3-4 LABEL DATASET . . . . . . . . . . . . . . . . . . . . . . . . . . . . . . . . . . 223-5 NORMALIZATION . . . . . . . . . . . . . . . . . . . . . . . . . . . . . . . . . 233-6 DATA VISUALIZATION . . . . . . . . . . . . . . . . . . . . . . . . . . . . . . . 25
3-6-1 Feature Value Differential . . . . . . . . . . . . . . . . . . . . . . . . . . 253-6-2 Feature Value Distribution . . . . . . . . . . . . . . . . . . . . . . . . . 26
3-7 Discussion . . . . . . . . . . . . . . . . . . . . . . . . . . . . . . . . . . . . . . 27
Master of Science Thesis Xiwei Shen

ii Table of Contents
4 EXPERIMENTS 294-1 Framework . . . . . . . . . . . . . . . . . . . . . . . . . . . . . . . . . . . . . . 294-2 Training . . . . . . . . . . . . . . . . . . . . . . . . . . . . . . . . . . . . . . . 29
4-2-1 Imbalanced Learning Criteria . . . . . . . . . . . . . . . . . . . . . . . . 304-2-2 Parameter Tuning . . . . . . . . . . . . . . . . . . . . . . . . . . . . . . 31
4-3 Imbalanced Learning Assessment . . . . . . . . . . . . . . . . . . . . . . . . . . 314-3-1 Receiver Operating Characteristics(ROC) Curve Analysis . . . . . . . . . 344-3-2 Probability Analysis . . . . . . . . . . . . . . . . . . . . . . . . . . . . . 34
4-4 Test and evaluation . . . . . . . . . . . . . . . . . . . . . . . . . . . . . . . . . 364-4-1 Feature Importance Analysis . . . . . . . . . . . . . . . . . . . . . . . . 374-4-2 Feature Value Analysis . . . . . . . . . . . . . . . . . . . . . . . . . . . 394-4-3 Probability Estimation Analysis . . . . . . . . . . . . . . . . . . . . . . . 414-4-4 Comparison between feature set . . . . . . . . . . . . . . . . . . . . . . 424-4-5 Investigation on False Positive files . . . . . . . . . . . . . . . . . . . . . 43
4-5 Discussion . . . . . . . . . . . . . . . . . . . . . . . . . . . . . . . . . . . . . . 45
5 DISCUSSION 475-1 Research Work Recap . . . . . . . . . . . . . . . . . . . . . . . . . . . . . . . . 47
5-1-1 Data Collection . . . . . . . . . . . . . . . . . . . . . . . . . . . . . . . 475-1-2 Classifier Training . . . . . . . . . . . . . . . . . . . . . . . . . . . . . . 485-1-3 Testing and Evaluation . . . . . . . . . . . . . . . . . . . . . . . . . . . 48
5-2 Conclusion . . . . . . . . . . . . . . . . . . . . . . . . . . . . . . . . . . . . . . 495-2-1 Research Question 1 . . . . . . . . . . . . . . . . . . . . . . . . . . . . . 495-2-2 Research Question 2 . . . . . . . . . . . . . . . . . . . . . . . . . . . . . 495-2-3 Research Question 3 . . . . . . . . . . . . . . . . . . . . . . . . . . . . . 49
5-3 Future Work . . . . . . . . . . . . . . . . . . . . . . . . . . . . . . . . . . . . . 505-3-1 Exploring features . . . . . . . . . . . . . . . . . . . . . . . . . . . . . . 505-3-2 Labelling source code files . . . . . . . . . . . . . . . . . . . . . . . . . 505-3-3 Unsupervised learning . . . . . . . . . . . . . . . . . . . . . . . . . . . . 50
Bibliography 51
Xiwei Shen Master of Science Thesis

Abstract
Web applications have been gaining increased popularity around the globe, in such a waythat a growing number of users are attracted to make use of the functionality and informationprovided by these applications. While providing solutions to complicated problems in a fastand reliable way is one of the most advantages of using web applications, these platforms cancause adverse effect on user’s life if controlled in unauthorized way by malicious people. Aplatform with more vulnerabilities are more likely to be attacked. This research is focusing onbuilding a prediction model for detecting vulnerabilities of web applications at eBay. Basedon the analysis of important features, we dig deeper to find decisive factors of web applicationvulnerabilities. Making use of data on GitHub, we extract features related to source codefiles and developer networks, such as modification frequency, number of involved developersand duration between two commits. By applying machine learning techniques in the fieldof vulnerability prediction, we are able to provide reasonable suggestions for developersin the beginning phase. This can help develop relative defect-free and well-documentedsoftware. In this paper, we will explain the prediction model in detail from the aspectsof code complexity, developers’ behaviors and their networks. Moreover, according to resultsof various classifiers, we offer possible causes of vulnerabilities and reasonable suggestionsfor avoiding vulnerabilities in the future. To conclude, main contributions of this thesisare valuable feature engineering, the machine learning model and applicable suggestions forpredicting vulnerabilities effectively at eBay.
Keywords Machine learning, imbalanced learning, network theory
Master of Science Thesis Xiwei Shen

iv Table of Contents
Xiwei Shen Master of Science Thesis

Preface
This thesis is the final work of my master study in Computer Science at TU Delft. The thesisproject is performed at eBay as a nine-month internship. The process of production of mythesis work is quite interesting and enjoyable. I would like to express my gratitude to thefollowing people for their help during my thesis project. My dear supervisors Sicco Verwer,who helps me to find this internship opportunity and help me find new research directionswhen I am lost. Thanks to Pieter Hartel and Saeed Sedghi, without their professional guidanceand suggestions, I could not produce so much wonderful work in this research. Dr. MaurícioAniche, who is so nice helping with my graduation process and helping me a lot with thetool that I used to collect GitHub log files, and he is so kind to be my committee member.And my colleague Arnoud Witt, Jack Schilder and Nico Mossel, they are the kindest peopleI have met here. Without their assistance and support, this internship would be much difficult.
I would also like to thank all my dear friends. Their support and their accompany makesmy life much more happy. Besides, I would like to give my thanks to my best friend, HanxiWang. With her encouragements from China, I feel fulfilling all the time.
At last, I would like to express many gratefulness to my dear parents, who support mydecisions all the time and always give their best wishes to my life!
Xiwei ShenSeptember, 2018
Master of Science Thesis Xiwei Shen

vi Table of Contents
Xiwei Shen Master of Science Thesis

Chapter 1
INTRODUCTION
1-1 BACKGROUND INFORMATION
Nowadays, web applications are widely used in many of our daily activities on the Internet.More and more Hackers now work on hacking these web applications by putting efforts intofinding available vulnerabilities exposed in web applications. A web application vulnerabilityis a hole or weakness in the application that allows an attacker to do harm to applicationowner, users and other entities that rely on the application. Normally, a vulnerability iscaused by a design flaw or an implementation bug. How to detect and fix web applicationvulnerabilities is a fundamental and important problem for e-commercial platform runners toconcern about. In order to help reduce the number of vulnerabilities caused by implementationbug during the development process, most Internet companies apply security check tools orget help from third-party security testing companies. Both these security check tools andsecurity check companies do almost the same thing: using an existing regulation libraryto do testing on applications and then generate reports. There are also some differencesbetween them: security check tools have the full access to source code, so they are able todetect existing vulnerabilities and their corresponding code file or code line; Security testingcompany can only point out which web page has which kind of vulnerability and generatereliable vulnerability reports since they do testing work on client side.
The whole security process is shown below: First, developers develop platforms. Second,doing regularly security check on their implemented platform and receiving security reportsfrom security analysis tools or security check companies. Third, storing security reports intoan internal system and assigning tasks to different groups. Forth, responsible developersdo modifications on the source code to fix a specific implementation bug based on securityreports. At last, security check companies would do validation on each bug and generate anew report to show the state of these bugs. This procedure is proven to be favorable forreducing the number of vulnerabilities existed in each platform. However, there are alsodrawbacks. Normally, the whole process of detecting vulnerabilities and fixing them mighttake over months. Developers are required to do a large amount of repeating work and this
Master of Science Thesis Xiwei Shen

2 INTRODUCTION
is expensive. Meanwhile, none of these steps in the procedure can prevent developers fromcreating web application vulnerabilities.
This project is aiming at achieving two goals in the end. First, finding main causes of webapplication vulnerabilities from perspectives of code characteristics and developer factors.Code characteristics can be achieved from source code files, and developer factors are quantifiedby analyzing Github commits history. Second, intuitively describe what do those featurevalues indicate. Based on statistical data analysis, giving reliable suggestions for developmentgroup in order to prevent making vulnerabilities from the very beginning. Third, building avulnerability detection model by using a machine learning technique.
1-2 PROBLEMS
The research on vulnerability detection is never stopped. Various tools are created to helpdevelopers find vulnerabilities during their application development, and most of them arestatic analysis tools. The major shortage of static analysis tools is that they are more likelyto provide false positive vulnerable results. Despite, the static analysis tool is only able todo alarm on having vulnerable source code line or file. Although these tools have a goodperformance on having a good overview and understanding of source code files, includingsecurity check functions and package designed structure, they do not have access to learnhow developers behaved during the application development, but human factors are directlyrelated with the appearance of vulnerabilities. Due to the widespread of version controlsystem Git, it is possible to trace developer work from beginning till the end.
1-3 RESEARCH QUESTION
For the sake of achieving these goals mentioned in section 1, this thesis would focus onintroducing methods to extract features about source code complexity, developer behavior,and developer network. To structure this research project and select the research directionto proceed in each stage, several research questions are set up and will be answered based onthe experiment results.For completing this research step by step, three research questions are defined in the firstplace:
• How to quantify developer works on each source code file from developer working logfiles?By learning from developer working log files, we can focus on studying the aspectsof extracting features from the developer network and calculating developer workingpattern by going through all the commit history. The method to build a completedeveloper network will be described in Chapter 3.
• What suggestions can be made to adjust developer behaviors based on collected metricsby using data analysis method?
Xiwei Shen Master of Science Thesis

1-4 RESEARCH SCOPE 3
In this big data era, data-driven strategies are much more reliable and efficient since aresult is supported by a large amount of history data. This research also emphasizes theimportance of having results from analyzing data, and this research will mainly use datavisualization method to support my conclusion because it directly shows the differencebetween features and classes.
• Is code complexity, developer behavior and developer network metrics important fordetecting web application vulnerabilities? Which one is most important to distinguishvulnerable files from normal files?Based on the study on accessible data resource, I select three aspects to study further.The feature collection procedure is a basic and significant procedure for building a wholemachine learning project. To make this project meaningful, project result should beinstructive. For instance, if code complexity is the killer of application safety accordingto the result, developer groups should be reminded of avoiding making complex codefile.
In conclusion, these research questions are settled to guide the procedure of building aprediction model for web application vulnerabilities. At the same time, analyzing collectedfeatures to find main causes of vulnerabilities, then giving suggestions for developers to adjusttheir behavior. At last, evaluating and proving the value of this research.
1-4 RESEARCH SCOPE
This research involves several areas, One part of these areas is data engineering on accessibleraw data including data collection, data pre-processing, feature measurement and data labeling.Another part is about classification by different machine learning technique, and imbalancedlearning is specially introduced to this project due to the characteristic of the collected dataset. Despite, this research also contains a comparison between different evaluation criterionand data analysis methods to answer my research questions. Among these different parts,feature measurement quality is the dominant factor that would influence the performance ofmy designed prediction model.In this research, I study all aspects of a program developer and quantify their contributionto each file and their role in each development group based on the study result. After havingthe input data for machine learning scheme, I only choose to use the traditional machinelearning classifier instead of using neural network or deep learning technique because myavailable data set size is rather small. For making my prediction model performs better onpredicting vulnerabilities, more efforts are paid to tune classifier parameters and select thebest-performed classifier by testing and comparing different classifiers. For supporting theexperimental result, more result analysis would be made at last.
1-5 RESEARCH CONTRIBUTION
In this thesis, we provide a solution based on the prediction model that aims at discoveringthe behavior of the developers into security posture of products. Our solution provides amodel that predicts security vulnerabilities based on the application development behavioral
Master of Science Thesis Xiwei Shen
4 INTRODUCTION
features, such as the duration and rate of modifying application source codes, using machinelearning techniques. The contributions of our vulnerabilities prediction model are as follows:
• Provide insightful information on the impact of the behavior model of the applicationmodel into the security vulnerabilities.
• Provide root causes of appearing vulnerabilities in the applications.
• Provide insight on how to adjust features and development parameters in such a waythat vulnerabilities are can be considerably reduced.
• Provide visibility on how to allocate and prioritize technology resources on developmentplatforms based on the vulnerability prediction model
1-6 READING GUIDE
In Chapter 2, first introducing some basic knowledge related with this research, then havingreviews on related papers of prediction models for vulnerability and implementation bug andalso point out which part is used for this research. Chapter 3 is all about the input dataof this research, including introducing data resources, details of how to calculating definedfeatures. The experimental procedure is shown in Chapter 4, starting with proposing mydesigned framework, to describe all technical details during each step. This chapter aimingat showing the performance of this model is reliable. In Chapter 5, After recapping the wholeresearch, I will make some discussions on the result and classifier performance, also presentfeature relation figures to make suggestions for developers on their daily work. Furthermore,listing future works in this research area.
Xiwei Shen Master of Science Thesis

Chapter 2
LITERATURE REVIEW
This chapter will have a review of papers about detecting software failure or vulnerabilitiesand how machine learning techniques can be used in the security area. I will first introducesome papers Quite a number of researchers have already made efforts on studying how todetect injection attack risk hole in web applications from different aspects.
This Chapter consists following parts: The first section gives an overview of machine learningtechniques, especially supervised learning algorithms, which is related to this research. Thesecond section introduces how to using machine learning techniques to do software faultsprediction, also propose the importance of having an imbalanced learning method into considerationwhen building a fault prediction model in Section 3. In the last section, I highlight severalpapers building vulnerability prediction models from different aspects, and according to theirstudy object, I categorize these researches into two types, including code file level analysis andprogram statement level analysis. Despite looking into their design of procedure, I mainlyfocus on discussing their selected features that are used in the model.
2-1 MACHINE LEARNING
Machine learning technique is widely used for data analysis to build prediction models.According to recent papers, machine learning techniques, which are widely used these days,can be divided into three categories: supervised learning, unsupervised learning and reinforcementlearning. To conclude, a supervised learning method can only learn from labeled training data,and on the contrary, unsupervised learning does not require the access to the label of data.Especially, reinforcement learning does not have a restriction on using labeled and unlabeleddata. This method is designed to learn from feedback that is retrieved from its interactionwith the environment. After considering the advantages and disadvantages of different typesof machine learning methods, I decided to use supervised learning for this research. Supervisedlearning algorithms can be used to train a model of class labels distribution, and this model isable to predict class labels for testing instances. An example of supervised learning algorithms
Master of Science Thesis Xiwei Shen

6 LITERATURE REVIEW
process flowchart is shown in Figure 2-1, this whole process is also called classification. Thisis the foundation of my designed prediction model as well. It is essential to select which
Figure 2-1: The process of supervised learning[1]
classification method to use for a certain problem. There is a review on several widelyused supervised learning algorithms in [1]. To decide which classifiers are more suitablefor this research, first I look into their pros and cons. In paper[1], the author pointed outthat comprehensibility of Decision Tree make this classifier helpful for understanding why aninstance is assigned to a certain class, and Decision Tree is a suitable choice when dealing withdiscrete features. Linear Discriminant Analysis(LDA) and Naive Bayes are both statisticallearning algorithms, which can provide a probability about labeling an instance. Moreover,in order to meet the requirement of this research, accuracy, tolerance to noise, the risk ofbeing overfitting and explanation ability are some vital aspects to consider when selectingclassifiers. These models are considered in this research.
2-2 MACHINE LEARNING FOR SOFTWARE FAULT PREDICTION
Most classifiers expect equal distributed class data, unfortunately, vulnerabilities detectingtraining data are more likely to be imbalanced data, since there are always more neutralfiles existed than vulnerable files in a development project. This directly resulted in havingimbalanced data for learning.
Xiwei Shen Master of Science Thesis
2-3 IMBALANCED DATA LEARNING 7
Imbalanced learning result is not reliable, because imbalanced learning can make a classifiercompromise on achieving better performance instead of predicting its actual label. He et al.[2]summarized different kinds solutions for imbalanced data. The sampling method is a way todo acceptable modifications on imbalanced data in order to achieve a balanced distributeddata, such as oversampling and undersampling. Another way to deal with imbalanced datapursue creating a balanced distributed data, instead, setting cost matrices to describe thecosts for misclassifying a data, this kind of method is called a cost-sensitive method.
Wang et al. in their paper[3] emphasized that a well-designed software defect predictionshould have a balance between defect detection rate and overall performance. It is the samefor vulnerability detection.
2-3 IMBALANCED DATA LEARNING
Because of the class distribution skew problem, it is a crucial issue to deal with imbalanceddata learning in this research. According to the study on existed techniques, there are severalmethods to deal with the imbalances:
Assessment Metrics
For assessing the performance of the classifier on training and testing balanced data, previousresearches used accuracy and error rate as an important evaluation metrics. However ifthe classifier can assign all instance into the majority class, the accuracy value could bestill high, but it is not an ideal classifier we want to have. Thus, this research chooses touse precision, recall, G-mean, balance, ROC curve and AUC value. Intuitively, precisionrepresents exactness about labeling correctly. On the contrary, recall is a measure of howmany instances belong to the positive class were labeled correctly. G-mean value is expressedas the geometric mean of recall values of both the positive and negative classes, a classifierwith a good performance should have higher G-mean value. Balance is retrieved by measuringthe distance between a certain (precision, recall) point to the ideal point on the ROC curvewhich is (0,1). ROC curve plots the true positive rate (TPR) against the false positive rate(FPR) with various discrimination thresholds. AUC measures the area under the curve, whichcan be used as a good evaluation criterion.
Sampling Techniques
Overall, there are two methods suitable for sampling imbalanced data, including randomunder-sampling and random oversampling. The idea of these two sampling methods israndomly adding(removing) a randomly selected dataset from minority(majority) class tomake the whole set becoming balanced. However, these random sampling methods have someshortages. The under-sampling method would cause information loss to majority class, andthe oversampling could bring about the over-fitting issue on minority class. Due to a limitednumber of vulnerable files, this research only uses random oversampling on the dataset.
Master of Science Thesis Xiwei Shen

8 LITERATURE REVIEW
Generating Synthetic Data Samples
Methods of generating synthetic data samples are aiming at creating new data samples tosolve the over-fitting issue. Among existed methods, SMOTE[4] and ADASYN[5] are widelyused within imbalanced learning area. By using SMOTE method, the minority class isover-sampled by adding new synthetic samples along the line segments joining any/all ofthe k nearest neighbors of each sample in minority.[4] But SMOTE method cannot avoidcreating overlapping samples, ADASYN is another method to prevent having an overlappingproblem. This method would create new data samples based on minority class distribution.Despite, there is a research[6] on combining SMOTE and standard boosting method to utilizetheir ability to deal with unbalanced data.
2-4 VULNERABILITY PREDICTION AND DETECTION
According to the study object of their researches, we can categorize them into two kinds:
2-4-1 Code File Level Static Analysis
This paper[7] drew a conclusion that data mining static code file attributes are useful fordetecting web application vulnerabilities. They argued that whether to use complexity metricsduring building prediction models are meaningless, since how to use these metrics are moreessential than select which metrics to use. It raised two important issues while building themodel.
• In a prediction model, when target detecting class (here it means the vulnerable class)is in the minority, accuracy value cannot represent the performance of the predictionmodel.
• The aim of their designed predictor is to detect true positive defects on future projects,so self-test result is not reliable.
To deal with issue 1, despite calculating prediction accuracy, they measured the confusionmetrics to calculate false alarm rates, detected rates in this situation. For issue 2, instead ofusing the self-test method, they selected attribute subset iteratively by M*N cross-evaluation,where the dataset is divided into N buckets, and for each bucket performed M-way cross-evaluation.After comparing the performance of different classifiers, they determined to use Naive Bayes(with log-transforms) in their predictor.
Vulnerable Code Change
The Vulnerable code change is defined by Bosu et al. in paper[8]. This paper identified whichcharacteristics that indicate which code changes are more likely to contain vulnerabilitiesby analyzing several open source software. There are three main aspects studied in thispaper, including code attributes, code commit characteristics, and human factors. Theyprocessed mining procedure on peer code review data since peer code review data documented
Xiwei Shen Master of Science Thesis

2-4 VULNERABILITY PREDICTION AND DETECTION 9
rich discussion between developers regards to potential vulnerabilities. In the aspect ofcharacteristic of developers, this paper raised two hypothesis, first one is "Does an author’sexperience affect the likelihood of writing vulnerable code changes", second one is "In caseswhere an open source project is sponsored by an organization, are authors employed by thatorganization less likely to write vulnerable code changes than other authors?" By buildingthe initial set of keywords. This kind of text mining method for detecting vulnerabilitiescan also be used in mining GitHub commit comments data. However, most developers didnot develop a reliable coding habit during their work, and their commit comments are morelikely to be "fix all things" which has no meaning for text mining. So we can not collect richcommit-comment database for analyzing the characteristics of vulnerable code changes in thisproject.
Characteristic of Applications and Vulnerabilities
Scandariato and Walden[9] designed a new model to predict a component of the application islikely to be vulnerable or not via text mining technique. They generated a vector of monogramfrequency to represent each java file as independent data.
During the development of detecting vulnerabilities, researchers looked into different levelsto extract features that can be used for detection from a project. Some try to relatecharacteristics of the software product itself with vulnerabilities, for example, studying thecomplexity of the source code. Another aspect is to study characteristics of the process ofcode development by tracking developers behavior or modification on the file.
Shin first discussed whether software complexity relates to the appearance of vulnerabilitiesor not in his early research[10]. By using metrics tools, they collect the following featuresto numerically present software complexity, including cyclomatic complexity with differentmeasurement methods, nesting complexity, number of possible paths, number of lines andexecutable statements. After drawing a conclusion that a vulnerable file seems to be morecomplex than a neutral file in this early work, he started another study taking both aspectsinto account including internal and external characteristics in his paper[11]. They madethree hypotheses for establishing complexity metrics: First, vulnerable files are more complexthan neutral ones. Second, vulnerable files have a higher unit complexity than neutral ones.Third, vulnerable files have a higher coupling than neutral ones. Forth, vulnerable files havea lower comment density than neutral ones. In addition, they also made hypotheses oncode churn. For example, a higher code churn results in vulnerable files, frequent check-insmakes vulnerable files, and vulnerable files have more lines of code that have been changedthan neutral files. As have mentioned before, developer activity was also considered, theymade following hypotheses for developer network: vulnerable files are more likely to havebeen worked on by non-central developers, vulnerable files are more likely to be changed bymultiple, separate developer clusters than neutral files.
Based on these hypotheses above, they collect corresponding metrics from the project, andthen do an evaluation on each metrics categorizes by using discriminant analysis. It turns outthat organizations can use complexity and developer activity metrics to proactively improve
Master of Science Thesis Xiwei Shen
10 LITERATURE REVIEW
software security.
Predicting Vulnerabilities by Measuring Code Churn
Code churn is a measure of modifications happened during development an application or asoftware, and it can be extracted from development log files, which are recorded by a versioncontrol system. Despite recording basic information about one change, such as responsibledeveloper, modification time, a version control system is able to show the difference betweenprevious versions and later versions. And these information are all the basis of code churnmeasurement.
To study further about the relationship between vulnerabilities and code churn metrics, it isalso meaningful to look into those researches which is relating software defect density withcode churn. Tracing back to 2005, Nagappan et al.[12] used statistical regression modelsto prove that although absolute measures of code churn have weak relationship with defectdensity, they calculate several relative measures of code churn is a good predictor of softwaredefect density.
Predicting Vulnerabilities with Exploring Developer Network
Shin is not the only one that takes developers network into account while studying softwarevulnerabilities. Meneely[13] explored the relationship between software failure and developernetwork. In order to quantitative variations on the centrality and connectivity of a developernetwork, they capture the number of developers working on same source code file, andcalculate the betweenness of node v based on equation below, where θst(v) is the numberof geodesic paths from developer s to t passing through node v and θst is the total number ofpaths from s to t. Pointing out that a developer with high betweenness means being centralin the network.
B(v) =∑ θst(v)
θst(2-1)
[14] [7] After building a developer network based on code churn information, then summingup metrics of developers who contribute to one file to present file-based metrics. Comparisonswere made to examine the performance of the promoted model in practice, including comparingthe source-lines-of-code basic model with promoted model and comparing model containingcode churn metrics only or network metrics only with this promoted model. According totheir study, a degree was positively correlated and closeness was negatively correlated withsoftware failure. Their conclusion motivates this research to take developer network of aapplication into consideration.
2-4-2 Program Statement Level Analysis
Another type of study object is the program statements. Unlike file level study, statementstudy on predicting vulnerabilities considers more about input and output data.
Xiwei Shen Master of Science Thesis

2-4 VULNERABILITY PREDICTION AND DETECTION 11
Detection Model Based on Taint-based Analysis
In spite of having an overview on the whole context file, researchers also looked deeper intosource code by studying each statement inside to precisely detect the location of existingvulnerability. Shar first started his work [15] on proposing a method to detect and automaticallyremove XSS vulnerability. Their job can be mainly divided into two different phases. Todetect potential XSS vulnerability, they used taint-based analysis technique which is a typicalstatic analysis on detecting vulnerabilities. In the second phase, they designed two stepsto remove XSS vulnerability. Firstly, identifying the statements referenced by untrusteddata in an HTML output statement can be escaped without influencing intended HTMLoutputs and security aspects. Then extracting the HTML document structure surroundingeach untrusted data from the source code and using pattern matching to identify the HTMLcontext. Secondly, generates secure code structures using ESAPI’s escaping APIs, whichcreated by OWASP[16], as replacements for the original code, and this process is fullyautomatic.
However, taint-based static analysis, which is based on predefined regulations to determinewhether the source code is vulnerable or not, could cause a large amount of false positiveresults during the practical use.
Detection Model Based on Hybrid Analysis
Philipp’s paper[17] introduced tainting-based dynamic method to detect malicious part. Datataint starts from marking untrusted data as malicious data, then propagate through theprogram and track the propagation. By following this procedure, traditional server-sideprotection mechanisms like [18] [19] could successfully prevent tainted malicious data frombeing used. Unlike traditional tainting-based approaches applied on the server side, Philippproposed an approach on the client side by modifying Firefox Web browser. Meanwhile, hepointed out that dynamic techniques cannot be used for detection of all kinds of controldependencies, so their "dynamic" tainting method is actually a mixture of static and dynamictechniques in order to achieve a full protection against XSS attacks.
So based on Balzarotti’s paper[20], Shar promoted a new prediction model for preventinginjection attack by introducing hybrid analysis to collect features from the source code. In thefirst place, Shar focused on studying two vulnerabilities including SQL injection and cross-sitescripting in shar2013mining, and using a data dependence graph to present a web program.Each node in the dependency graph that they were studying during feature selection andclassification was "sink". A sink is a program statement that would interact with a databaseor web client. According to their static and dynamic analysis, they extract 22 attributes fromthe data dependence graph and use them as input to train and test classifiers. To collect thestatic analysis attributes for each sink, Shar used an open source analysis tool called Pixy[21], which is specially designed for analyzing PHP language.Afterwards, Shar wrote another paper[22] that leverage control dependency information insteadof data dependency one to make some progress on this prediction model. Despite, moreefforts on classifying method was also made by introducing a semi-supervised classifier into
Master of Science Thesis Xiwei Shen
12 LITERATURE REVIEW
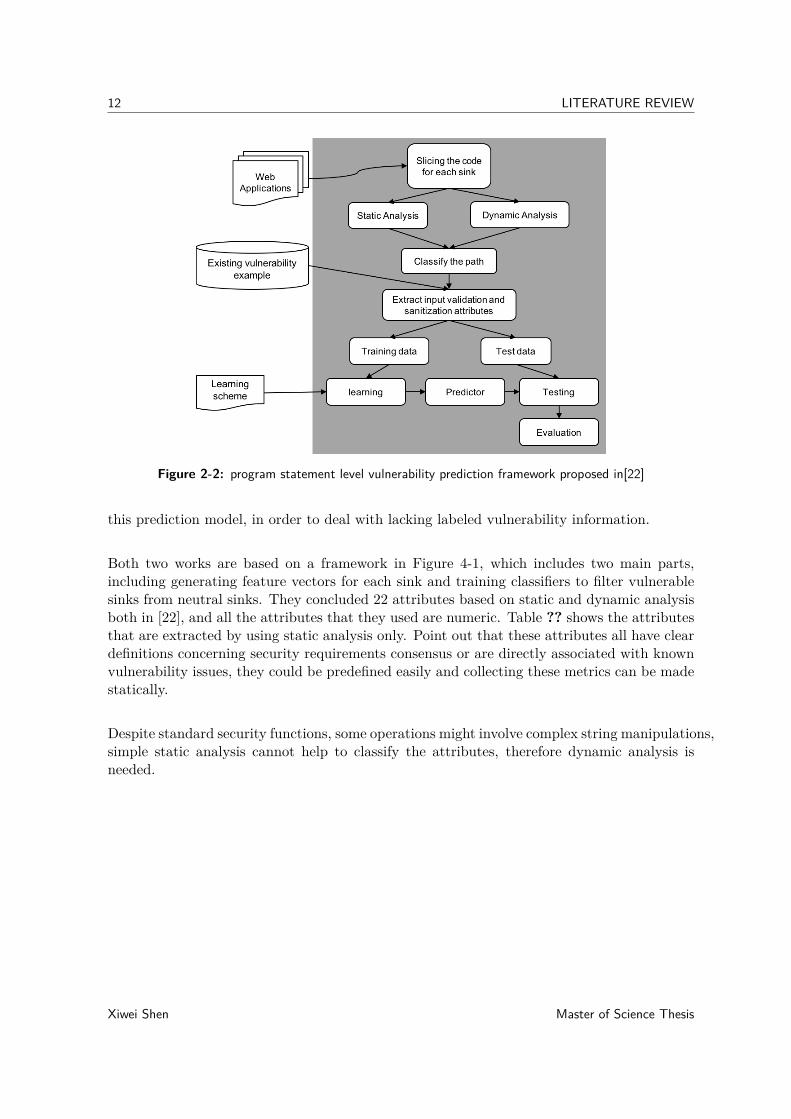
Figure 2-2: program statement level vulnerability prediction framework proposed in[22]
this prediction model, in order to deal with lacking labeled vulnerability information.
Both two works are based on a framework in Figure 4-1, which includes two main parts,including generating feature vectors for each sink and training classifiers to filter vulnerablesinks from neutral sinks. They concluded 22 attributes based on static and dynamic analysisboth in [22], and all the attributes that they used are numeric. Table ?? shows the attributesthat are extracted by using static analysis only. Point out that these attributes all have cleardefinitions concerning security requirements consensus or are directly associated with knownvulnerability issues, they could be predefined easily and collecting these metrics can be madestatically.
Despite standard security functions, some operations might involve complex string manipulations,simple static analysis cannot help to classify the attributes, therefore dynamic analysis isneeded.
Xiwei Shen Master of Science Thesis

2-4 VULNERABILITY PREDICTION AND DETECTION 13
Article Approach Focusing area LimitationSharand Tan2011[15]
Taint-basedStaticAnalysis(Java)
Detection of storedand reflected XSSvulnerability
high false positive rate inresults by using taint-basedstatic anaylsis, might misssome vulnerabilities sincethe method do not trackinformation flow across webpages.
Sharand Tan2013[23]
HybridAnalysis(PHP) +cluster
Detection of SQLinjection and XSSvulnerability
Not accurate as full static ordynamic analysis
Sharand Tan2015[22]
HybridAnalysis(PHP) +semi-supervised
Detection of SQLinjection and XSSvulnerability
static and dynamic analysisresults are acheived by usingPixy[21]
Table 2-1: Comparing different detection model
Master of Science Thesis Xiwei Shen

14 LITERATURE REVIEW
Xiwei Shen Master of Science Thesis

Chapter 3
DATASET AND FEATURES
This project focuses on studying three main aspects of the GitHub repository, includingsource code complexity, developer network structure and developer behaviors. This Chapterwill be separated into the following section: First, it would focus on describing what kind ofresources I can get access to extract features for detecting vulnerabilities, and explaining whyI use them for my project. Then, the definitions of all features selected to generate a featurevector are shown in the second section, also briefly introduce the methods of calculating thesemetrics. Next, noticing values from different platforms are differ from each other, I introducednormalization process. At last, using visualization method to present the feature values andgeneralize useful suggestions to developer team.
3-1 DATA RESOURCE
This project focus on three main aspects of the GitHub repository and the data was providedby eBay company, including source code complexity, developer network structure and developerbehaviors during constructing platforms. A raw dataset consists of all JavaScript source codefiles and whole commit history files from GitHub.
• Source code filesThis project is a code file level study, we treated each file as a unit. Every featurewe used here is for constructing a feature vector for each file. In the previous studyon detecting vulnerabilities in applications, researchers studied the relationship betweensource code complexity and vulnerabilities, based on their result, we designed to extractcomplexity metrics from source code file to study further.
• GitHub commit historyThe human factor, which is usually being neglected during designing a defect detectionmodel, is actually an important aspect to look further. One way to learn aboutdevelopers habits is to conduct a survey on developer group and gathering the information.But limited valid data can be retrieved from this survey, and by this way, updating
Master of Science Thesis Xiwei Shen
16 DATASET AND FEATURES
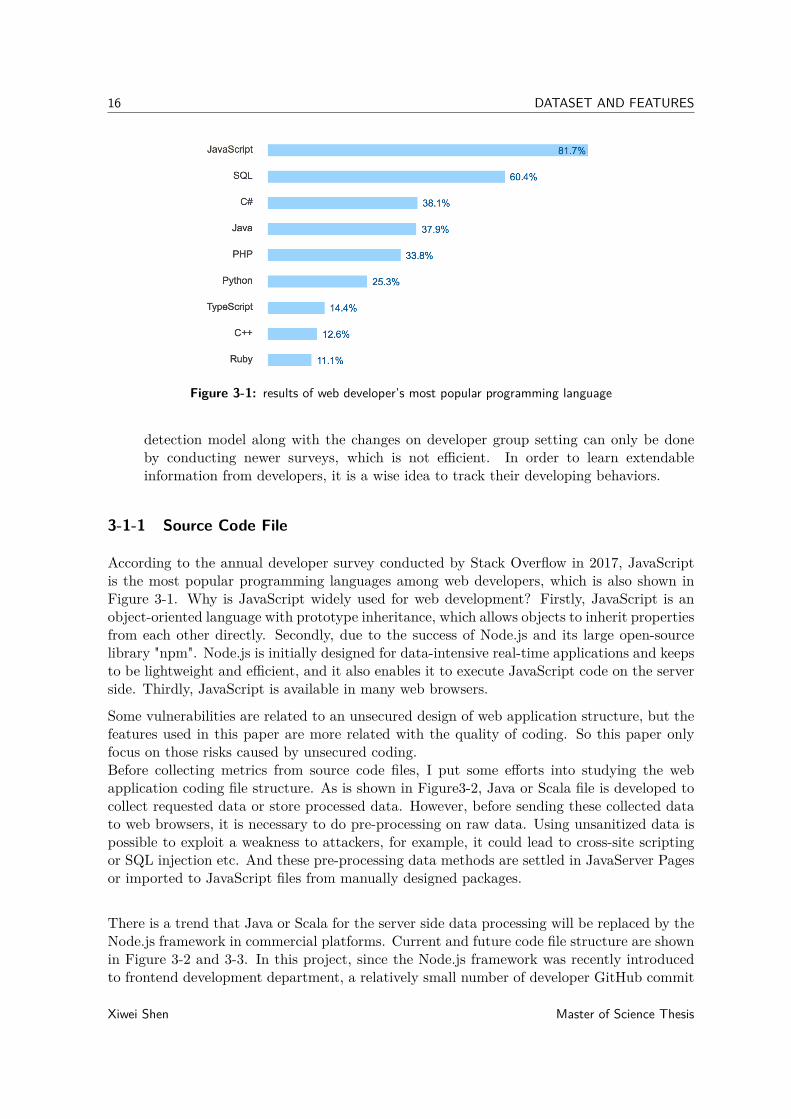
Figure 3-1: results of web developer’s most popular programming language
detection model along with the changes on developer group setting can only be doneby conducting newer surveys, which is not efficient. In order to learn extendableinformation from developers, it is a wise idea to track their developing behaviors.
3-1-1 Source Code File
According to the annual developer survey conducted by Stack Overflow in 2017, JavaScriptis the most popular programming languages among web developers, which is also shown inFigure 3-1. Why is JavaScript widely used for web development? Firstly, JavaScript is anobject-oriented language with prototype inheritance, which allows objects to inherit propertiesfrom each other directly. Secondly, due to the success of Node.js and its large open-sourcelibrary "npm". Node.js is initially designed for data-intensive real-time applications and keepsto be lightweight and efficient, and it also enables it to execute JavaScript code on the serverside. Thirdly, JavaScript is available in many web browsers.
Some vulnerabilities are related to an unsecured design of web application structure, but thefeatures used in this paper are more related with the quality of coding. So this paper onlyfocus on those risks caused by unsecured coding.Before collecting metrics from source code files, I put some efforts into studying the webapplication coding file structure. As is shown in Figure3-2, Java or Scala file is developed tocollect requested data or store processed data. However, before sending these collected datato web browsers, it is necessary to do pre-processing on raw data. Using unsanitized data ispossible to exploit a weakness to attackers, for example, it could lead to cross-site scriptingor SQL injection etc. And these pre-processing data methods are settled in JavaServer Pagesor imported to JavaScript files from manually designed packages.
There is a trend that Java or Scala for the server side data processing will be replaced by theNode.js framework in commercial platforms. Current and future code file structure are shownin Figure 3-2 and 3-3. In this project, since the Node.js framework was recently introducedto frontend development department, a relatively small number of developer GitHub commit
Xiwei Shen Master of Science Thesis

3-1 DATA RESOURCE 17
history for Node.js based frontend file package can be used to study further. Current structurein Figure 3-2 has been used for more than 7 years, and adequate commit history record isavailable in GitHub repository.
Figure 3-2: current frontend code file structure
Figure 3-3: future frontend code file structure
3-1-2 GitHub Repository
With the rapid increase in the popularity of decentralized source code management(DSCM),GitHub becomes one of the most important resources of software artifacts on the Internet[24].A large number of works on mining GitHub’s event logs have proven the rich informativenessthat GitHub owns. In essence, GitHub is an online version control system. As mentionedin Chapter 2, previous researches have already related software defect with code churnmeasures, and proven the close relations between them. This paper was inspired by the idea ofassociating web application vulnerabilities with code churn measures. Moreover, the previousstudy put efforts on discovering the relationship between developer network characteristicsand software failures. On the foundation of their research, I introduce social network analysisinto my research. In order to have basic information about developers, I pay attention tothe information provided by a version control system. It is easy to build a developer networkbased on GitHub repository data.GitHub is a popular social coding site that uses Git as its distributed revision control andsource code management system.
Master of Science Thesis Xiwei Shen

18 DATASET AND FEATURES
3-2 FEATURE DEFINITION
As briefly introducing some researches of predicting software fails and web application vulnerabilities,various of aspects can be selected to study further. Considering all accessible resources andaim of this research, this research will look at three aspects: code complexity, developerbehavior, and developer network. For preparing the feature vector of this project, a largenumber of calculations is needed. The target of feature engineering procedure in this study isto define some distinguished features to identify files from different classes and format thesefeature vectors as the input of the selected machine learning algorithm.
Code Complexity Metrics Code quality assurance is the foundation of preventing vulnerabilities.Despite a limited number of vulnerabilities are caused by inappropriate framework design,most of them are code-level related. In this project, complexity metrics are collected torepresent objective code quality by applying static analysis. Halstead[25] and McCabe[26]’smetrics are collected. Definitions of these metrics are shown in the following:
• path: the file path to be used as an index
• sloc: physical line of codes, which is the number of lines in a module or function
• cyclomatic: the number of cycles in the program flow control graph.
• cyclomatic density: a percentage of cycles in the logical lines of code
• operator: the total number of operators
• operand: the number of distinct operands
• vocabulary: the sum of distinct operators and operands
• length: the sum of appearance times of operators and operands
• difficulty: D = η12 ×
N2η2
where η1 is number of distinct operators, η2 is number of distinctoperands, N2 is total appearance number of operands.
• maintainability: derived from the logical lines of code, the cyclomatic complexity, andthe Halstead effort.
Developer Behavior Metrics In order to quantify the developer’s behavior during development,I used the information from GitHub commits. Each commit includes basic information aboutwho edited the code, when it happened, which line is modified. By crawling all GitHubcommit history per each platform, we are able to compute some basic metrics and somederived metrics that are showed below:
• num_churn: the total number of modification times on source code file
• duration: the number of days since each code file was created till last edited date
• frequency: the average number of commits within a day
Xiwei Shen Master of Science Thesis

3-3 FEATURE COLLECTION 19
• commit_du: the average duration between two commits
• num_dailychurn: count the number of days that a code file changes were committedseveral times a day
• num_dev: the number of developers who have done contribution to this file
• work_dev: the number of developers who are still making contributions to this file
• leave_dev: the number of developers who stopped contributing to this file.
Developer Network Metrics The measurement of features for each file is based on developernetwork measures, so it is necessary to create a developer network first. In this undirecteddeveloper network, each node represents a contributed developer and we add edges betweentwo nodes when both of them do contribution to the same code files. To quantify developernetwork, graph theory is introduced to this project.
• degree: the sum/average of each developer’s degree
• closeness: the sum/average of each developer’s closeness centrality
• betweenness: the sum/average of each developer’s betweenness
3-3 FEATURE COLLECTION
3-3-1 Code Complexity Metrics
Since each file is characterized by looking into three different aspects, the method of collectingdifferent metrics for each one varies from each other. In this project, in order to identify thesefiles, the unique index is their file path. As described before, we only focus on collectingattributes from JavaScript files in this project. For analyzing JavaScript files, Phil Boothimplemented an open source tool called "PLATO"[27] on the basis of Halstead’s and McCabe’stheory for generating code complexity statistical report. "PLATO" is able to find all JavaScriptfile existed in the development package automatically, and it returns a JSON file report thatcontains all details of each JavaScript file.
3-3-2 Developer Metrics
In order to compute code churn measures and characteristics of the developer network,we should have data that records what developers have done during the development. Inorder to crawl GitHub commitments history from the GitHub repository, this research usesPyDriller [28], which eases the commitment information extraction procedure. PyDriller isable to write a detailed record. According to the author’s description, there are two domainobjects showing below:
Master of Science Thesis Xiwei Shen

20 DATASET AND FEATURES
• Commit This domain object is designed to store all the information related to acommit:the hash(which is a unique code for each commit), the committer (who havethe right to confirm a commit), the author (who does the modifications), the message(comments left by author), the authored and committed dates (useful for computingsome features like frequency and duration), a list of its parents’ hashes (a merge commithas two parents), and the list of modified files (create a new domain ’Modification’ tostore the information about each modified file).
• Modification modification object is settled to carry information about file modificationin a commit history, and this object has several fields:
– Filename: name of the modified file– OldPath: path of the file before modification– NewPath: path of the file after modification– Change Type: including ADD, RENAMED, MODIFY, DELETE– Difference: code line difference between versions, and shown in Git way.– Added: the number of added code lines– Removed: the number of removed code lines
Developer Behavior Metrics
Before computing developer behaviors and developer network metrics, the first step is doinginitial cleaning on these commit records, and it is an important step regarding modificationtype. According to the definition, there are four main kinds of different modifications. Amongthem, only ADD, MODIFY, DELETE operations are valid modifications to be consideredduring calculating developer behavior metrics. It is because that RENAMED operation hasno impact on the code quality and no relationship with the existence of web applicationvulnerabilities.
Not all information provided by Git will be used in this research, developer behavior featuresare only related with author identity and time. Table 3-1 shows all defined developer behaviormetrics with their corresponding Git commit information details, in other words, these metricsare measured by considering this information. The computation for these features are directlyderived from Git commit information, but we have to make sure that the definition of thesefeatures is in accord to actual situation of code files. The challenging part of collectingdeveloper behavior related metrics is to determine the definitions of these features. It iscrucial to define duration because frequency and commit_du both depend on it. I generatetwo reasonable definitions based on the understanding of software development life circle, oneis measuring days since a file was created till it was last edited, another one is calculatingdays of existence. In order to determine which one to use in this research, I visualize thedistribution of duration with these two definitions separately, details and proven are shownin section 3-6.
Despite duration, work_dev and leave_dev also have ambiguous meanings in actual use. Thesetwo features are initially designed to categorize developer with contributions. Most Internet
Xiwei Shen Master of Science Thesis

3-3 FEATURE COLLECTION 21
Feature Related Git Commit Infonum_churn NewPath, Change Typeduration NewPath, commited date, Change Typefequency NewPath, commited date, Change Typecommit_du NewPath, commited date, Change Typenum_dailychurn NewPath, commited date, Change Typenum_dev NewPath, authorwork_dev NewPath, commited date, authorleave_dev NewPath, commited date, author
Table 3-1: Developer behavior features with corresponding Git commit information
companies have multiple developer groups working on diverse projects, it is common to havea high turnover of technical personnel within them. Instead of collecting active developername list from each developer group manually, this research settles an automatic methodto distinguish working developer and left developer by seeing their commitments history. Ifa developer stop contributing to a file over months, it is possible that this developer wasmoved to other teams or had already left the company. So, we can categorize these inactivedevelopers into left developer regarding each code file. On the contrary, the developer whohas done contribution to this file within months will be categorized into working developer.How to determine the boundary between the working developer and left developer is discussedin section 3-6.
Developer Network Metrics
Unlike measuring developer behavior metrics, collecting network metrics for each file toquantify the developer’s experience and group work quality are based on network analysis.In this part, we will introduce graph theory and social network analysis.
In network analysis, each vertex is called nodes in a network graph, and every edge betweentwo nodes is named as a connection. Despite these two essential elements, a sequence ofnon-repeating, adjacent nodes is a path, and the shortest path between two nodes is called ageodesic path. From the perspective of social network analysis, a geodesic path is the “socialdistance” from one node to another in social network analysis.
In terms of characteristics of code files, it is unrealistic to do social network analysis on a codefile network directly, so procedure of collecting network metrics per each file can be dividedinto two phases:
• Constructing Developer Network In this undirected network, each vertex noderepresents an individual developer, including active and inactive developers. The connectionbetween two developers represents that they have worked on the same code file before.Moreover, the weight of the edge between nodes is accumulated by the times they worktogether. An example network graph is shown in Figure 3-4, in this figure, I colorededge with large weight (more than 3 times) in Red and other edge are colored by Orange.
Master of Science Thesis Xiwei Shen

22 DATASET AND FEATURES
• Collecting Developer Network Metrics By introducing social network analysisinto this research, we can quantitatively measure the structure of a developer network.According to the previous study, metrics that measure direct connections between vertexnodes are connectivity metrics, and other metrics that measure how each node areindirectly connected to the rest of nodes in the network are centrality metrics. Thetarget of applying graph theory in this research is to interpret network structure ina statistical way. Among all network metrics, this research will use degree, closenessand betweenness to study further. All these 3 metrics all have intuitive meaning in adeveloper network. Degree can represent how experienced a developer is by calculatinghow many developers and files he/she had worked with. Closeness is derived fromshortest path measures, which can be used to show the way of each developer workingwith others. Betweenness is a metrics can evaluate whether the developer is usuallythe center of the team or not. Defined measurement equations for closeness andbetweenness are shown below, where σst(v) is the number of geodesic paths from nodes to t going through node v, σst is the total number of geodesic paths from node s to tfor betweenness, and |V (G, v)| is the number of reachable nodes in the graph of node v,dG(v, t) is the number of edges from node v to t.
Closeness(v) =∑
s,t,v∈G
σst(v)σst
(3-1)
Betweenness(v) = ( 1|V (G, v)|)
∑v,t∈G
dG(v, t) (3-2)
• Generating Network Metrics for each File After quantifying the experience ofdevelopers and the way they work with others, the next step is to use these collecteddeveloper network metrics to measure each file. From GitHub log file, I can collect a listof contribution developers for each file. Based on previous steps, we have developer-basednetwork metrics already. When determining file-based network metrics, I use the averageand sum of developer-based metrics.
3-4 LABEL DATASET
The web application is facing with various types of vulnerabilities, but in general, they canbe categorized into two main kinds based on the causes of them, including design flaw andimplementation bug. Obviously, most design flaws are hard to detect by only analyzingindividual source code files. In this research, only implementation bugs caused vulnerabilitiesare considered.
When doing classification on these data sample by using machine learning algorithms, we donot subdivide web application vulnerabilities into specific kinds of vulnerabilities. It meansthat dataset in this research only is binary, in other words, a file can only be vulnerable ornormal. For labelling collected files, we have two resources. One is vulnerability reportsprovided by third party security testing company. Another one is reports generated byautomatic security check tools. The major difference between these two kind of resources
Xiwei Shen Master of Science Thesis

3-5 NORMALIZATION 23
Figure 3-4: An Developer Network Example Presented by Graph
package code file number vulnerable file numberpck1 156 4pck2 452 2pck3 146 7
Table 3-2: Package information: Total number of JavaScript files and number of vulnerable files
is that testing company has no access to source code files, so they can only point out whichwebsite is vulnerable. While security check tools have full access to all data files, the detectionresult of these tools are accurate to the source code file. I show the number of vulnerablefiles along with number of all existing code files separately for each package in Table 3-2. Inaverage, there is only one vulnerable file within 58 files. So when designing the predictionmodel for this research, I need to consider how to deal with imbalanced data in priority.
3-5 NORMALIZATION
In this research, data samples are collected from different development packages and platforms.For improving the performance of classifiers, it is essential to have data set in value consistence.To see whether values collected from different packages are consistent, I visualize the distributionof each feature.
The distribution of feature duration and line of code (sloc) is shown in Figure 3-5 as examples.
Master of Science Thesis Xiwei Shen

24 DATASET AND FEATURES
The duration metric represents the existence days of a file, and the value could be influencedby several factors, for example when the platform was established, how often the frameworkversion was updated. As a result, the distribution of duration varies from development packageto package. The duration of package 3 ranges from 0 to 350, however that of package 1distributed from 0 to around 2000. The distribution of sloc metric is similar to duration sincethe distributions of metric values are quite different between these packages.
Due to the inconsistency within different packages that I used, the normalization processis necessary before learning patterns from these collected data. In this research, I apply"min-max" normalization strategy which transforms x to y following the equation below:
y = x−minmax−min
(3-3)
The density curve of duration and sloc are plotted in Figure 3-6. Apparently, the dataset afternormalization process is consistent between different packages, and the value ranges from 0to 1 without influencing the original value distribution.
(a) duration (b) line of code
Figure 3-5: Feature value distribution before Normalizing
(a) duration (b) line of code
Figure 3-6: Feature value distribution after Normalizing
Xiwei Shen Master of Science Thesis

3-6 DATA VISUALIZATION 25
Figure 3-7: Difference feature value between vulnerable and normal files
Files are labelled by using results of different detection tools
3-6 DATA VISUALIZATION
In order to better understand the data I collected in this research before carrying out furtherpre-processing procedure on the dataset, data visualization is helpful for concluding initialresults. In this initial analysis, I select two prospects to study further.
3-6-1 Feature Value Differential
Here, I use the dataset before normalization procedure to visualize the difference, the majorproblem is that feature values varies greatly from each other, which means the difference valuecan range from single digit to thousands. For showing difference value of various metrics inthe same figure, an equation is defined in 3-4, where Average is the average number of allmetric value.
Diff = Avg(Normal)−Avg(V ulnerable)Average
(3-4)
The difference value of each metrics can be influenced by which files are included in Normaldata samples and Vulnerable samples separately. Two factors can determine what files areincluded in each sample, including using reports generated by different vulnerability detectiontools to label source code files and files belong to different platforms. When visualizing thedifference, I utilize control variate method. In Figure 3-7, all files are from the same platform,but labels of these files are determined by results of different detection tools. And in Figure3-8, files from different platforms are labelled based on Checkmarx result.
A feature, which is worth to be study further, is always with positive(negative) differentialvalue, no matter how the influential factors are changed. As is shown in the figure, days ofhaving frequent modification (num_dailychurn) and duration between two commits (commit_du)might be greatly influenced by using different detection tools result and also using files fromdifferent platforms. In conclusion, prediction results that is based on these two features mightbe unreliable.
Master of Science Thesis Xiwei Shen

26 DATASET AND FEATURES
Figure 3-8: Difference feature value between vulnerable and normal files
Files belongs to different platforms
3-6-2 Feature Value Distribution
In this section, by visualizing the distribution of normal and vulnerable files’ feature valuesseparately, some initial results can be derived from comparing the data from two classes.Figure 3-9 shows the distribution of four features, including duration, num_dev, leave_devand vocabulary. Duration measures the time that a file exists, the value distribution indicatesthat most of the normal files have shorter existence time. Several vulnerable files have existedfor a long period of time, which make it different from most normal files. num_dev is ametric to count how many developers have contributed to a file. More people can producemore implementation bugs, while more people are more likely to discover the bugs and fixthem. Various factors can influence the relation between developer and vulnerability. As canbe seen from the figure, most normal files have contribution from only 2 to 4 developers. Alsothe distribution between 2 to 8 of vulnerable files is similar to normal files, so when assigningworks to developer, 2 to 4 developer in a team is enough for developing a file. On noticing thefrequent personnel changes, attentions are also paid to analyse whether number of left peopleare related with web application vulnerabilities. The figure shows that vulnerable files aremore likely to have more people left the group. The last figure is related with code complexitymetrics. When vocabulary is larger, the file is more complex. As can be seen from the figure,vulnerable files are more complex than normal files.
Another important aspects in this research is introducing network theory into evaluatingdeveloper group work. In Figure 3-10, I first display the relationship between closeness anddegree derived from network structure. It is obvious that degree value increases along withthe increase of closeness value. We can also interpret the relationship as that experienceddeveloper group tends to work more closely to each other. The other two plots show thedistributions of these two file-based network metrics. closeness density curve shows that peakpoint of normal file density curve is with larger avg_closeness value than that of vulnerablefiles, which indicates that a development team with close collaboration is more successful inmaintaining files to be secured. Different from the density curve of avg_closeness, the majorityof normal files are developed by group of developers having low degree value. However, it isalso obvious that none of the vulnerable file is developed by a group of rather experienced
Xiwei Shen Master of Science Thesis

3-7 Discussion 27
developers.
(a) duration (b) number of contribution developers
(c) number of left developers (d) vocabulary
Figure 3-9: Feature value distribution of normal and vulnerable files
3-7 Discussion
In conclusion, code complexity metrics can be achieved from inspecting source code filesthemselves, and the static metrics related with developer behavior can be extracted fromGitHub log files directly. In order to measure the metrics of developer team, it is necessary tointroduce social network theory into this research. Despite collecting feature values, labelingeach file is also the foundation of supervised learning. Since this research uses the results ofcheckmarx security report, file labels might have false positive results. However, this issuecould be solved in the future. To analyze collected data, I inspect the facts by visualizingthese values by using different kinds of visualization methods.
According to the information that can be learned from these visualization figures in thisChapter, several suggestions are proposed for developers or development group managerto consider about. To clarify these suggestions clearly, I also divided them into different
Master of Science Thesis Xiwei Shen

28 DATASET AND FEATURES
(a) Relationship between closenessand degree
(b) average of closeness (c) average of degree
Figure 3-10: File-based network metrics relation and distribution
categories.
Source code files
• Avoid creating complex source code files. The prevention methods include dividing afile into small parts, each function is implemented in an individual file.
• Accelerate the pace on updating the package framework. From the duration metrics,we can know that some files have existed for a long time. If the framework of packagesare frequently updated, there would be not that much old files which exist over 3 yearsin a development package.
Developer team
• For each file, 2 working developers is enough to maintain the security problem. Bycalculating how many developers are still contributing to each file, it turns out themaintainence work do not require a large group of developers. Assigning more peopleis a waste of resource and also has risk on creating more security issues.
• Prevent developers from leaving the developer team. According to the study, it showsthat number of left developers is related to the appearance of vulnerabilities.
• Motivate developers to work closely with each other. In order to enhance the collaborationbetween developers, it is also important to have experienced developers in the team.
For supporting code complexity and developer related metrics are important for buildingvulnerability prediction model, the next chapter would first introduce the prediction modelframework for this research and doing different aspects of analysis on the prediction result toanswer the research questions raised in the beginning of this thesis.
Xiwei Shen Master of Science Thesis

Chapter 4
EXPERIMENTS
This Chapter includes three parts to introduce the experiments in this research. The firstsection describes an overview of the structure of my designed framework. Then, I will explainthe details of each procedure in this experiment, including the settlement of training andtesting parts, along with introducing data pre-processing procedure and evaluation metrics ormethods that would be used to compare the performance of classifiers. Finally, to understandthe testing results generated by this prediction model, different prospects are selected to studyfurther.
4-1 Framework
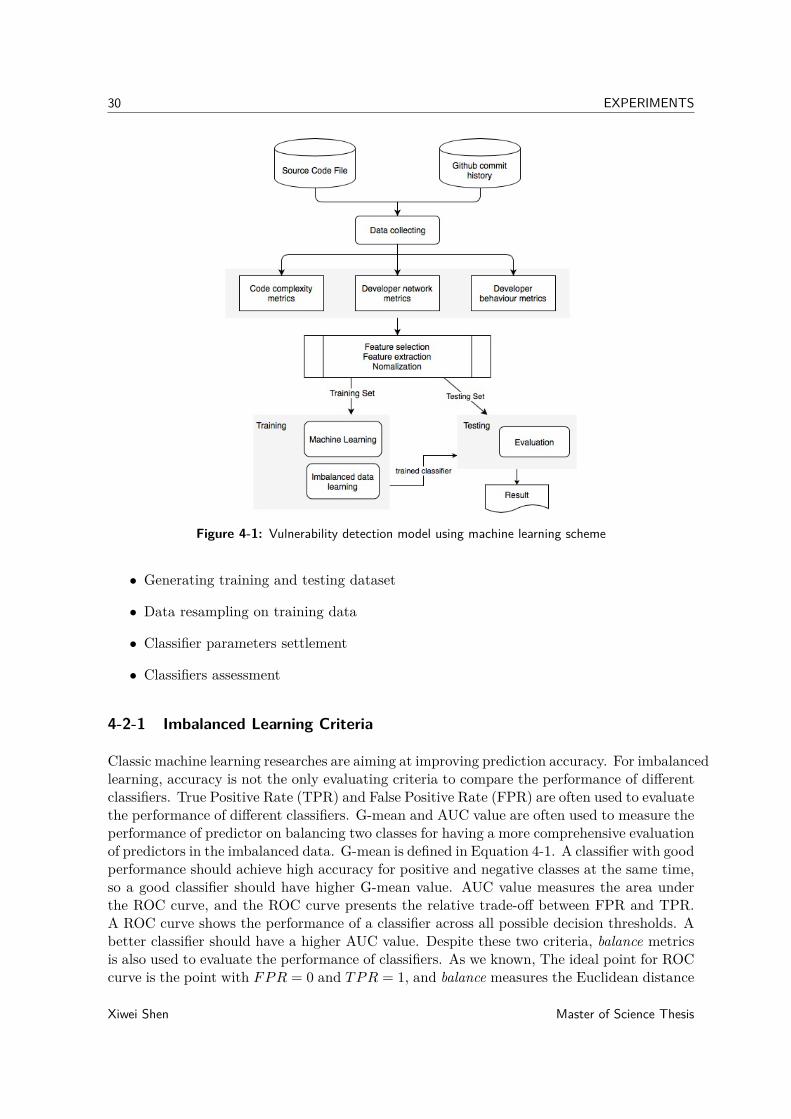
In Chapter 3, I describe the way of cleaning the dataset. These collected data are the inputof my designed prediction model. In Figure 4-1, I present the framework of this predictionmodel. Follow the diagram; the whole process starts with cleaning raw data and collectingfeatures from source code files and GitHub commit history. Because of using different aspectsto inspect the raw data, the collected features can be categorized into three kinds. Afterward,I do feature normalization on feature values, and this procedure should be done for differentplatform file separately. Then, the whole dataset would be divided into two parts: thetraining set and testing set. During the training process, the main purpose is to achieve abest-performed classifier that can be used to generate the final result of this model in thetesting phase. Finally, analyzing the obtained result to the reasoning why it is a good modelor not regarding system setting, and concluding instructive information to give suggestionsto platform developers.
4-2 Training
The whole procedure follows the procedures below:
• Feature extraction by Principle Component Analysis(PCA)
Master of Science Thesis Xiwei Shen
30 EXPERIMENTS
Figure 4-1: Vulnerability detection model using machine learning scheme
• Generating training and testing dataset
• Data resampling on training data
• Classifier parameters settlement
• Classifiers assessment
4-2-1 Imbalanced Learning Criteria
Classic machine learning researches are aiming at improving prediction accuracy. For imbalancedlearning, accuracy is not the only evaluating criteria to compare the performance of differentclassifiers. True Positive Rate (TPR) and False Positive Rate (FPR) are often used to evaluatethe performance of different classifiers. G-mean and AUC value are often used to measure theperformance of predictor on balancing two classes for having a more comprehensive evaluationof predictors in the imbalanced data. G-mean is defined in Equation 4-1. A classifier with goodperformance should achieve high accuracy for positive and negative classes at the same time,so a good classifier should have higher G-mean value. AUC value measures the area underthe ROC curve, and the ROC curve presents the relative trade-off between FPR and TPR.A ROC curve shows the performance of a classifier across all possible decision thresholds. Abetter classifier should have a higher AUC value. Despite these two criteria, balance metricsis also used to evaluate the performance of classifiers. As we known, The ideal point for ROCcurve is the point with FPR = 0 and TPR = 1, and balance measures the Euclidean distance
Xiwei Shen Master of Science Thesis

4-3 Imbalanced Learning Assessment 31
from the real (FPR, TPR) point to (0, 1). The higher balance is, the better a classifier is.
G−mean =√recall(1− FPR); balance = 1−
√(0− FPR)2 + (1− recall)2
√2
(4-1)
4-2-2 Parameter Tuning
Before comparing the performance of using different classifiers to predict vulnerabilities, it isessential to ensure. To help to improve the result, I introduce an oversampling method todeal with the imbalanced issue and PCA method to avoid over-fitting. The process of tuningparameter for these two methods are shown below.
Oversampling Method
SMOTE method is widely used in the imbalanced learning area. This special oversamplingmethod is designed to simulate the distribution of data samples existed by creating syntheticnew data. According to previous researches, smote_ratio, which is a parameter that cancontrol the percentage of data to be resampled. For finding which ratio value for SMOTEmethod can improve the performance of the prediction model. Concretely, I apply a 5-foldcross-validation method to this research. To avoid the random situation, each run wouldrepeat five times. In total, a classifier along with using the same oversampling ratio willhave 5*5 results, which means every point in Figure 4-2 is the average number of 25 results.Moreover, in order to compare the performance, we consider all three metrics mentioned in theprevious section for both training and testing data. Details in figures can tell the increasingof G-mean and balance along with increasing SMOTE ratio value. Meanwhile AUC valuefluctuates by using different SMOTE ratio. So the decision on SMOTE ratio depends onfinding the highest AUC value. In summary, for Naive Bayes, I choose to use 0.4 as the ratio;For the Random forest, 0.4 is also the most suitable choice; For Decision tree, 0.5 is moresuitable; For logistic discriminant analysis, 0.5 is also a reasonable value.
Principle Component Analysis
In total, I collect 26 features for about 1000 files from three different aspects of platformdevelopment. However, most classifiers are not good at dealing with the high dimensionaldataset, so we need to do feature selection or extraction to reduce dimensions of the dataset.Feature extraction is a procedure of transforming raw data into new features space which issuitable for modeling. Among all feature extraction methods, PCA is one of the most popularmethod for data science research. Generally, PCA compute the eigenvectors of a covariancematrix with the highest eigenvalues, uses those vectors to transfer the original data into anew feature space with n components. Selecting how many components to be used as inputof this prediction model can influence the performance.
4-3 Imbalanced Learning Assessment
In this research, I select four supervised learning algorithms to classify collected files.
Master of Science Thesis Xiwei Shen

32 EXPERIMENTS
(a) Naive Bayes
(b) Random Forest
(c) Decision Tree
(d) Logistic Discriminant Analysis
Figure 4-2: Evaluation on using Different Smote Ratio
Xiwei Shen Master of Science Thesis
4-3 Imbalanced Learning Assessment 33
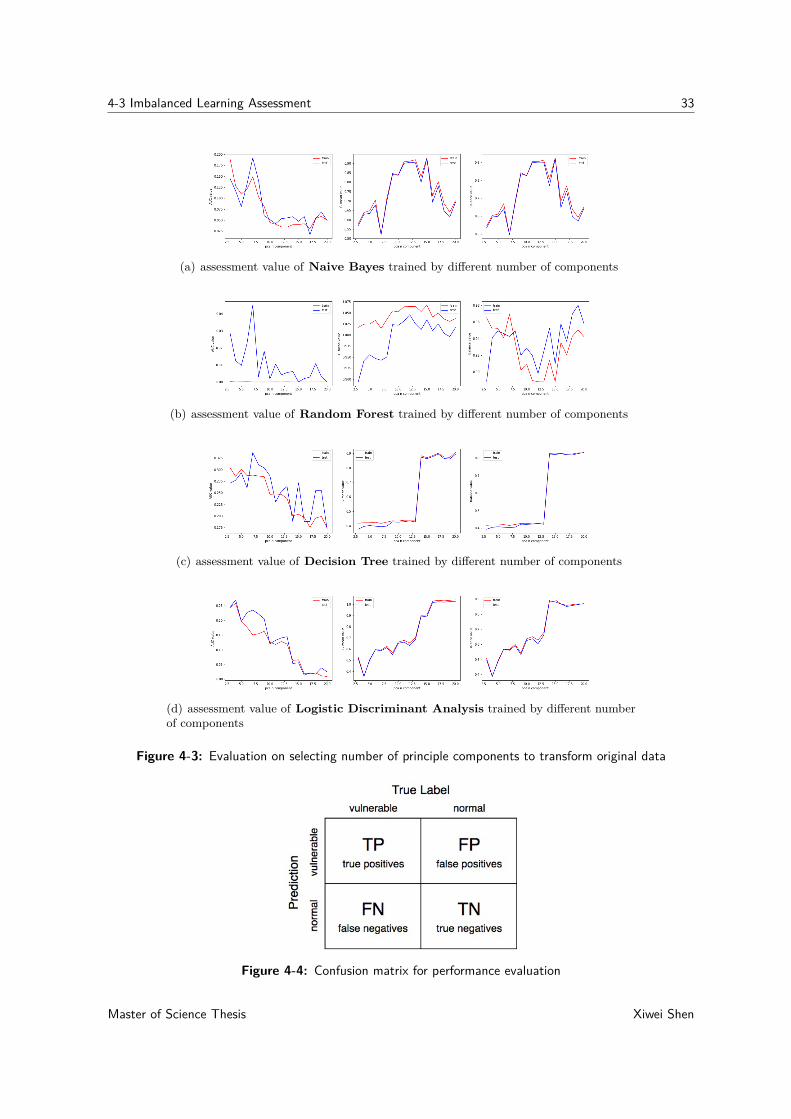
(a) assessment value of Naive Bayes trained by different number of components
(b) assessment value of Random Forest trained by different number of components
(c) assessment value of Decision Tree trained by different number of components
(d) assessment value of Logistic Discriminant Analysis trained by different numberof components
Figure 4-3: Evaluation on selecting number of principle components to transform original data
Figure 4-4: Confusion matrix for performance evaluation
Master of Science Thesis Xiwei Shen

34 EXPERIMENTS
(a) Logistic Discriminant Analysis (b) Decision Tree
(c) Random Forest (d) Naive Bayes
Figure 4-5: Machine learning algorithms comparison based on ROC curve and AUC value
4-3-1 Receiver Operating Characteristics(ROC) Curve Analysis
In order to inspect how different machine learning algorithms performs in this designedprediction model, most researches on imbalanced data learning used ROC curve to presentthe relative trade-off between FPR and TPR. During this part, I apply 4-fold cross-validationon the experiment. Therefore, each fold can have an adequate number of vulnerable files.After tuning the parameters of classifiers, Figure 4-5 plots ROC curves of different supervisedlearning algorithms. One method to evaluate these classifiers is to compare their AUC values.Instead of computing the average number of AUC values from four folds, I compare the AUCvalue generated by these classifiers under using the same fold. Logistic Discriminant Analysishas the highest AUC value in Fold 0 and 1, and Random Forest ranks the first in Fold 3.However, it is difficult to compare each point in the ROC curve, so I need to introduce anothercomparison method to this research.
4-3-2 Probability Analysis
Despite computing metrics used in previous researches to evaluate the performance of selectedmachine learning algorithms, it is worthwhile inspecting which kind of data samples is more
Xiwei Shen Master of Science Thesis
4-3 Imbalanced Learning Assessment 35
likely to be labeled as ’Vulnerable file’ by our prediction model regarding their feature values.In total, this research collects 13 vulnerable files from 4 different platform developmentpackage. The idea of this comparison is similar to presenting the ROC curve, but is morestraightforward to understand than ROC curve method.
Cost is defined as how many normal files are misclassified when labeling all vulnerable filescorrectly based on the probability estimates calculated by machine learning algorithms pereach file. In Table 4-1, we list all vulnerable files with its probability of being vulnerableand probability estimation descending ranking. Ranking number directly shows the cost oflabeling a vulnerable file. For example, the probability of file 635 being labeled as ’vulnerable’ranks 7, which means first seven files with higher probability estimation will be classified tothe vulnerable category if file 635 is marked to be vulnerable. These labeled ’vulnerable’ fileswould include several normal files, and these normal files are named as false positives. Theideal situation is that a classifier can be distinct from all these listed vulnerable files withoutproducing any false positives result. From this perspective, we can compare the cost value toevaluate the performance of selected classifiers.
In order to collect probability estimation for each vulnerable file calculated by differentclassifiers, we use two different methods. First one is to generate a resampling dataset byusing SMOTE method and then we train the classifiers on these resampling data. Then,using selected classifiers to test original dataset without resampling process and record theprobability estimations. Finally, sorting source code files according to their probabilityestimations and recording their probability ranking place. Results are all shown in Table4-1. Another one is introducing cross validation idea by separating the dataset into five folds;each fold is then used once as a validation set while the remaining folds make up the trainingset. This result is presented in Table 4-2.
We can set several perspectives to analyze which classifier gives the best performance accordingto these two tables. First, we compare the cost of discovering all vulnerable files. Learningfrom the Table 4-1, by using Logistic Regression and Naive Bayes classifier, we know thatvulnerable file index 672 is the one most likely to be treated as a normal file with lowprobability estimation calculated by these two classifiers. It ranks the 559th and 624thplace separately. However, the results of random forest vary for these two classifiers. Itshows the confidence in categorizing file index 672 into vulnerable class, which probabilityestimation is 100 percent. Although an ideal predictor can discover all vulnerable files, thisaim is always hard to be realized. So we need a trade-off between high true positive rateand low false positive rate. Considering this issue, I set another inspection on the cost ofdiscovering 80 percent of vulnerable files. In other words, how many files will be labeled asvulnerable, if we want to have ten true positives? In this way, the random forest classifier stillgives the best performance by categorizing all ten vulnerable files into positive class withoutproducing any false positive. Learned from the table, decision tree result is different fromother classifiers. Due to its settlement, the probability estimation value is binary. In order tocompare decision tree’s performance with other classifiers, the third perspective is designedto compute the average and variance value of file ranking result. Since a large number ofnormal files are classified to Vulnerable, the average cost of all vulnerable files estimated bydecision tree is expensive, but the standard variance is comparatively low. In other words,
Master of Science Thesis Xiwei Shen

36 EXPERIMENTS
File Naive Bayes Random Forest Decision Tree Logistic RegressionRank Probability Rank Probability Rank Probability Rank Probability
672 559 0.0600 1 1.0000 437 0.1546 624 0.1266737 123 0.4029 1 1.0000 107 0.4847 201 0.3842738 122 0.4036 1 1.0000 107 0.4847 200 0.3849581 288 0.1595 13 0.5083 107 0.4847 496 0.1759710 0 0.9999 1 1.0000 437 0.1546 0 0.9400588 495 0.0860 11 0.7000 437 0.1546 490 0.1772734 92 0.4633 1 1.0000 107 0.4847 54 0.628648 284 0.1605 8 0.9000 107 0.4847 155 0.4344722 113 0.4186 10 0.8000 169 0.4847 180 0.4101153 1 0.9912 1 1.0000 107 0.4847 2 0.8222635 58 0.5363 8 0.9000 107 0.4847 97 0.51847124 5 0.8329 1 1.0000 107 0.4847 115 0.490230 80 0.4831 8 0.9000 437 0.1546 174 0.4159
Average 170.7 0.4821 6.1 0.8745 243.9 0.3834 214.5 0.4575Std 176.1 0.3059 3.9 0.1362 161.7 0.1569 190.2 0.2174
Table 4-1: Prediction score value with its ranking based on different machine learning algorithms
decision tree founds that truly vulnerable files are more similar to each other. In conclusion,all these three aspects indicate that random forest gives the best performance among thesefour selected classifiers.
The method of analyzing Table 4-2 is different from previous analysis since each rankingvalue in this table is a relative score comparing to other files in the same fold. We can notcompare file ranking or probability estimation between files from different folds directly. Whenstudying this table, I also start with two different angles. First, we inspect vulnerable filesin the same fold. As we can see from the table, file 737 and 738 are all in fold 5, and all ourselected classifiers assign them similar popularity estimation value. However only RandomForest gives a higher value of estimations to these two files. In most situations, decision treescan find the similarity between vulnerable files in the same fold, but the probability computedis rather lower than other classifiers did. From the perspective of comparing average value ofranking and probability, although random forest did not perform as good as shown in Table4-1, it still has the lowest average rank among all four classifiers.
To conclude, both these two tables indicate that Random Forest classifier is a good comparativechoice for building this prediction model. In the following section, I would describe the testingpart of this experiment. For having the conclusion on this research, all four classifiers areused during the testing.
4-4 Test and evaluation
As is shown in the framework description section, all collected data samples are separatedinto the training set and testing set. While doing the training section, classifiers are designedto learn from the training set. Then we can do testing and evaluation using our trained
Xiwei Shen Master of Science Thesis

4-4 Test and evaluation 37
Fold File Naive Bayes Random Forest Decision Tree Logistic RegressionRank Probability Rank Probability Rank Probability Rank Probability
Fold 148 146 3.53e-08 76 0.1100 134 0.5711 79 0.5920124 29 0.5529 38 0.1889 134 0.5711 76 0.600030 91 0.0180 133 0.0633 156 0.1153 140 0.2792
Fold 2153 2 0.9650 13 0.3933 97 0.5146 78 0.4522588 109 0.0182 144 0.0033 156 0.0980 140 0.0266581 94 0.0259 144 0.0033 156 0.0980 142 0.0227
Fold 3672 153 2.67e-14 117 0.0067 155 0.1536 155 0.0221635 55 0.0844 117 0.0067 66 0.4559 16 0.4272710 155 1.21e-52 36 0.0567 66 0.4559 1 0.9866
Fold 4 722 10 0.3951 25 0.1400 154 0.2089 55 0.2734734 39 0.3296 125 0.0133 154 0.2089 2 0.4515
Fold 5 737 106 0.2899 5 0.9500 131 0.4962 118 0.5799738 105 0.2900 6 0.9467 131 0.4962 119 0.5798
Average 88.4 0.2 83.7 0.2 125.8 0.37 90.9 0.38Std 50.7 0.304 59.4 0.334 32.8 0.189 52.3 0.280
Table 4-2: Probability Estimation Value with its Ranking of Different Machine LearningAlgorithms
classifiers. In this section, machine learning algorithms are evaluated by presenting testingresults and analyzing the relation between file feature values and classifier estimations.
One purpose of this research is to discover those features which are closely related with theexistence of vulnerable files. In answering the question, the study uses two different methods.
4-4-1 Feature Importance Analysis
Random Forest is an averaging algorithm based on several randomized decision trees. Decisiontree classifier is trained by learning and setting a series of decision rules inferred from thedata features. During the learning procedure, along with the increasing of tree depth, moredecision nodes are added to the tree to split smaller size of data samples. So the relativenode depth can be used to assess feature importance in a tree. The higher feature importancevalue is, the more critical feature node is in the tree.
As mentioned in the previous section, I apply principal component analysis (PCA) on originalfeature space, and the result turns out that machine learning algorithms give better performanceon transformed data than on original data. Due to the use of feature extraction method,feature importance values derived from trained Random Forest classifier are corresponding toPCA feature space. PCA components consist of several original features, and If we want toknow feature importance for the variables in original feature space, the first step is inverse theimportance value from PCA feature space to the original one. Each component in PCA spaceis generated by a linear combination of several features, also feature importance value is arelative value, linear decomposition process will not destroy the relative relationship betweenfeatures. Feature importance value ranking is shown in Figure 4-6. To avoid the randomnessof Random Forest classifier, I divide the training set into five folds and do training on differentfolds individually. According to the figure, the most important feature to distinguish between
Master of Science Thesis Xiwei Shen

38 EXPERIMENTS
Figure 4-6: Feature importance value retrieved from Random Forest
normal and vulnerable files is maintainability, which is a derived feature measuring sourcecode complexity, and two features defined to quantify network structure follows. Among topten features with high importance value, four of them are developer metrics (avg_closeness,avg_degree, duration and leave_dev), rest of the feature is all about code complexity metrics(maintainability, difficulty, operator, vocabulary, length, and operand).
Feature importance value in Figure 4-6 is the result of learning from the training set. Forcomparison, I also extract feature importance value from the testing set, and the top 10important features are displayed in Figure 4-7. As can be seen from the figure, the resultslearned from the training set and testing set are almost the same. The only difference is thatwork_dev metrics is more important than leave_dev for test set.
Through this important features analysis learning from data samples, we can find these causesof web application vulnerabilities distinguished from all the features that I collected. In thenext section, I will analyze the classification results from different aspects based on this featureimportance analysis.
Xiwei Shen Master of Science Thesis

4-4 Test and evaluation 39
Figure 4-7: Feature Importance Value of Test Set Retrieved from Random Forest
4-4-2 Feature Value Analysis
In Figure 4-4, we defined the confusion matrix for this research. True label use ’true’ and’false’ to represent ’vulnerable’ and ’normal’ separately, and for prediction result, ’positive’means the file is labeled to be vulnerable, and ’negative’ stands for labeling a file as ’normal’file. To inspect why a file is classified into the normal or vulnerable class based on the featurevalue analysis, I separate this analysis into several parts.
Vulnerable Files Comparison
In the test set for this research, there are five vulnerable files in total. During the test,Random Forest classifier can find 1 True Vulnerable file while classifying four vulnerable filesinto the normal class.
Although we made a comparison between classifiers during training part which proves RandomForest gives the best performance, I still use all these four classifiers to test and compare theirdetected files in order to understand the relation between file features and its label. As wecan see from Table 4-3, despite Decision Tree classifier, all other three classifiers provides thesame result. It is obvious that file 737 is more likely to be classified into vulnerable class.For knowing the reason, further analysis is made on file 737 by feature importance analysis.From the feature importance analysis, we can find out the top ten relevant features. Whileintroducing the collected dataset in Chapter 3, we have noticed the incoherence that relates tocombining data from multiple platforms. The normalization process is done for each platform,feature values of each file show relative degrees comparing to other files in the same platform.Table 4-4 presents the values of these ten features for file 737, it is clear that file 737 has highmaintainability value than that of other files in the same platform, and its network metricsvalues are about the average. Meanwhile, most relevant, important features have relativelylow value.
Master of Science Thesis Xiwei Shen

40 EXPERIMENTS
Classifier TP file index FN file index FP file indexRandom Forest 737 [588, 30, 581, 48] [676, 723, 680, 163]
Logistic Discriminant Analysis 30 [588, 737, 581, 48] [213, 230, 725, 771]Decision Tree [30, 48] [737, 588, 581] [690, 723, 716, 39]Naive Bayes 737 [588, 30, 581, 48] [159, 341]
Table 4-3: TP and FN Files List Generated by Different Classifiers
file index maintainability avg_closeness avg_degree difficulty duration operator vocabulary length work_dev operand737 0.8353 0.5000 0.6703 0.0309 0.0624 0.0046 0.0236 0.0047 0.01 0.0205
Table 4-4: Vulnerable file feature value list
From this individual file analysis, we can only know the characteristics of it compared to otherfiles in the same platform. The similarity shared by all vulnerable files is something we alsoneed to consider about. In Table 4-5, presenting all False Negative results with their featurevalues. True positive results and false negative results are all labeled vulnerable files, basedon this; first analysis perspective is to find a similarity between them. Directly shown in thetable, all vulnerable files have a small size of active developers. Code complexity metric valuevaries from file to file, from the table we can not tell whether a more complex file would havea higher probability of being vulnerable. After finding the similarity, we also need to knowthe difference between them considering not all vulnerable files are detected by our predictionmodel. False positive files preserve higher value on most code complexity metrics, and ifavg_closeness and avg_degree of a file are both larger than that of the true positive file, thisfile is more likely to be normal.
Comparison between Normal Files and Vulnerable Files
In this section, Normal file means the file is actually without any vulnerabilities, and Vulnerablefile represents a file with vulnerabilities. Moreover, a positive file stands for a file which islabeled as vulnerable by our designed prediction model and negative file means it is labeledas normal.
For showing the distribution of feature value, we use the boxplot method to visualize theresult. In the figure, all positive files share similar code complexity feature values, while thesefeatures can distinguish positive and negative files. So derived from these figures by comparingall positive files with negative files, code complexity metrics play an important role in helpingclassifier to make predictions, although the result is not that good enough. While throughcomparing true files with false files, the figure also shows only developer metrics, including
file index maintainability avg_closeness avg_degree difficulty duration operator vocabulary length work_dev operand588 0.6929 0.1875 0.1429 0.3206 0.0607 0.0665 0.1019 0.0609 0.25 0.072330 0.3172 0.5789 0.6117 0.7309 0.8476 0.7333 0.4038 0.3783 0.01 0.3867581 0.7191 0.1875 0.1428 0.0332 0.00 0.0051 0.0204 0.0050 0.01 0.386748 0.3894 0.6842 0.6808 0.3933 0.7363 0.5000 0.0938 0.0586 0.01 0.0138
Table 4-5: Vulnerable File Feature Value List
Xiwei Shen Master of Science Thesis

4-4 Test and evaluation 41
Figure 4-8: Value Distribution of Top 10 Important Features
avg_closeness, duration and avg_degree, are able to distinguish false positive file and truepositive file. An initial conclusion can be drawn from the figure is that developer metricsincluding developer behavior metrics, and developer network metrics are more important fordistinguishing normal and vulnerable files. Based on this initial conclusion, further researchesare done in section 4-4-4 to prove the conclusion by using another method.
4-4-3 Probability Estimation Analysis
We focus on analyzing feature values to discover the cause of having web application vulnerabilitiesin previous sections. In this section, I focus on studying the estimation probability computedby different classifiers. In Figure 4-9, the x-axis shows the index of all vulnerable files in thetest set, and the y-axis displays the estimation probability. Also, for understanding how aclassifier makes decisions on labeling, the figure also shows the decision boundary determinedby these classifiers. Random Forest assigns high probability estimation on file 737, but fail todistinguish other four vulnerable files from normal files. The situation faced by Naive Bayes issimilar to Random Forest, but Naive Bayes is more likely to find something abnormal on file30. This plotting also has some disadvantages, since the figure cannot show the probabilitydistribution for normal files. We cannot determine the expense of lowering the decisionboundary from this figure, so we are not able to conclude that Logistic Discriminant Analysisis better than other classifiers. However, this figure can instruct us which file might be valuablelook into further. Like file 581 and 588, all classifiers assign both of them with low probabilityestimation. According to my investigation, both of them are from a new platform that hasbeen recently updated, and only this platform is developed based on Node.js framework.This result inspires a new direction for the future work on studying the relationship between
Master of Science Thesis Xiwei Shen
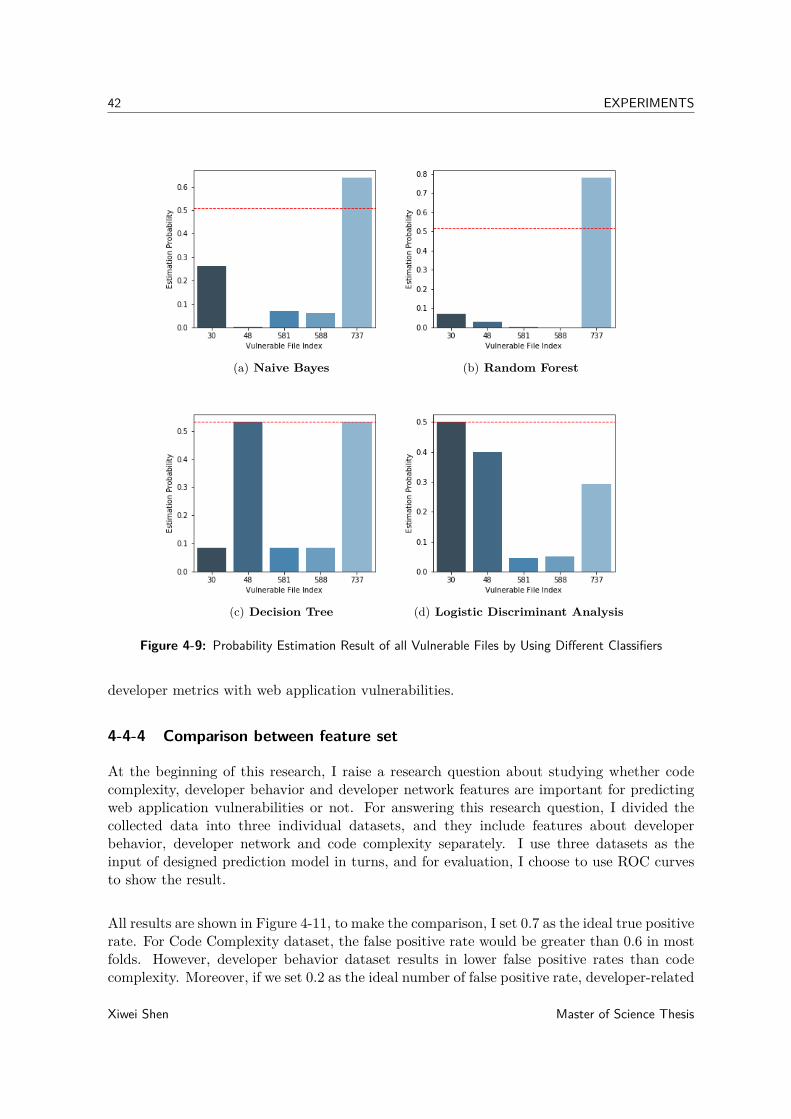
42 EXPERIMENTS
(a) Naive Bayes (b) Random Forest
(c) Decision Tree (d) Logistic Discriminant Analysis
Figure 4-9: Probability Estimation Result of all Vulnerable Files by Using Different Classifiers
developer metrics with web application vulnerabilities.
4-4-4 Comparison between feature set
At the beginning of this research, I raise a research question about studying whether codecomplexity, developer behavior and developer network features are important for predictingweb application vulnerabilities or not. For answering this research question, I divided thecollected data into three individual datasets, and they include features about developerbehavior, developer network and code complexity separately. I use three datasets as theinput of designed prediction model in turns, and for evaluation, I choose to use ROC curvesto show the result.
All results are shown in Figure 4-11, to make the comparison, I set 0.7 as the ideal true positiverate. For Code Complexity dataset, the false positive rate would be greater than 0.6 in mostfolds. However, developer behavior dataset results in lower false positive rates than codecomplexity. Moreover, if we set 0.2 as the ideal number of false positive rate, developer-related
Xiwei Shen Master of Science Thesis

4-4 Test and evaluation 43
(a) Code Complexity (b) Developer Behavior
(c) Developer Network
Figure 4-10: ROC curve and AUC value by using different feature sets
metrics can result in higher true positive rate than dataset with code related metrics. Also, theaverage AUC value also indicates the better performance brought by using developer relatedmetrics. From this part of the research, we can conclude that developer related metrics aremore important than code complexity metrics when building a web vulnerability predictionmodel.
4-4-5 Investigation on False Positive files
In this research, Checkmarx’s detection result is settled to be the ground truth. It is possiblethat this designed prediction model is able to discover some vulnerabilities existed in the filesthat have not been detected by Checkmarx. To investigate whether the research can discovervulnerabilities that Checkmarx cannot detect, with the support from developer team, I selectseveral false positive files from the prediction result, including file 39, 163 and 230.
Before discussing with developers about the false positive results made by the predictionmodel, I did an analysis based on collecting feature contributions extracted from the RandomForest classifier. It is common known that the Random Forest classifier is a black-boxmethod and it is impossible to interpret the whole decision process. As a tree-based classifier,prediction value calculation is defined in Equation 4-2, where each k represents a feature.The larger the contribution value is, the feature would have more influence on prediction.
Master of Science Thesis Xiwei Shen

44 EXPERIMENTS
(a) File 39 (b) File 163
(c) File 230
Figure 4-11: Feature Contribution of labelling files
prediction = cinitial +K∑k=1
contribution(x, k) (4-2)
When comparing contribution value for predicting each source code file, the result is similarto the result shown in feature Importance Analysis in section 4-4-1, developer networkmetrics, like avg_degree and avg_closeness, also have high contribution value According tothe information provided by developer team, file 163 is a source code file created by thethird-party team. A third-party file can contain more potential factors other than the aspectswe considered that can result in producing vulnerabilities. This information gives inspirationto the future work that considering the source of files is also useful for this area of research.
The other two files are all related with providing information to page viewers. The similarityshared by these files also highlight a new direction that the functions realized in the file mightalso related with the probability of having vulnerabilities. For example, a function to build amessage box is more likely to have vulnerabilities than a static web page without any inputform.
Figure 4-11 shows the feature contributions for labeling different files, which is clear thatfile-based network metrics like avgdegree and avgcloseness have made large contributionsfor labeling a file. For further study, we can collect developer network metrics from otherresources instead of introducing network theory, in order to know whether the actual developerteam structure and collaboration is correspond to metric values.
Xiwei Shen Master of Science Thesis

4-5 Discussion 45
4-5 Discussion
Previous analysis on the prediction results can be divided into two main parts. During trainingphases, the analysis helps the research to build a prediction model with good performance.While in testing part, I analyze the prediction results and point out how a trained classifiermakes decisions on classifying each file. These analysis proves the importance of consideringdeveloper related metrics when building a prediction model, and these developer relatedmetrics are more useful than code complexity metrics.
However, this research also has several limitations. Firstly, the number of vulnerable files islimited, because we only take JavaScript files into account. With only 13 vulnerable files innearly 1000 normal files, it is vital to decide how to divide training and testing set properlyand introduce imbalanced learning method into this research. Secondly, file ground truthlabels are not reliable enough due to the existence of false positive labels. For improving theperformance of this designed prediction model, it might be useful to label each file by usingreliable vulnerability check result. Thirdly, the performance of this prediction model is notgood enough, although we have done data processing and parameter tuning in this research.
Master of Science Thesis Xiwei Shen

46 EXPERIMENTS
Xiwei Shen Master of Science Thesis

Chapter 5
DISCUSSION
This Chapter concludes this research on building a prediction model for discovering webapplication vulnerable files. In this Chapter, we do recall on the whole experiment processby pointing out how to execute the experiments and what we have found during the researchin the beginning, then discussing the experimental methods, results and limitations of thisresearch. At last, answering three research questions raised in Chapter 1. Also, on the basisof research limitation, promoting new direction and suggestions to the future works.
5-1 Research Work Recap
This research is focusing on building a prediction model for detecting vulnerable files. Allcollected data are originally acquired from GitHub repository. GitHub repository consists twomain kind of resource, including source code files and commitment history log files. Previousresearches on building prediction models for detecting vulnerable files considers only thequality of the code, without taking human factors into account. This research starts from anew perspective of introducing developer related metrics into input feature space, and usingtraditional machine learning algorithms to learn from input data to predict sample data. Thewhole experiment procedure includes three parts.
5-1-1 Data Collection
Data collection process not only involves determining the features that is useful for theprediction model, but also includes where to collect designed features. Both of them couldinfluence the performance of the prediction model. Due to this reason, we put efforts onstudying what resources are useful for this project and how to use them. By using npm project"PLATO", I am able to extract all code complexity metrics from each development package.For developer related metrics, I can only use GitHub commitment record to calculate somestatic metrics, for measuring developer team network structure, I introduce network theoryinto this research. Moreover, there is no guarantee that the vulnerability check results could
Master of Science Thesis Xiwei Shen

48 DISCUSSION
provide the ground-truth result to label our files, which have false vulnerable files records,and it might influence the performance. We did an initial data analysis on the raw data byvisualizing the feature value distributions of normal files and vulnerable files separately. Thefigures present that some features show the distinctions between these two kinds of files. Basedon the visualization, I raised several suggestions to developers and managers that can helpto reduce the risk of having vulnerabilities by adjusting the settlement of their developmentteams.
5-1-2 Classifier Training
Building a machine learning system for this prediction model is also count for a large part myresearch. In the beginning, I notice that this research should pay attention to the imbalanceof the collected dataset which was inspired by several papers about software defects detection.Considering that I have all labeled data for training, so only supervised learning algorithmsare considered in this research. For imbalanced data learning, resampling method is used toimprove the performance of prediction model, like many other research on imbalanced datalearning, I used SMOTE method to do oversampling on training set. When selecting machinelearning algorithms to build the prediction model, I take both black-box and white-boxmethods into account, and decided to use Naive bayes, Random Forest, Decision Tree andLDA classifiers. Methods for imbalanced learning evaluation are different from other balancedlearning evaluation, and most researches used ROC curve and AUC value to evaluate andcompare the performance. To show the details about prediction probabilities of each file, Ilisted prediction probabilities and rankings for vulnerable files. By comparing the rankingsgenerated by different classifiers, it turns out that Random Forest gives the best performance.
5-1-3 Testing and Evaluation
For testing and evaluation on this prediction model, I select several different aspects to analyzethe prediction results. Random Forest is a tree-based classifier, so it can compute the featureimportance value according to the decisions made by each tree branch. The ranking of featureimportance value presents that developer network metrics is important for making decisions,but half of the metrics are related with code complexity. Since there are limited number ofvulnerable files in test set, I used a table to show their predicted label. Noticing that file 737is more likely to be classified into vulnerable class, I display the feature values of this file andtry to find patterns of a vulnerable file. Despite before, I also do the comparison betweensome normal files and vulnerable files and the result turns out that developer related metricsare more useful for distinguishing true positive and false positive results. Then, to answerthe research question raised in Chapter 1, I do some experiments by using different featuresets and compare the performance. The result clearly indicate that using developer relatedmetrics are performing better than code related metrics on predicting vulnerable files. Atlast, in order to find some new directions for future work, I spend some time to study thefalse positive files. According to my discovery, a third-party file is always misclassified tovulnerable file, which might be useful to add a metric which can present the source of a codefile.
Xiwei Shen Master of Science Thesis

5-2 Conclusion 49
5-2 Conclusion
To draw conlcusions, we first recall our research question.
• How to quantify developer works on each source code file from developer working logfiles?
• What suggestions can be made to adjust developer behaviors based on collected metricsby using data analysis method?
• Is code complexity, developer behavior and developer network metrics important fordetecting web application vulnerabilities? Which one is most important to distinguishvulnerable files from normal files?
5-2-1 Research Question 1
• How to quantify developer works on each source code file from developer working logfiles?
In this research, several static metrics are defined to measure developer’s working behaviour.I used the information included in GitHub repository. Details for calculation are shown inChapter 3.
5-2-2 Research Question 2
• What suggestions can be made to adjust developer behaviors based on collected metricsby using data analysis method?
In Chapter 3, I visualize the density distribution of some features and suggestions are made inthe conclusion part. Based on the information provided in the figure, I am able to give someadvice to platform developers. Also, the feature importance values can also give indicationto the way of adjusting development work.
5-2-3 Research Question 3
• Is code complexity, developer behavior and developer network metrics important fordetecting web application vulnerabilities? Which one is most important to distinguishvulnerable files from normal files?
According to the results I found during the experiment, it shows that developer relatedmetrics are more important than code related metrics. But code complexity metrics are alsoimportant for predicting vulnerable files, as is shown in the feature importance value results.
Master of Science Thesis Xiwei Shen

50 DISCUSSION
5-3 Future Work
5-3-1 Exploring features
The features we collected in this research are all static features. Adding version label to eachfile. Inspired from predicting third-party code files to be vulnerable, it is also useful to addanother feature to distinguish whether the file is developed by internal groups or not. Also,classifying files according to their usages might also help. Moreover, all the metrics that Icollected in this research are static. So further work could be done to collect some dynamicmetrics to measure developer works. For example, we can collect metrics every once in awhile and add time stamp to these metrics.
5-3-2 Labelling source code files
In this research, the ground truth label is determined by Checkmarx (a vulnerability detectiontool) result. As an automatic detection tool, it is unavoidable that Checkmarx’s vulnerabilityreport would have false positive, in other words, detected vulnerability actually do not exist.For improving the performance of this prediction model, learning procedure is deterministic.If we can ensure true labels do not contain false positive result, the prediction model canlearn things more precisely.
5-3-3 Unsupervised learning
This research only choose supervised learning to build the prediction model, because ofconsidering that the labeled data is accessible. If it was difficult to access the ground-truthlabel of training data samples, it would be a wise choice to use unsupervised learning algorithms.Some papers about software defects also mentioned about using semi-supervised learningmethod to do prediction, which also worth to try.
Xiwei Shen Master of Science Thesis

Bibliography
[1] S. B. Kotsiantis, I. Zaharakis, and P. Pintelas, “Supervised machine learning: A reviewof classification techniques,” Emerging artificial intelligence applications in computerengineering, vol. 160, pp. 3–24, 2007.
[2] H. He and E. A. Garcia, “Learning from imbalanced data,” IEEE Transactions onKnowledge & Data Engineering, no. 9, pp. 1263–1284, 2008.
[3] S. Wang and X. Yao, “Using class imbalance learning for software defect prediction,”IEEE Transactions on Reliability, vol. 62, no. 2, pp. 434–443, 2013.
[4] N. V. Chawla, K. W. Bowyer, L. O. Hall, and W. P. Kegelmeyer, “Smote: syntheticminority over-sampling technique,” Journal of artificial intelligence research, vol. 16,pp. 321–357, 2002.
[5] H. He, Y. Bai, E. A. Garcia, and S. Li, “Adasyn: Adaptive synthetic sampling approachfor imbalanced learning,” in Neural Networks, 2008. IJCNN 2008.(IEEE World Congresson Computational Intelligence). IEEE International Joint Conference on, pp. 1322–1328,IEEE, 2008.
[6] N. V. Chawla, A. Lazarevic, L. O. Hall, and K. W. Bowyer, “Smoteboost: Improvingprediction of the minority class in boosting,” in European conference on principles ofdata mining and knowledge discovery, pp. 107–119, Springer, 2003.
[7] T. Menzies, J. Greenwald, and A. Frank, “Data mining static code attributes to learndefect predictors,” IEEE transactions on software engineering, vol. 33, no. 1, pp. 2–13,2007.
[8] A. Bosu, J. C. Carver, M. Hafiz, P. Hilley, and D. Janni, “Identifying the characteristics ofvulnerable code changes: An empirical study,” in Proceedings of the 22nd ACM SIGSOFTInternational Symposium on Foundations of Software Engineering, pp. 257–268, ACM,2014.
Master of Science Thesis Xiwei Shen

52 Bibliography
[9] R. Scandariato, J. Walden, A. Hovsepyan, and W. Joosen, “Predicting vulnerablesoftware components via text mining,” IEEE Transactions on Software Engineering,vol. 40, no. 10, pp. 993–1006, 2014.
[10] Y. Shin and L. Williams, “Is complexity really the enemy of software security?,” inProceedings of the 4th ACM workshop on Quality of protection, pp. 47–50, ACM, 2008.
[11] Y. Shin, A. Meneely, L. Williams, and J. A. Osborne, “Evaluating complexity, codechurn, and developer activity metrics as indicators of software vulnerabilities,” IEEETransactions on Software Engineering, vol. 37, no. 6, pp. 772–787, 2011.
[12] N. Nagappan and T. Ball, “Use of relative code churn measures to predict system defectdensity,” in Proceedings of the 27th international conference on Software engineering,pp. 284–292, ACM, 2005.
[13] A. Meneely, L. Williams, W. Snipes, and J. Osborne, “Predicting failures with developernetworks and social network analysis,” in Proceedings of the 16th ACM SIGSOFTInternational Symposium on Foundations of software engineering, pp. 13–23, ACM, 2008.
[14] I. Chowdhury and M. Zulkernine, “Using complexity, coupling, and cohesion metricsas early indicators of vulnerabilities,” Journal of Systems Architecture, vol. 57, no. 3,pp. 294–313, 2011.
[15] L. K. Shar and H. B. K. Tan, “Automated removal of cross site scripting vulnerabilitiesin web applications,” Information and Software Technology, vol. 54, no. 5, pp. 467–478,2012.
[16] O. W. A. S. Project, “Xss (cross site scripting) prevention cheat sheet,” 2018.
[17] P. Vogt, F. Nentwich, N. Jovanovic, E. Kirda, C. Kruegel, and G. Vigna, “Cross sitescripting prevention with dynamic data tainting and static analysis.,” in NDSS, vol. 2007,p. 12, 2007.
[18] V. Haldar, D. Chandra, and M. Franz, “Dynamic taint propagation for java,” inComputer Security Applications Conference, 21st Annual, pp. 9–pp, IEEE, 2005.
[19] A. Nguyen-Tuong, S. Guarnieri, D. Greene, J. Shirley, and D. Evans, “Automaticallyhardening web applications using precise tainting,” in IFIP International InformationSecurity Conference, pp. 295–307, Springer, 2005.
[20] D. Balzarotti, M. Cova, V. Felmetsger, N. Jovanovic, E. Kirda, C. Kruegel, andG. Vigna, “Saner: Composing static and dynamic analysis to validate sanitization in webapplications,” in Security and Privacy, 2008. SP 2008. IEEE Symposium on, pp. 387–401,IEEE, 2008.
[21] N. Jovanovic, C. Kruegel, and E. Kirda, “Pixy: A static analysis tool for detectingweb application vulnerabilities,” in Security and Privacy, 2006 IEEE Symposium on,pp. 6–pp, IEEE, 2006.
[22] L. K. Shar, L. C. Briand, and H. B. K. Tan, “Web application vulnerability predictionusing hybrid program analysis and machine learning,” IEEE Transactions on Dependableand Secure Computing, vol. 12, no. 6, pp. 688–707, 2015.
Xiwei Shen Master of Science Thesis

53
[23] L. K. Shar, H. B. K. Tan, and L. C. Briand, “Mining sql injection and cross site scriptingvulnerabilities using hybrid program analysis,” in Proceedings of the 2013 InternationalConference on Software Engineering, pp. 642–651, IEEE Press, 2013.
[24] E. Kalliamvakou, G. Gousios, K. Blincoe, L. Singer, D. M. German, and D. Damian, “Thepromises and perils of mining github,” in Proceedings of the 11th working conference onmining software repositories, pp. 92–101, ACM, 2014.
[25] M. H. Halstead et al., Elements of Software Science (Operating and programming systemsseries). Elsevier Science Inc., New York, NY, 1977.
[26] T. J. McCabe, “A complexity measure,” IEEE Transactions on software Engineering,no. 4, pp. 308–320, 1976.
[27] C. D. D. L. Jesse Harlin, Jarrod Overson, “es6-plato.” https://github.com/deedubs/es6-plato, 2012.
[28] D. Spadini, M. Aniche, and A. Bacchelli, PyDriller: Python Framework for MiningSoftware Repositories. 2018.
Master of Science Thesis Xiwei Shen

54 Bibliography
Xiwei Shen Master of Science Thesis