master’s thesis operational requirements and control …sgemfinalreport.fi/files/thesis_anton...
TRANSCRIPT
FACULTY OF TECHNOLOGY
LUT ENERGY
ELECTRICAL ENGINEERING
MASTER’S THESIS
OPERATIONAL REQUIREMENTS AND CONTROL OF
ISLAND LVDC MICROGRID
Examiners Prof. Jarmo Partanen
M.Sc. Tero Kaipia
Author Anton Shevchuk
Lappeenranta 24.05.2012

Abstract
Lappeenranta University of Technology
Faculty of Technology
Electrical Engineering
Anton Shevchuk
Operational Requirements and Control of LVDC Microgrid
Master’s thesis
2012
60 pages, 30 pictures, 0 tables and 1 appendix
Examiners: Professor Jarmo Partanen and M.Sc. Tero Kaipia
Keywords: LVDC microgrids, distribution networks, island operation, low volt-
age, DC system, island PV generation.
The development of power electronic devices and technologies in renewable
power production open possibilities for implementation the low voltage DC dis-
tribution systems in concern with renewable sources if energy, especially with
photovoltaic generation. It can become one of the most beneficial solution in is-
land operating conditions.
This master’s thesis is focused on the solving actual problems related to the de-
velopment of novel LVDC microgrid for islanding positioning, such as formula-
tion of functional and operational requirements for the system, finding effective
ways of control for proposed microgrid. In present work most attention is paid
for application of PV generation in Island LVDC system, however it doesn’t re-
strict the utilization of alternative renewable power sources.

Аннотация
Технологический Университет г. Лаппеенранты
Технологический Факультет
Кафедра Электротехники
Антон Шевчук
Функциональные Требования и Управление Низковольтными Сетями
Постоянного Тока
Магистерская Работа
2012
60 страниц, 30 иллюстраций, 0 таблиц and 1 приложение
Научные руководители: Проф. Ярмо Партанен, Теро Каипиа.
Ключевые слова: низковольтные распределительные сети, сети постоянно-
го тока, островное функционирование, фотоэлектрические системы.
Развитие силовой электроники и технологий, связанных с применением
возобновляемых источников электроэнергии, открывает возможность ис-
пользования низковольтных распределительных сетей постоянного тока.
Данная работа посвящена решению актуальных проблем, связанных с раз-
работкой инновационной низковольтной распределительной сети посто-
янного тока в условиях островного функционирования. Основное внима-
ние уделяется разработке системных и функциональных требований для
данной системы и обоснованию наиболее рациональных методов управле-
ния. В работе сделан акцент на применение фотоэлектрических систем в
качестве основного источника электроэнергии.

Table of contents
1 Introduction........................................................................................................ 6
1.1 Main objective and research tasks of the thesis............................................................ 7
1.2 Research methods ....................................................................................................... 8
2 DC microgrids as the alternative for AC distribution systems in Island
conditions .................................................................................................................... 9
2.1 Advantages and challenges of LVDC microgrids ...................................................... 11
2.2 Possible structures of LVDC microgrids.................................................................... 13
2.3 Application of Island LVDC microgrid with PV system in Finland ........................... 16
3 Requirements for Island LVDC system ............................................................25
3.1 System requirements ................................................................................................. 25
3.2 Functional requirements............................................................................................ 26
3.3 Operational requirements.......................................................................................... 28
3.3.1 Battery connection ........................................................................................... 29
3.3.2 Battery type selection ....................................................................................... 32
3.3.3 Battery capacity ............................................................................................... 33
3.3.4 PV module selection ........................................................................................ 35
3.4 Electric safety and fault protection in LVDC microgrids ........................................... 36
3.4.1 System grounding ............................................................................................ 36
3.4.2 Fault protection................................................................................................ 37
3.4.3 Protection requirements ................................................................................... 39
4 Control of the Island LVDC system..................................................................41
4.1 Price-based demand control....................................................................................... 42
4.1.1 Price determination.......................................................................................... 43
4.1.2 Application of nodal pricing ............................................................................ 46
4.2 Technical control ...................................................................................................... 47
4.2.1 Power balance control ...................................................................................... 47
4.2.2 Voltage control ................................................................................................ 48
4.2.3 Specific of voltage control ................................................................................ 49
4.2.4 Load sharing.................................................................................................... 50
5 Case calculations................................................................................................52
5.1 System definition ...................................................................................................... 52
5.2 Consumption calculations ......................................................................................... 53
5.3 Battery size calculation ............................................................................................. 54
5.4 PV array size calculation........................................................................................... 54
5.5 Price calculation........................................................................................................ 56
5.6 Modeling .................................................................................................................. 58
5.6.1 Technical characteristics and constrains of the model ...................................... 58
5.6.2 Subsystems ...................................................................................................... 58
5.7 Results ...................................................................................................................... 62
6 Conclusion .........................................................................................................65
References..................................................................................................................67
Appendices:
Appendix 1. Statistic information about wind and solar situation in Finland

Abbreviations and symbols
AC Alternative Current
DC Direct Current
DG Distributed Generation
EOL End-of-Life Capacity
EV Electric Vehicle
HVDC High Voltage Direct Current
IGBT Insulated-Gate Bipolar Transistor
IT Isolation Terre
LV Low Voltage
LVDC Low Voltage Direct Current
MDOD Maximum Depth of Discharge
MDDOD Maximum Daily Depth of Discharge
MMS Microgrid Management System
MV Medium Voltage
PI Proportional Integral
PV Photovoltaic
RMS Root-Mean-Square
SAIFI System Average Interruption Frequency Index
SOC State of Charge
STC Standard Test Conditions
THD Total Harmonic Distortion
TN Terre Neutral
ε annual payment
η coefficient of power conversion
k efficiency coefficient
membership function
π constant
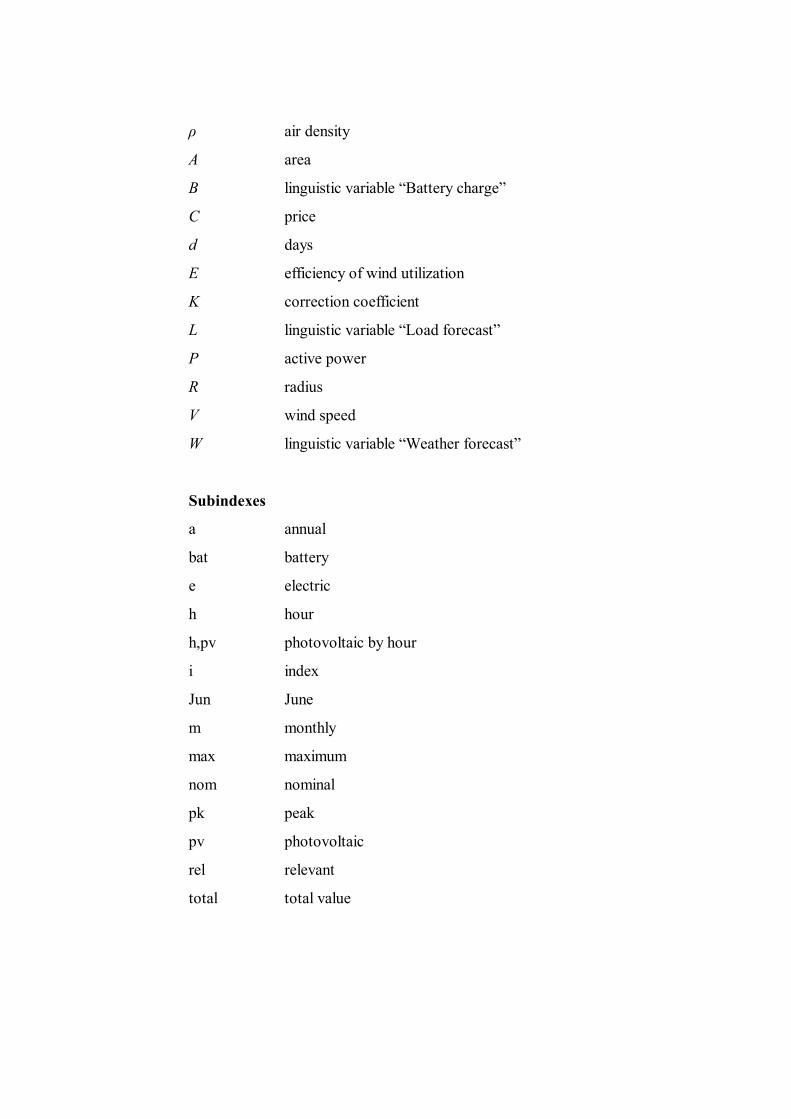
ρ air density
A area
B linguistic variable “Battery charge”
C price
d days
E efficiency of wind utilization
K correction coefficient
L linguistic variable “Load forecast”
P active power
R radius
V wind speed
W linguistic variable “Weather forecast”
Subindexes
a annual
bat battery
e electric
h hour
h,pv photovoltaic by hour
i index
Jun June
m monthly
max maximum
nom nominal
pk peak
pv photovoltaic
rel relevant
total total value

Acknowledgments
The work was carried out at Lappeenranta University of Technology (LUT) dur-
ing 2011/2012 studying period. I would like to express my sincere appreciation to
the people who helped me with presented work.
At first, I would like to thank to Professor Jarmo Partanen for the possibility of
work under your supervision and M.Sc. Tero Kaipia for the great help and sup-
port.
I want to tell thanks to staff of Department of Electrical Engineering of the Saint-
Petersburg State Mining University and especially to my supervisor Prof. Boris
Abramovich for that knowledge and experience which they gave me.
Special thanks to Vladimir Borzenkov who provided me the opportunity to study
in Lappeenranta.
I wish to express my thanks to my parents for love and support me in difficult
times and to my darling Mary for understanding and patience.

6
1 Introduction
Nowadays the LVDC distribution system is one of the new primary technological
innovations in electricity distribution. The utilization of the LVDC systems opens
a lot of possibilities in developing power supply systems and also has considerable
impacts in such ways as enhance of the reliability, power quality and energy effi-
ciency of the electricity distribution system. By using the allowed DC voltage
range (determined by LVD 2006/95/EC), it is possible to improve mentioned
network parameters, the benefits of which are directly visible to the customers.
Expansion of power electronics applications, upgrowth of renewable sources of
energy, especially the increase in small-scale distributed generation, and devel-
opment of LVDC microgrids makes possible to solve one of the most important
issue for the isolated networks such as sustainable power supply with minimiza-
tion of total costs and providing maximum of power efficiency. This challenge
especially actual in case of island location and north regions where exist problems
with delivering energy.
At the present stage of development of low voltage DC distribution networks the
issues which are related to the voltage control and power balance control are par-
ticularly relevant and important, because of strict dependence between such chal-
lenges and quality of electric supply, especially in isolated operation.
Another important issue is to study problems related to the determination of the
most effective system setup for the island LVDC network from technical and
economical points of view simultaneously, and also find the answer for the de-
mand response problem: which kind of control mechanism is more beneficial –
priced-based or technical-based? This master’s thesis focused on solving men-
tioned above problems and bases on comparison of different alternatives and
computer modeling.
7
1.1 Main objective and research tasks of the thesis
The main objective of following work is to define operational requirements and
develop structure for power balance control and voltage control in LVDC island
network system which maintains maximum of power efficiency in the distribution
area by the optimisation of use of demand control, battery charge control and
generator control as well as maintains minimum of total costs of the system.
In carrying out theoretical research aimed at the study and development power
balance control algorithm for low voltage DC distribution networks, following
research tasks:
1. Literature survey of microgrids
Technical construction alternatives for AC and DC microgrids (pros
and cons), control methods and automation systems;
Modelling of the behaviour of consumption, generation and state of
battery charge in microgrids.
2. System structures and operational requirements
Determination of the operational requirements for LVDC microgrid
and functional requirements of customer, generation and storage inter-
faces (converters);
Electric safety and fault protection schemes;
Definition of general level system concept and equipment layout – sys-
tem setup that maximises the energy efficiency and minimises the total
costs.
3. Control and automation system
Requirements and realisation for DC-network voltage control;
Definition of power balance control algorithm that optimises the use
of demand control, battery charge control and generator control;
Analysis of the robustness of the control system;
Requirements for the communication between the active components
in the system and needs for system supervision.

8
1.2 Research methods
Methods of electrical circuits theory, automatic control theory, numerical meth-
ods of solving equations were used in present study to decide problems related to
the development of the novel LVDC microgrid.
Mathematical and computer modelling were used also to implement and study the
model of low voltage DC distribution network equipped with photovoltaic power
generation.
In present work the possibility of utilization of Fuzzy logic methods is described.
Theory of fuzzy sets could be proposed for solving problem with price determina-
tion in LVDC microgrid.
9
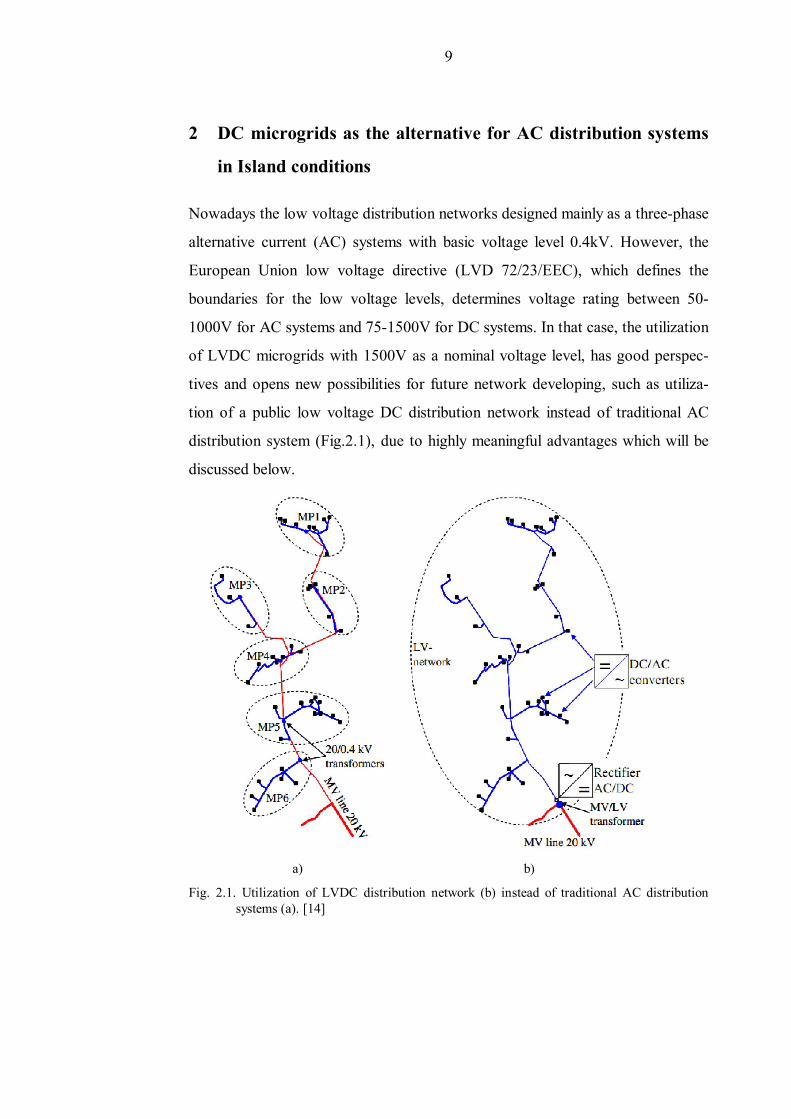
2 DC microgrids as the alternative for AC distribution systems
in Island conditions
Nowadays the low voltage distribution networks designed mainly as a three-phase
alternative current (AC) systems with basic voltage level 0.4kV. However, the
European Union low voltage directive (LVD 72/23/EEC), which defines the
boundaries for the low voltage levels, determines voltage rating between 50-
1000V for AC systems and 75-1500V for DC systems. In that case, the utilization
of LVDC microgrids with 1500V as a nominal voltage level, has good perspec-
tives and opens new possibilities for future network developing, such as utiliza-
tion of a public low voltage DC distribution network instead of traditional AC
distribution system (Fig.2.1), due to highly meaningful advantages which will be
discussed below.
a) b)
Fig. 2.1. Utilization of LVDC distribution network (b) instead of traditional AC distribution systems (a). [14]

10
The studies show [11], [12] that different power-electronics-based DC solutions
have a significant application potential in rural areas and in the electricity distribu-
tion networks in centres of urban areas. As one of important moments it seems
perspective to implement such technologies in isolated network systems, such as
in island operating networks, especially in cases of application of renewable
sources of energy, such as for example PV power systems, and accomplishment
of distributed generation (Fig2.2.).
Fig. 2.2. Island LVDC distribution network.
The possible targets of a low voltage DC system are not limited only to public
electricity distribution networks, but the such system can also be widely applied
for instance in different industries areas and in internal networks in customers’
premises [15].
11
2.1 Advantages and challenges of LVDC microgrids
According to the results of significant research work, utilization of low voltage
DC distribution networks introduces benefits compared to AC systems. First of
all the transmission capacity of LVDC systems is higher than traditional AC sys-
tems due to the voltage difference between the systems. Research results shows
that the transmission capacity can be over 16 times at the voltage drop limit and
over 4 times at thermal limit compared to the traditional 400VAC system. At the
same time, the transmission capacity coefficient depends on the used DC voltage
level and structure of the system [15].
In case of traditional distribution network, high transmission capacity of LVDC
distribution system opens the possibility of replacement of a part of MV line, so
that application of LVDC structure for distribution of electricity allows to reduces
the investment costs of an electricity distribution network. In that case the smaller
cable cross-sections can be used than in traditional 400V AC distribution system
which reduces distribution system total costs. Replacing of medium-voltage dis-
tribution network also reduces interruption costs, as the total MV network length
decreases. At the same time, in the instance of replacement of a part of MV
structure, there is reduction in the number of LV transformers as DC distribution
system includes only one LV transformer in the beginning of LVDC system [18].
Island operating systems have specific operational and functional requirements
which are defined by unconventional operating conditions. Low voltage DC net-
works bring novel beneficial solutions in this engineering area. First of all, utiliza-
tion of DC technologies allows to avoid the problem with synchronization of
power sources in electric grid. It is one of the major benefit in case of hybrid-
power systems and networks with distributed generation (DG). It is also no need
to consider about reactive power.
However, there are additional costs caused by the DC and AC converters. The
price development for power electronics devices, however, show a downward

12
trend, and at the same time, the costs of traditional distribution network tech-
nologies are steadily increasing as shown on the Fig.2.1.1.
Fig. 2.1.1. Price development of technology industry between 1999 and 2011. [2]
In that case, permanent rise of the quality of power electronics components simul-
taneously with the price reduction makes it possible to apply power electronics
devices in application of LVDC distribution networks.
Another important benefit is that the voltage quality improves due to active volt-
age control of an inverter’s. As customer AC voltage is converted from much lar-
ger DC voltage the customer operating voltage can nearly be kept constant. For
the same reason network voltage fluctuations and drops can be eliminated and
they may not influence on the customer operating voltage [18].
From the protection point of view, the LVDC distribution system creates its own
protection zone, so that the faults occurring in the DC line causes outage to the
customers in the DC district only, thus systems reliability increases.

13
However, it should be mentioned another aspect of the problem that is mean that
new distribution system introduces challenges as well. The DC power supply sys-
tem is more complex than traditional 20/0.4 kV AC distribution system which
makes system operation more difficult technically.
In addition the LVDC system also causes difficulties from the electrical safety
point of view. In the LVDC system high DC voltage can be a reason of dangerous
earth voltage levels in difficult grounding conditions which may require additional
earthing equipment.
Another important moment is that the power electronic devices introduce new
challenges to distribution system also. The power electronic converter usage can
cause switch faults and complicate protection device operations, which simulta-
neously has sufficient fault current capability. Besides, lifetimes of power elec-
tronic device may be only a quarter than traditional ones which provides addi-
tional maintenance issues and costs of converters [18].
2.2 Possible structures of LVDC microgrids
Typically, an LVDC distribution system consists of power electronic converters
and DC link between the converters. The topology of LVDC distribution system
can have different kind of variations. Common to the traditional grid-connected
distribution networks topologies is that AC/DC conversion is always located near
MV line. The DC/AC conversion can instead be located at different locations
[19].
In isolated network systems (stand-alone systems) the AC/DC conversion is lo-
cated near generator of electric energy and usually equipped with battery bank.
Depending on the location the LVDC system can be either a HVDC link type so-
lution or a wide LVDC distribution district where the DC/AC conversion is made
at the customer-ends.
14
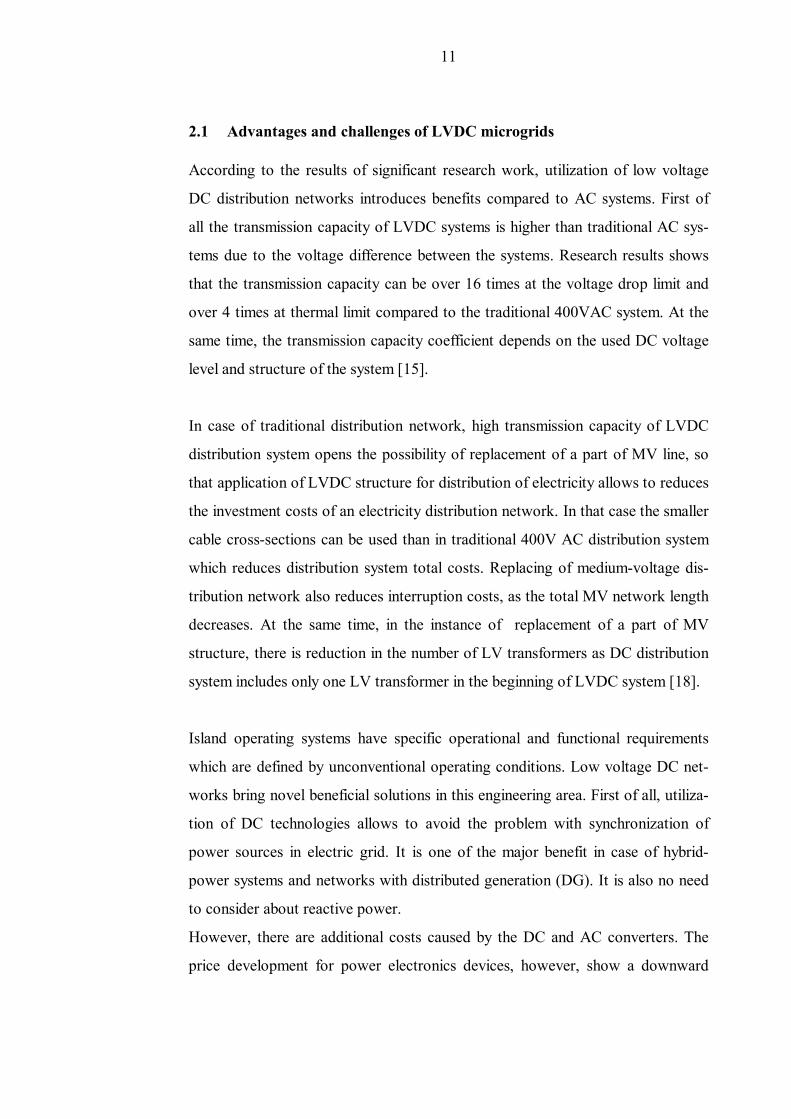
The LVDC distribution system can be made with two basic implementations: uni-
polar and bipolar. The unipolar system has a one voltage level via energy is
transmitted. All the customers are connected to this one voltage level [19]. Uni-
polar DC systems are shown in Fig. 2.2.1-2.2.2.
Fig. 2.2.1. A grid-connected unipolar LVDC distribution system.
Fig. 2.2.2. A stand-alone unipolar LVDC distribution system with PV source of energy.
The bipolar system can be introduced as two unipolar systems which are con-
nected in series. Thus, there are two voltage levels, which are equal but of oppo-
site sign compared with their common neutral voltage level. A bipolar connection
requires a three-wire transmission line, but customer connections are two-wire
cables connected between positive or negative pole. Therefore customer supply
voltage is either + 750 VDC or - 750 VDC. The converters of a bipolar connec-

15
tion consist of two similar structure converter units connected between the neu-
tral and phase voltage levels. They can also be similar to the ones used in a unipo-
lar connection [17]. Bipolar DC systems with connection alternatives are shown
in Fig. 2.2.3-2.2.4.
Fig. 2.2.3. A grid-connected bipolar DC system.
Fig. 2.2.4. A stand-alone bipolar DC system with PV source of energy.
Previous research results show that the bipolar ±750 VDC system is more benefi-
cial for LVDC distribution networks for the following reasons. First of all, the
bipolar system enables exploitation of the whole DC voltage range defined by the
low-voltage directive without a need to exceed the standardized DC voltage lim-
its of commercial low-voltage underground power cables (SFS 4879), (SFS
4880) [14]. Secondly, the bipolar system enables the use of 750 V voltage level of
converters with appropriate customer connection (neutral-pole), which allows to

16
reduces the price of converters. Also it is very important that it makes possible to
keep the other half of the network in operation if the other half is faulted , hence
it is the way of increasing the supply reliability.
However, from the drawbacks point of view, the bipolar system has disadvan-
tages compared to the unipolar system. First, the load asymmetry of the system
leads to voltage asymmetry because of the current superposition in the neutral of
the system. This phenomenon causes extra losses in the system and can also cause
overvoltages in a fault situation as the voltage of the healthy pole will rise [14].
Besides, bipolar structure has less transmission capacity then unipolar system
cause of difference in voltage levels.
2.3 Application of Island LVDC microgrid with PV system in Finland
Using of solar power as a major source of energy is one of the most perspective
solutions in island conditions and has a huge potential when considering techno-
logical innovations. Novel low voltage DC microgrid conception and develop-
ment of photovoltaic technologies allow to create an independent system for
power supply in cases when it’s impossible or non-efficient from economical point
of view to create traditional power supply system. Besides, it is estimated that the
price of solar electricity will fall dramatically over the next few years.
Despite the long and dark winters, potential for solar energy production in Fin-
land could be high enough. Compared to Central Europe, the lack of dust and
smog in Finland’s micro climate makes good conditions for domestic solar energy
production. Solar radiation reaches its peak in Finland in May-July and achieve its
minimum in January-February [16].
Along the coasts of the Gulf of Finland and Gulf of Bothnia there are thousands
of islands, the main archipelagos are Åland archipelago and the archipelago of
Turku. In the south-west the heavily dissected coast grew into the largest archi-
pelago in Finland which is unique in the world due to great amount of islands.

17
Lake District is an inner plateau in the south of the country with thick forests and
a large number of lakes, islands, swamps and marshes. Considering mentioned
above, the development of independent island microgrids in Finland becomes very
actual. In this chapter, there are three different island regions in different parts of
Finland were chosen to estimate and compare possibilities of energy production
from solar power and its utilization with LVDC microgrids.
Fig. 2.3.1. Principle scheme of Island LVDC network with PV power source.
Power potential of photovoltaic system as source of energy in island conditions
could be estimated on the example of Turku archipelago on the south-east part of
Finland (60.449, 22.259), as it is very developed island part of Finland and seems
perspective for island LVDC installations. Turku region has a humid continental
climate with warm summers and no dry season. It is presented on the Fig.2.3.2.

18
Fig.2.3.2 Island region near Turku
For estimation of energy production from solar power and also comparison with
consumption were chosen January and June. January characterize as the month
with worst weather conditions and highest consumption of electricity cause the
solar activity and temperatures are minimal. June was chosen as the month with
best weather conditions from the solar activity point of view, in which there is
also a minimum of electricity consumption. The demand curve of electrical energy
consumption in January is presented on the Fig.2.3.3.
Fig.2.3.3. Average Hourly Demand Index (% of the maximum power) in January [1].

19
Information about solar power for Turku region in January is presented on
Fig.2.3.4. Illustrated values describe daily solar irradiance in Watts for square me-
ter with optimal inclination that region [16]. Real irradiance on a fixed plane
(W/m2) described by “global real-sky” curve, this values could be used for estima-
tion of power production because it describes real sky-behavior with average
cloud cover for that month. Global clear-sky irradiance on a fixed plane (W/m2)
described by “global clear-sky” curve, it is the ideal situation of possible irradi-
ance when the sky is completely free of clouds. Diffuse irradiance on a fixed
plane (W/m2) described by “diffuse real-sky” curve.
Fig.2.3.4. Solar irradiance in January for Turku region (optimal inclination 42°)
Using presented above data it is possible to preliminary estimate average energy
production and consumption for January, also necessary area of solar panels:
If we assume that peak power Pmax=100kW, then following Average
Hourly Demand Index (Fig.4) we can assume that Pmax = 100%, thus we
can obtain daily consumption of power:

20
P=∑Ph=1433.9 kWh/day.
Using information about solar irradiance Ph,pv (W/m2) and the coefficient
of photoelectric conversion it is possible to estimate how much electric
power we can get from one square meter. Crystalline-silicon modules have
efficiencies ranging from 10 to 15%, this values based on manufacturers’
nameplate ratings (IEEE Std 1562™-2007). For Turku region in January
electric power is:
Ppv=∑Ph,pv∙k/1000=648.1∙0.15/1000=0.097 kWh/m2/day.
Thus, to cover daily consumption P the needed area of solar panels is
equal:
A= P/ Ppv=1433.9/0.097 = 14782.47 m2. (It’s a square 122x122m.)
As it could be seen the needed area of solar panels is quite big in case of power
supply in worse conditions, which makes utilization of solar energy quite expen-
sive and not-effective in winter time. Some problems could become with place-
ment of such spread PV arrays, which in island conditions could be difficult.
There is an opposite situation in June. The demand curve of electrical energy con-
sumption in June is presented on the Fig.2.3.5. Information about solar power for
Turku region in June is presented on Fig.2.3.6. For calculations of solar power
used “global real-sky” curve, which describes real irradiance on a fixed plane
(W/m2).

21
Fig.2.3.5. Average Hourly Demand Index (% of the maximum power) in June [1].
Fig.2.3.6. Solar irradiance in June for Turku region (optimal inclination 42°)
According to the information about energy consumption and also about solar ir-
radiance it is clear that there are significant possibilities for utilization solar power
plant as a source of electric energy in warm period of the year.

22
For comparison with previous results, calculations for June are presented below:
Peak power Pmax=100kW;
Daily consumption P=∑Ph=851.3 kWh/day.
Ppv=∑Ph,pv∙k/1000=22729∙0.15/1000=3.41 kWh/m2/day.
Thus, to cover daily consumption P the needed area of solar panels is
equal:
A= P/ Ppv=851.3/3.41 =249.65 m2.
One of possible ways to decide problem with effective and beneficial power sup-
ply using renewable sources of energy in case of island operation is to apply hy-
brid PV-wind power plant. Wind energy could help to cover demand of electricity
in winter time, especially in Finland.
Wind maps of Finland in winter and summer time from Finnish Metrological Insti-
tute are presented in Appendix 1. The following maps give the wind speed for
each grid point representing a horizontal resolution of 2.5 x 2.5 km2. Each grid
square thus has, or may have, areas with wind speed higher or lower than the av-
erage. According to that maps, it is clear that wind potential of island regions is
quite high, especially in winter time.

23
Fig.2.3.6. Average wind speed on the surface of the land in Turku region [26].
Even if we take for calculations wind conditions on the surface of the land (usu-
ally it is less wind speed on the surface of the land), it is possible to get satisfac-
tory results (Fig.2.3.6).
For example, wind turbine with nominal power 100kW, radius of blade
surface R=10m and wind speed V=11m/s (average speed in January for
Turku region on the 50m height from the sea level (see Appendix 1),
could produce electrical energy:
Pe=0.5EρπR2V3η=0.5∙0.45∙1.225∙3.14∙102∙113∙0.75 =86.3kW,
where E – efficiency of wind utilization, ρ – air density, η – coefficient of
power conversion.
Thus, it is the task for determination an optimal relation between necessary PV
and wind power capacity. As it could be seen, for example for Finland, in January
there is a prefecit of wind power and defecit of solar power and opposite situation
in June.
24
PV
IG AC/DC
Battery
DC/DC
DC bipolarnetwork
DC bus
DC/AC Load
Voltage control
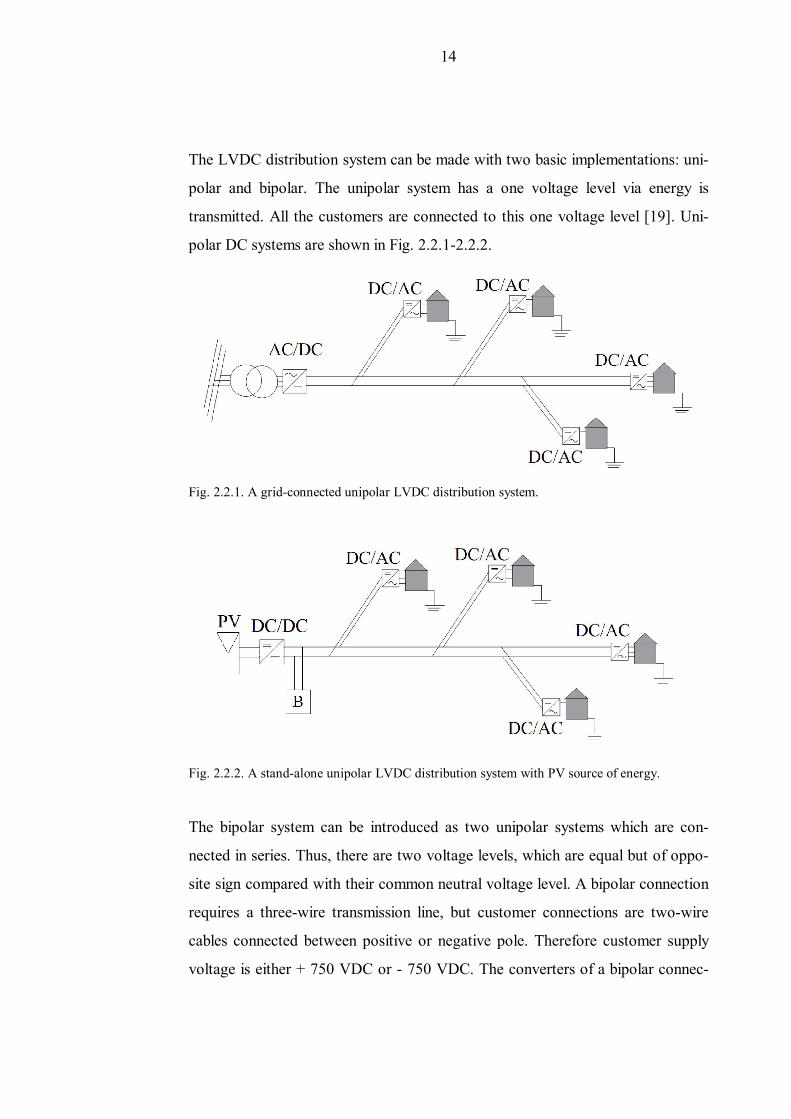
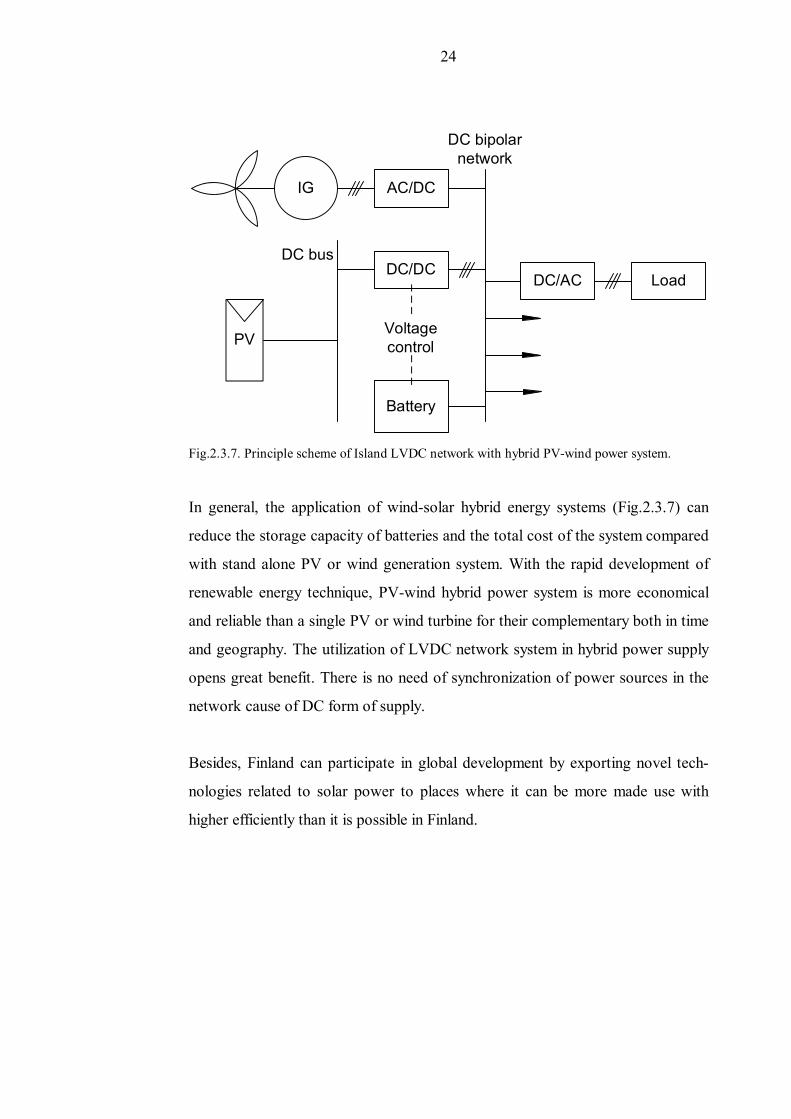
Fig.2.3.7. Principle scheme of Island LVDC network with hybrid PV-wind power system.
In general, the application of wind-solar hybrid energy systems (Fig.2.3.7) can
reduce the storage capacity of batteries and the total cost of the system compared
with stand alone PV or wind generation system. With the rapid development of
renewable energy technique, PV-wind hybrid power system is more economical
and reliable than a single PV or wind turbine for their complementary both in time
and geography. The utilization of LVDC network system in hybrid power supply
opens great benefit. There is no need of synchronization of power sources in the
network cause of DC form of supply.
Besides, Finland can participate in global development by exporting novel tech-
nologies related to solar power to places where it can be more made use with
higher efficiently than it is possible in Finland.
25
3 Requirements for Island LVDC system
This chapter is focused on the definition of necessary requirements for the novel
low voltage DC system for conversion and distribution of electrical energy in is-
land operating conditions. Innovation LVDC system is developed as independent
uninterruptable power supply system which is also expected to be used mainly
with renewable sources of energy, thus appropriate moments should be taken into
account for determination of system, functional and operational requirements.
3.1 System requirements
Generating system and related storage equipment have to meet following re-
quirements:
• they have to provide sustainable and uninterruptable power supply
• they have to meet the electrical safety requirements
LVDC distribution system and the related equipment have to meet at least the
following systemic criteria:
• they have to answer to the purpose
• they have to meet the electrical safety regulations
• voltage quality has to meet the standards (minimum requirement)
• the efficiency of the system has to be high
Furthermore, there are some additional requirements, which are essential for the
both applications:
• low acquisition costs
• low maintenance costs
• long lifetime, low life cycle costs
• easy maintenance, usability and replaceability
• opportunity to data transmission and measurement functions
• opportunity to active load control
• opportunity to connection of distributed generation

26
In design, manufacturing, installation, and use of equipment, standards concern-
ing the system and its components have to be followed.
3.2 Functional requirements
The following requirements are developed with an emphases on photovoltaic
power systems, as it is expected that it will the major source of energy in island
operating conditions, however they are not exclude the possibility of utilization of
other renewable sources of energy, such as wind, biomass or hybrid power sys-
tems.
The primary function of a LVDC electricity distribution system is power trans-
mission between a source of energy and a customer, and voltage transformation
for the customer needs. In low-voltage distribution, the system and its compo-
nents have to meet at least the following functional criteria:
• Generating system supplying the DC system:
- setup to low voltage required by rectification or DC/DC conversion
• Rectification to a LVDC distribution system and DC/DC conversion when
observing from the renewable sources of energy:
- low current distortion (THD to be less than 5 % [8], the power factor
of the DC system, when loaded, should be > 0.9 unless otherwise
agreed)
- boost-control in cases of power drawdown
- controlled start-up after a supply interruption
- energy efficiency of the power electronic modules > 98 % (target)
• Energy storage system:
- voltage level should correspond to the nominal supply voltage 1500
VDC to implement direct battery connection
- have to be designed for autonomy system work (IEEE Std 1562™):
27
for non-critical loads and areas with high solar irradiance, 5 to 7
days of autonomy are acceptable.
for critical loads or areas with low solar irradiance, 7 to 14 days
of autonomy or greater should be used.
- battery-type should be chosen with maximum possible charge-current
- batteries should be a deep-cycle type
• DC link:
- nominal voltage 1500 VDC (+10, -25 %) neutral isolated, ripple
<10%
momentary voltage being at minimum the minimum DC voltage
required to generate the customer AC voltage
- when applying full-bridge inversion, 325 VDC in one-phase
inversion, 565 VDC in three-phase inversion
application of an earthing method that takes into account the
touch voltage regulations
- safety regulations concerning low-voltage distribution have
to be met
• Voltage transformation according to the needs of the customer, mainte-
nance of the appropriate voltage level (inversion):
- sinusoidal voltage, 50 Hz constant frequency ±0.1 Hz
- voltage level 1~230 V or 3~400 V, (<±10 %)
- low voltage distortion < 5 % (0.05 x Un)
- compatibility with the present electrical installations in premises
- safety regulations concerning electrical installations in premises have
to be met
compatibility with the protections of the present internal net-
works in premises
- may not cause noise problems
- controlled start-up after a supply interruption
28
• Operating conditions
- applicable to outdoor installations, operating temperatures from -40
to +60 ºC
- Voltage withstand capability in accordance with IEC 60664-1
- target lifetime 15–20 a
- easy maintenance/replaceability
- readiness for disconnection of an individual device
3.3 Operational requirements
Following subchapter is related to definition of operational requirements for novel
Island LVDC system. Operational requirements are developed to reach the aim of
the maximum efficiency of the system simultaneously with the simplicity of reali-
sation such system, and as a consequence minimization of investments costs.
Demand response control should be used as a major mechanism to link demand
with supply. In particular, demand response can be used to reduce peak demand
and therefore reduce the price volatility. This problem is more deeply introduced
in Chapter 4.
Load control can be applied for cases of technical constrains and can be imple-
mented by voltage-relays, which control voltage level on the DC side of customer
converter and operate the switch-states of the loads. It means, that in the mo-
ments of maximum allowed discharge level of battery bank, some load will be dis-
connected automatically in order specified by customer. This problem is more
deeply introduced in Chapter 4.
Information about system status, prices for customers, produced by and con-
sumption power, time of possible autonomic work and another relevant informa-
tion, should be provided for customers by special web-service. It will be the main
customer’ information instrument for demand regulating.
29
Bipolar structure of the distribution network with nominal voltage ±750 VDC
have to be utilized to satisfy acting standards and not to exceed DC voltage limits
for commercial low-voltage underground power cables. Also it makes possible to
keep the other half of the network in operation if the other half is faulted.
Direct battery connection is more preferable for the novel LVDC system. As-
pects, relating to this problem are described in Subchapter 3.3.1.
Control system for the line conversion and the state of charge of the battery bank
should be implement by main DC/DC converter. It allows to decrease number of
power electronic devices, hence reduce investment costs and increase the reliabil-
ity. However, it is required to develop specific algorithm of control for such pur-
poses.
Number of days with autonomy system works should be determined accordingly
to weather conditions of a region, as the main source of energy in island condi-
tions expected to be renewable, which is mainly weather-dependant. Battery bank
size defines respectively to the number of autonomy days. More deeply it is de-
scribed in Subchapter 3.3.2.
3.3.1 Battery connection
Following below variants of battery bank connections are described mostly for
photovoltaic power systems, however those conceptions could implemented with
any power sources.
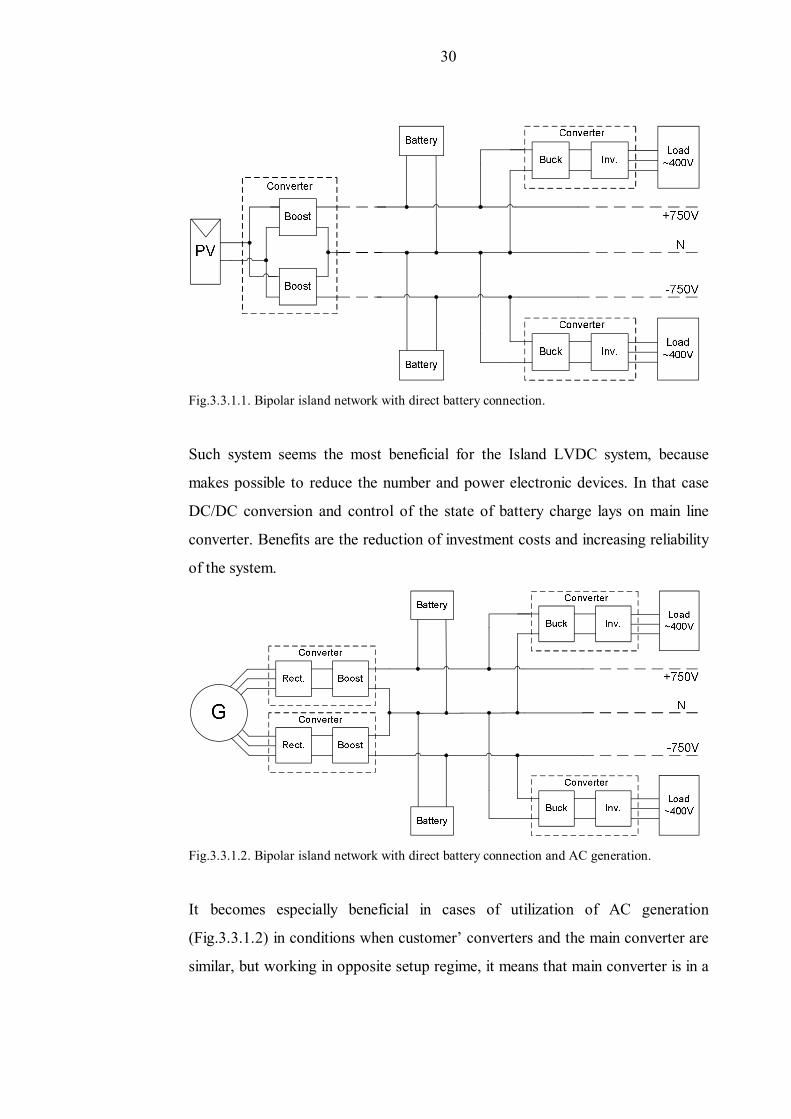
First possible system setup is bipolar DC network with direct battery connection.
In this variant DC voltage from the PV array converted to necessary system volt-
age with the help of two converters which have common neutral point. Battery is
connected after filter part of the converter. Load is connected to the DC/AC con-
verter, which is buck the voltage and transform in to the tree-phase alternative
waveform. This system setup is presented on the Fig.3.3.1.1.
30
Fig.3.3.1.1. Bipolar island network with direct battery connection.
Such system seems the most beneficial for the Island LVDC system, because
makes possible to reduce the number and power electronic devices. In that case
DC/DC conversion and control of the state of battery charge lays on main line
converter. Benefits are the reduction of investment costs and increasing reliability
of the system.
Fig.3.3.1.2. Bipolar island network with direct battery connection and AC generation.
It becomes especially beneficial in cases of utilization of AC generation
(Fig.3.3.1.2) in conditions when customer’ converters and the main converter are
similar, but working in opposite setup regime, it means that main converter is in a
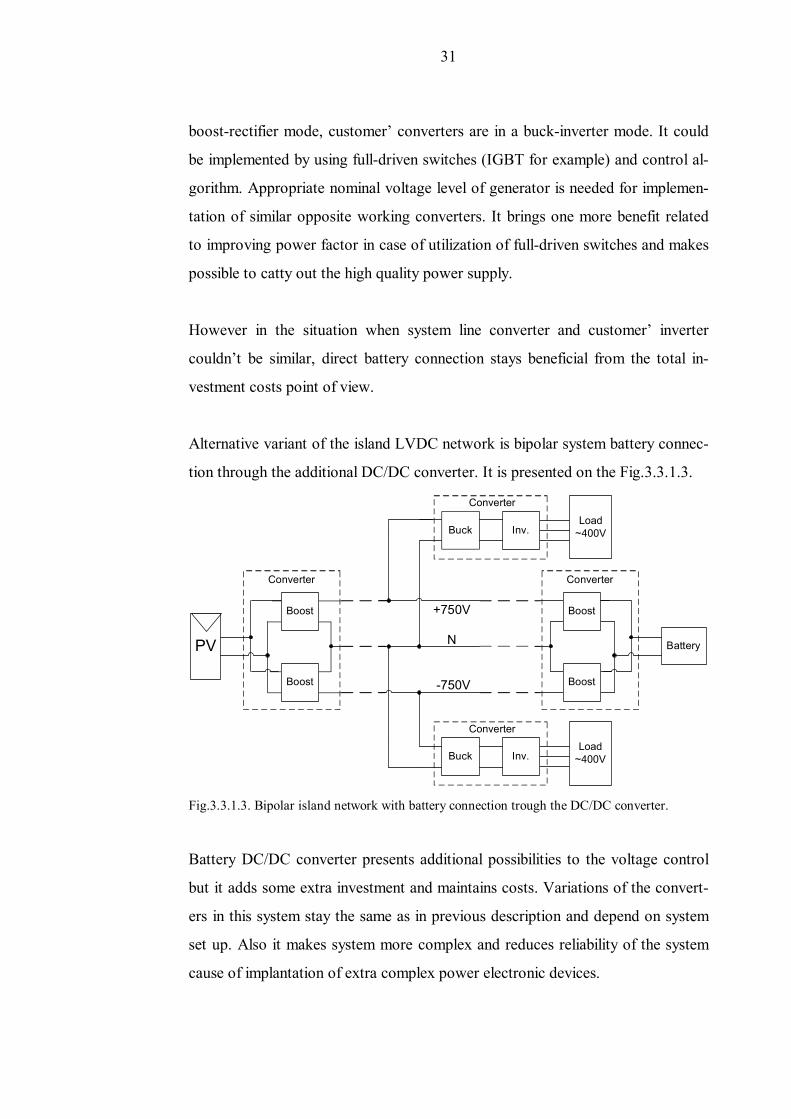
31
boost-rectifier mode, customer’ converters are in a buck-inverter mode. It could
be implemented by using full-driven switches (IGBT for example) and control al-
gorithm. Appropriate nominal voltage level of generator is needed for implemen-
tation of similar opposite working converters. It brings one more benefit related
to improving power factor in case of utilization of full-driven switches and makes
possible to catty out the high quality power supply.
However in the situation when system line converter and customer’ inverter
couldn’t be similar, direct battery connection stays beneficial from the total in-
vestment costs point of view.
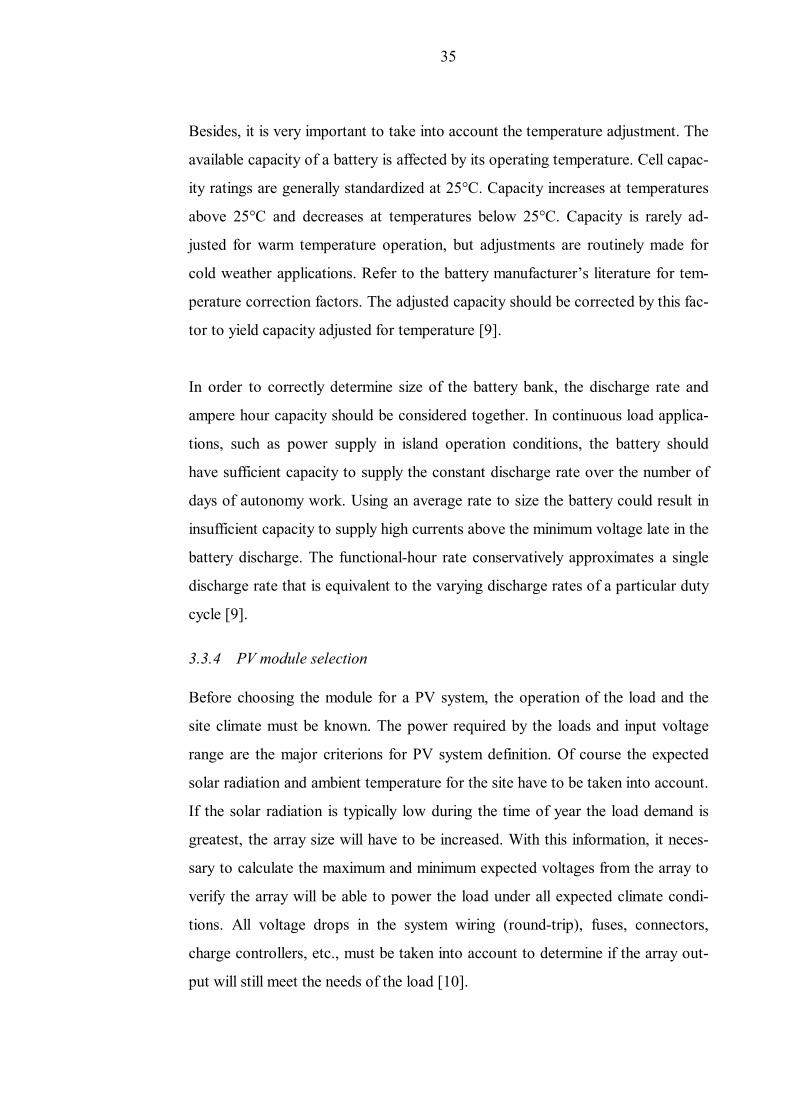
Alternative variant of the island LVDC network is bipolar system battery connec-
tion through the additional DC/DC converter. It is presented on the Fig.3.3.1.3.
Buck Inv.
Converter
Load~400V
Buck Inv.
Converter
Load~400V
Battery
Boost
Boost -750V
+750V
NPV
Converter
Boost
Boost
Converter
Fig.3.3.1.3. Bipolar island network with battery connection trough the DC/DC converter.
Battery DC/DC converter presents additional possibilities to the voltage control
but it adds some extra investment and maintains costs. Variations of the convert-
ers in this system stay the same as in previous description and depend on system
set up. Also it makes system more complex and reduces reliability of the system
cause of implantation of extra complex power electronic devices.

32
3.3.2 Battery type selection
Batteries are designed to accumulate excess energy created by source of energy
and store it to be used at night or when there is no other energy input. Batteries
are rated according to their "cycles" and could have shallow cycles between 10%
to 20% of the battery's total capacity, or deep cycles up to 50% to 80%.
According to the world practice in design of PV systems, there are two ways of a
simple and effective determination of battery bank size. The first idea is that most
batteries will last longer if they are shallow cycled–discharged only by about 20%
of their capacity–rather than being deep-cycled daily. It means that a reasonable
design will save the deep cycling for occasional duty, and the daily discharge
should be about 20% of capacity [5].
Another statement is that deep cycle battery type is more beneficial for using in
solar PV system. Deep cycle battery is specifically designed for to be discharged
to low energy level and rapid recharged or cycle charged and discharged day after
day for years. The battery should be large enough to store sufficient energy to
operate the appliances at night and cloudy days.
Basing on the literature survey and different studies in this area, it is possible to
make a conclusion that the most beneficial choice for Island LVDC microgrid,
especially in Finnish conditions, is deep cycle battery type , because it allows to
charge the bank very rapidly. It’s very important in winter time, when solar en-
ergy is available only for few hours during daily time or in clearing time during
cloudy weather. However, this battery bank has to be designed for working in
shallow regime. This is done to increase the life time of batteries and simultane-
ously have the possibility for deep discharging during bad weather conditions and
rapid charging in moments of suitable conditions.

33
3.3.3 Battery capacity
Application of photovoltaic power system island low voltage DC network may
require some battery reserve, both for reliability of system and to provide time for
intervention in the event of an unanticipated case such as unusually poor weather
or failure of a system component. In general case, the number of days of battery
reserve is commonly specified as a system design requirement, and is based on
several considerations including the following [9]:
a) System application. Critical load applications generally require more
days of battery reserve than noncritical applications.
b) System availability. System availability is the minimum percentage of
the time that the PV system should be able to satisfy the system loads.
c) Solar irradiance variability. Daily and seasonal variations in solar ir-
radiance affect the required number of days of battery reserve.
d) Predictability of load. The load may or may not be predictable; also,
there may be the possibility of adjusting the loads, e.g., dropping non-
essential loads.
e) Backup power provisions. If the PV system includes provisions for
backup power, the desired frequency and duration of operation of the
backup power source needs to be considered.
f) f) Accessibility of site. The worst-case time required for correction of
any problem should be considered.
The number of days is defined by IEEE Standard 1562-2007 “IEEE Guide for
Array and Battery Sizing in Stand-Alone Photovoltaic Systems”. For non-critical

34
loads and areas with high solar irradiance, 5 to 7 days of autonomy are accept-
able. For critical loads or areas with low solar irradiance, 7 to 14 days of auton-
omy or greater should be used [10].
The required battery capacity for a PV application is determined by the number of
days of battery reserve and by the characteristics of the load, battery, and installa-
tion. A functional-hour rate for the application is determined by capacity and load
calculations [9].
The unadjusted capacity, in ampere hours, is calculated by multiplying the days of
battery reserve by the average daily load (in ampere hours/day). Then, the unad-
justed capacity should be modified to assure satisfactory battery cycle life. Battery
manufacturers rate cells for maximum depth of discharge (MDOD), maximum
daily depth of discharge (MDDOD) and end-of-life (EOL) capacity. The battery
capacity should be adjusted in the following ways [9]:
a) The capacity adjusted for MDOD is obtained by dividing the unad-
justed capacity by MDOD (in percent).
b) The capacity adjusted for MDDOD is obtained by dividing the maxi-
mum daily ampere hours by MDDOD (in percent).
c) The capacity adjusted for life is obtained by dividing the unadjusted
capacity by the end-of-life capacity expressed in percent of the rated
capacity, commonly 80%.
The largest of these three capacities will satisfy the depth-of-discharge and end-
of-life adjustments.
35
Besides, it is very important to take into account the temperature adjustment. The
available capacity of a battery is affected by its operating temperature. Cell capac-
ity ratings are generally standardized at 25°C. Capacity increases at temperatures
above 25°C and decreases at temperatures below 25°C. Capacity is rarely ad-
justed for warm temperature operation, but adjustments are routinely made for
cold weather applications. Refer to the battery manufacturer’s literature for tem-
perature correction factors. The adjusted capacity should be corrected by this fac-
tor to yield capacity adjusted for temperature [9].
In order to correctly determine size of the battery bank, the discharge rate and
ampere hour capacity should be considered together. In continuous load applica-
tions, such as power supply in island operation conditions, the battery should
have sufficient capacity to supply the constant discharge rate over the number of
days of autonomy work. Using an average rate to size the battery could result in
insufficient capacity to supply high currents above the minimum voltage late in the
battery discharge. The functional-hour rate conservatively approximates a single
discharge rate that is equivalent to the varying discharge rates of a particular duty
cycle [9].
3.3.4 PV module selection
Before choosing the module for a PV system, the operation of the load and the
site climate must be known. The power required by the loads and input voltage
range are the major criterions for PV system definition. Of course the expected
solar radiation and ambient temperature for the site have to be taken into account.
If the solar radiation is typically low during the time of year the load demand is
greatest, the array size will have to be increased. With this information, it neces-
sary to calculate the maximum and minimum expected voltages from the array to
verify the array will be able to power the load under all expected climate condi-
tions. All voltage drops in the system wiring (round-trip), fuses, connectors,
charge controllers, etc., must be taken into account to determine if the array out-
put will still meet the needs of the load [10].

36
3.4 Electric safety and fault protection in LVDC microgrids
The electrical safety of the presented island distribution network cannot be ne-
glected. Compared to the traditional distribution system the LVDC network has
more different fault situations. One of the reasons of these challenges is applica-
tion of power electronic devices. They could be the reason of switch faults and
also need more complex protection device operation [20].
Possible fault situations in the DC network are
• short circuit in a positive pole
• short circuit in a negative pole
• short circuit between positive and negative pole
• without neutral connection
• short circuit between positive and negative pole
• with neutral connection
• earth fault in positive conductor
• earth fault in neutral conductor
• earth fault in negative conductor
Possible fault situations in the customer AC side are short circuit and earth fault.
The customer network short circuits could be also the reason of short circuit situ-
ations in power electronic devices.
As it was mentioned above, power electronic devices can introduce switch faults
which can create switches to be short circuits or open circuits. Also the modula-
tion can stall introducing permanent connection from converter’s input to its out-
put [20].
3.4.1 System grounding
Used DC voltage levels in the LVDC system can be a reason of high earth volt-
ages in difficult grounding conditions with incorrect grounding arrangement. In

37
such conditions it is necessary to construct the DC system as an ungrounded IT
system. Earth faults in a system with the IT grounding arrangement present only
small earth voltages because of the lack of a fault current loop. In case of utiliza-
tion of TN system, any earth-connected fault will cause immediate exceeding of
the safe earth voltages in the typical Finnish grounding conditions [17]. High level
of earth voltages can occur also in double earth fault situations of the IT systems,
as it was mentioned. Therefore, standardization requires that at least alarming in-
sulation monitoring is necessary to use in ungrounded systems to indicate the first
fault [25]. In cases of the first fault it is also desirable to use tripping to reduce
the possibility of double fault situations.
In a galvanic constant system with the IT grounding application, the average po-
tential of customer networks depends of the earth potential and consequently
floats continuously. Hence, it is important to keep the protective earth connec-
tions in good conditions. The potential difference of any energised part of the cus-
tomer network is not allowed to exceed an RMS value of 500 V against the earth
[22]. The pole voltages of the LVDC system have to be reduced to ±700 VDC to
safely meet this standard requirement.
It is also possible to implement TN grounding system in the customers’ networks,
but it necessary to implement a galvanic isolation transformer between the DC
and customer networks. In this case, floating potential difference between the
earth and the customer’s devices is eliminated. It allows to use full ±750 VDC
voltage range in the public network. However, galvanic isolation arrangements
makes the inverter structure more complex, and as a consequence there is a rise in
investment cost and losses of the inverter.
3.4.2 Fault protection
The LVDC network faults can be eliminated with combination of different type of
protections, such as over current and short circuit protection and earth fault pro-
tection. Molded case circuit breakers which includes circuit breaker and over cur-

38
rent relay could be implemented in the LVDC system for the short circuit protec-
tion. It can be located either on AC or DC side of the converter. In case of the
AC side the breaker can eliminate converter switch faults also. The poles of the
LVDC bipolar system are needed to have its own protection devices. The molded
case circuit breaker is illustrated with letter A in figure 3.4.2.1. The DC fuses also
could be utilized in DC part of the system. The DC fuse is indicated with letter B
in figure 3.4.2.1. [20] However, in modern conditions fuses could be replaced
with DC circuit breakers, it improves reliability and decrease time of maintenance
work.
Fig. 3.4.2.1. A proposed protection scheme for bipolar LVDC microgrid with ungrounded IT
system.
Utilization of ungrounded system requires individual protection device for the DC
network earth faults. The insulation monitor can be applied to eliminate first fault.
In that case the insulation monitor can be used for operation with circuit breaker
which is used for short circuit protection also and no additional circuit breaker is
needed. The insulation monitor is indicated with letter C in figure 3.4.2.1.
For short circuit protection in customer AC side can be applied circuit breakers
and fuses. The circuit breakers and fuses is illustrated with letter D in figure
3.4.2.1.

39
Application of the insulation monitoring devices is necessary in customer AC side
to cover earth faults and have selective directional earth fault protection. For this
purposes also needs an additional device for directional operation. The customer
insulation monitor is illustrated in the figure 3.4.2.1 with letter E.
The 30 mA residual current devices can be applied to improve human safety in
double fault situations between DC and customer AC networks. In such situations
residual current device separates customer network from DC side. The residual
current device is indicated with letter F in figure 3.4.2.1.
3.4.3 Protection requirements
The protection requirements which are occur from LV standards and the system
operation requirements of novel LVDC distribution system are determine the pro-
tection requirements. Power electronic device operation is also taken into ac-
count, because it is also needed that converters can withstand the fault situations
without a breakdown [21].
The Finnish LV standardization [25] defines LVDC system to fulfill following
requirements:
• maximum earth voltage 240 VDC
• maximum contact voltages 50 VAC and 120 VDC
• insulation monitoring needs to be used to at least give a alarm of insula-
tion decrease in ungrounded system
• earth fault needs to be cleared within 2 h in ungrounded system
• DC network short circuit needs to be cleared within 5 s
• customer AC network short circuit needs to be cleared within 0.4 s in
grounded system and within 0.8 s in ungrounded system
The requirements of desirable system operation are
• protection zone for LVDC system to reduce fault impact and decrease
number of faults (SAIFI)

40
• selectivity in earth fault protection between customer network and DC
network
• selectivity in short circuit protection between inverter current trip opera-
tion and customer network protection device operation
• to operate at first fault situations in DC network earth faults to decrease
risk of double fault situations
• the healthy pole of bipolar system can be in operation while other pole is
faulted

41
4 Control of the Island LVDC system
The Island LVDC microgrid is a complicated power system which requires effi-
cient control algorithms and principles to provide reliable, sustainable and uninter-
ruptable power supply for the customers. Simultaneously with that requirements
is necessary to achieve maximum of economic benefit and reduce investment
costs. Following chapter is related to the definition of main control concepts for
low voltage DC network regulating, which allow to implement all mentioned
above statements.
In general, control methods of the presented Island LVDC microgrid could be
divided into two conditional parts. First is a price-based control, which allows to
regulate customer’ energy consumption using price for the electricity as the in-
strument of control. Proposed price mechanism can improve residential energy
consumption patterns by using web services to provide information for customers
and also aggregate consumer preferences, real-time metering and forecasting. It is
expected that such type of control will be a major regularity tool for achieving the
power balance in Island LVDC system.
Second mechanism is a technical regulation which includes technical constraints
and control of system parameters. It combines customer voltage control, auto-
matic load operation (connection/disconnection) and also protection arrange-
ments. It can be presented as a the secondary level of control which starts to op-
erate when first level cannot cope with the problem of power balance.
The arrangement of mentioned above regulating mechanisms have to provide
flexible and effective control for the presented LVDC distribution system. These
two principles are described more deeply in relevant subchapters below.

42
4.1 Price-based demand control
Demand side management becomes a key component of control for modern net-
works nowadays. It helps reduce peak load and adapt elastic demand to fluctuat-
ing generations. Besides, such responsive demand becomes increasingly important
in electrical power systems with application of weather-dependent renewable gen-
eration, due to the difficulty and expense of storing electrical energy.
During study work one common approach for the presented problem was found.
It lies in the fact that the each player develops an individual demand response
program to deal with peak demand that suits their own objectives [13]. The Island
LVDC system is not an exception, because weather-dependent generation and
DC technologies are significantly affect on system behavior.
In this way, price-based demand response control is introduced as a mechanism to
link demand with supply in Island LVDC power system. In particular, demand
response can be applied to reduce peak demand and also to affect on consump-
tion for effective battery management. As it was already mentioned, photovoltaic
power production extremely depends of the weather conditions and it is needed
to be taken into account. The main idea of demand response in Island LVDC sys-
tem with PV generation is, at first, to reduce power consumption in time of solar
activity and direct energy to charge battery bank as quickly as it possible, because
next opportunity to make it may not be soon. Secondly, to transfer peak loads on
the time with minimum consumption. It makes possible to reduce battery dis-
charge state and prolong battery lifetime.
As the price is the instrument of regulating, it is necessary to affect on customers
through it, it means that price should represent a signals for a particular user ac-
tion. For example, it should be beneficial for customer to disable part of the load
during the time of solar activity, because it is necessary for system to charge bat-
teries quickly. It is also might be beneficial for customer to enable some load in
43
night time, when consumption is minimal, for example washing machines and dis-
hwashers, because it will allow to spread the loads evenly and as consequence to
prolong battery discharge cycle.
Price formation, which reflects necessary actions for the system and allows to im-
plement price-based demand response for LVDC microgrid is described in the
subchapter following below.
4.1.1 Price determination
Novel Island LVDC microgrid requires an individual price formation principle
because of specific power generations and operation conditions and also due to
specific topology of the network and device installations.
Pricing should be carried out on a simple and efficient algorithm that takes into
account the specifics of the application of weather-dependent renewable power
source and low voltage DC distribution technologies, which are in significant in-
vestment costs, insufficient maintenance costs and high volatility of power supply.
Proposed mechanism for price determination is presented of the figure 4.4.1.1.
Following presented scheme, structure of pricing could be conditionally divided
into two ways which are costs for generation and costs for distribution. Consider-
ing annual generation and system profiles of load behavior and generation possi-
bilities, it is possible to obtain these two components and by summing get actual
price for the electricity for customer.
However, as it was described previously, it is necessary to affect on customer by
price changing in required situations. The main idea of proposed below method is
to include a so-called Price Correction Coefficient, which will readjust the price
for required situations, for example make prices high in time necessary for battery
charging and opposite make prices low in night time.

44
Annual costs of generation:
-capital-operative
Annual costs of network: -capital
-maintenance-losses
/Expected annual
generation/
€/MWh
Generation profile
x € for generation
€/MWh
Load profile
x€ for network+
Price for electricity
Fig. 4.4.1.1. A proposed price formation scheme.
As price have to reflect on external conditions, such as weather forecast and as a
consequence possibilities for generation, load forecast and the most important
state of battery charge, thus, this requirement could be implement with the cor-
rection price coefficient, which have to take into all mentioned information. Price
determination, in this case, based on inaccurate information such as forecasted
data. Therefore, for these purposes could be used fuzzy logic theory, suitable for
work with inaccurate information even in linguistic form. This method based on
expert assessments and allows to get quickly an accurate results in real time.
Expert methods define term-set of parameters that form the membership functions
for all linguistic variables. The set of rules in fuzzy expert system generates a rule
base. Generally, it is based on three stages, which are fuzzyfication, fuzzy logic
output and defuzzyfication. Named stages are performed by following below
functions:
Fuzzyfication stage transforms input variables in categories of fuzzy logic,
and any grade of membership () is determined by obtained fuzzy set.

45
Fuzzy logic output forms conclusions about the current fuzzy set based on
information from the rule base.
Defuzzyfication block transform fuzzy logic output to the concrete value.
In presented problem it will be a value of correction price coefficient.
Rule base consists of terms which are describing correction price coefficient de-
termination in such view (as possible example):
IF weather forecast (W) is in good AND load forecast (L) is bad AND
battery charge (B) is full THEN correction price coefficient (k) is low.
Therefore, schematic illustration of fuzzy logic mechanism for determination of
correction price coefficient k presented on the figure 4.4.1.2.
Fig. 4.4.1.2. Fuzzy-logic scheme of correction price coefficient.
Hence, customer price could be presented as equation (4.4.1.1):
C=Ce∙K, (4.4.1.1)
where Ce is a price for electricity and k is a correction price coefficient, which is:

46
K= max{i(W); i(L); i(B)}, (4.4.1.2)
where i(W), i(L), i(B) are membership functions for Weather forecast, Load
forecast and Battery charge. Using composition (max), all the fuzzy subsets as-
signed to each output variable are combined together and formed a single fuzzy
subset for each value of the output variable.
4.1.2 Application of nodal pricing
In conditions of utilization of low voltage DC distribution system in Island oper-
ating situation it is possible to apply nodal price methods for determination of the
price for the electricity. In that case, prices in each node of the distribution system
will be calculated and bases on them, common price will be defined.
Nodal prices reflect the actual situation in the grid more transparently than uni-
form or zonal prices and represent adequate price allocation signals. Nodal prices
may also save costly investments in transmission lines [27].
Nodal price shows the cost of energy purchased in single node. It includes gener-
ating costs, loss costs and costs of system’s congestions. Nodal prices are usually
different and it is necessary to determine them through the financial-technical
models. In these models each generator costs, losses in network between supplier
and buyer, physical and financial balances in nodes are considered. It is assumed
also that nodal prices would send adequate signals in form of price increasing that
show local demand for boosting of generation output or transmission capability of
network. Equilibrium price in every node depends on demand and offer of elec-
tricity in that node, equilibrium prices in other node, and available transmission
capacity of network and order of dispatching. Insufficient transmission capacity
could lead to market’s segmentation and increasing of participant’s concentration.

47
The future research work should be forwarded to the deep study of possibility of
application such methods for the novel LVDC system. In addition, on the next
step a simultaneous optimization of the technical properties of the necessary
scheme (power losses, and voltages in nodes) and electricity prices in nodes needs
realization.
4.2 Technical control
Technical control from the LVDC microgrid point of view includes power bal-
ance control, voltage control and protection arrangement. As it was mentioned
previously utilization of DC technologies provide great benefit as there is no need
to care about reactive power component and synchronization of power sources in
the network. Therefore, power balance regulation could be implemented with ac-
tive power control, which means in island LVDC conditions that it is necessary to
achieve equality between produced active power by photovoltaic power plant,
active residential load, and stored active power in energy storage.
4.2.1 Power balance control
Main mechanism for achieving power balance in the system is to control the vital
elements of the Island LVDC system, such as produced PV power, battery charge
and customer loads, and to achieve power balance between it. It requires high
speed communication system and intellectual microgrid management system
(MMS), which will be responsible for the co-ordination of the power balance
management.
In general, it is proposed that the microgrid power balance can be maintained by
charging or discharging the energy storage as needed i.e. if control of the master
unit cannot keep up the power balance.
Utilization of demand side management as part of LV microgrid power balance
management requires full adoption of smart metering and smart control of loads
within the microgrid. In addition, household MMSs should be able to directly

48
control all dispatchable loads in the household. Fast load disconnection during
island operation of LV microgrid requires utilization of high-speed communica-
tion, as it was mentioned above[6].
4.2.2 Voltage control
In general, power balance control is deeply interconnected with Voltage control,
it could be said that it is main instrument of power balancing. Nowadays, there
are two major different DC bus voltage control schemes investigated. One of the
methods, known as the communication or master/slave method, which is strongly
relies on fast communication between the source and load converters. The output
power, with sign, is calculated for each of the converters. Information on total
output power is fed forward to the converters. One of the converters, the master,
is responsible for controlling the DC bus voltage. Feed forward of the total output
power allows for high bandwidth DC bus voltage control. The DC bus voltage
controller is, however, still required during transients and to compensate for
losses in the DC power system. Due to the resistive voltage drop, a proportional-
integral (PI) controller is adopted in order to avoid stationary DC bus voltage er-
ror.
The other method is referred to as voltage droop control. Droop control does not
require any communication at all between the converters. Instead, the DC bus
voltage is measured at the source converter terminals. All the source converters
contribute to balance the total power consumed by the loads and the losses of the
DC power system. In common voltage droop control, the DC bus voltage de-
creases linearly as the output power for the converter increases, in order to give
stable operation. This, of course, yields a stationary error in the DC bus voltage.
Therefore, a restoration process to reduce the stationary DC bus voltage error
need to be taken into account.
49
4.2.3 Specific of voltage control
As it known, traditionally voltage regulation on passively managed low voltage
distribution networks has been done with fixed off-load transformer tap changers
at MV/LV distribution substations [6]. However island conditions, PV power
generation and utilization of DC form of supply require more intelligent methods.
In such system voltage control responsibility lays on main line converter control
system and battery management system, and also as a secondary level on control
of customer inverters. The control systems for converters, as also the load sharing
mechanisms, is a separate and very important part of research work, because it is
necessary to design a specific algorithms of control, suitable for the novel low-
voltage DC distribution system.
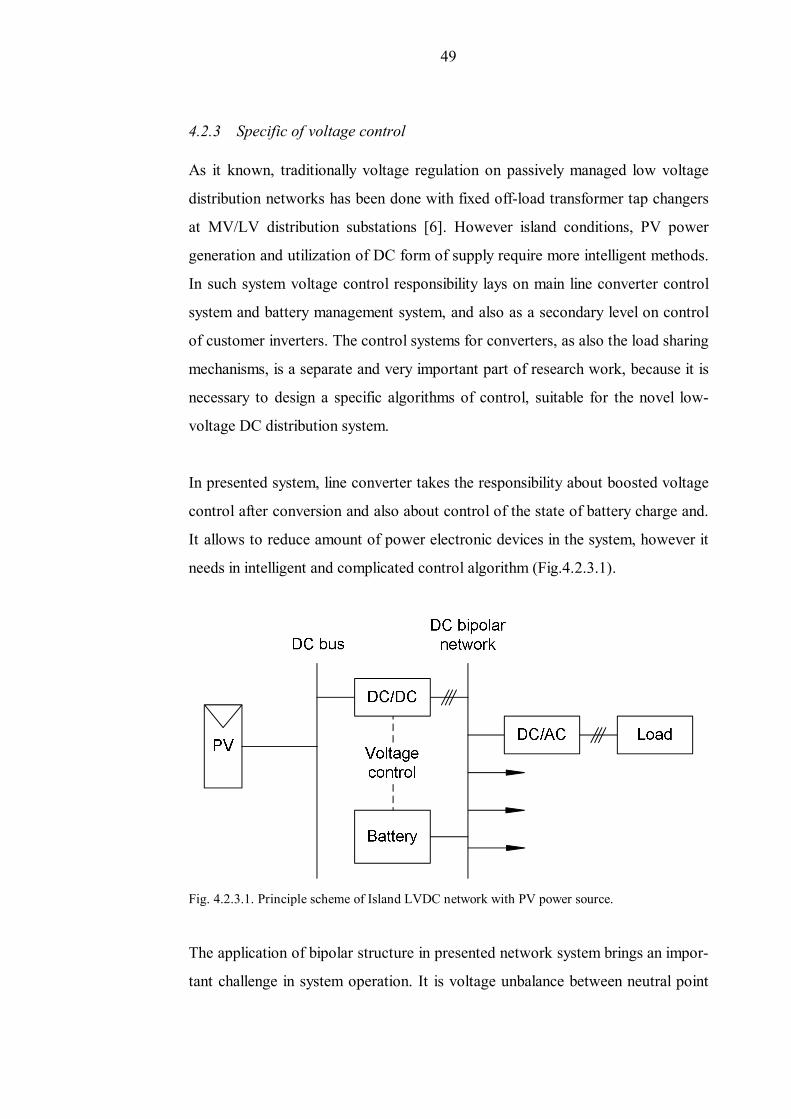
In presented system, line converter takes the responsibility about boosted voltage
control after conversion and also about control of the state of battery charge and.
It allows to reduce amount of power electronic devices in the system, however it
needs in intelligent and complicated control algorithm (Fig.4.2.3.1).
Fig. 4.2.3.1. Principle scheme of Island LVDC network with PV power source.
The application of bipolar structure in presented network system brings an impor-
tant challenge in system operation. It is voltage unbalance between neutral point

50
and poles. Therefore excessive voltage unbalance should be compensated mainly
through the control of energy storage and controllable loads. In future scenario,
single-phase DG units and charging of electrical vehicles have to be taken into
account for decision of this problem.
In general, from the LV microgrid concept's point of view it is essential that the
chosen method for the compensation of excessive voltage unbalance in island op-
erated LV microgrid is compatible with other chosen technical solutions of LV
microgrid concept. These are for instance protection principles and settings, volt-
age level and voltage THD management [6].
Controllable customer loads could be applied for power balance maintenance and
prolong independent system operating in some way. It can be implemented by
voltage-relays, which control voltage level on the DC side of customer converter
and operate the switch-states of the loads. When the discharge level of energy
storage achieve a certain value some loads disconnect automatically in order to
reduce power consumption and keep system voltage at the appropriate level. The
order of disconnection of load is determined by customer in advance. In worth
case, when the energy storage devastated and power production eliminated cause
of weather conditions there will be a total disconnection of a customer. For that
reason customer’ household have to be equipped with additional independent
power source, for example diesel-generator or EV. Automatic recovery of power
supply must be implemented.
4.2.4 Load sharing
There are also basically two different methods to achieve load sharing. One of the
methods is referred to as the droop concept and the other as the master/slave
concept.
For the droop concept, a finite loop gain for the DC voltage controller is adopted.
A droop characteristic is obtained from the transfer function slope in the P-V

51
plane at the desired DC bus voltage. Since this droop characteristic appears as a
negative slope in the P-V plane, load sharing is obtained. The quality of load
sharing is determined by the negative slope of the droop characteristic, i.e. for a
steep slope, load sharing is good but voltage regulation is poor. On the other
hand, for a shallow slope, load sharing is poor but voltage regulation is good.
Therefore, a trade-off between voltage regulation and load sharing has to be made
for the droop concept.
In the master/slave concept, only one of the source converters is controlling the
DC bus voltage. The other source converters are current controlled. This results
in a stiff DC bus voltage regulation and a fully controllable load sharing.
As research work sows [28], in a situation where several converters connected to
the DC distribution bus that all control the voltage precisely to the reference at
their respective connection point, load sharing among sources is not controlled.
Instead, load sharing is entirely determined by the distribution bus impedance.
During design load sharing mechanism for the Island LVDC microgrid it is neces-
sary to take into account specific of innovative system, and chose suitable method
as the basis for future development.
52
5 Case calculations
In following chapter, case calculations are presented basis on the example of pos-
sible LVDC microgrid. The results helps to get preliminary answer the question:
is it possible during summer time to have a microgrid system based on solar pan-
els? Also the economical efficiency of represented system in summer time is esti-
mated.
However, in spite of non-efficiency of application of PV panels in winter time,
which was shown in Subchapter 2.3., such case was also emulated during model-
ing due to study the influence of consumption and production of energy in differ-
ent conditions.
5.1 System definition
For presented case calculation following system example was accepted:
• Location on Turku archipelago - 60°26'57" North, 22°15'33" East, Eleva-
tion: 35 m a.s.l.;
• ±750V DC bipolar structure of system;
• Total power of the system – 100kW (peak value);
• Number customers – 15;
• Total length of LV network – 2700m;
• Load growth in the system – 1% for t = 40a;
• Depreciation time T = 15a;
• Lifetime for converters – 15a;
• Lifetime for PV panels – 20a;

53
Fig. 5.1.1. Island LVDC distribution network.
5.2 Consumption calculations
For the purpose of defining of daily consumption were used graph 2.3.5. [1] pre-
sented in the Subchapter 2.3., which are describe customer’ consumption behav-
ior in June when there are the best conditions for power production from solar
energy.
Peak power Pmax=100kW;
Daily consumption in June dtPP hJun
24
0
851.3 kWh/day.
Obtained result is used for determination of necessary energy storage capacity
and required power of PV system.

54
5.3 Battery size calculation
As it was justified in previous chapters the deep-cycle type of batteries is more
suitable for presented LVDC system. According to the standards related to the
determination of battery capacity for stand-alone island systems with PV genera-
tion [9, 10] it is required that energy storage can maintain an uninterruptable
power supply at least for 7 days in extra cases. So that, battery capacity could be
obtained as:
Pbat = PJun∙d = 851.3∙7 = 5959.1kWh ≈7945Ah.
For accurate determination of battery capacity the worst case of energy consump-
tion have to be considered.
For following modeling batteries type was chosen Lead-Acid deep cycle type,
nominal voltage 750V, maximum charged voltage 816.6V, nominal discharged
current 30A. Characteristics of the battery bank were set up automatically from
Matlab database according to the nominal voltage and rated capacity.
5.4 PV array size calculation
The nominal peak power is the power rating given by the manufacturer of the
module or system. It is the power output of the module(s) measured at
1000W/m2 solar irradiance (and a module temperature of 25°C and a solar spec-
trum corresponding to an air mass of 1.5). This means that if modules are 100%
efficient, it is needed 1m2 to get a system with a peak power of 1kW. These con-
ditions are known as Standard Test Conditions(STC).[16]
In other words, if Ppk is the nominal peak power and A the area of the module(s),
it is:
Ppk= A*effnom (5.4.1.)

55
The actual power depends on the irradiance G and the real module effi-
ciency eff which is a function of irradiance and module temperature Tm. So it is
possible to obtain the actual power:
P = G/1000 * A*eff(G,Tm) = G/1000*A*effnom * effrel(G,Tm) (5.4.2.)
where we have written the actual efficiency as the product of the nominal effi-
ciency effnom and the relative efficiency effrel(G,Tm).
Combining Eq. 5.4.1 and 5.4.2 it is possible to get:
P = G/1000 * Ppk * effrel(G,Tm) (5.4.3.)
Therefore, if the relative efficiency and the peak power are know, there is no need
to know the nominal efficiency or the area.
According to the introduced information and graph 2.3.6 represented in Subchap-
ter 2.3., it possible to determine necessary area of PV panels if the efficiency and
power consumption are known.
Daily irradiance in June: dtGG hJun 24
0
= 22729/1000 = 22.729kWh/day.
Power that could be obtained from 1m2 in June: Ppv,Jun = GJun∙k =
22.729∙0.15 = 3.41 kWh/m2/day, where k is efficiency [15].
Thus, to cover daily consumption P the needed area of solar panels is equal:
A = PJun/ Ppv,Jun = 851.3/3.41 = 249.65 m2. (It’s a square 15x15m.)
For the most accurate calculations the worst case have to be take into account.

56
Thus, peak power that PV power plant can produce in STC:
Ppk= A∙k = 249.65∙0.15 = 37.45kW.
The value of peak power is necessary for following price calculations.
5.5 Price calculation
For decision problem with price determination it is necessary to define the situa-
tion with the ownership of the system. Will this system be provided for customers
by some independent company and customers will need to pay to this company,
or customers will own this system by themselves, which means that they will
share the sufficient capital investment for constructing system.
In first case, company which provides power system is interested in a short de-
preciation period and needs to determine necessary monthly payments for cus-
tomers. It is also requires a smart price-based demand control to prolong the life-
time of batteries and other equipment, reduce maintenance work, outages and
costs.
In second case, customers, which own the power system and took money for
construction for example in a bank, have to make monthly payments to the bank
and save up money for future renovation and maintenance of the system. In that
situation the price-based demand control could be represented as a virtual mecha-
nism for effective system operation.
However, it is necessary to determine the capital investment in power system.
Distribution system:
• Line investment - 31400€;
• Converter investments - 72250€;
57
Capital investment in PV power plant:
• PV power plant investments – 74900€ (C = Ppk ∙c = 37.45kW ∙ 2€/W);
• Energy storage - 1490000€ (C = Pbat ∙c = 5959.1kWh ∙ 250€/ kWh);
Lifetime investment in the system:
• Line losses - 5000€;
• Converter losses - 9270€;
• Interruptions - 200€;
• Maintenance and fault repair - 2530€;
Total costs are Ctotal = 1685550€ ≈ 1.69 million euro.
For determination of a constant annual cost amount required for the repayment of
the capital and interest charges during the lifetime it is necessary to make annuity
calculation:
15)100/51(
11
100/5
)100/1(
11
100/
tp
p =0.096;
where p = 5% is the interest rate and t=15a is the investment lifetime in years.
Thus, the annuity payment is:
Ca = Ctotal∙ ε = 1685550 ∙ 0.096 = 161812.8€.
So that it is possible to define monthly payment for customer:
Cm = Ca / (12 ∙ 15) = 684542.4 / (12 ∙ 15) = 898.96€.
Taking into account the obtained fixed price for electricity, then it is possible to
change it with the help of correction coefficient, which is consider the external

58
parameters, as it was described in Subchapter 4.1. Influence on the price with the
help of correction coefficient could be illustrated on Fig.5.7.1 - 5.7.2. with the
blue curve on the first graphs. Represented correction coefficient is automatically
calculated according to the membership functions of “Weather”, “Load”, “Bat-
tery” and fuzzy logic algorithm, laid in Matlab Fuzzy Controller.
5.6 Modeling
For computer modeling was made the decision to simulate one half of the bipolar
system, because it allows to get necessary results with more simple structure of
model. Another pole of the system has the similar behavior, so that it is useful to
implement this possibility. For simulating process was used the Matlab computer
environment with SimPowerSystem toolbox.
5.6.1 Technical characteristics and constrains of the model
Technical characteristics and constrains of the model are presented in following
list:
• Load: Resistive, peak power 100kW, consumption 880kWh/day in case of
June (1450kWh/day in case of January);
• Batteries: Lead-Acid deep cycle type, nominal voltage 750V, maximum
charged voltage 816.6V, nominal discharged current 30A, rated capacity
8kAh;
• PV power plant: Efficiency 15%, Area of panels 250m2 in case of June
(15000m2 in case of January);
• Solar irradiance: presented in W/m2 for Turku region;
• Network: no losses, one pole of bipolar structure;
• Simulating period: one day (1440 min.), scale is that 1 sec. of modeling is
equal to 1 real min.
5.6.2 Subsystems
The model of LVDC system is presented on the Fig.5.6.2.1. and includes one
pole of the bipolar network, PV power plant, presented as “PV generation”, load,

59
presented as the subsystem “Load”, energy storage, presented as “Battery” block
and measurement equipment.
Fig.5.6.2.1. Model of the Island LVDC system.
Information about load behavior and solar irradiance for studied months was
wrote in .mat-files in a table view. Those files were set up respectively to the nec-
essary inputs of subsystems “Load” and “PV generation”.
Model is equipped with metering system to estimate the produced and consumed
power which is present of Fig.5.6.2.2.-5.6.2.3. The calculation of the area under
demand curve using integral gives the value about consumed power
(Fig.5.6.2.2.). As it is need to get amount of kilowatts per hour, the period of 60
min is taken for calculations (1min – sample time of the model, so that integral

60
use this period for calculations). This metering system is represented as the “Con-
sumed power” subsystem in the model.
Fig. 5.6.2.2. Demand metering.
The calculation of the area under curve of solar irradiance using integral gives the
value about produced power (Fig.5.6.2.3.). It is necessary to consider that irradi-
ance is presented in Watts, therefore it have to be divided by 1000 to get kilo-
watts. The efficiency coefficient have to be also taken into account. It is 15% for
Crystalline-silicon modules (IEEE Std 1562™-2007). This metering system is
represented as the “Produced power” block in the model of LVDC system.
Fig. 5.6.2.3. Power production metering.
In studied Simulink model, PV power plant is presented as a controllable current
source which included in the subsystem “PV generation” (Fig.5.6.2.4.). The con-
trol signal for current source is obtained from solar irradiance multiplied with area
of PV panels and coefficient of efficiency and then divided on system voltage,
which is a battery voltage in following case.

61
Fig. 5.6.2.4. PV generation subsystem.
Load is represented as controllable current source too, but with opposite connec-
tion (Fig.5.6.2.5.). The signal for current source can be obtained from Load pro-
file and system voltage. Load profile provides the demand curve in kilowatts
scale, therefore it is necessary to multiply it with 1000 to get power in Watts. The
possibility of Load control is envisaged by summation the load curve with correc-
tion signal, it means that it is possible to influence on the load current through
power consumption.
Fig. 5.6.2.5. Load subsystem.

62
The control signal for the “Load” subsystem is written in a table view like load
curve and information about solar irradiance. It consists of time scale and set of
correction coefficients (in presented model there are correction values), which
could be obtained like was described in Subchapter 4.1. By summation with load
curve it makes possible to affect on consumption. Hence, the demand control is
implemented in a such view.
Energy storage has direct connection to the system and battery measurement
block provide information about battery voltage, current and state of charge
(SOC).
5.7 Results
During modeling process were obtained system characteristics for studied model.
They are presented on Fig.5.7.1. – 5.7.2. Red curves are describe system behavior
without demand control while blue curves describe it with implemented demand
control. As it could be seen from graphs below, the main result is the reduction of
battery discharge level on 1 – 2% in a day scale. It could seems insufficient, how-
ever in scale of whole time of autonomy work, for example 10 days, this value
achieve 10 – 20%. Besides, consumption of electricity becomes more even, which
reduce the range of power fluctuations in the system. The slight reduction by few
percent in a charging time also observed, but not as significant as was expected.
Price calculations illustrates high investment costs mostly due to sufficient cost of
PV power system and battery storage. It has strong impact on annual costs for
customers, which are sufficient values too. In that case, application of hybrid sys-
tem, e.g. diesel generator or small wind turbine with solar panels, seems more
profitable, because it may allow to reduce investments and depreciation time of
the system.

63
Fig. 5.7.1. System characteristics for January: red curves – without demand control; blue – with
implemented demand control.

64
Fig.5.7.2. System characteristics for June: red curves – without demand control; blue – with
implemented demand control.

65
6 Conclusion
During writing presented work there were studied different aspects related to cre-
ation of novel Island LVDC microgrid with utilization of photovoltaic power
generation, however it should be emphasized that this system could be easily im-
plemented with different renewable and traditional power sources. In that case
utilization of LVDC system opens first significant benefit that there is no need of
synchronization of power generators and no need to care about reactive power
flows.
The possibilities of application of low voltage DC distribution systems in island
operating conditions in Finland were studied. Weather conditions is the main con-
straining parameter for utilization of solar power as the main source of energy in
presented system in Finland. Low solar activity, especially in winter time, affects
on PV arrays sizing, which have to be significant to cover customer power de-
mand in some applications. From that point of view, it could be beneficial to use
hybrid systems for power supply, however it is require an independent research
for determining an optimal ration between different type of power sources, for
example wind and solar installations.
Proposed bipolar structure of the LVDC network is chosen due to actual cabling
standards and provides benefits from reliability and transmission capacity point of
view, cause it enables exploitation of the whole DC voltage range defined by the
low-voltage directives.
Chosen voltage level, which is 750VDC, which allows not to exceed the stan-
dardized DC voltage limits of commercial low-voltage underground power ca-
bles, makes possible to increase the transmission capacity more than 3 times com-
pared to the traditional 400VAC. Besides, such voltage level of converters with
appropriate customer connection allows to reduces the price of converters.

66
Research results shows that direct battery connection, which is proposed, have
advantages compared to the connection through an additional DC/DC converter,
because allows to reduce the investment costs, however it is also required an in-
telligent control and management systems. In case of Finland it is beneficial to
utilize deep-cycle type of batteries, cause of the possibility of deep discharge in
situations with long cloudy periods.
Price based demand control is proposed to be the main instrument to influence on
customer’ power consumption. Present work offers to implement simple price
determination, based mostly on investment and maintenance costs, with correc-
tion coefficient, which could be determined using fuzzy logic theory. It will allow
to consider such inaccurate data as weather and consumption forecasts.
According to the specifics of novel LVDC system and based on international and
national Finnish standards, basic system, functional, operational and protection
requirements were defined in the present paper.
On the results of present work the main ways of realization Island low voltage
DC microgrid were defined, however each problem requires a significant future
independent research work to achieve effective and profitable solutions. It can be
assumed that present paper has laid the foundations for future researches and
identified the main problems with have to be solved.

67
References
[1] Average hourly demand hour indexes, Sähköenergialiitto ry Sener, Turku
Energia, Turku, 2012.
[2] Development of producer prices in technology industries in Finland 1999-
2011. Finnish technology industry (teknologiateollisuus ry), 2012.
[3] European commission. Low voltage directive LVD 73/23/EEC. European
commission directive: Brussels,1973.
[4] European commission. Low voltage directive LVD 2006/95/EC. European
commission directive: Brussels, 2006.
[5] Feasibility of Photovoltaic Systems, Broshure, Texas State Energy
Conservation Office (SECO), http://InfinitePower.org, 2012.
[6] Hannu Laaksonent, Technical Solutions for Low-Voltage Microgrid
Concept, University of Vaasa, Faculty of Technology, 2011.
[7] IEC 60664-1 International standart, Insulation coordination for equipment
within low-voltage systems, International Electrotechnical Commission,
2002.
[8] IEEE Standard 519, IEEE Recommended Practices and Requirements for
Harmonic Control in Electrical Power Systems, The Institute of Electrical
and Electronics Engineers, 1992.
[9] IEEE Standard 1013, IEEE Recommended Practice for Sizing Lead-Acid
Batteries for Photovoltaic (PV) Systems, The Institute of Electrical and
Electronics Engineers, 2000.
[10] IEEE Standard 1562, IEEE Guide for Array and Battery Sizing in Stand-
Alone Photovoltaic (PV) Systems, The Institute of Electrical and
Electronics Engineers, 2007.
68
[11] Kaipia T., Salonen P., Lassila J., Partanen J. Application of Low Voltage
DC-Distribution System – A Techno-Economical Study. CIRED 2007
conference, Vienna, 2007.
[12] Lassila J., Kaipia T., Voutilainen V., et al., Potential of power electronics in
electricity distribution systems, CIRED Seminar 2008: SmartGrids for
Distribution, Frankfurt, 2008.
[13] Nguyen D. T., Negnevitsky M., M. de Groot, Wang C., Demand Response
in the Retail Market: Benefits and Challenges, Power Engineering
Conference, AUPEC 2009, Australasian Universities, 2009.
[14] Partanen J., Pyrhönen J., Silventoinen P., et al., Tehoelektroniikka
sähkönjakelussa – Pienjännitteinen tasasähkönjakelu, Lappeenrannan
teknillinen yliopisto, Lappeenranta, 2010.
[15] Partanen J., Pyrhönen J., Silventoinen P., et al., Power Electronics in
electricity distribution and DC distribution, Research Report, LUT, 2008.
[16] PVGIS © European Communities, 2001-2010, European Commission, Joint
Research Centre Institute for Energy Renewable Energy Unit, 2012.
[17] Salonen P. Tasasähkön hyödyntämismahdollisuudet sähkönjakelussa.
Diplomityö, Lappeenrannan teknillinen yliopisto, 2007.
[18] Salonen P., Kaipia T., Nuutinen P., Peltoniemi P., Partanen J. An LVDC
Distribution System Concept. NORPIE 2008 conference, Espoo, 2008.
[19] Salonen P., Kaipia T., Nuutinen P., Peltoniemi P., Partanen J. A Study of
LVDC Distribution System Grounding. NORDAC 2008 conference,
Bergen, 2008.
[20] Salonen P., Nuutinen P., Peltoniemi P., Partanen J. Protection Scheme for
an LVDC Distribution System. CIRED 2009 conference, Prague, 2009.

69
[21] Salonen P., Nuutinen P., Peltoniemi P., Partanen J. LVDC Distribution
System Protection – Solutions, Implementation and Measurements. EPE
2009 conference, Barcelona, 2009.
[22] SFS 2091 SFS standardi. Asennuskaapelit. Muovivaippakaapeli MMJ.
Suomen Standardisoimisliitto SFS ry, Helsinki, 1998.
[23] SFS 4879 0.6/1 kV power cables.XLPE-installed AL-cabels. Construction
and testing. National cable standart. SESKO Standartization, Helsinki,
2008.
[24] SFS 4880 0.6/1 kV power cables.PVC-installed PVC-sheathed cabels.
Construction and testing. National cable standart. SESKO
Standartization, Helsinki, 2008.
[25] SFS 6000 – Low voltage Electrical Installations and Safety at Electrical
Work. National Low Voltage Standard –series. SESKO standardization,
Helsinki, 2007.
[26] WeatherSpark, Weather graphs and maps, http:// WeatherSpark.com, 2012
[27] Y. Fu, Z. Li, Different Models and Properties on LMP Calculations, The
Institute of Electrical and Electronics Engineers, 2006
Z. Ye, K. Xing, S. Mazumder, D. Borojevic and F.C. Lee, ”Modeling and
Control of Parallel Three-Phase PWM Boost Rectifiers in PEBB-Based
DC Distributed Power Systems”, IEEE Applied Power Electronics
Conference and Exposition, APEC ‘98 Conf. Rec., Anaheim, CA, USA, ,
1998.

Appendix 1.1
Fig.1. Wind map of Finland for January, 50m altitude.

Appendix 1.2
Fig.2. Wind map of Finland for June, 50m altitude.

Appendix 1.3
Fig.3. Solar irradiance in January for Turku region (optimal inclination 42°)
Fig.4. Solar irradiance in January for Vaasa region (optimal inclination 45°)

Appendix 1.4
Fig.5. Solar irradiance in January for Savonlinna region (optimal inclination 42°)
Fig.6. Solar irradiance in June for Turku region (optimal inclination 42°)

Appendix 1.5
Fig.7. Solar irradiance in June for Vaasa region (optimal inclination 45°)
Fig.8. Solar irradiance in June for Savonlinna region (optimal inclination 42°)