masterarbeit - univie.ac.atothes.univie.ac.at/32040/1/2014-03-12_1169369.pdf · in august 2002 an...
TRANSCRIPT

MASTERARBEIT
Titel der Masterarbeit
„Impact of flood control on communities of meadow butterflies in the Nationalpark Donau-Auen“
verfasst von
Rebecca Fies BSc
angestrebter akademischer Grad
Master of Science (MSc)
Wien, 2014
Studienkennzahl lt. Studienblatt: A 066 879
Studienrichtung lt. Studienblatt: Masterstudium Naturschutz und Biodiversitätsmanagement
Betreut von: Univ.-Prof. Mag. Dr. Konrad Fiedler


„Jedes Naturgesetz, das sich dem Beobachter offenbart, lässt auf ein höheres, noch
unerkanntes schließen.“
Alexander von Humboldt


Acknowledgments
First I want to thank the students and teaching stuff that collected the additional datasets
used in the analysis of this work. In the year 2012 Ina Finger, Manuela Grijincu, Hannes Horn,
and Dominik Rabl did the sampling (Projektpraktikum: Insektengemeinschaften in
Auenlebensräumen). Florian Bodner, Christiane Dorninger, Christian Gegenbauer, Sandra
Hauzmayer and Christian Schulze did the sampling in the year 2005 (Projektpraktikum:
Biodiversität terrestrischer Tiergemeinschaften).
Special Thanks go to Dipl.- Biol Dipl.- Psych Marc Adams, that definitely knows how to handle
R.
I also want to thank all the people of the Nationalpark Donau-Auen for giving me advices and
rides. Especially I want to thank Karoline Zsak for introducing me to the region and Christian
Baumgartner for enabling this work.
And last but not least I want to thank my supervisor Univ.-Prof. Mag. Dr. Konrad Fiedler for
sharing his ecological and statistical knowledge with me and his patience.
I want to thank everyone, who does not stop believing in me.


1
Introduction
The "Nationalpark Donau-Auen” ranges as a green belt between the congested areas of the
capital cities Vienna and Bratislava along the Danube River. It represents the biggest
remaining functional riparian environment of Central Europe, on a total area of 9.300 ha
(NATIONALPARK DONAU-AUEN GMBH 2014). The National Park was accredited by the IUCN in
1997, even though it does not fulfil the criterion of zonation according to the strength of
conservation and management regulations. For example a buffer zone could not be
allocated because the Nationalpark Donau-Auen is directly adjacent to residential areas.
Instead of having a core area, the reserve is divided into the “nature zone” with and without
management, respectively (NATIONALPARK DONAU-AUEN GMBH 2014a) .
All extant meadows in the Nationalpark Donau-Auen are secondary relicts of former
anthropogenic land-use like grazing of farm animals or harvest of hay. Nowadays they are
irreplaceable elements of a cultural landscape, increasing the ß-diversity enormously. These
meadows provide several additional habitats that differ above other ecological aspects in
the frequency and duration of inundations and the mowing regime.
Since the Danube near Vienna is an alpine river, the regular flooding events result from the
snowmelt in the Alps normally happening between June and July (TOCKNER et al. 1998). The
construction of a continuous levee (“Marchfeld-Schutzdamm”) in the late 19th century
interrupted flooding dynamics in the northern part. In the southern part, fluctuations of the
water level of the Danube may reach up to 7 meters in extent and water flow through
ranges between 1,500 - 1,900 m³/s at average water level. In August 2002 an extreme
flooding event was reported, with a water supply of 11,000 m³/s and a water level of 7.80 m
near Orth an der Donau, which was still exceeded by the flood in 2013 with 11,000 m³/s and
7.98 m (LEBENSMINISTERIUM VII/3).
Mowing is done by third parties through contractual conservation management agreements
twice a year in June and August with the objectives of “preserving the different types of
meadows, rare plant species, and structural elements for animals and to maintain the
natural scenery”. Meadows with low productivity are mown once a year. It is stipulated that
the harvest (freshly cut or as hay) has to be removed from all mown meadows. In some
years, mowing may be prevented or interrupted by flooding events, mostly in early summer
at the first mowing date (NATIONALPARK DONAU-AUEN GMBH 2009).
As is typical in Central Europe, butterfly communities are more species rich on meadows
than in closed-canopy forest due to the high thermal demands of these organisms. On the
one hand, they are highly mobile during their adult stages, making fast reactions to abiotic
factors and recolonization after local population extinctions possible. On the other hand,
caterpillars are sedentary and trophically linked to one (monophagous spp.) or a few
(oligophagous spp.) host plant genera (CIZEK et al. 2012). Hence, flooding as well as mowing
constitutes major mortality factors for caterpillars.

2
In Central Europe, the impacts of flooding regimes on terrestrial arthropods in general and
on butterfly communities in particular have not been in the focus of many research projects
yet (TRUXA & FIEDLER 2012). Insects of flooded areas have to deal with low oxygen
concentration during inundations, the destruction of local habitats and the risk of passive
drift away from their microhabitats (ROTHENBUECHER & SCHAEFER 2005). Some species, like the
butterflies Lycaena dispar batavus and Coenonympha tuilla are adapted to submergence by
climbing up their host plants as larvae (JOY & PULLIN 1997, NICHOLLS & PULLIN 2003). In both
species, tolerance to submergence has been shown to be variable. Studies on L.dispar
batavus revealed that not only the duration of an inundation influences mortality, but also
the exact stage of development which experiences flooding. Early diapause larvae of L.
dispar batavus suffered 50% mortality after 90.8 days, whereas the same happened to late
diapause larvae after only 19.4 days under water. If only partially flooded, immediate
mortality was not significantly higher than in controls (NICHOLLS & PULLIN 2003). In C. tullia a
direct mortality of 50% after 7 days of submergence was followed by sublethal effects,
whose causes could not be identified (JOY & PULLIN 1997). An increasing indirect mortality
was also found in L.dispar batavus, whose larvae were not capable to finish development
successfully after being exposed to a flooding event (Webb & PULLIN 1998). Hibernating
larvae of Neptis rivularis, which also inhabits wetlands did not even survive 21 days of
inundation (KONVICKA et al. 2002). The eggs of Lycaena epixanthe show adaptions to
submergence. Spines on their eggs surface are able to trap air, which might than be respired
by the egg (WRIGHT 1983). SEVERNS et al. (2006) supposed the same egg surface for another
wetland species, Lycaena xanthoides. Concluding the findings of several studies on the listed
wetland butterfly species C. tuilla, L. dispar batavus, L. epixanthe L.xanthoides and N.
rivulars, SEVERNS et al. (2006) stated that even though these species are supposed to be
adapted to inundations, all of them still show a higher survival in habitats without
inundation. According to them this proves that all these species are either not yet
completely adapted or just as adapted as physiologically possible.
In floodplains at the rivers Danube, Morava and Leitha regional aspects like different habitat
conditions were shown to a have a bigger influence on moth diversity than the local flood
regime (TRUXA & FIEDLER 2012). Total moth diversity in forest habitats influenced by regular
floods was even higher (TRUXA & FIEDLER 2012), which is contrary to the Rhine floodplains
where more moth species where found in forests not prone to frequent inundations (KÖPPEL
1997). However regarding only moths with early stages in the ground-layer, inundations had
a negative influence on species diversity compared with non-flooded regions (TRUXA &
FIEDLER 2012). Also ants, which are living directly on and in the ground, revealed a lower
species richness in flooded regions (BALLINGER et al. 2007). Contrary to expectation, at the
Danube a characteristic moth community with species that show more tolerance towards
inundations was not found (TRUXA & FIEDLER 2012). Such was also not the case in spider
communities (VAN HELSDINGEN 1997). BALLINGER et al. (2007) stated that most terrestrial
arthropods which inhabit floodplains were ubiquitous opportunists, which were able of fast
recolonization after catastrophic events.

3
The role of mowing as a method to avoid the encroachment of bushes in anthropogenic,
open landscapes has widely been discussed in conservation biology (GERSTMEIER & LANG 1996,
MORRIS 2000, GRIME 2006). Whereas mowing may be seen as an essential step to maintain
different types of meadows with a low nutrient content, fewer shrubs and more rare plant
species, it is also a catastrophic event for ground-layer insects. Even though mowing is
expected to influence invertebrate diversity negatively, still no consensus has been reached
as to its effects on insects in general and butterflies in particular (HUMBERT et al. 2009, DOVER
et al. 2010). On the one hand adult butterflies may easily escape by flight, while eggs, larvae
and pupae rely on unmown patches, including their host plants, for survival (HORN 2012).
Local populations not only have to deal with direct mortality of the immobile stages, caused
by the mowing event (HUMBERT et al. 2009). Mowing also changes habitat structures thereby
influencing the availability of oviposition sites (either positively or negatively), and leads to a
temporary shortage of nectar sources (DOVER et al. 2010). To make things even worse,
mowing is often done in the mornings, when temperatures are not high enough to allow
adult butterflies to escape. That is why DOVER et al. (2010) actually concluded direct
mortality to act on the mobile, adult stages as well. KONVICKA et al. (2008) stated that
mowing has to be adapted to the “gradual and patchy manner” like otherwise extensive
grazing or sythe-mowing may obtain. Additionally a mosaic of cut and uncut swards may be
a solution (HUMBERT et al. 2009). The cutting time and interval may also modify the effects of
mowing on different species. JOHST et al. (2006) found that Maculinea nausithous tolerates a
variable span concerning the mowing week (in the year), if each meadow is only cut every
second or third year. How severely the influence of hay harvesting may affect butterflies was
shown by KONVICKA et al (2008). In the Carpathians and the Czech Republic they detected
that blindfold grassland management through uniform machine mowing for more than ten
years drove a formerly stable population of Colias myrmidone to extinction. In conclusion
one can say that the effects of mowing on local butterfly diversity and population
persistence (CIZEK et al. 2012) not only depend on the mowing regime, but also on the
landscape and the traits of the respective species (JOHST et al. 2006).
Even if not researched extensively, disturbances like the inundation or mowing events cause
ecological alterations not only in species diversity but also in functional diversity (NAEEM
2002), making it an essential component for conservation planning (DÍAZ et al. 2007). By
using a functional diversity index FD (PETCHEY & GASTON 2006), FLYNN et al. (2009) reported an
even steeper decline in functional diversity than in species diversity on bird and mammal
species caused by land-use intensification. Also functional diversity on two tropical
amphibian communities declined strikingly after selective logging, even though species-
diversity did not differ significantly (ERNST et al. 2006). Functional diversity has been shown
to describe species assemblages rules in several studies (MASON et al. 2005, CORNWELL et al.
2006, MCGILL et al. 2006, MASON et al. 2007). Using simulated communities MASON et al.
(2010) found that, besides others of the numerous functional indices categorized in recent
years (i.e. PETCHEY et al. 2004, RICOTTA 2005, PETCHEY & GASTON 2006, SCHLEUTER et al. 2010),
the three orthogonal indices Functional Richness, Functional Evenness and Functional

4
Divergence are sensitive on local community assembly rules (MOUCHET et al. 2010). There are
three theories used to describe local species assemblies, which may co-occur as described in
MASON et al. (2007) and HELMUS et al. (2007). The first theory, called niche filtering, assumes
that environmental constraints act as filters, forcing species with similar but optimal
functional traits to coexist (ZOBEL 1997, CORNWELL et al. 2006). Environmental filtering was
proven to be stronger in a regional scale (DÍAZ et al. 1999, CORNWELL et al. 2006). In contrast
to that the limiting similarity theory, a modification of the competitive exclusion principle,
stats that only up to a maximum, similar species may coexist (ABRAMS 1983). Local assemblies
driven by the limiting similarity are inhabited by functionally complementary species to
avoid competition (MACARTHUR & LEVINS 1967, MOUILLOT et al. 2007). Placed in between these
theories, the neutral theory (HUBBELL 2001) stats that overlapping niches are possible, as
species and individuals are equivalent. Community assembly is rather driven by the events of
ecological drift, migration and speciation (BEERAVOLU et al. 2009).
Functional diversity may be optimally described by three indices Functional Richness,
Functional Evenness and Functional Divergence, which were proven to be independent of
each other several times (VILLÉGER et al. 2008, MOUCHET et al. 2010, PAKEMAN 2011).
Functional Richness represents the amount of trait space occupied by species (abundance is
not included) of the community. Low values of Functional Richness demonstrate that some
niches in the functional space are not occupied. Unused niches multiply the chances of
invasion (DUKES 2001, MASON et al. 2005, MOUCHET et al. 2010). Functional Evenness describes
the regularity of the species and their abundances in the functional trait space. Therefore,
low values suggest that some areas of the functional space are crowded while others are not
filled at all (MOUCHET et al. 2010). PAKEMAN (2011) showed with plant communities that
Functional Evenness increases in disturbed areas. MASON et al. (2008) described Functional
Divergence as the “abundance-weighted functional differences between the species within a
community”. High values of Functional Divergence imply that the most abundant species
have traits on the outer margin of functional space (VILLÉGER et al. 2008), indicating a high
degree of niche differentiation, an efficient resource usage and correspondingly low
resource competition (MASON et al. 2005).
The first aim of this study was to provide an exhaustive butterfly species list to the
Nationalpark Donau-Auen, including a variety of data sets (1). Secondly, this study aimed on
establishing the influence of inundation on butterfly communities. Species numbers and
total abundances are expected to be lower on meadows which are flooded regularly. Also
species composition might differ because of flooding regime. Species thriving on flood-prone
meadows might be ubiquitous opportunists as described for arthropods (BALLINGER et al.
2007) or specialists for humid habitats. There might be differences in feeding guilds, due to
habitat preferences and adult life-history traits (2). Similarly, mowing might influence
butterfly species richness, abundance and species composition. Those meadows that are not
mown might reveal a lower species number and abundance, as certain larval host plants
might be missing and nectar resources become more limited during succession (3). Finally, I

5
will analyse whether Functional Diversity of butterfly assemblages differs according to
flooding or mowing regimes with emphasis on the food and habitat niche as well as the
resilience and fragility of the species (4).
Material and Methods
Study sites and sampling
In the Nationalpark Donau-Auen 20 meadows in the northern part and 18 meadows (Fig. 1)
situated south of the levee were periodically sampled five times each, from the end of April
until the middle of September 2013.
There was a break of at least three weeks between each sampling round. Meadow area
ranged between 0.3 and 5 ha, but most had an area of about 1.3 ha. Sampling was only done
if weather was dry, air temperature was at least 17°C if overcast (or 13–17°C during sunny
weather) and not windy (≤ 4 Beaufort). A time-standardised survey method was used (Tab.
1). Butterflies were recorded in a 5 m radius to the front, walking in “zigzaggs“ as described
in (TROPEK & KONVICKA 2010). If necessary butterflies were netted, identified after the
standardized sampling time using SLAMKA (2004) and STETTMER et al. (2011) and released
again. The sibling species Leptidea juvernica and Leptidea sinapis, as well as Colias
alfacariensis and Colias hyale were not further identified, due to unreliable identification in
the field, at all used datasets.
Fig. 1. Schematic representation of the study area and the different flooding categories on the northern and southern part of
the levee. N = northern meadows, further categorised as N_O = seven meadows, situated near Orth an der Donau, which
experienced uprising groundwater, N_M = nine meadows, which did not experience any influence of the flood, N_S = four
meadows near Stopfenreuth that were actively. S= 18 southern meadows, that are annually flooded. The map was kindly
provided by the Nationalpark Donau-Auen and altered.

6
Table 1. Standardised transect sampling time relative to meadow area.
Predictors
The park area was separated into the northern, not normally flooded habitats (N) and the
southern, annually flooded habitats (S). Exceptionally, however, the intense flood of 2013
influenced even some of the northern meadows. Therefore, the northern meadows were
additionally separated into three categories. N_O refers to seven meadows, situated near
Orth an der Donau, which experienced standing but clear water for over two weeks because
of uprising groundwater N_M refers to nine meadows, which did not experience any
influence of the flood at all. In contrast, four meadows near Stopfenreuth (N_S) were
actively flooded because this region serves as a flood retention basin (Fig. 1). The time and
completeness of mowing of the meadows was recorded during the whole survey. Sites were
classified as mown (with grass removed), mulched, or not mown. On each meadow and
during each sampling period, the amount of available nectar sources was scored on a scale
from 1 (poor) to 3 (rich). For further analyses the average of the nectar source scorings of all
five sampling periods was used. The area of the sites was extracted from a geographic
information system using ArcMap 10 (ESRI, 1999-2010). For all meadows (except one) a
plant species list and a phytosociological classification of the meadows was provided by the
Nationalpark Donau-Auen. In order to get a coarse index for the nutrient level of the
meadows, the average of the Ellenberg indicator values for nitrogen of the eponymous
species of the plant communities present on each meadow was used.
Analysed datasets
Additionally to the 2013 butterfly surveys, datasets from the years 2012 (RABL 2012) and
2005 (FIEDLER, pers. comm.) were analysed. In the 2012 survey, 14 meadows to the north of
the levee corresponding to northern meadows from 2013 and 13 south of the levee,
corresponding to southern meadows from 2013, had been investigated. In contrast to the
2013 survey, meadows in 2012 and 2005 were only sampled twice. In 2012 sampling took
place in June, before the inundation (which was short and rather weak) and in July after the
inundation. In the 2005 survey, 12 northern and 16 southern meadows were analysed, but
only five in the northern part and six in the southern part corresponded to meadows studied
in 2013. Five of the northern meadows were sampled in May and June, seven only in May. In
the southern part seven of the meadows were sampled twice (in May and June) and nine
area in ha time in min
0.5 20 1 20 + 15 1.5 20 + 15 + 10 2 20 + 15 + 10 + 5 2.5 20 + 15 + 10 + 5 + 2.5 3-5 20 + 15 + 10 + 5 + 2.5 + 1.25

7
once in June. Only for the 2012 survey, environmental descriptors (flood, mowing, nectar,
nutrient level, area) comparable to the 2013 survey were available.
Data analysis
Statistical analyses were done using the free software R (R CORE TEAM 2013). All datasets
were graphically tested for normal distribution using quantile-quantile plots as implemented
in the package CAR (FOX & WEISBERG 2011). To meet normal distributions more closely, the
data was square-root or arcsin square-root transformed if necessary.
Species accumulation curves were calculated using rarefaction, as implemented in the
package VEGAN (OKSANEN et al. 2013). The program SPADE (CHAO & SHEN 2009) was used to
estimate the sample coverage error and the number of missing species, applying the
Incidence-based Coverage (ICE) which uses the group of rare species for estimating the
expected total species richness of a site (COLWELL & CODDINGTON 1994, COLWELL 2006).
General linear models (GLM) were applied, using the package STATS (R CORE TEAM 2013). The
influence of the aforementioned predictors was tested on a range of response variables that
characterize various aspects of butterfly community composition. These included: 1. Number
of recorded butterfly species and individuals (both square-root transformed) 2. Percentage
of grass, herb, wood, Fabaceae or Brassicaceae feeding species to the overall butterfly
abundance of each meadow, 3. Percentage of individuals representing species from three
habitat preference classes (living predominantly in meadows, margins and meadows, or
woody habitats), 4. Percentage of individuals belonging to species with very low (40-89
eggs), or very high (304-1024 eggs) fecundity, 5. Percentage of individuals representing
migratory, very dispersive species or species showing strong side fidelity, 6. Percentage of
individuals representing species with a very long lifespan (> 36 day) and 7. Percentage of
individuals representing mono- and polyvoltine species. Species trait data were extracted
from BINK (1992) and SETTELE et al. (2005). All proportions were arcsin square-root
transformed. Also the influence of the selected predictors on the butterfly community
temperature index and analogous measures of the butterflies' climatic niches relative to
precipitation and soil water content (SCHWEIGER et al. 2014) were analysed using GLMs. For
all GLMs an automatic model selection (backward and forward), using AICc as criterion, was
computed using the package STATS (R CORE TEAM 2013). Predictors which were removed from
the best model are hereafter marked with n.i. (not included). Only models showing any
significant relationships were subjected to interpretation. Statistical significance for all tests
was set to p ≤ 0.05. For continuous predictors the standardized regression coefficient (β) was
used to clarify, if the relationship between the variables was positive or negative, using the
package QUANTPSYC (FLETCHER 2010).
Non-metric multidimensional scaling (NMDS) was done to display the species composition,
(Bray-Curtis similarity matrix), as implemented in VEGAN (OKSANEN et al. 2013). Vectors
indicating relationships with environmental predictors were a posterior fitted into the
ordinations, calculated as Spearman’s rank correlation coefficients between ordination axis

8
scores of the communities and the respective predictor values. Besides the predictors
already described above, the two ordination axis scores of the plant species community
(presence/absence) were used. Only predictors showing significant influence (p < 0.1) on the
species composition were used, as only the predictor flood showed a highly significant
influence of (p < 0.005). Multivariate Analysis of Variance (MANOVA) (VEGAN, OKSANEN et al.
2013) based on a permutation was done to test the influence of the predictors on species
composition. For the NMDS ordination of both years, species which could not be found in
the 2012 survey, because of early flying times were removed from the dataset (Anthocharis
cardamines, Zerynthia polyxena). Analysis of similarities (ANOSIM) was performed to test,
whether there were significant difference between the species composition of the different
flooding regimes and the years (vegan, OKSANEN et al. 2013).
Graphics were done using the package GRAPHICS (R CORE TEAM 2013) and GGPLOT2 (WICKHAM
2009).
Functional Diversity
10 functional traits were used to calculate the Functional Diversity Indices, consisting of
categorical parameters on the food niche of caterpillars, the phagism (BINK 1992) the type of
food plants, the habitat of the caterpillars taken from SETTELE et al. (2005), detailed
information on the climatic niche of the species, the average annual temperature, the
average precipitation and the average soil moisture (SCHWEIGER et al. 2014), the lifespan,
voltinism, fecundity (SETTELE et al. 2005) and the length of the forewing (SLAMKA 2004) (Tab.
19).
Functional Diversity indices were calculated using the package FD implemented in R (LALIBERTÉ
& LEGENDRE 2010, LALIBERTÉ & SHIPLEY 2011). All traits were standardized to mean 0 and unit
variance, like recommended by VILLÉGER et al. (2008). A “cailliez” - correction method was
performed (CAILLIEZ 1983). A Gower distance matrix was calculated because qualitative and
quantitative date were used together (VILLÉGER et al. 2008, LALIBERTÉ & LEGENDRE 2010). First a
principal coordinates analysis (PCoA) was applied on the species-species distance
matrix. Than the PCoA axes were used as traits to calculate the indices. To get a value
between 0 and 1, Functional Richness was standardized by the ‘global’ Functional Richness
including all species as described by LALIBERTÉ & LEGENDRE (2010). GLMs and a stepwise model
selection were performed, testing if the predictors described above had an influence on the
three Functional Diversity indices.
Results
In total 4,320 sightings of 63 different species were recorded on the 38 meadows in 2013
(Table 16). The family Nymphalidae represented the highest proportion of species with 44 %,
followed by the Lycaenidae (25 %), Pieridae (16%), Hesperiidae (11 %) and Papilionidae (4%).
In the 2012 survey 4,224 sightings of 53 different species were recorded on 27 meadows
(Table 17). Also in this year the family Nymphalidae represented the highest proportion of

9
species with 44 %, followed by the Lycaenidae (26 %), Pieridae (15%), Hesperiidae (13 %) and
Papilionidae (2%).
In 2005 1,772 sightings of 40 different species were reported on 28 meadows (Table 18).
Again the family Nymphalidae represented the highest proportion of species with 41 %,
followed by the Lycaenidae (25 %), Pieridae (13%), Hesperiidae (18 %) and Papilionidae (3%).
Species which were uniquely seen in the 2013 survey on one of the northern meadows are
Heteropterus morpheus, Polyommatus dorylas, Apatura iris and Neptis rivularis as well as
Polyommatus semiargus on one of the southern meadows. Additionally Iphiclides podalirius,
Anthocharis cardamines, Cupido alcetas, Cupido decoloratus and Argynnis aglaja were not
found in the 2012 and 2005 surveys, but several times in the 2013 survey on northern and
southern meadows (Tables 14, 16).
Only seen in the 2012 survey were Neozephyrus quercus and Thecla betulae, both seen once
on a northern and once on a southern meadow, respectively (Table 14, 17). Only in the 2005
survey, Carterocephalus palaemon was found once on a northern and once on a southern
meadow. Aricia agestis was a unique on a northern meadow (Table 14, 18). Satyrium pruni
was seen once on the southern side in the 2012 survey and once on the northern side of the
2005 survey (Tables 14, 16, 17).
Additionally 13 species are included in the species list (Table 14), because they have been
recorded in the Viennese part of the National Park (HÖTTINGER et al. 2013) and are therefore
expected to possibly occur in Lower Austria as well.
Species accumulation curves
Species accumulation curves were separately calculated for the regularly flooded meadows
north of the levee and those to the south of the levee using datasets collected in the years
2013, 2012 and 2005 (Fig. 2a). In all three years butterfly species richness was higher on the
northern meadows. Only the species accumulation curve of the southern meadows in the
year 2013 (dark blue line, Fig. 2a) reached saturation. For these meadows additional
sampling sites would not add a higher number of species. ICE estimations revealed
estimated sample coverage for infrequent species of 0.92 and the number of 9.8 species to
be missing on the northern meadows of the 2013 survey (dark red line, Fig. 2a). Additionally
species accumulation curves of the northern and respectively the southern meadows using
the dataset of all three years (2013, 2012 and 2005) were calculated (Fig. 2b). Again, the
butterfly species richness was higher on the northern meadows, but both curves did not
reach saturation. ICE estimations revealed a coverage error for rare species of 0.91 and the
number of 11.2 species to be missing on the northern meadows of all years and a coverage
error of 0.95 and the number of 6.1 species to be missing on the southern meadows of all
years. Fig. 3 shows species accumulation curves, using only the datasets recorded in the
sampling periods after summer inundation. In contrast to Fig. 2a and Fig. 2b, the surveys
from 2012 (a year with a short and moderate flood event) in the northern (pink line) and

10
southern part (turquoise line) revealed higher species richness than in 2013. This indicates a
distinct short term decline in species richness after the exceedingly intense flooding event in
2013.
Fig. 2. Randomized species-accumulation curves (method: rarefaction) for (a) the northern (N) and southern (S) meadows of the years 2013, 2012 and 2005 (solid lines), dashed lines: 95% confidence-intervals, (b) the northern and respectively southern meadows, using the datasets of all three years (solid lines), dashed lines: 95% confidence-intervals.
Fig. 3. Randomized species-accumulation curves (method: rarefaction) for the northern (N) and southern (S) meadows of the years 2013 and 2012, using only the datasets recorded in the sampling periods after summer inundation (solid lines), dashed lines: 95% confidence-intervals.
Local butterfly species richness and abundance
The number of recorded butterfly species per meadow was highly significantly related to the
number of individuals sighted on the sites in both years (Table 2a, c). Surprisingly, none of
the other predictors tested had any relation to observed species numbers in both years. Figs.
4a and 5a show that butterfly abundance was significantly influenced by the flood regime in
2013 (Table 2b) and in 2012 (Table 2d). Total butterfly abundance was also marginally
positively related to meadow area in both years (2013: β = 0.242; 2012 β = 0.246). Distinctly
more individuals were found on meadows with higher availability of nectar (2013: β = 0.451;
2012: β = 0.615). Only in 2013 butterfly abundance was significantly higher on nutrient poor
meadows (Table 2b, Fig. 4b).

11
Table 2. Results of general linear models, testing the effects of several predictors on (a) butterfly species richness in the year 2013, (b) abundance in the year 2013, (c) butterfly species richness in the year 2012, (d) abundance in the year 2012. Significance codes: ’***’ p < 0.001; ’**’ p < 0.01; ’*’ p < 0.05. Significant effects (p < 0.05) in bold case.
a number of species, 2013 Df F p
flood 3 2.022 0.135 mowing 2 0.300 0.743 nectar 1 1.499 0.231 area 1 0.021 0.885 nutrient level 2 0.165 0.849
r²adj=0.7768 abundance 1 30.593 < 0.001 ***
b
abundance,2013 Df F p flood 3 4.290 0.013 *
mowing 2 0.155 0.857 nectar 1 6.356 0.018 *
area 1 9.730 0.004 ** r²adj= 0.652 nutrient level 2 6.093 0.006 **
c
number of species, 2012 Df F p flood 1 0.006 0.938 mowing 2 0.644 0.537 nectar 1 4.165 0.056 area 1 1.021 0.326 nutrient level 2 1.225 0.317
r²adj=0.7184 abundance 1 6.784 0.018 *
d
abundance, 2012 Df F p flood 1 14.09 0.001 **
mowing 2 0.58 0.567 nectar 1 33.07 < 0.001 ***
area 1 5.44 0.031 * r²adj=0.759 nutrient level 2 1.20 0.324

12
Fig. 4: Overall butterfly abundance relative to (a) flood regime and (b) nutrient status of meadows in the 2013 survey. Box-and-whisker-plot, range = 1.5 * IQR. Meadow types: N_O = non flooded with high level of groundwater, N_M = non flooded, N_S = non flooded with flood impact only in 2013, S = annually flooded. Rich = nutrient rich, moderate = moderate nutrient level, poor = nutrient poor.
Fig. 5: Overall butterfly abundance relative to flood regime in the 2012 survey. Box-and-whisker-plot, range = 1.5 * IQR. Meadow types: N = non flooded, S = annually flooded.
Functional guilds according to larval host use
Table 3 shows the GLM results for the effects of several predictors on the proportional
contribution of various feeding guilds to the butterflies sighted per meadow. These guilds
comprised species whose caterpillars feed on grass, herbs, woody plants and species of
Fabaceae, or of Brassicaceae, respectively. Among all feeding guilds, flooding significantly
affected their contribution to local butterfly assemblages (Table 3), but in contrasting ways
(Fig. 6). The grass-feeding guild decreased in prevalence in response to flooding of meadows.
Meadows less impacted by inundation (N_O, N_M) showed a higher proportion of grass-
feeders (Fig. 6a). A similar trend was observed with regard to Fabaceae-feeding species
(Fig. 6c). Conversely, the fraction of herb-feeders increased with stronger flood impact, as
well as the subset of Brassicaceae-feeders (Figs. 6b, 6d). The nutrient status of meadows

13
only affected the fractions of grass-feeding and herb-feeding species, respectively (Figs. 7a,
7b). Again Brassicaceae-feeders showed a similar trend as the grass-feeding species (Fig. 7c).
The proportional contribution of butterflies with caterpillars feeding on woody plants was
clearly higher on flood affected meadows (Fig. 6e). In addition, the proportion of Fabaceae-
feeders was positively influenced by nectar availability (β = 0.374).
Table 3. Results of general linear models, testing the effects of several predictors on the proportion of individuals whose larvae develop on (a) grass; (b) herbs; (c) woody plants; (d) Fabaceae; (e) Brassicaceae. Significance codes: ’***’ p < 0.001; ’**’ p < 0.01; ’*’ p < 0.05. Significant effects (p < 0.05) in bold case, n.i. = predictor not included in the final model.
a
d grass DF F p
Fabaceae Df F p
flood 3 6.22 0.002 ** flood 3 4.26 0.013 * mowing 2 2.61 0.090 . mowing n.i.
nutrient level 2 4.94 0.014 * nutrient level n.i. nectar n.i.
nectar 1 6.66 0.015 *
r²adj=0.565
r²adj=0.306
b
e herbs Df F p
Brassicaceae Df F p
flood 3 9.76 < 0.001 *** flood 3 2.09 0.005 ** mowing n.i.
mowing n.i.
nutrient level 2 4.83 0.015 ** nutrient level 2 5.21 0.013 * nectar n.i.
nectar 1 1.79 0.143
r²adj=0.541
r²adj=0.496
c
woody plants Df F p flood 3 3.58 0.024 *
mowing n.i. nutrient level n.i. nectar n.i.
r²adj=0.173

14
Fig. 6: Proportional contribution of (a) grass-feeding individuals, (b) herb-feeding individuals, (c) Fabaceae-feeding individuals, (d) Brassicaceae-feeding individuals and (e) woody plants feeding individuals relative to flood regime. Box-and-whisker-plot, range = 1.5 * IQR. Meadow types: N_O = non flooded with high level of groundwater, N_M = non flooded N_S = non flooded with flood impact only in 2013, S = regularly flooded.

15
Fig. 7: Proportional contribution of (a) grass-feeding individuals, (b) herb-feeding individuals and (c) Brassicaceae-feeding individuals relative to nutrient level. Box-and-whisker-plot, range = 1.5 * IQR. Meadow types: rich = nutrient rich, moderate = moderate nutrient level, poor = nutrient poor.
Butterfly groups according to habitat preferences
Butterfly groups defined by habitat preferences (species that predominantly inhabit
meadows, meadow margins, and forest margins, respectively) were differentially
represented according to the nutrient status of the meadow sites, whereas no pattern
emerged with regard to flood regime (Table 4). True meadow species were more frequently
found on nutrient poor sites (Fig. 8a), whereas forest margin and woodland species were
relatively more common on nutrient rich sites (Fig. 8b, c).

16
Table 4. Results of general linear models, testing the effects of several predictors on the percentage of individuals representing (a) meadow species, (b) meadow margin species and (c) woodland species. Significance codes: ’***’ p < 0.001; ’**’ p < 0.01; ’*’ p < 0.05. Significant effects (p < 0.05) in bold case, n.i. = predictor not included in the final model.
a
c meadow Df F p
forest margin Df F p
flood 3 2.83 0.054 . flood n.i. mowing n.i.
mowing n.i.
nutrient level 2 6.15 0.006 ** nutrient level 2 4.05 0.026 * nectar 1 2.27 0.142
nectar n.i.
r²adj=0.362
r²adj=0.141
b
meadow margin Df F p flood n.i.
mowing 2 2.32 0.114 nutrient level 2 10.47 < 0.001 ***
nectar n.i.
r²adj=0.401

17
Fig. 8. Proportional contribution of (a) individuals living on meadows, (b) individuals living on meadow margins and (c) individuals living in forest margins relative to nutrient level. Box-and-whisker-plot, range = 1.5 * IQR. Meadow types: rich = nutrient rich, moderate = moderate nutrient level, poor = nutrient poor.

18
Functional groups according to adult life-history traits and climatic niche
dimensions
The percentage of individuals representing butterfly species with very high fecundity (Table
5) differed significantly between flood regimes. Low fecundity butterflies were less prevalent
on the southern meadows, whereas species with very high fecundity were relatively more
common there (Fig. 9).
Table 5. Results of the general linear model, testing the effects of several predictors on the percentage of the relative
representation of individuals with very high fecundity. Significance codes: ’*’ p < 0.05. Significant effects (p <0.05) in bold
case, n.i. = predictor not included in the final model.
very fecund Df F p flood 3 4.45 0.011 *
mowing 2 1.77 0.188 nutritient level 2 0.35 0.706 nectar 1 1.26 0.270
r²adj= 0.339
Fig. 9. Relative representation of butterflies with very high fecundity relative to flood regime. Box-and-whisker-plot, range = 1.5 * IQR. Meadow types: N_O = non flooded with high level of groundwater, N_M = non flooded, N_S = non flooded with flood impact only in 2013, S = regularly flooded.
Truly migratory (Table 6a) and highly dispersive, but non-migratory butterflies (Table 6b)
were more common on flood-prone meadows (Figs. 10a, 10b), whereas individuals that
show strong side fidelity (Table 6c) decreased with flood impact (Fig. 10c). These territorial
butterflies were also distinctly more common on nutrient rich meadows (Fig. 10d).

19
Table 6. Results of general linear models, testing the effects of several predictors on the percentage of the relative representation of (a) migratory, (b) dispersive individuals and (c) individuals showing strong side fidelity. Significance codes: ’***’ p < 0.001; ’**’ p < 0.01; ’*’ p < 0.05. Significant effects (p < 0.05) in bold case, n.i. = predictor not included in the final model.
a
c migratory Df F p
side fidelity Df F p
flood 3 3.48 0.026 * flood 3 7.30 < 0.001 mowing n.i.
mowing n.i.
nutrient level n.i.
nutient level 2 9.31 < 0.001
r²adj= 0.167
r²adj= 0.586
b dispersive Df F p
flood 3 11.52 < 0.001 *** mowing 2 2.52 0.097 . nutrient level 2 1.83 0.177
r²adj= 0.66

20
Fig. 10. Relative representation of (a) migratory, (b) dispersive individuals, (c) butterflies showing strong side fidelity relative to flood regime and (d) butterflies showing strong side fidelity relative to nutrient level. Box-and-whisker-plot, range = 1.5 * IQR. Meadow types: N_O = non flooded with high level of groundwater, N_M = non flooded meadows, N_S = non flooded with flood impact only in 2013, S = regularly flooded. Rich = nutrient rich, moderate = moderate nutrient level, poor = nutrient poor.
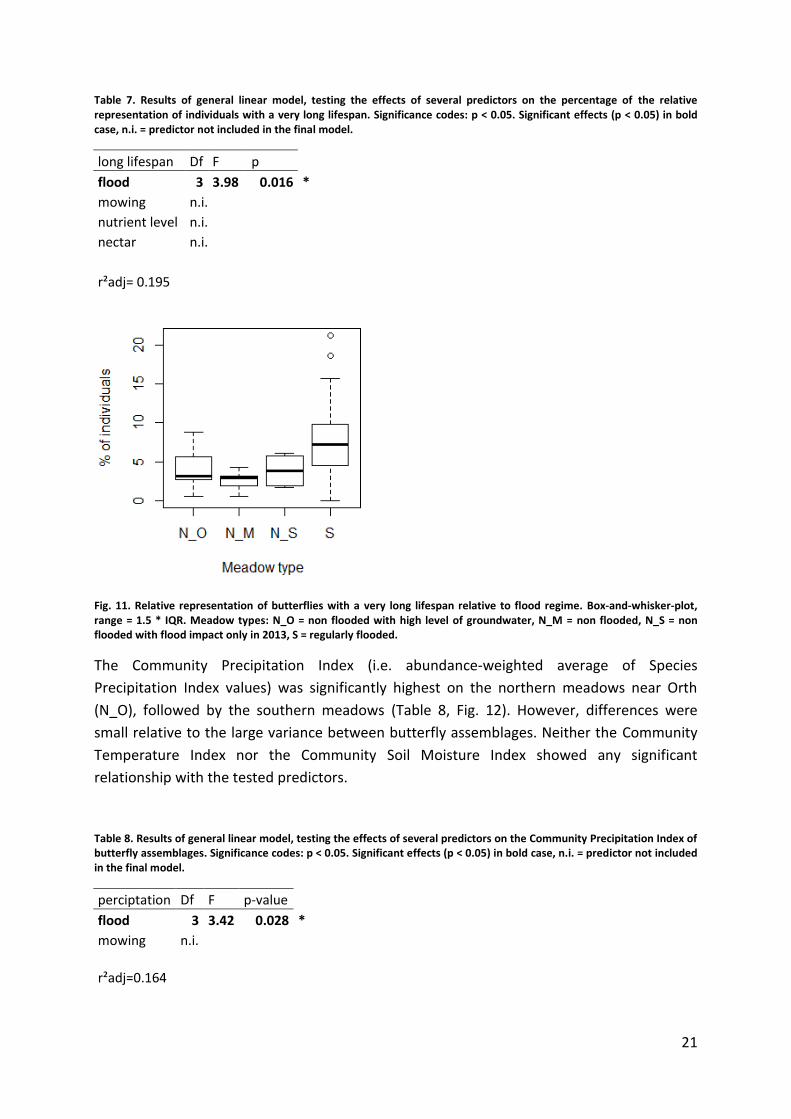
Butterflies with a very long lifespan were slightly more common on meadows with the
highest flood impact and were least common on meadows near Orth (Table 7, Fig. 11). The
proportions of uni- and polyvoltine butterflies showed no significant influence of any of the
predictors tested.
21
Table 7. Results of general linear model, testing the effects of several predictors on the percentage of the relative representation of individuals with a very long lifespan. Significance codes: p < 0.05. Significant effects (p < 0.05) in bold case, n.i. = predictor not included in the final model.
long lifespan Df F p flood 3 3.98 0.016 *
mowing n.i. nutrient level n.i. nectar n.i.
r²adj= 0.195
Fig. 11. Relative representation of butterflies with a very long lifespan relative to flood regime. Box-and-whisker-plot, range = 1.5 * IQR. Meadow types: N_O = non flooded with high level of groundwater, N_M = non flooded, N_S = non flooded with flood impact only in 2013, S = regularly flooded.
The Community Precipitation Index (i.e. abundance-weighted average of Species
Precipitation Index values) was significantly highest on the northern meadows near Orth
(N_O), followed by the southern meadows (Table 8, Fig. 12). However, differences were
small relative to the large variance between butterfly assemblages. Neither the Community
Temperature Index nor the Community Soil Moisture Index showed any significant
relationship with the tested predictors.
Table 8. Results of general linear model, testing the effects of several predictors on the Community Precipitation Index of butterfly assemblages. Significance codes: p < 0.05. Significant effects (p < 0.05) in bold case, n.i. = predictor not included in the final model.
perciptation Df F p-value flood 3 3.42 0.028 *
mowing n.i.
r²adj=0.164

22
Fig. 12. Community precipitation index of butterfly assemblages relative to flood regime. Box-and-whisker-plot, range = 1.5 * IQR. Meadow types: N_O = non flooded with high level of groundwater, N_M = non flooded, N_S = non flooded with flood impact only in 2013, S = regularly flooded.
Species composition
Figs. 13 and 14 show NMDS ordinations of butterfly communities, based on Bray-Curtis
similarities, including relationships with environmental predictors fitted into the diagrams as
vectors (Table 9). The end points of the vectors are Spearman rank correlation coefficients
between ordination axis scores of the communities and the respective predictors (Table 10).
In both years butterfly species composition differed prominently between non-flooded
meadows (north of the levee, blue symbols) and flooded meadows (south of the levee, red
symbols). This is also indicated by the flood vectors, which reflect the largest fraction of
explained variance in species composition. In 2013 the nutrient status of meadows also
contributed strongly to separating butterfly communities, with more nutrient-rich meadows
often being associated with stronger flooding impact (Fig. 13). The impact of mowing
influenced species composition only, and rather weakly, in the year 2012 (Fig. 14). The role
of a meadow's nectar sources on butterfly species composition was slightly stronger in 2012
(r² = 0.123) than in 2013 (r² = 0.073). High nectar availability was usually associated with low
flood impact.

23
Table 9. Results of a Multivariate Analysis of Variance of the Bray-Curtis similarity matrix, using a permutation test with pseudo F-ratios. The predictors NMDS1 and NMDS2 are the two ordination axis scores of the plant species community (presence/absence). Significance codes: ’***’ p < 0.001; ’**’ p < 0.01; ’*’ p < 0.05. Significant effects (p < 0.05) in bold case.
2013 Df F r² p flood 3 4.012 0.230 0.001 ***
nutrient level 2 2.383 0.091 0.004 ** nectar 1 3.817 0.073 0.002 ** mowing 2 1.214 0.046 0.241
area 1 1.566 0.030 0.103 NMDS1 1 1.749 0.033 0.071 NMDS2 1 0.921 0.018 0.495
2012 Df F r² p flood 1 5.754 0.159 0.001 ***
nutrient level 2 0.936 0.052 0.543 nectar 1 4.437 0.123 0.001 ***
mowing 1 2.409 0.064 0.018 *
area 1 1.828 0.051 0.064 NMDS1 1 1.665 0.046 0.112 NMDS2 1 1.134 0.031 0.294
Table 10. Spearman rank correlation coefficients between NMDS axis scores of butterfly assemblages (X, Y) and environmental descriptors of the meadows for 2013 and 2012 surveys. Significant effects (p < 0.05) in bold case.
2013 X Y
2012 X Y
flood 0.4240 0.6543
habitat 0.8089 0.0951 **
nectar -0.4118 0.2188
nectar -0.3268 -0.0003
nutrition -0.5227 -0.2630
mowing -0.3480 0.3480

24
Fig. 13. NMDS based on Bray-Curtis similarity of 2013 butterfly communities; vectors fitted into the ordination calculated as Spearman’s rank correlation coefficients between ordination axis scores of the communities and the respective predictor values. Stress = 0.2329.
Fig. 14. NMDS based on Bray-Curtis similarity of 2012 butterfly communities; vectors fitted into the ordination calculated as Spearman’s rank correlation coefficients between ordination axis scores of the communities and the respective predictor values. Stress = 0.1929.

25
Fig. 15 shows an NMDS ordination of the combined survey data from the years 2012 and
2013. Butterfly communities of the northern meadows showed a far smaller multivariate
dispersion in 2012 than in exceptional flood year 2013, when also many of these meadows
became inundated. The southern meadows prone to annual floods, in contrast, exhibited a
rather similar degree of multivariate dispersion of their butterfly assemblages. Overall,
segregation of butterfly communities due to flooding was reflected along the first ordination
axis, whereas differences between years were related to the second ordination axis.
ANOSIM testing for differences in species composition revealed significant differences
between the northern part and the southern part of the Nationalpark, as well as the years
2012 and 2013 (Table 11).
Table 11. Results of analysis of similarities (ANOSIM), testing for differences in species composition of the northern, not flooded meadows and the southern, flooded meadows and the years 2012 and 2013.
R p
north vs. south 0.3321 0.001 2012 vs. 2013 0.2525 0.001
Fig. 15. NMDS plot based on Bray-Curtis similarities of the 2012 and 2013 butterfly surveys combined, Stress= 0.2363.
Figs. 16a and 17a show the average abundances of those species which were collectively
responsible for 80% of the differences in species composition between the northern and
southern meadows in 2013 (Fig. 16a) and 2012 (Fig. 17a). In the 2013 survey 13 and in the
2012 survey 12 species contributed to the 80% of the differences in the species composition,
whereas the first nine species are exactly the same (Figs. 16a, 17a). In Figs. 16b and 17b the
proportional contribution of the species to the community dissimilarity are illustrated.

26
Fig. 16. (a) Average abundance of the 13 species responsible for 80% discrimination in butterfly species composition (Bray-Curtis dissimilarity) between the northern and southern meadows, according to the SIMPER algorithm in 2013, (b) percentage contribution of these species to discrimination between northern and southern meadows in 2013.
Fig. 17 (a) Average abundance of the 12 species responsible for 80% discrimination in butterfly species composition (Bray-Curtis dissimilarity) between the northern and southern meadows, according to the SIMPER algorithm in 2012, (b) percentage contribution of these species to discrimination between northern and southern meadows in 2012.
Functional Diversity
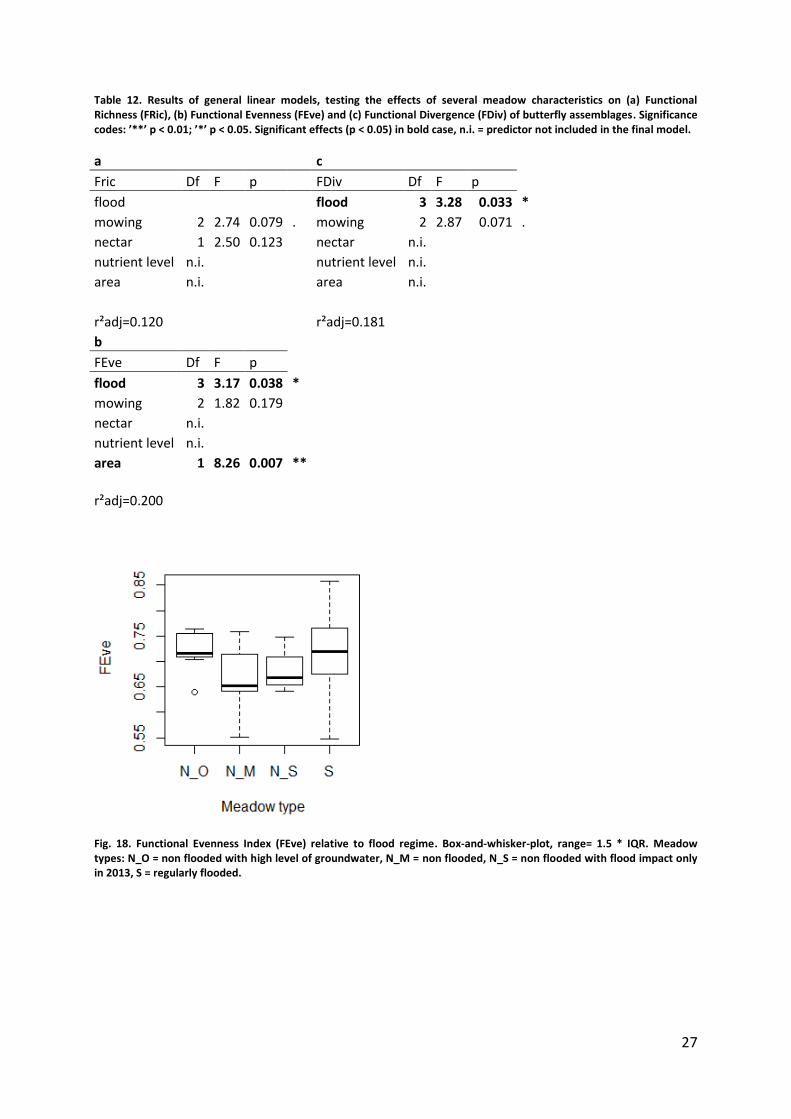
The Functional Evenness Index (FEve) was significantly highest on the southern meadows (S),
and the northern meadows near Orth (N_O) (Table 12b, Fig. 18). In addition, Functional
Evenness was negatively affected by area (β = -0.462). The Functional Divergence Index
(FDiv) was significantly highest on the meadows near Orth (N_O), followed by the southern
meadows (S) (Table 12c, Fig. 18). Functional Richness showed no significant influence by any
of the tested factors (Table 12a).
27
Table 12. Results of general linear models, testing the effects of several meadow characteristics on (a) Functional Richness (FRic), (b) Functional Evenness (FEve) and (c) Functional Divergence (FDiv) of butterfly assemblages. Significance codes: ’**’ p < 0.01; ’*’ p < 0.05. Significant effects (p < 0.05) in bold case, n.i. = predictor not included in the final model.
Fig. 18. Functional Evenness Index (FEve) relative to flood regime. Box-and-whisker-plot, range= 1.5 * IQR. Meadow types: N_O = non flooded with high level of groundwater, N_M = non flooded, N_S = non flooded with flood impact only in 2013, S = regularly flooded.
a
c Fric Df F p
FDiv Df F p
flood
flood 3 3.28 0.033 * mowing 2 2.74 0.079 . mowing 2 2.87 0.071 . nectar 1 2.50 0.123
nectar n.i.
nutrient level n.i.
nutrient level n.i. area n.i.
area n.i.
r²adj=0.120
r²adj=0.181
b FEve Df F p
flood 3 3.17 0.038 * mowing 2 1.82 0.179
nectar n.i. nutrient level n.i. area 1 8.26 0.007 **
r²adj=0.200

28
Figure 19. Functional Divergence Index (FDiv) relative to flood regime. Box-and-whisker-plot, range = 1.5 * IQR. Meadow types: N_O = non flooded with high level of groundwater, N_M = non flooded, N_S = non flooded with flood impact only in 2013, S = regularly flooded.
Discussion
Local butterfly richness, abundance and survey coverage
On the northern meadows in 2013, 63 of the 82 expected species were found. Species
accumulation analysis pointed out that approximately ten rare species were still missing in
my surveys. On the one hand this leads to the conclusion that still not enough meadows
were sampled to cover all rare species. On the other hand, four of the missing species might
just have been those which were seen once in the southern part: Satyrium w-album,
Polyommatus semiargus, Argynnis aglaia (has been seen twice) and Melitaea aurelia. P.
semiargus and M. aurelia were indeed found once on a northern meadow in 2012,
underlining the possibility that these species may be two of the rare species missing on the
northern meadows in the 2013 survey. Also Neozephyrus quercus, Thecla betulae and
Satyrium pruni, which were not found on the northern part in the 2013, but in the 2012
survey, might belong to this set of missing species. Even though they are classified as
endangered on the Red List of Lower Austria (HÖTTINGER & PENNERSTORFER 1999 cit. in
HÖTTINGER et al. 2013), their host plants were all more or less frequently found in the
floodplain forests surrounding the northern meadows. Additionally, N. quercus, S. w-album,
S. pruni, T. betulae and A. aglaja might just have been overlooked because they inhabit
forest margins and are not seen on meadows very often. Finally, also Melitaea diamina and
Lasiommata megera, which were both reported once on a southern meadow in earlier study
years, might contribute to the missing species on the northern meadows of the 2013 survey.
Hence, it is quite likely that all species suspected to be overlooked in these surveys had
indeed been observed either on the flood-prone meadows or in earlier years in the region. In

29
contrast to the northern meadows, the number of sampled southern meadows was
completely sufficient in the 2013 survey.
After analysing all three sampling years together, an estimated number of 11 rare butterfly
species was still missing for the northern part of the National Park. Species accumulation
curves for the southern meadows of all three sampling periods were more saturated than
the northern ones, with only six rare species missing. As expected, the southern meadows
therefore reveal a smaller number of species from the regional species pool because the
flooding impact acts as a filter, reducing the abundance and concomitantly the species
number.
In the Viennese part of the National Park (the so-called Lobau) additionally 12 species were
reported thus far (Table 14) (HÖTTINGER et al. 2013). Seven of these (Cacharodus alceae,
Spialia sertorius, Glaucopsyche alexis, Polyommatus amandus, Polyommatus bellargus,
Erebia medusa and Melitaea phoebe) are xerothermophilous and hence are supposed to be
rather found on the northern meadows near Orth, if at all. Indeed, some of these (such as M.
phoebe) have been observed on dry habitats along the Marchfeld levee near Orth and their
occurrence on at least some of the northern meadows is hence very probable. The
remaining four species might also contribute to the missing species on the southern
meadows (Callophrys rubi, Melitaea athalia, Lasiommata maera and Nymphalis antiopa). In
summary, butterfly species missed during the surveys in the Orth surroundings between
2005 and 2013 in all likelihood would largely belong to the species pool already noted for
the adjacent Lobau area.
Altogether the 2013 survey, conducted over a whole vegetation period, reported 64 species
(77 %) out of the 83 expected species (Table 14). In comparison, samplings of the 2012
survey, which were only done in June and July and on fewer sampling sites, revealed 53
species (64% of the expected species). The 2005 survey, which was done in May and June
and on the smallest number of sampling sites, produced only 40 species (48% of the
expected species pool). Taken together, the surveys aggregated over three years discovered
72 species (87% of the known species pool), thus only little more than in the 2013 survey
alone. Therefore, if sampling is done during one whole season this would suffice to get a
near-complete species list. In relative terms, butterfly sampling exclusively in June and July
might be sufficient, covering only 13% of the species less for the least effort. Phenologically
only two species might not be found on the wing during this period, viz. Anthocharis
cardamines and Zerynthia polyxena. In the Nationalpark Donau-Auen a partial second
generation of C. rubi may be found until September. The first generation of this species only
flies until the beginning of June. Also G. alexis was proven to be found until October for
eastern Austria (HÖTTINGER et al. 2013).
Generally speaking, more species were found on meadows with more individuals. Even
though species accumulation curves indicate the local species richness on the flooded
southern meadows to be smaller than on the not flooded northern meadows, no significant

30
influence of the flooding regime on the number of detected species per sites could be shown
by regression analysis. However, butterfly abundance was significantly highest on meadows
without any flooding impact (N_M), which was also the case in 2012, i.e. a year with less
flooding impact. It can therefore be concluded that the southern meadows reveal a lower
number of species from the regional species pool, because the flooding reduces the
abundance and consequently the species number. A smaller number of species and
abundance was also found for spiders and bugs due to longer flooding durations (BONN et al.
2002, GRATZER et al. 2012), whereas the number of identified moth species and abundance
was similar at flooded and not flooded meadows (TRUXA & FIEDLER 2012). Additionally
meadows with a lower nutrient level harboured more butterfly individuals. This result might
directly be linked to the flood regime, as most of the northern meadows are also nutrient
poor. Also flower nectar availability influenced the abundance positively, especially if the
flood intensity was less (as in 2012). Nectar resource limitation of butterfly abundance has
been proven in several studies on different butterfly species and communities (BOGGS 1987,
HOLL 1995, SCHULTZ & DLUGOSCH 1999, CROXTON et al. 2005, SAARINEN et al. 2005). Many
butterflies achieve a longer lifespan and higher fecundity, as nectar availability increases
(HILL 1992, BOGGS & ROSS 1993, SCHULTZ & DLUGOSCH 1999). It has also been proven that the
microdistribution of butterflies is influenced by the flower nectar resource of the different
patches in a mosaic-like habitat. Butterflies accumulate in patches that are flower rich
(LOERTSCHER et al. 1995). In general, one may conclude that nectar resources become the
most important limiting factor of butterfly abundance on the meadows in the study area,
when flooding is less intense. These findings also indicate that the differences in the local
species richness in 2013 might be caused indirectly by flower nectar availability. As generally
more species were found, where more individuals were sighted and the meadows with a
higher flower nectar availability harboured more individuals.
Butterfly species composition
Flooding emerged as the crucial factor altering butterfly species composition on the
meadows in the area, presumably acting on the immobile egg, larval and pupal stages. Also
TRUXA & FIEDLER (2012) observed strong differences in species composition of moths relative
to the flood regime along three riverine floodplains in Eastern Austria. A major influence of
inundation on species composition of carabid beetle assemblages was found along several
large rivers in Germany (BONN et al. 2002, GERISCH et al. 2006) and on bug communities at the
Morava river (GRATZER et al. 2012). This results stand in contrast to the general findings of
BONN et al. (2002), who found rather the habitat structure to alter spider species
composition than the flooding regime per se. Fitting to the findings of TRUXA & FIEDLER on
moth (2012) and VAN HELSDINGEN (1997) on spider communities, but in contrast to previous
expectations, no characteristic floodplain meadow butterfly community, consisting of
species specific to humid habitats, was found. Almost one half of the difference in species
composition between the northern and southern meadows was explained by abundance
differences of the three most abundant ubiquitous species, Maniola jurtina (16.8% of
between-habitat differentiation), Coenonympha glycerion (14.7%) (both more frequent on

31
the northern meadows) and Pieris rapae (11.2%, more abundant on the southern meadows).
The first two species are grass-feeders. Representatives of this feeding guild were generally
proven to be more frequent on the meadows with no or little flooding impact (N_M, N_O).
In total only 13 butterfly species contributed 80% to the difference in species composition
relative to flood impacts. Of these, only Araschina levana with 6.1% contribution may be
described as typical floodplain forest species. Species that were limited or more common on
the northern meadows were mostly species inhabiting dry and warm habitats like Hesperia
comma, Polyommatus coridon, Plebejus argus and Plebejus arygnomon. But even if P. argus
and P. arygnomon were sighted pretty frequently on the northern meadows, these species
did not influence the different species composition of the northern and southern meadows
considerably. Also Aphantopus hyperantus was only seen on the northern meadows, though
with 29 individuals contributing only 0.96 % to the difference in species composition. A
possible explanation for this preference for non-flooded sites is found in its egg-laying
habits. A. hyperantus females merely drop their eggs to the ground without any attachment,
making them more easily being drifted away (WIKLUND 1984, EBERT 1993). All the same, the
eggs of Melangaria galathea are drifted away. This species was sighted more often on the
northern meadow (18 individuals), than on the southern meadows (4 individuals). Also the
eggs of this species are just dropped to the ground, while the female is sitting on a blade of
grass. Moreover no sticky exudate, fixing the eggs could be found for this species (SONNTAG
1981, EBERT 1993).
The second factor modifying butterfly species composition in the 2013 survey was the
nutrient level of the meadows. The average nutrient level of a meadow may be seen as
indicator for the availability of the host plants, hence also acting on the immobile larval
stages of the butterfly’s life cycle. As already mentioned, the nutrient level is strongly linked
to the flood regime, as most of the flooded meadows are also nutrient rich. Generally,
xerothermophilous butterfly species, inhabiting dry and warm meadows suffer from the
eutrophication which happens on the southern meadows not only because their host plants
might be missing. They might also not be capable to finish their lifecycle because of colder
microhabitats caused by taller perennial herbs (THOMAS & JONES 1993, MAES & VAN DYCK
2001). Therefore xerothermophilous grass land species contribute rather to the species
composition on the northern sides and only on the less nutrient rich southern meadows. The
guild of the butterflies, inhabiting meadow margins and forest margins definitely benefit of
the higher perennial herbs on the meadows with higher nutrient level. Also regression
analysis revealed true meadow species to be more common on nutrient poor sites, whereas
forest margins or even woodland species were more frequently spotted on the nutrient rich
meadows.
Also the mowing exclusively altering the species composition in the 2012 survey, as
described below, acts on the immobile larval stages.
Only at third rank butterfly species composition in both years was influenced by the
availability of nectar, which is resource class acting on the adult stages.

32
Against expectations, the axis scores of the NMDS of the species plant list did not reveal any
significant influence on the species composition. Even if the species list only revealed
absence and presence data, a marginal influence of this predictor on the species
composition was expected, as many butterflies are limited to only a few plant taxa as larval
host plants. Obviously the abiotic factors analysed (flood, nutrient level, mowing and nectar)
dominated the influence of the biotic interaction viz. the host plant availability, on the
butterfly species composition. Supporting our expectations, many studies revealed the host
plant availability to be an important factor acting on the distribution and stability of butterfly
populations (i.e. SHAHABUDDIN et al. 2000, THOMAS et al. 2001, SHAPIRO 2002, KOH et al. 2004).
Especially for monophagous butterflies like P. coridon and Cupido minimus, which were also
found at the surveys of this work, host plant density was shown to be the most important
predictor for occurrence and population density (KRAUSS et al. 2004, KRAUSS et al. 2005). Low
host plant density or absence was even shown to be the main factors driving butterfly
species to extinction (THOMAS 1983, WAHLBERG et al. 2002, LEÓN‐CORTÉS et al. 2003, HULA et al.
2004, KRAUSS et al. 2005).
Differences with regard to feeding guilds and functional groups
Even though meadow butterfly communities did not differ starkly with regard to their
species richness between flooding regimes, species composition was very strongly shaped by
the incidence of annual summer floods. These differences in compositional diversity
translated further into variation at the guild or functional group level. I found a higher
percentage of individuals feeding on herbs, and especially of Brassicaceae feeders, on the
southern meadows and the northern meadows with the highest flooding impact in 2013
(N_S). All Brassicaceae feeders were members of Pieridae; Anthocharis cardamines, Pieris
brassicae, Pieris napi, Pieris rapae and Pontia edusa. P. rapae and P. napi were seen very
frequently on the southern meadows. Additionally P. napi was sighted more often on the
southern meadows than on the northern meadows. Both are common ruderal species with
at least three flight periods (STETTMER et al. 2011) that may easily recolonize the southern
meadows after inundation. P. edusa was also found more often on the southern meadows.
Even if this species inhabits warm and dry habitats, it may also recolonize the southern
meadows easily, as the highly migratory imagines may be found on the wing from April to
October with up to four generations. In contrast A. cardamines does not contribute to the
Brassicaceae feeders that are more common on the southern meadows, as it is only
univoltine and is exposed to the inundations as pupae or larvae, viz. the most immobile
stages. P. brassicae was only found twice on the southern side and once on the northern
side, which is not surprising as this hemerophilous species needs large-sized agricultural
planted Brassicaceae, because their eggs are laid in large clutches of up to 100 individuals. As
relatively more Brassicaceae feeders were found on the southern meadows, it may be
assumed that more Brassicaceae were growing on the southern side. As only a
presence/absence list of plant species was available, this assumption cannot be affirmed.
The following can, however, be stated: The Brassicaceae found on the meadows were
ruderal species, associated with high Ellenberg indicator values for nitrogen (i.e. Alliaria

33
petiolata) (ELLENBERG et al. 1992), indicating these species to benefit of the disturbance
caused regularly by the inundations and the high nutrient level of the southern meadows. In
general the higher percentage of Brassicaceae-feeders could therefore be an indication that
the southern butterfly communities are ruled by eutrophication and ruderalisation like the
plant community.
In contrast, the biggest proportion of grass-feeding individuals was found on the meadows
near Orth (N_O), which were influenced by uprising groundwater, followed by the meadows
with no (N_M) or little flooding impact (N_S). The northern meadows that were only a little
bit or not disturbed by the inundation tended to harbour typical grassland butterfly
communities. Therefore the more disturbed the meadows were by the flooding regime, the
less likely a typical grassland butterfly community was established.
As expected the highest proportion of butterflies whose caterpillars feed on woody plants
was found on the flooded meadows, as the larval stages of this guild may not really be
affected by most inundation events. Moreover most of the species feeding on woody plants
are true floodplain-species (i.e. Apatura ilia), adapted to the regular disturbance of
inundations. Also arboreal moth were much less affected by the flooding impact than moth
species living in the ground-layer (TRUXA & FIEDLER 2012). Overall this results reflect the
findings on the difference in the species composition of the northern and the southern
meadows, that have already been discussed: The guild of grass-feeders was the most
affected by the flooding regime and these guild was therefore found more frequently on the
northern meadows, whereas the Brassicaceae-feeder P. rapae was more common on the
southern meadows.
Butterflies inhabiting meadows were relatively more common on the nutrient poor
meadows. As already mentioned above the sediments which are more or less regularly
delivered to the southern meadows during inundation events act as natural fertilisers,
making the southern meadows generally more nutrient rich. But also the northern part of
the National Park Donau-Auen contains nutrient rich meadows, whereas some of the
southern meadows near the levee are rather nutrient poor. Therefore most of the nutrient
poor meadows are found on the northern part of the Nationalpark and reveal relatively
more xerothermophilous species. These nutrient poor meadows show less shrub
encroachment as almost all of them were completely mown during the 2012 and 2013
survey. Vice versa the contribution of butterfly species inhabiting forest margins was higher
on nutrient rich meadows, with a higher proportion of tall perennial herbs.
The hypothesis of a unique species set on annually flood-impacted meadows was already
refuted. But some general statements about the distribution of butterfly species relative to
their life history traits can be made. On the southern flood-prone meadows one can find
relatively more butterflies showing a high fecundity (Aglais urticae, Inachis io, Melitaea
aurelia Nymphalis polychloros) and a long lifespan (Gonepteryx rhamni, A. urticae, Argynnis
paphia, I. io, N. polychloros, Polygonia c-album, Vanessa atalanta, Vanessa cardui). There are

34
relatively more migratory (Colias alfacariensis/hyale, Colias crocea, P. edusa, Vanessa
atalanta and Vanessa cardui) and dispersive butterflies (P. brassicae, P. rapae, A. urticae, I.
io, N. polychloros, P. c-album) on the southern meadows than on the northern meadows,
whereas butterflies with a strong side fidelity are less prevalent on flood-prone meadows
(Heteropterus morpheus, Cupido minimus, Lycaena dispar, Satyrium w-album, Brenthis
daphne, Coenonympha glycerion,). Even though the southern meadows showed no species
composition consisting of true wetland species, the higher average precipitation index of the
flood affected meadows indicates that these meadows contain slightly more butterflies
living in comparatively wetter habitats.
Assembly rules
As already proven, on the one hand the inundation changes the relative contributions of
different guilds (i.e. feeding guild) and functional groups (i.e. dispersion) but on the other
hand some functional groups are not directly influenced by the flooding regime (i.e. butterfly
groups according to habitat preferences). But all in all, the results show that the composition
of functional traits was altered by the flooding regime. Therefore Functional Diversity was
expected to be lower on the southern meadows, because some functional traits were
supposed to be missing, as the flooding event filters out some traits on the southern
meadows. In fact, the Functional Evenness was much more variable but only slightly stronger
on the southern than on the northern meadows, indicating the communities of the southern
meadows to be rather instable and unsaturated. Functional Divergence was proven to show
higher values at higher degrees of limiting similarity ruling community assemblies, in a study
using simulated data sets (MOUCHET et al. 2010). In this study, Functional Divergence was
highest among butterflies at meadows near Orth, which only suffered a medium flooding
impact by uprising groundwater, followed by the southern meadows (S). The abundant
species of the meadows of these two flooding categories tend to be at the outer margins of
the functional space (MASON et al. 2005, VILLÉGER et al. 2008, MOUCHET et al. 2010). Therefore
butterfly assemblages on the meadows near Orth (N_O) and the southern meadows (S) are
rather ruled by niche differentiation.
Interannual differences in flood intensity
The above considerations are largely related to the survey results in the year 2013, which
was characterized by an unusually strong summer flood. Also in 2012, with a much shorter
and less intense flooding event, flooding regime was the most crucial factor altering butterfly
species composition on the meadows. This proves that the flooding regime is decisive not
only in an extreme year, but higher flooding intensity rendered species composition less
homogenous. The exceptional flooding of some of the northern meadows in 2013 (N_O and
N_S) made their species composition even less homogenous than on the regularly flooded
meadows (S). Meadows which were actively flooded (N_S) showed the most heterogeneous
species composition. These results corroborate that even if the southern meadows are not
inhabited by typical wetland species, their species composition seems to be well adapted to

35
the more or less regular flooding anyway, which was already shown by higher average
precipitation indices of the southern meadows.
Although butterfly species composition differed in the homogeneity between the years 2013
and 2012, assemblages were remarkably similar concerning those species which were
responsible for the discrimination relative to flooding impact. In total only 13 species
contributed 80% of the dissimilarity in species composition and the first nine species were
exactly the same in both years. Again the grass-feeders Maniola jurtina (16.5%) and
Coenonympha glycerion (13.1%) were more frequent on the northern part. In contrast to the
surveys in 2013, Pieris rapae (11.2%) and Polyommatus icarus (6.7%) were also more
common on the northern meadows in 2012. Celastrina argiolus was more frequent in the
northern part but contributed only to the top 80% discrimination of the species composition
in the year 2013, when this species was more abundant. The highly polyphagous larval
stages of C. argiolus feed, among others, on woody plants (i.e. Frangula alnus) and are
therefore probably less affected by flooding events. In contrast to C. argiolus, C. glycerion
seems to suffer from the flooding impact, as it contributed strongly to species composition
differentiation only in 2012. All in all, this species was more common in 2012 with
approximately twice as much sightings on the northern meadows than on the southern
meadows. In 2013 only 30% of the total sightings were done on the southern meadows.
Anthocharis cardamines and Zerynthia polyxena could not alter species composition in 2012,
as the surveys were done after their flight periods.
Even though butterfly assemblages on the meadows were made up from pretty similar
species in the years 2013 and 2012, multivariate analyses revealed a clear interannual
variation. This underlines that abundance fluctuations of ubiquitous species play the crucial
role concerning the differences in species composition.
Impact of the mowing regime
Ostensibly, the mowing regime neither influenced butterfly species number nor their overall
abundance or species composition in 2013, but slightly affected species composition in 2012.
These results are contrary to initial assumptions, as the impacts of mowing on invertebrates
are widely discussed to be rather negative (e.g. GERSTMEIER 1996, MORRIS 2000, HUMBERT et al.
2009). Indeed, mowing once or twice a year was shown to lead to a decline in butterfly
richness and abundance (MORRIS 2000, DOVER et al. 2010). Mowing causes direct mortality
especially of the immobile stages, leads to a temporary shortage of nectar and changes
habitat structures and concomitantly oviposition sites (HUMBERT et al. 2009, DOVER et al.
2010). These findings could not be affirmed in this study. Notably, mowing took place less
regularly in the year 2013 because of the strong inundation and the spatial separation of the
meadows. Five of the six mulched meadows of 2013 had still been mown in the year 2012
and none of the meadows in 2012 was categorised as mulched. Therefore mulching was a
side effect of the stronger inundation, making the mowing more difficult because of
temporally constrained access for the farmers. Against this background, it could have been

36
expected that especially the exceptional mowing regime in 2013 influenced species richness,
abundance and species composition. For example the exceptional mulching could have led
to a decline in species richness and abundance, as flower nectar availability at the mulched
meadows was temporarily almost not-existent. This was not the case, even if flower nectar
availability was shown to influence abundance and therefore indirectly species richness. One
explanation might be that the effects of mulching on plant species composition, possibly
altering host plant species availability to butterflies, would have only been expected if
mulching would be done regularly over several years, as described by BAKKER et al. (1989) and
MOOG et al. (2002) after 25 years. Different mowing regimes are therefore no crucial event
neither acting on the butterfly species richness and abundance nor on the species
composition in a year with strong flooding impact. This underlines the crucial role of the
flooding regime. If the flooding event takes place in such an intensive way as in 2013, natural
river dynamics surpass the influence of mowing as a management practice. In 2013, even
some northern meadows were under water, indicating that in that year flooding indeed
surpassed mowing in shaping meadow butterfly assemblages. In order to evaluate the
effects of mowing on butterflies at the Nationalpark Donau-Auen, I would suggest repeating
the 2013 survey in a year with less flooding impact.
Conservation aspects
With 72 species recorded in the years 2013, 2012 and 2005, butterfly communities in the
National Park Donau-Auen are moderately diverse, compared to the 209 species which are
known for Austria as a whole (HUEMER 2013) .
On the one hand the representation of species of conservation concern was with 33% much
higher than the representation reported for moth species of conservation concern (5%) by
TRUXA & FIEDLER (2012). Three butterfly species are listed as strongly endangered on the Red
List of Lower Austria, 19 species are listed as endangered and of three species the exact
regional status of vulnerability is not known (HÖTTINGER & PENNERSTORFER 1999 cit. in HÖTTINGER
et al. 2013). Another seven endangered species were only found in the Viennese part of the
National Park (HÖTTINGER et al. 2013), which could be an indication for their likely occurrence
in the Lower Austrian part as well. On the other hand, none of the strongly endangered
species was seen more than three times. Polyommatus semiargus was seen only twice on a
southern meadow and once on a northern meadow. Zerynthia polyxena and Nymphalis
polychloros were both seen only twice on the northern part and N. polychloros additionally
once on the southern part of the National Park in 2013. On the other hand, Z.polyxena and
its host plant Aristolochia clematitis were seen regularly, implicating this species to be more
common in the National Park Donau-Auen than the sampling scheme targeted at meadow
butterflies might indicate.
Also the endangered species Thecla betulae (1,1), Satyrium pruni (0,1), Satyrium w-album
(3,2), Apatura ilia (16,33), Apatura iris (1,0), Limenitis camilla (3,6) and Limenitis populi (2,2),
which all inhabit forests and forest margins, were not very frequently seen on the sampling

37
sites. But again sightings besides standardized meadow transects showed at least S. w-album
and A. ilia to be pretty common. It might be reasonably assumed that T. betulae and S. pruni,
whose larvae feed on Prunus spinosa, are more common in the Viennese part of the
Nationalpark, where P. spinosa is part of the shrubs on the so-called “Heißländen”. In fact
the National Park is of specific regional importance for all listed species which inhabit forests
like N. polychloros and especially the floodplain species L. populi (2,2) feeding on Populus
nigra and Populus tremula and A.iris (1,0) feeding on Salix sp. A. iris is not very common in
lowlands, as its host plants (i.e. Salix caprea) are more frequent in the floodplains of the
uplands. In order to get meaningful information about the status of the populations of the
species inhabiting woodlands, specially designed surveys should be done, as these species
are only found on meadows by chance. Against expectations, the wetland species Neptis
rivularis (1,0) and Melitaea diamina (0,1) were uniques, showing this endangered species to
be pretty rare in the National Park as well. Whereas another endangered species, Lycaena
dispar (13,55), seems to be of least concern in these region, especially on the southern
meadows.
Besides the species inhabiting woody or rather wet habitats, the xerothermophilous
meadows, which are mostly found in the northern part of the National Park are of
importance for several endangered species inhabiting warm and dry sites such as
Polyommatus coridon (9,1) and Melitaea didyma (21,2). Especially the relatively frequent
sightings of Papilio machaon (15,10) and Iphiclides podalirius (3,3) indicate a regional refuge
for these endangered species. Polyommatus dorylas (0,1) and Polyommatus thersites (3,3) as
well as Melitaea aurelia (1,2) showed no clear preference to the northern meadows.
Polyommatus dorylas was found on a meadow close to the levee, where this species had
been recorded before (FIEDLER pers. comm.).
Numerous sightings of Plebejus aryrognomon (48,11) point to a favourable conservation
status of this species in the National Park, which is of importance as the conservation status
of this species is not known for Lower Austria (HÖTTINGER & PENNERSTORFER 1999 cit. in
HÖTTINGER et al. 2013). As Colias alfacariensis was not distinguished from its sibling species
Colias hyale, the regional situation of this endangered species could not be assessed. Also
the effective proportion of Cupido decoloratus (7,3) should be targeted in an additional
survey, as this species was only distinguished in 2013. This species is limited to the southern
and easternmost part of Austria (STETTMER et al. 2011), probably giving the National Park
Donau-Auen a special responsibility.
Lower Austria marks the northern distribution boundary of Melitaea trivia, but as this
species was not found in any of the samplings, its occurrence in the National Park Donau-
Auen remains very unlikely. This xerothermophilous species, whose presence is linked to raw
soil or rocks, used to be pretty common in eastern Austria, but showed only very local
populations. It became endangered through bush encroachment, reforestation and
inappropriate habitat management (HÖTTINGER & TIMPE 2003). M. trivia is listed as strongly
endangered on the Red List of Lower Austria (HÖTTINGER & PENNERSTORFER 1999 cit. in

38
HÖTTINGER et al. 2013). Also the occurrence of Brenthis hecate could not be confirmed. B.
hecate is supposed to be critically endangered in Austria. The only regional host plant of this
species is Filipendula vulgaris, which is endangered itself but was found on a few meadows
in the National Park Donau-Auen. Hence, it is possible that some relict populations of B.
hecate might still await discovery in the reserve.
Conclusion
The butterfly communities of the meadows of the Nationalpark Donau-Auen are ruled by the
flooding. Even if the inundation in 2013 was much more intense as usual, it could generally
be shown that the factor flood influences the species abundance and concomitantly the
species number as well as species composition strongly. The effects of the mowing only
carries weight if the inundation is less intense. The southern meadows are mainly inhabited
by the ubiquitous grass-feeders Maniola jurtina and Coenonympha glycerion, as well as the
Pieridae Pieris rapae, Pieris napi and Pontia edusa. It is also likely to find relatively more
individuals of Aglais urticae, Inachis io, Nymphalis polychloros, Vanessa atalanta, Vanessa
cardui and Polygonia c-album. Also floodplain species like Apatura ilia might be found more
frequently on the southern meadows. Xerothermophilous species are more common on the
northern meadows, which are generally nutrient poor and harbour dry and warm habitats.

39
Literature Abrams, P. (1983). "The Theory of limiting similarity." Ann. Rev. Ecol. Syst. 14: 359-376.
Bakker, J. P. (1989). "Nature Management by grazing and cutting: on the ecological significance of grazing and cutting regimes applied to restore species-rich grassland communities in the Netherlands." Kluwer Academic Publisher, Dordrecht.
Ballinger, A., P. Lake and R. M. Nally (2007). "Do terrestrial invertebrates experience floodplains as landscape mosaics? Immediate and longer-term effects of flooding on ant assemblages in a floodplain forest." Oecologia 152(2): 227-238.
Beeravolu, C. R., P. Couteron, R. Pélissier and F. Munoz (2009). "Studying ecological communities from a neutral standpoint: A review of models’ structure and parameter estimation." Ecological Modelling 220(20): 2603-2610.
Bink, F. A. (1992). "Ecologische atlas van de dagvlinders van Noordwest-Europa." Schuyt & Co Haarlem.
Boggs, C. (1987). "Ecology of nectar and pollen feeding in Lepidoptera." Nutritional ecology of insects, mites and spiders: 369-391.
Boggs, C. L. and C. L. Ross (1993). "The Effect of Adult Food Limitation on Life History Traits in Speyeria mormonia (Lepidoptera: Nymphalidae)." Ecology 74(2): 433-441.
Bonn, A., K. Hagen and D. Wohlgemuth- von Reiche (2002). "The significance of flood regimes for carabid beetle and spider communities in riparian habitats, a comparison of three major rivers in Germany." River Research and Applications 18(1): 43-64.
Cailliez, F. (1983). "The analytical solution of the additive constant problem." Psychometrika 48(2): 305-308.
Chao, A. and T. Shen (2009). "Program SPADE (species prediction and diversity estimation)." Program and User’s Guide published at http://chao.stat.nthu.edu.tw.
Cizek, O., J. Zamecnik, R. Tropek, P. Kocarek and M. Konvicka (2012). "Diversification of mowing regime increases arthropods diversity in species-poor cultural hay meadows." Journal of Insect Conservation 16(2): 215-226.
Colwell, R. (2006). "EstimateS: Statistical estimation of species richness and shared species from samples." http://viceroy.eeb.uconn.edu/estimates.
Colwell, R. K. and J. A. Coddington (1994). "Estimating Terrestrial Biodiversity through Extrapolation." Phil. Trans. R. Soc. of London B 345(1311): 101-118.
Cornwell, W. K., D. W. Schwilk and D. D. Ackerly (2006). "A trait-based test for habitat filtering: convex hull volume." Ecology 87(6): 1465-1471.
Croxton, P. J., J. P. Hann, J. N. Greatorex-Davies and T. H. Sparks (2005). "Linear hotspots? The floral and butterfly diversity of green lanes." Biological Conservation 121(4): 579-584.
Díaz, S., M. Cabido and F. Casanoves (1999). Functional implications of trait-environment linkages in plant communities, Evan Weiher,Paul Keddy.

40
Díaz, S., S. Lavorel, F. de Bello, F. Quétier, K. Grigulis and T. M. Robson (2007). "Incorporating plant functional diversity effects in ecosystem service assessments." Proceedings of the National Academy of Sciences of the United States of America 104(52): 20684-20689.
Dover, J., A. Rescia, S. Fungariño, J. Fairburn, P. Carey, P. Lunt, R. L. H. Dennis and C. J. Dover (2010). "Can hay harvesting detrimentally affect adult butterfly abundance?" Journal of Insect Conservation 14(4): 413-418.
Dukes, J. S. (2001). "Biodiversity and invasibility in grassland microcosms." Oecologia 126(4): 563-568.
Ebert, G. (1993). Die Schmetterlinge Baden-Württembergs Band 1 Tagfalter 1, 1991 Eugen Ulmer GmbH & Co.
Ebert, G. (1993). Die Schmetterlinge Baden Württembergs Band 2 Tagfalter 2, 1991 Eugen Ulmer GmbH & Co.
Ellenberg, H., H. E. Weber, R. Düll, V. Wirth, W. Werner and D. Paulißen (1992). Zeigerwerte von Pflanzen in Mitteleuropa.
Ernst, R., K. E. Linsenmair and M.-O. Rödel (2006). "Diversity erosion beyond the species level: Dramatic loss of functional diversity after selective logging in two tropical amphibian communities." Biological Conservation 133(2): 143-155.
Fletcher, T. D. (2010). "QuantPsyc: Quantitative Psychology Tools." R package version 1.5. http://CRAN.R-project.org/package=QuantPsyc.
Flynn, D. F. B., M. Gogol‐Prokurat, T. Nogeire, N. Molinari, B. T. Richers, B. B. Lin, N. Simpson, M. M. Mayfield and F. DeClerck (2009). "Loss of functional diversity under land use intensification across multiple taxa." Ecology Letters 12(1): 22-33.
Fox, J. and S. Weisberg (2011). "An {R} Companion to Applied Regression, Second Edition." Thousand Oaks CA: Sage. http://socserv.socsci.mcmaster.ca/jfox/Books/Companion.
Gerisch, M., A. Schanowski, W. Figura, B. Gerken, F. Dziock and K. Henle (2006). "Carabid Beetles (Coleoptera, Carabidae) as Indicators of Hydrological Site Conditions in Floodplain Grasslands." International review of hydrobiology 91(4): 326-340.
Gerstmeier, R. and C. Lang (1996). "Beitrag zu Auswirkungen der Mahd auf Arthropoden." Zeitschrift für Ökologie und Naturschutz 5.
Gratzer, M., W. Rabitsch and C. H. Schulze (2012). "Impact of flooding on true bug communities (Heteroptera) on meadows of the Morava River floodplains, Eastern Austria." Conference Volume of the 5th Symposium for Research in Proteced Areas, Mittersill 2013.
Grime, J. P. (2006). "Plant strategies, vegetation processes, and ecosystem properties." http://eu.wiley.com/WileyCDA/Section/index.html.
Helmus, M. R., K. Savage, M. W. Diebel, J. T. Maxted and A. R. Ives (2007). "Separating the determinants of phylogenetic community structure." Ecology Letters 10: 917-925.
Hill, C. J. (1992). "Temporal changes in abundance of two lycaenid butterflies (Lycaenidae) in relation to adult food resources." Journal of the Lepidopterists' Society 46(3): 173-181.
Holl, K. D. (1995). "Nectar resources and their influence on butterfly communities on reclaimed coal surface mines." Restoration Ecology 3(2): 76-85.

41
Horn, H. (2012). "Tagfalter im Nationalpark Donauauen – Einfluss des Donauhochwassers auf Population und Diversität anhand funktioneller Gruppen." Unpublised Bachelor Thesis, Universität Wien.
Höttinger, H., M. Pendl, M. Wiemers and A. Pospisil (2013). Insekten in Wien Tagfalter.
Höttinger, H. and J. Pennerstorfer (1999). "Rote Listen ausgewählter Tiergruppen Niederösterreichs-Tagfalter (Lepidoptera: Rhopalocera & Hesperiidae), 1. Fassung 1999." NÖ Landesregierung, Abteilung Naturschutz, St. Pölten.
Höttinger, H. and J. Pennerstorfer (2005). "Rote Liste der Tagschmetterlinge Österreichs (Lepidoptera: Papilionoidea & Hesperioidea)." Grüne Reihe des Umweltministeriums 14(1): 313-354.
Höttinger, H. and W. Timpe (2003). "Biologie, Gefährdung und Schutz von Melitaea trivia (DENIS & SCHIFFERMüLLER, 1775) in Österreich, insbesondere im Burgenland (Lepidoptera, Nymphalidae)." Joannea Zoologie 5: 51-63.
Hubbell, S. P. (2001). The unified neutral theory of biodiversity and biogeography.
Huemer, P. (2013). Die Schmetterlinge Österreichs (Lepidoptera). Systematische und faunistische Checkliste, Direktor PD Dr. Wolfgang Meighörner.
Hula, V., M. Konvicka, A. Pavlicko and Z. Fric (2004). "Marsh Fritillary (Euphydiyas aurinia) in the Czech Republic: monitoring, metapopulation structure and conservation of an endangered butterfly." Entomologica Fennica 15(4): 231-241.
Humbert, J. Y., J. Ghazoul and T. Walter (2009). "Meadow harvesting techniques and their impacts on field fauna." Agriculture, Ecosystems & Environment 130(1): 1-8.
Johst, K., M. Drechsler, J. Thomas and J. Settele (2006). "Influence of mowing on the persistence of two endangered large blue butterfly species." Journal of Applied Ecology 43(2): 333-342.
Joy, J. and A. S. Pullin (1997). "The effects of flooding on the survival and behaviour of overwintering large heath butterfly Coenonympha tullia larvae." Biological Conservation 82(1): 61-66.
Koh, L. P., N. S. Sodhi and B. W. Brook (2004). "Ecological correlates of extinction proneness in tropical butterflies." Conservation Biology 18(6): 1571-1578.
Konvicka, M., O. Nedved and Z. Fric (2002). "Early-spring floods decrease the survival of hibernating larvae of a wetland-inhabiting population of Neptis rivularis (Lepidoptera : Nymphalidae)." Acta Zoologica Academiae Scientiarum Hungaricae 48(2): 79-88.
Köppel, C. (1997). Die Großschmetterlinge (Makrolepidoptera) der Rastatter Rheinaue: Habitatwahl sowie Überflutungstoleranz und Überlebensstrategien bei Hochwasser Dr. Ulf Eitschberger.
Krauss, J., I. Steffan-Dewenter and T. Tscharntke (2004). "Landscape occupancy and local population size depends on host plant distribution in the butterfly Cupido minimus." Biological Conservation 120(3): 355-361.
Krauss, J., I. Steffan‐Dewenter, C. B. Müller and T. Tscharntke (2005). "Relative importance of resource quantity, isolation and habitat quality for landscape distribution of a monophagous butterfly." Ecography 28(4): 465-474.

42
Laliberté, E. and P. Legendre (2010). "A distance-based framework for measuring functional diversity from multiple traits." Ecology 91(1): 299-305.
Laliberté, E. and B. Shipley (2011). "FD: Measuring functional diversity (FD) from multiple traits, and other tools for functional ecology." R package version 1.0-11. http://cran.r-project.org/package=FD.
Lebensministerium VII/3 (24.06.2013). "Hochwasser 2013 - wie außergewöhnlich ist dieses Ereignis?". 12.03.2014, from http://www.lebensministerium.at/wasser/wasser-oesterreich/wasserkreislauf/hochwasser2013-1.html.
León‐Cortés, J. L., J. J. Lennon and C. D. Thomas (2003). "Ecological dynamics of extinct species in empty habitat networks. 2. The role of host plant dynamics." Oikos 102(3): 465-477.
Loertscher, M., A. Erhardt and J. Zettel (1995). "Microdistribution of butterflies in a mosaic‐like habitat: The role of nectar sources." Ecography 18(1): 15-26.
MacArthur, R. and R. Levins (1967). "The Limiting Similarity, Convergence, and Divergence of Coexisting Species." American naturalist 101(921): 377-385.
Maes, D. and H. Van Dyck (2001). "Butterfly diversity loss in Flanders (north Belgium): Europe's worst case scenario?" Biological Conservation 99(3): 263-276.
Mason, N. W., C. Lanoiselée, D. Mouillot, P. Irz and C. Argillier (2007). "Functional characters combined with null models reveal inconsistency in mechanisms of species turnover in lacustrine fish communities." Oecologia 153(2): 441-452.
Mason, N. W. H., D. Mouillot, W. G. Lee and J. B. Wilson (2005). "Functional richness, functional evenness and functional divergence: the primary components of functional diversity." Oikos 111(1): 112-118.
McGill, B. J., B. J. Enquist, E. Weiher and M. Westoby (2006). "Rebuilding community ecology from functional traits." Trends in Ecology and Evolution 21(4): 178-185.
Moog, D., P. Poschlod, S. Kahmen and K. F. Schreiber (2002). "Comparison of species composition between different grassland management treatments after 25 years." Applied Vegetation Science 5(1): 99-106.
Morris, M. G. (2000). "The effects of structure and its dynamics on the ecology and conservation of arthropods in British grasslands." Biological Conservation 95(2): 129-142.
Mouchet, M. A., S. Villeger, N. W. Mason and D. Mouillot (2010). "Functional diversity measures: an overview of their redundancy and their ability to discriminate community assembly rules." Functional Ecology 24(4): 867-876.
Mouillot, D., N. W. Mason and J. B. Wilson (2007). "Is the abundance of species determined by their functional traits? A new method with a test using plant communities." Oecologia 152(4): 729-737.
Naeem, S. (2002). "Disentangling the impacts of diversity on ecosystem functioning in combinatorial experiments." Ecology 83(10): 2925-2935.
Nationalpark Donau-Auen GmbH (2009). "Nationalpark-Donau-Auen 2009-2018 für den NÖ Teil des Nationalpark, Donau-Auen NÖ Nationalparkgesetz § 10 Abs. 2, Kapitel 1.4.1 Wiesen Nationalpark." 12.03.2014, from http://www.donauauen.at/dateien/2216_Managementplan_download_1.12.09.pdf.
43
Nationalpark Donau-Auen GmbH (2014). "Zahlen, Daten, Fakten." 12.03.2014, from http://www.donauauen.at/?area=nationalpark&subarea=numbers.
Nicholls, C. N. and A. S. Pullin (2003). "The effects of flooding on survivorship in overwintering larvae of the large copper butterfly Lycaena dispar batavus (Lepidoptera : Lycaenidae), and its possible implications for restoration management." European Journal of Entomology 100(1): 65-72.
Oksanen, J., F. G. Blanchet, R. Kindt, P. Legendre, P. R. Michin, R. B. O’Hara, L. S. Garvin, P. Solymos, M. H. H. Stevens and H. Wagner (2013). "vegan: Community Ecology Package." R package version 2.0-9. http://CRAN.R-project.org/package=vegan.
Pakeman, R. J. (2011). "Functional diversity indices reveal the impacts of land use intensification on plant community assembly." Journal of Ecology 99(5): 1143-1151.
Petchey, O. L. and K. J. Gaston (2006). "Functional diversity: back to basics and looking forward." Ecology Letters 9(6): 741-758.
Petchey, O. L., A. Hector and K. J. Gaston (2004). "How do different measures of functional diversity perform?" Ecology 85(3): 847-857.
R Core Team (2013). "R: A language and environment for statistical computing." R Foundation for Statistical Computing, Vienna, Austria. http://www.R-project.org/.
Rabl, D. (2012). "Auswirkungen von Überschwemmungsereignissen auf die Tagfaltergemeinschaften von Wiesen eines mitteleuropäischen Tieflandauwaldes und auf die Abundanz und Inzidenz einzelner Arten." Unpublished Bachelor Thesis, Universität Wien.
Ricotta, C. (2005). "A note on functional diversity measures." Basic and Applied Ecology 6(5): 479-486.
Rothenbuecher, J. and M. Schaefer (2005). "Conservation of leafhoppers in floodplain grasslands - trade-off between diversity and naturalness in a northern German national park." Journal of Insect Conservation 9(4): 335-349.
Saarinen, K., A. Valtonen, J. Jantunen and S. Saarnio (2005). "Butterflies and diurnal moths along road verges: does road type affect diversity and abundance?" Biological Conservation 123(3): 403-412.
Schleuter, D., M. Daufresne, F. Massol and C. Argillier (2010). "A user's guide to functional diversity indices." Ecological Monographs 80(3): 469-484.
Schultz, C. B. and K. M. Dlugosch (1999). "Nectar and hostplant scarcity limit populations of an endangered Oregon butterfly." Oecologia 119(2): 231-238.
Schweiger, O., A. Harpke, M. Wiemers and J. Settele (2014). "CLIMBER: Climatic niche characteristics of the butterflies in Europe." Zookeys 367: 65-84.
Settele, J., R. Steiner, R. Reinhardt and R. Feldmann (2005). Schmetterlinge: Die Tagfalter Deutschlands, Ulmer.
Severns, P. M., L. Boldt and S. Villegas (2006). "Conserving a wetland butterfly: quantifying early lifestage survival through seasonal flooding, adult nectar, and habitat preference." Journal of Insect Conservation 10(4): 361-370.

44
Shahabuddin, G., G. A. Herzner, C. R. Aponte and M. C. del Gomez (2000). "Persistence of a frugivorous butterfly species in Venezuelan forest fragments: the role of movement and habitat quality." Biodiversity & Conservation 9(12): 1623-1641.
Shapiro, A. M. (2002). "The Californian urban butterfly fauna is dependent on alien plants." Diversity and Distributions 8(1): 31-40.
Slamka, F. (2004). Die Tagfalter Mitteleuropas-östlicher Teil.
Sonntag, G. (1981). "Öko‐ethologische Untersuchungen zur Sexualbiologie des Schachbrettfalters (Agapetes galathea L.) unter besonderer Berücksichtigung thermobiologischer Aspekte." Zeitschrift für Tierpsychologie 56(2): 169-186.
Stettmer, C., M. Bräu, P. Gros and O. Wanninger (2011). Die Tagfalter Bayerns und Österreichs - 2. überarbeitete Auflage, Bayerische Akademie für Naturschutz und Landschaftspflege.
Thomas, C. D. and T. M. Jones (1993). "Partial recovery of a skipper butterfly (Hesperia comma) from population refuges: lessons for conservation in a fragmented landscape." Journal of Animal Ecology 62(3): 472-481.
Thomas, J. A. (1983). "The ecology and conservation of Lysandra bellargus (Lepidoptera: Lycaenidae) in Britain." Journal of Applied Ecology 20(1): 59-83.
Thomas, J. A., N. A. D. Bourn, R. T. Clarke, K. E. Stewart, D. J. Simcox, G. S. Pearman, R. Curtis and B. Goodger (2001). "The quality and isolation of habitat patches both determine where butterflies persist in fragmented landscapes." Proceedings of the Royal Society of London. Series B: Biological Sciences 268(1478): 1791-1796.
Tockner, K., F. Schiemer and J. V. Ward (1998). "Conservation by restoration: the management concept for a river‐floodplain system on the Danube River in Austria." Aquatic Conservation-Marine and Freshwater Ecosystems 8(1): 71-86.
Tropek, R. and M. Konvicka (2010). "Forest eternal? Endemic butterflies of the Bamenda highlands, Cameroon, avoid close‐canopy forest." African Journal of Ecology 48(2): 428-437.
Truxa, C. and K. Fiedler (2012). "Down in the flood? How moth communities are shaped in temperate floodplain forests." Insect Conservation and Diversity 5(5): 389-397.
Van Helsdingen, P. J. (1997). "The Spiders (Araneida) of Pollardstown Fen, Co Kildare, Ireland." The Irish Naturalists' Journal 25(11-12): 396-404.
Villéger, S., N. W. H. Mason and D. Mouillot (2008). "New multidimensional functional diversity indices for a multifaceted framework in functional ecology." Ecology 89(8): 2290-2301.
Wahlberg, N., T. Klemetti and I. Hanski (2002). "Dynamic populations in a dynamic landscape: the metapopulation structure of the marsh fritillary butterfly." Ecography 25(2): 224-232.
Webb, M. R. and A. S. Pullin (1998). "Effects of submergence by winter floods on diapausing caterpillars of a wetland butterfly, Lycaena dispar batavus." Ecological Entomology 23(1): 96-99.
Wickham, H. (2009). "ggplot2: elegant graphics for data analysis." Springer New York.
Wiklund, C. (1984). "Egg-laying patterns in butterflies in relation to their phenology and the visual apparency and abundance of their host plants." Oecologia 63(1): 23-29.

45
Wright, D. M. (1983). "Life history and morphology of the immature stages of the bog copper butterfly Lycaena epixanthe (Bsd. and Le C.)(Lepidoptera: Lycaenidae)." Journal of Research on the Lepidoptera 22(1): 47-100.
Zobel, M. (1997). "The relative of species pools in determining plant species richness: an alternative explanation of species coexistence?" Trends in Ecology & Evolution 12(7): 266-269.

46
Appendix Table 13. Abbreviations of the meadows, their geographic coordinates and various ecological descriptors. Flood regime: N_O – non flooded meadows with high level of groundwater, N_M – non flooded meadows, N_S – non flooded meadows with flood impact only in 2013, S – regularly flooded once a year. Mowing regime: mulched, mown or unmown meadows. Average nectar availability of all sampling periods, scaled from 1 (poor) to 3 (rich). Nutrient level: average of the Ellenberg indicator values for nitrogen of the eponymous species of all plant communities occurring on each meadow.
GPS Coordinates Flood regime
mowing regime
nectar availability
area (m nutrient level
N1 48.141674 16.691097 N_O mulched 1.3 21040 2 N2 48.139399 16.688560 N_O mown 0.4 9793 3 N3 48.135885 16.691137 N_O mown 0.4 3184 2 N4 48.135345 16.726652 N_M mown 0.5 13097 1 N5 48.137035 16.737446 N_M mown 0.5 15546 2 N6 48.135388 16.765577 N_M mown 0.7 20651 3 N7 48.137493 16.770920 N_S mown 1.3 31297 1 N8 48.142490 16.855506 N_S mulched 0.2 2105 4 N9 48.144552 16.867415 N_S unmown 0.8 30521 3 N10 48.142204 16.869153 N_S mown 0.3 8963 1 N11 48.140085 48.140085 N_M mown 0.3 41563 3 N12 48.144208 16.686033 N_O mulched 0.2 12287 1 N13 48.144208 16.686033 N_O mown 0.4 10922 3 N14 48.138137 16.670047 N_O mown 0.5 21095 2 N15 48.136634 16.830400 N_M mown 0.3 5890 1 N16 48.136634 16.830400 N_M mown 0.8 15237 2 N17 48.136634 16.830400 N_M mown 0.6 7535 2 N18 48.144208 16.686033 N_M mown 1 8022 1 N19 48.144208 16.686033 N_M mown 0.8 7026 1 N20 48.144208 16.686033 N_O mown 0.6 7311 1 S1 48.131335 16.688436 S mulched 0.2 8974 1 S2 48.129946 16.679124 S mown 0.8 53002 1 S3 48.131292 16.674811 S mown 1.1 39373 1 S4 48.129502 16.712984 S mown 0.6 25507 2 S5 48.126623 16.717683 S mown 0.4 12507 2 S6 48.129058 16.720923 S unmown 0.4 10453 1 S7 48.129058 48.129058 S mown 0.7 33905 1 S8 48.129058 16.720923 S mown 0.8 48903 2 S9 48.129058 16.720923 S mulched 0.5 22458 1 S10 48.129058 16.720923 S unmown 0.3 8405 1 S11 48.129058 16.720923 S mulched 0.5 16160 2 S12 48.129058 16.720923 S mulched 0.3 16057 1 S13 48.127769 16.699594 S unmown 0.7 4095 1 S14 48.129058 16.720923 S mown 0.8 29455 2 S15 48.129058 16.720923 S mown 0.5 31251 1 S16 48.129058 16.720923 S mown 0.9 8242 1 S17 48.129058 16.720923 S mown 0.2 31251 1 S18 48.129058 16.720923 S unmown 0.8 8242 1

47
Table 14. Species list of butterflies from the surveys in 2013, 2012 and 2005. Species found in the respective year were marked (x). Additionally the species were marked (x) if they were found in the Viennese part of the National Park Donauauen, any time between 1989-2011, data from HÖTTINGER et al. (2013). Species only recorded in the Viennese part are written in red.
2013 survey
2012 survey
2005 survey
(HÖTTINGER et al. 2013)
Hesperiidae
Carcharodus alceae x Carterocephalus palaemon x x Erynnis tages x x x x Hesperia comma x x x Heteropterus morpheus x x x x Ochlodes sylvanus x x x x Pyrgus malvae x x x x Spialia sertorius x Thymelicus lineola x x x x Thymelicus sylvestris x x x x
Papilionidae
Iphiclides podalirius x x Papilio machaon x x x Zerynthia polyxena x x x
Pieridae
Anthocharis cardamines x x Colias alfacariensis/hyale x x x Colias crocea x x x Colias erate x x x Gonepteryx rhamni x x x x Leptidea juvernica/sinapis x x x Pieris brassicae x x x Pieris napi x x x x Pieris rapae x x x x Pontia edusa x x x
Lycaenidae
Aricia agestis x x Callophrys rubi x Celastrina argiolus x x x x Cupido alcetas x x Cupido argiades x x x x Cupido decoloratus x - Cupido minimus x x x Glaucopsyche alexis x Lycaena dispar x x x x Lycaena phlaeas x x x x Lycaena tityrus x x x x Neozephyrus quercus x Plebejus argus x x x Plebejus argyrognomon x x x x Polyommatus amandus x Polyommatus bellargus x Polyommatus coridon x x x Polyommatus dorylas x x Polyommatus icarus x x x x Polyommatus semiargus x x Polyommatus thersites x x x Satyrium pruni x x x Satyrium spini x

48
Satyrium w-album x x x Thecla betulae x x
Nymphalidae
Aglais urticae x x x Apatura ilia x x x x Apatura iris x x Aphantopus hyperantus x x x Araschnia levana x x x x Argynnis adippe x x x x Argynnis aglaja x Argynnis paphia x x x Boloria dia x x x Brenthis daphne x x x Brintesia circe x x x Coenonympha glycerion x x x x Coenonympha pamphilus x x x x Erebia medusa x Inachis io x x x x Issoria lathonia x x x x Lasiommata maera x Lasiommata megera x Limenitis camilla x x x Limenitis populi x x Maniola jurtina x x x x Melitaea athalia x Melitaea aurelia x x x Meliaea diamina x x Melitaea didyma x x x x Melitea phoebe x Melanargia galathea x x x x Minois dryas x x x Neptis rivularis x x Nymphalis antiopa x Nymphalis polychloros x x Pararge aegeria x x x x Polygonia c-album x x x x Vanessa atalanta x x x x Vanessa cardui x x x

49
Table 15. Conservation status according to the Red Lists of the butterflies of Austria 2005 (HÖTTINGER & PENNERSTORFER 2005, cit. in HÖTTINGER et al. 2013) in (RL-A 2005), of Lower Austria 1999 HÖTTINGER & PENNERSTORFER 1999 cit. in HÖTTINGER et al. 2013) (RL-LA 1999) and of Vienna 2013 (HÖTTINGER et al. 2013) (RL-V 2013). Categories of RL-A 2005 and RL-V 2013: RE=regionally extinct, CR=critically endangered, EN=endangered, VU=vulnerable, DD=Data deficient, NT=near threatened, LC=least concern, categories of RL-LA 1999: 0= extinct, 1=threatened with extinction 2=strongly endangered, 3=endangered, 4=potentially endangered, 5=vulnerability not exactly known, 6= vulnerability not sufficiently known, I=vulnerable migratory species, +=not endangered, -= not listed. Melitaea cinxia was not listed in HÖTTINGER et al. 2013.
RL-A 2005 RL-LA 1999 RL-V 2013
Hesperiidae
Carcharodus alceae NT 3 LC Carterocephalus palaemon LC + NT Erynnis tages LC + LC Hesperia comma LC + VU Heteropterus morpheus NT + VU Ochlodes sylvanus LC + LC Pyrgus malvae LC + VU Spialia sertorius VU 3 CR Thymelicus lineola LC + LC Thymelicus sylvestris LC + LC
Papilionidae
Iphiclides podalirius NT 3 VU Papilio machaon LC 3 VU Zerynthia polyxena NT 2 EN
Pieridae
Anthocharis cardamines LC + LC Colias alfacariensis/hyale NT/LC 3/+ VU/LC Colias crocea NE I NE Colias erate LC + LC Gonepteryx rhamni LC + LC Leptidea reali/sinapis -/DD /-6 /-DD Pieris brassicae LC + LC Pieris napi LC + LC Pieris rapae LC + LC Pontia edusa LC + LC
Lycaenidae
Aricia agestis NT + NT Callophrys rubi LC + VU Celastrina argiolus LC + x Cupido alcetas - - - Cupido argiades LC + LC Cupido decoloratus LC 5 VU Cupido minimus LC + NT Lycaena dispar LC 3 NT Lycaena phlaeas LC + LC Lycaena tityrus LC + LC Neozephyrus quercus NT + LC Plebejus argus NT + NT Plebejus argyrognomon NT 5 VU Polyommatus amandus LC 3 CR Polyommatus bellargus NT 3 VU Polyommatus coridon NT 3 VU Polyommatus dorylas VU 3 RE Polyommatus icarus LC + LC Polyommatus semiargus LC 2 CR Polyommatus thersites VU 3 VU

50
Satyrium pruni NT 3 EN Satyrium spini NT 3 VU Satyrium w-album VU 3 EN Thecla betulae NT 3 NT
Nymphalidae
Aglais urticae LC + LC Apatura ilia NT 3 NT Apatura iris LC 3 VU Aphantopus hyperantus LC + LC Araschnia levana LC + LC Argynnis adippe NT + VU Argynnis aglaja LC + VU Argynnis paphia LC + LC Boloria dia LC + NT Brenthis daphne LC + DD Brintesia circe LC + LC Coenonympha glycerion LC + LC Coenonympha pamphilus LC + LC Erebia medusa NT + CR Inachis io LC + LC Issoria lathonia LC + LC Lasiommata maera LC 2 RE Lasiommata megera LC + LC Limenitis camilla LC 3 EN Limenitis populi VU 3 CR Maniola jurtina LC + LC Melanargia galathea LC + LC Melitaea athalia LC + VU Melitaea aurelia VU 5 RE Melitaea cinxia - - - Melitaea diamina NT 3 RE Melitaea didyma VU 3 DD Melitaea phoebe VU 3 EN Minois dryas NT + NT Neptis rivularis NT 3 LC Nymphalis antiopa LC 3 EN Nymphalis polychloros NT 2 VU Pararge aegeria LC + LC Polygonia c-album LC + LC Vanessa atalanta LC + LC Vanessa cardui NE + NE

51
Table 16. Number of individuals of each species, counted per site over all sampling periods, in the 2013 survey.
N1 N2 N3 N4 N5 N6 N7 N8 N9 N10 N11 N12 N13 N14 N15 N16 N17 N18 N19 N20
Hesperiidae
Erynnis tages 0 0 0 0 0 0 2 9 22 2 6 0 0 0 0 7 6 3 1 0
Heteropterus morpheus
1 0 0 0 0 0 0 0 0 0 0 0 0 0 0 0 0 0 0 0
Hesperia comma 0 1 0 0 0 0 0 0 1 0 0 0 1 0 0 2 0 0 0 0
Ochlodes sylvanus 0 0 0 0 0 0 0 0 1 0 0 0 0 0 1 4 0 1 0 0
Pyrgus malvae 0 0 0 0 0 0 0 0 0 2 0 0 0 0 0 0 0 0 0 0
Thymelicus lineola 3 0 0 0 0 0 2 0 1 0 0 0 0 0 0 0 0 0 0 4
Thymelicus silvestris 3 2 0 0 0 0 1 0 0 0 0 2 2 0 0 0 0 1 0 0
Papilionidae
Iphiclides podalirius 0 0 0 1 0 0 1 0 0 0 0 0 0 0 0 0 0 0 1 0
Papilio machaon 0 0 0 1 2 1 3 1 0 0 1 0 0 0 1 3 2 0 0 0
Zerynthia polyxena 0 0 0 0 0 0 0 2 0 0 0 0 0 0 0 0 0 0 0 0
Pieridae
Anthocharis cardamines
3 0 0 3 7 1 4 4 9 4 3 4 1 8 0 4 0 1 3 3
Colias alfacariensis/hyale
0 0 0 0 2 0 2 4 0 0 0 0 0 0 0 2 2 0 1 0
Colias crocea 0 0 0 0 1 1 3 2 1 0 1 0 0 0 1 3 2 0 0 0
Colias erate 0 2 0 0 3 0 0 3 0 1 0 0 0 0 0 1 0 0 0 0
Gonepteryx rhamni 0 0 0 0 1 0 0 0 0 0 2 0 0 0 0 1 1 1 0 0
Leptidea juvernica/sinapsis
17 6 0 2 4 22 23 10 8 4 10 0 4 1 1 10 2 4 4 3
Pieris brassicae 1 0 0 0 0 0 0 0 0 0 0 0 0 0 0 0 0 0 0 0
Pieris napi 7 0 2 3 4 9 16 3 7 2 4 3 3 7 3 12 4 12 9 1
Pieris rapae 9 4 6 14 44 22 63 7 27 4 26 7 12 12 13 69 10 11 18 5
Pontia eudusa 2 0 1 0 2 0 0 0 0 2 1 0 2 0 0 1 0 3 0 0
Lycaenidae
Celastrina argiolus 1 1 3 2 3 0 3 0 0 0 3 0 6 3 2 1 1 0 2 4
Cupido alcetas 0 0 0 0 0 1 3 0 0 0 1 0 2 0 1 0 2 0 0 0
Cupido argiades 9 1 0 3 9 16 43 2 4 0 2 1 4 1 5 22 1 6 14 1
Cupido decoloratus 0 0 0 0 0 2 1 1 0 0 0 0 0 0 0 2 0 1 0 0
Cupido minimus 0 0 0 0 0 0 0 0 1 0 0 0 0 0 0 0 0 0 0 0
Lycaena dispar 1 1 0 0 2 0 0 0 0 0 0 0 0 0 0 0 0 0 0 0
Lycaena phlaeas 0 0 0 0 0 0 0 0 0 0 0 0 0 0 0 0 2 0 0 0
Lycaena tityrus 0 0 0 0 0 0 0 0 0 0 0 0 0 0 0 0 2 0 0 0

52
Plebejus argus 0 1 0 0 0 11 6 0 10 0 0 0 0 0 0 0 2 0 0 0
Plebejus argyrognomon
0 2 0 0 0 11 6 0 12 0 1 0 0 0 0 0 0 0 0 0
Polyommatus coridon
0 0 0 0 0 1 0 0 0 0 0 0 0 0 0 1 0 2 0 0
Polyommatus dorylas
0 0 0 0 0 1 0 0 0 0 0 0 0 0 0 0 0 0 0 0
Polyommatus icarus 3 5 2 2 23 17 43 4 13 0 9 4 1 6 2 28 9 5 25 8
Polyommatus semiargus
0 0 0 0 0 0 0 0 0 0 0 0 0 0 0 0 0 0 0 0
Polyommatus thersites
0 0 0 0 0 0 0 0 0 0 0 0 0 0 0 0 0 0 3 0
Satyrium w-album 0 0 0 0 0 0 0 0 0 0 0 0 0 0 0 0 0 0 0 0
Nymphalidae
Aglais urticae 0 0 0 0 0 3 0 0 0 0 0 0 0 0 0 0 0 0 0 0
Araschnia levana 0 0 6 2 4 0 6 6 6 7 17 0 1 2 14 0 0 0 3 0
Apatura ilia 0 0 0 0 0 0 0 0 1 0 0 0 0 0 0 0 0 0 0 0
Apatura iris 0 0 0 0 0 0 0 0 0 0 0 0 0 0 0 0 0 0 0 0
Aphantopus hyperantus
0 9 0 2 1 1 0 0 0 0 0 1 5 8 0 0 0 0 2 0
Argynnis adippe 0 0 1 0 0 0 0 0 0 0 0 0 0 0 0 0 0 0 0 0
Argynnis aglaja 0 0 0 0 0 0 0 0 0 0 0 0 0 0 0 0 0 0 0 0
Argynnis paphia 4 1 1 0 1 0 0 0 3 0 0 4 5 6 0 1 1 0 1 1
Brenthis daphne 3 0 1 0 0 0 0 0 0 0 0 0 0 1 0 0 0 0 0 1
Brintesia circe 1 0 0 0 8 0 0 0 0 0 0 0 0 0 0 0 0 0 0 0
Boloria dia 1 1 1 5 32 12 10 2 1 0 0 1 0 0 3 7 1 7 5 4
Coenonympha glycerion
41 98 26 7 56 71 26 9 30 1 13 4 49 6 6 68 14 13 0 0
Coenonympha pamphilus
1 0 0 1 4 3 14 13 5 0 2 0 2 1 1 7 1 2 0 0
Inachis io 1 0 0 0 0 0 0 0 1 1 0 0 0 0 1 6 0 0 0 0
Issoria lathonia 1 0 1 0 1 1 1 0 7 0 2 1 1 1 0 4 0 1 1 0
Limenitis camilla 0 0 0 0 1 0 1 0 0 0 0 0 1 0 0 0 0 0 0 0
Limenitis populi 0 0 0 1 0 0 0 0 0 0 0 0 0 1 0 0 0 0 0 0
Maniola jurtina 79 42 12 48 96 32 27 6 20 1 15 24 53 34 13 72 8 28 0 0
Melanargia galathea
3 0 0 0 5 0 2 0 1 0 1 1 4 0 0 0 0 0 1 0
Melitea aurelia 0 0 0 0 0 0 0 0 0 0 0 0 0 0 0 0 0 0 0 0
Melitaea didyma 0 3 0 3 7 0 5 1 0 0 1 0 0 0 0 0 0 0 0 0
Minois dryas 0 0 0 0 0 1 1 0 0 0 0 0 0 0 0 0 0 0 0 0
Neptis rivularis 0 0 0 0 0 0 0 0 0 0 0 0 0 0 0 1 0 0 0 0
Nymphalis polychloros
0 0 0 0 0 0 0 0 2 0 0 0 0 0 0 0 0 0 0 0
Pararge aegeria 0 0 0 0 0 0 1 0 0 1 0 0 0 1 0 0 0 0 0 0
Polygonia c-album 0 0 0 1 0 0 0 1 1 0 0 0 1 3 2 2 0 0 2 0

53
Vanessa atalanta 0 0 0 0 0 3 1 0 3 1 0 0 0 0 0 0 1 1 0 0
Vanessa cardui 0 0 1 1 0 1 1 1 1 0 0 0 1 0 0 0 0 1 0 0
S1 S2 S3 S4 S5 S6 S7 S8 S9 S10 S11 S12 S13 S14 S15 S16 S17 S18
Hesperiidae
Erynnis tages 0 1 1 0 0 0 0 6 1 0 1 0 0 0 0 0 0 0
Heteropterus morpheus
0 0 0 0 0 0 0 0 0 0 0 0 0 0 0 0 0 0
Hesperia comma 0 0 0 0 0 0 0 0 0 0 0 0 0 0 0 0 0 0
Ochlodes sylvanus 0 0 0 0 0 0 0 3 0 0 0 0 0 2 0 0 0 0
Pyrgus malvae 0 0 0 0 0 0 0 0 1 0 0 0 0 0 0 0 0 0
Thymelicus lineola 1 0 0 0 0 0 0 0 0 0 0 0 1 0 0 0 0 0
Thymelicus silvestris 1 0 0 0 0 0 1 0 0 0 0 0 0 0 0 0 0 0
Papilionidae
Iphiclides podalirius 0 0 0 0 0 0 0 1 0 0 0 0 1 0 0 0 0 1
Papilio machaon 0 0 1 0 0 0 0 1 0 0 0 0 0 7 1 0 0 0
Zerynthia polyxena 0 0 0 0 0 0 0 0 0 0 0 0 0 0 0 0 0 0
Pieridae
Anthocharis cardamines
1 2 2 0 0 0 0 0 2 3 0 4 0 3 3 1 0 1
Colias alfacariensis/hyale
0 2 0 1 0 0 0 0 0 0 0 0 0 2 0 0 0 0
Colias crocea 0 2 2 0 0 0 2 1 0 0 0 1 0 0 0 0 1 1
Colias erate 0 0 0 0 0 0 0 0 0 0 0 0 0 1 0 0 0 0
Gonepteryx rhamni 0 1 0 0 0 0 0 0 0 0 0 0 1 0 0 0 0 0
Leptidea juvernica/sinapsis
6 1 0 2 0 0 2 6 1 2 1 0 1 15 3 3 6 1
Pieris brassicae 0 0 0 0 0 0 0 0 1 1 0 0 0 0 0 0 0 0
Pieris napi 9 31 6 13 0 6 13 0 12 6 3 1 6 11 24 8 3 5
Pieris rapae 12 35 10 15 2 6 23 33 14 10 10 6 10 64 26 17 18 16
Pontia daplidice 0 1 0 0 0 0 1 3 0 0 1 0 0 0 0 3 0 1
Lycaenidae
Celastrina argiolus 2 4 6 3 5 1 12 1 2 0 1 2 12 0 3 1 1 2
Cupido alcetas 0 0 0 0 0 0 0 0 0 0 0 0 0 1 0 0 0 0
Cupido argiades 1 9 6 9 0 1 3 9 0 0 0 0 1 3 1 0 1 0
Cupido decoloratus 0 0 0 1 0 0 1 0 0 0 0 0 0 0 0 1 0 0
Cupido minimus 0 1 0 0 0 0 0 1 0 0 0 0 0 4 0 0 0 0
Lycaena dispar 0 0 1 0 0 0 2 2 0 0 0 0 0 0 0 0 0 0
Lycaena phlaeas 0 0 0 0 2 0 0 0 0 0 0 0 0 0 0 0 0 0
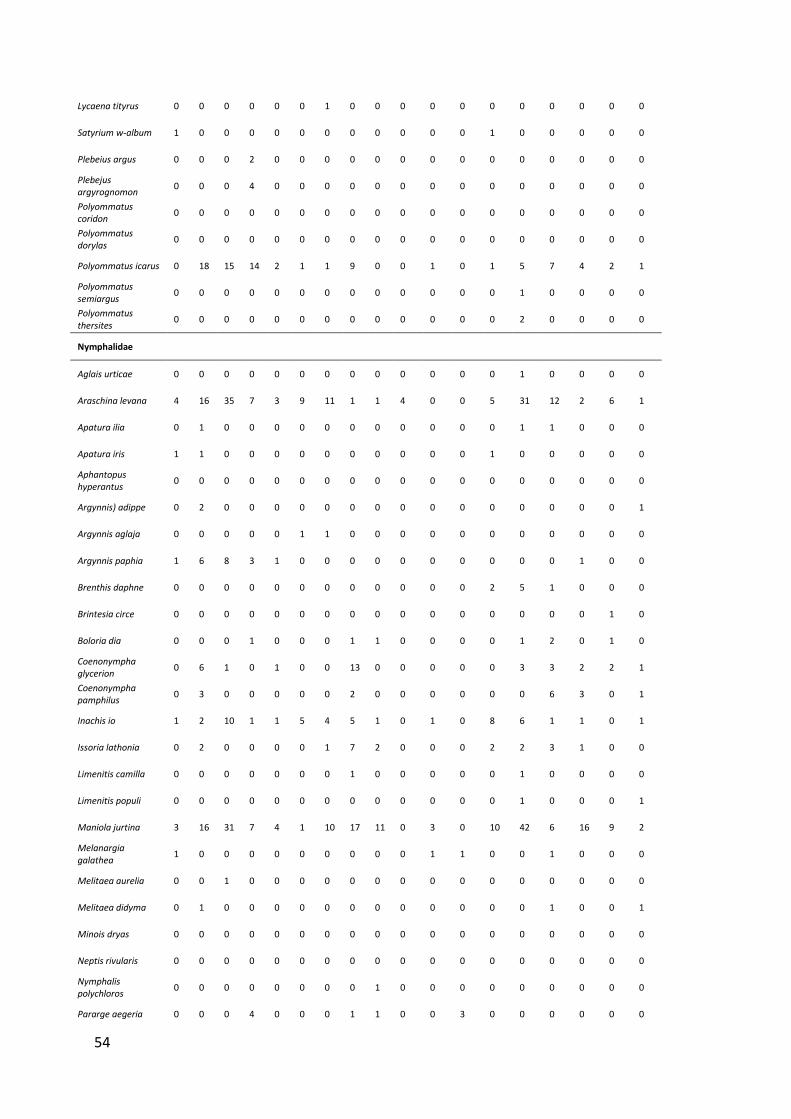
54
Lycaena tityrus 0 0 0 0 0 0 1 0 0 0 0 0 0 0 0 0 0 0
Satyrium w-album 1 0 0 0 0 0 0 0 0 0 0 0 1 0 0 0 0 0
Plebeius argus 0 0 0 2 0 0 0 0 0 0 0 0 0 0 0 0 0 0
Plebejus argyrognomon
0 0 0 4 0 0 0 0 0 0 0 0 0 0 0 0 0 0
Polyommatus coridon
0 0 0 0 0 0 0 0 0 0 0 0 0 0 0 0 0 0
Polyommatus dorylas
0 0 0 0 0 0 0 0 0 0 0 0 0 0 0 0 0 0
Polyommatus icarus 0 18 15 14 2 1 1 9 0 0 1 0 1 5 7 4 2 1
Polyommatus semiargus
0 0 0 0 0 0 0 0 0 0 0 0 0 1 0 0 0 0
Polyommatus thersites
0 0 0 0 0 0 0 0 0 0 0 0 0 2 0 0 0 0
Nymphalidae
Aglais urticae 0 0 0 0 0 0 0 0 0 0 0 0 0 1 0 0 0 0
Araschina levana 4 16 35 7 3 9 11 1 1 4 0 0 5 31 12 2 6 1
Apatura ilia 0 1 0 0 0 0 0 0 0 0 0 0 0 1 1 0 0 0
Apatura iris 1 1 0 0 0 0 0 0 0 0 0 0 1 0 0 0 0 0
Aphantopus hyperantus
0 0 0 0 0 0 0 0 0 0 0 0 0 0 0 0 0 0
Argynnis) adippe 0 2 0 0 0 0 0 0 0 0 0 0 0 0 0 0 0 1
Argynnis aglaja 0 0 0 0 0 1 1 0 0 0 0 0 0 0 0 0 0 0
Argynnis paphia 1 6 8 3 1 0 0 0 0 0 0 0 0 0 0 1 0 0
Brenthis daphne 0 0 0 0 0 0 0 0 0 0 0 0 2 5 1 0 0 0
Brintesia circe 0 0 0 0 0 0 0 0 0 0 0 0 0 0 0 0 1 0
Boloria dia 0 0 0 1 0 0 0 1 1 0 0 0 0 1 2 0 1 0
Coenonympha glycerion
0 6 1 0 1 0 0 13 0 0 0 0 0 3 3 2 2 1
Coenonympha pamphilus
0 3 0 0 0 0 0 2 0 0 0 0 0 0 6 3 0 1
Inachis io 1 2 10 1 1 5 4 5 1 0 1 0 8 6 1 1 0 1
Issoria lathonia 0 2 0 0 0 0 1 7 2 0 0 0 2 2 3 1 0 0
Limenitis camilla 0 0 0 0 0 0 0 1 0 0 0 0 0 1 0 0 0 0
Limenitis populi 0 0 0 0 0 0 0 0 0 0 0 0 0 1 0 0 0 1
Maniola jurtina 3 16 31 7 4 1 10 17 11 0 3 0 10 42 6 16 9 2
Melanargia galathea
1 0 0 0 0 0 0 0 0 0 1 1 0 0 1 0 0 0
Melitaea aurelia 0 0 1 0 0 0 0 0 0 0 0 0 0 0 0 0 0 0
Melitaea didyma 0 1 0 0 0 0 0 0 0 0 0 0 0 0 1 0 0 1
Minois dryas 0 0 0 0 0 0 0 0 0 0 0 0 0 0 0 0 0 0
Neptis rivularis 0 0 0 0 0 0 0 0 0 0 0 0 0 0 0 0 0 0
Nymphalis polychloros
0 0 0 0 0 0 0 0 1 0 0 0 0 0 0 0 0 0
Pararge aegeria 0 0 0 4 0 0 0 1 1 0 0 3 0 0 0 0 0 0

55
Polygonia c-album 2 1 7 1 0 0 0 1 0 0 0 0 0 1 1 2 1 3
Vanessa atalanta 2 2 1 1 0 2 0 0 0 0 0 1 1 0 0 1 2 0
Vanessa cardui 0 0 1 0 0 0 0 5 0 0 0 0 0 4 0 1 0 0

56
Table 17. Number of individuals of each species, counted per site over all sampling periods, in the 2012 survey.
N1 N2 N3 N4 N5 N6 N7 N8 N9 N10 N11 N12 N13 N14
Hesperiidae
Erynnis tages 0 1 0 1 0 0 0 2 1 1 2 0 0 0
Heteropterus morpheus
2 1 0 0 0 0 0 0 0 0 0 0 0 0
Hesperia comma 0 0 0 0 1 0 1 0 0 0 0 1 0 3
Ochlodes sylvanus 2 1 1 0 0 0 0 0 0 1 0 1 8 5
Pyrgus malvae 0 0 0 0 0 0 0 0 1 0 0 0 0 0
Thymelicus lineola 9 1 9 1 3 35 13 2 0 7 1 17 5 11
Thymelicus silvestris
0 1 0 0 0 0 0 0 0 0 0 5 0 7
Papilionidae
Papilio machaon 0 0 0 0 0 0 0 0 0 0 0 0 1 0
Pieridae
Colias alfacariensis/hyale
0 0 0 1 0 1 1 2 0 0 0 0 0 0
Colias crocea 0 0 0 3 0 1 1 1 1 1 2 0 0 0
Colias erate 0 0 0 1 0 0 0 0 0 0 0 0 0 0
Gonepteryx rhamni
1 2 2 0 0 1 3 1 1 0 0 0 0 0
Leptidea juvernica/sinapsis
3 0 3 0 0 5 26 5 1 15 2 17 3 3
Pieris brassicae 0 0 0 0 0 0 1 0 0 0 0 0 1 0
Pieris napi 0 1 5 1 2 1 3 0 1 1 3 3 1 4
Pieris rapae 8 4 1 8 15 12 31 7 15 10 11 5 6 13
Lycaenidae
Celastrina argiolus 0 0 1 3 7 0 1 0 1 1 0 1 4 5
Cupido argiades 0 2 0 5 2 8 15 2 4 9 1 3 0 11
Cupido minimus 0 0 0 1 0 0 0 0 0 0 0 0 0 2
Lycaena dispar 0 0 4 0 0 0 0 0 0 0 0 2 0 0
Lycaena phlaeas 0 0 0 0 0 0 1 0 0 1 0 0 0 0
Lycaena tityrus 0 0 0 0 7 0 0 0 0 0 0 0 1 0
Neozephyrus quercus
1 0 0 0 0 0 0 0 0 0 0 0 0 0
Plebejus argus 1 1 0 0 0 18 3 17 15 2 0 0 0 0
Plebejus argyrognomon
0 2 0 1 2 3 4 2 2 0 0 0 0 0
Polyommatus coridon
0 0 0 0 0 4 0 0 1 0 0 0 0 0
Polyommatus icarus
1 1 1 10 7 11 25 16 3 2 12 7 1 5
Polyommatus semiargus
1 0 0 0 0 0 0 0 0 0 0 0 0 0
Satyrium pruni 0 0 0 0 0 0 0 0 0 0 0 0 0 0

57
Satyrium w-album 0 0 0 0 0 0 0 0 2 0 0 0 1 0
Thecla betulae 0 0 0 0 1 0 0 0 0 0 0 0 0 0
Nymphalidae
Apatura ilia 0 0 0 1 2 0 1 0 3 0 3 1 0 3
Aphantopus hyperantus
2 14 4 7 2 1 1 0 1 0 1 7 14 3
Araschnia levana 0 0 2 0 0 1 0 0 0 1 3 0 1 3
Argynnis adippe 0 0 0 0 0 0 1 0 0 0 0 0 0 0
Argynnis paphia 2 9 1 2 7 1 2 0 0 2 2 4 22 2
Boloria dia 6 11 0 6 64 32 26 6 17 6 17 3 0 2
Brenthis daphne 2 0 9 0 0 0 1 0 0 0 0 2 4 2
Brintesia circe 0 0 1 2 0 0 0 0 1 0 0 0 0 0
Coenonympha glycerion
31 10 17 0 11 31 33 22 20 7 4 13 0 9
Coenonympha pamphilus
1 1 0 1 8 1 12 21 0 2 1 1 2 11
Inachis io 0 0 0 0 0 0 0 1 0 0 0 0 0 0
Issoria lathonia 0 0 0 1 2 0 3 2 0 0 2 0 0 0
Maniola jurtina 51 47 86 56 108 63 107 19 31 26 25 88 39 54
Melanargia galathea
48 6 0 3 49 14 35 32 4 4 2 24 8 9
Melitaea aurelia 0 0 1 0 0 0 0 0 0 0 0 0 0 0
Melitaea diamina 0 0 0 0 0 0 0 0 0 0 0 0 0 0
Melitaea didyma 0 1 0 1 2 7 7 1 0 0 1 0 0 1
Minois dryas 0 0 0 0 0 1 3 3 0 0 3 0 0 0
Pararge aegeria 0 0 0 0 0 0 0 0 0 0 1 0 0 0
Polygonia c-album 0 0 0 2 2 0 0 1 3 0 2 1 2 1
Vanessa atalanta 1 0 1 0 0 0 1 1 0 0 0 0 0 1
Vanessa cardui 0 0 0 0 0 0 4 0 0 0 0 0 1 0
S1 S2 S3 S4 S5 S6 S7 S8 S9 S10 S11 S12 S13
Hesperiidae
Erynnis tages 0 1 0 1 0 0 0 2 1 1 2 0 0
Heteropterus morpheus
2 1 0 0 0 0 0 0 0 0 0 0 0
Hesperia comma 0 0 0 0 1 0 1 0 0 0 0 1 0
Ochlodes sylvanus 2 1 1 0 0 0 0 0 0 1 0 1 8
Pyrgus malvae 0 0 0 0 0 0 0 0 1 0 0 0 0
Thymelicus lineola 9 1 9 1 3 35 13 2 0 7 1 17 5

58
Thymelicus silvestris
0 1 0 0 0 0 0 0 0 0 0 5 0
Papilionidae
Papilio machaon 0 0 0 0 0 0 0 0 0 0 0 0 1
Pieridae
Colias alfacariensis/hyale
0 0 0 1 0 1 1 2 0 0 0 0 0
Colias crocea 0 0 0 3 0 1 1 1 1 1 2 0 0
Colias erate 0 0 0 1 0 0 0 0 0 0 0 0 0
Gonepteryx rhamni
1 2 2 0 0 1 3 1 1 0 0 0 0
Leptidea juvernica/sinapsis
3 0 3 0 0 5 26 5 1 15 2 17 3
Pieris brassicae 0 0 0 0 0 0 1 0 0 0 0 0 1
Pieris napi 0 1 5 1 2 1 3 0 1 1 3 3 1
Pieris rapae 8 4 1 8 15 12 31 7 15 10 11 5 6
Lycaenidae
Celastrina argiolus 0 0 1 3 7 0 1 0 1 1 0 1 4
Cupido argiades 0 2 0 5 2 8 15 2 4 9 1 3 0
Cupido minimus 0 0 0 1 0 0 0 0 0 0 0 0 0
Lycaena dispar 0 0 4 0 0 0 0 0 0 0 0 2 0
Lycaena phlaeas 0 0 0 0 0 0 1 0 0 1 0 0 0
Lycaena tityrus 0 0 0 0 7 0 0 0 0 0 0 0 1
Neozephyrus quercus
1 0 0 0 0 0 0 0 0 0 0 0 0
Plebejus argus 1 1 0 0 0 18 3 17 15 2 0 0 0
Plebejus argyrognomon
0 2 0 1 2 3 4 2 2 0 0 0 0
Polyommatus coridon
0 0 0 0 0 4 0 0 1 0 0 0 0
Polyommatus icarus
1 1 1 10 7 11 25 16 3 2 12 7 1
Polyommatus semiargus
1 0 0 0 0 0 0 0 0 0 0 0 0
Satyrium pruni 0 0 0 0 0 1 0 0 0 0 0 0 0
Satyrium w-album 0 0 0 0 0 0 0 0 2 0 0 0 1
Thecla betulae 0 0 0 0 1 0 0 0 0 0 0 0 0
Nymphalidae
Apatura ilia 0 0 0 1 2 0 1 0 3 0 3 1 0
Aphantopus hyperantus
2 14 4 7 2 1 1 0 1 0 1 7 14
Araschnia levana 0 0 2 0 0 1 0 0 0 1 3 0 1
Argynnis adippe 0 0 0 0 0 0 1 0 0 0 0 0 0
Argynnis paphia 2 9 1 2 7 1 2 0 0 2 2 4 22

59
Boloria dia 6 11 0 6 64 32 26 6 17 6 17 3 0
Brenthis daphne 2 0 9 0 0 0 1 0 0 0 0 2 4
Brintesia circe 0 0 1 2 0 0 0 0 1 0 0 0 0
Coenonympha glycerion
31 10 17 0 11 31 33 22 20 7 4 13 0
Coenonympha pamphilus
1 1 0 1 8 1 12 21 0 2 1 1 2
Inachis io 0 0 0 0 0 0 0 1 0 0 0 0 0
Issoria lathonia 0 0 0 1 2 0 3 2 0 0 2 0 0
Maniola jurtina 51 47 86 56 108 63 107 19 31 26 25 88 39
Melanargia galathea
48 6 0 3 49 14 35 32 4 4 2 24 8
Melitaea aurelia 0 0 1 0 0 0 0 0 0 0 0 0 0
Melitaea diamina 0 0 0 0 0 0 0 0 0 0 0 0 0
Melitaea didyma 0 1 0 1 2 7 7 1 0 0 1 0 0
Minois dryas 0 0 0 0 0 1 3 3 0 0 3 0 0
Pararge aegeria 0 0 0 0 0 0 0 0 0 0 1 0 0
Polygonia c-album 0 0 0 2 2 0 0 1 3 0 2 1 2
Vanessa atalanta 1 0 1 0 0 0 1 1 0 0 0 0 0
Vanessa cardui 0 0 0 0 0 0 4 0 0 0 0 0 1

60
Table 18. Number of individuals of each species, counted per site over all sampling periods, in the 2005 survey.
14 15 16 17 18 26 36 37 38 39 40 44
N2 N1 N12 N13 N14
Hesperiidae
Carterocephalus palaemon
0 0 0 0 1 0 0 0 0 0 0 0
Erynnis tages 0 0 0 0 1 0 0 0 0 0 0 0
Heteropterus morpheus
0 0 0 0 0 0 0 0 1 0 0 0
Ochlodes sylvanus
0 0 0 0 0 0 0 0 0 0 0 2
Pyrgus malvae 0 0 0 0 0 0 0 0 0 0 0 0
Thymelicus lineola
0 1 0 0 0 0 0 0 0 0 1 2
Thymelicus sylvestris
0 0 0 0 0 0 0 0 0 0 0 0
Papilionidae
Zerynthia polyxena
0 0 0 0 0 0 0 0 0 0 0 0
Pieridae
Antocharis cardamines
0 4 0 0 0 0 0 0 0 0 0 0
Colias hyale 0 1 0 0 0 0 0 0 0 0 0 0
Gonepteryx rhamni
0 0 0 3 0 0 0 0 0 0 0 0
Pieris napi 1 0 2 0 0 0 0 0 0 0 3 1
Pieris rapae 0 0 1 1 1 0 0 2 2 0 1 2
Pontia edusa 0 0 0 0 0 0 0 0 0 0 0 0
Lycaenidae
Aricia agestis 1 0 0 0 0 0 0 0 0 0 0 0
Celastrina argiolus
0 0 0 0 0 0 0 0 0 0 0 0
Cupido argiades 0 0 0 0 0 0 0 0 0 0 0 0
Lycaena dispar 0 0 0 0 0 0 0 0 0 0 0 0
Lycaena phlaeas 0 0 0 0 0 0 0 0 0 0 0 0
Lycaena tityrus 0 0 0 1 0 0 0 0 0 0 0 0
Plebeius argyrognomon
0 0 0 0 0 0 0 0 0 0 1 3
Polyommatus icarus
18 13 4 3 5 1 3 32 0 1 11 10
Polyommatus thersites
0 0 0 0 0 0 0 0 0 0 0 0
Satyrium pruni 0 0 0 1 0 0 0 0 0 0 0 0
Nymphalidae
Aglais urticae 0 0 0 0 0 0 0 0 0 0 0 0

61
Apatura ilia 0 0 2 5 0 0 2 0 0 0 0 0
Araschnia levana
0 0 0 0 0 0 0 0 0 0 0 0
Argynnis adippe 0 0 0 0 0 0 0 0 2 0 0 1
Brenthis daphne 0 0 4 0 1 0 0 2 0 1 0 0
Coenonympha glycerion
30 35 10 7 5 7 1 16 2 22 3 22
Coenonympha pamphilus
7 30 7 3 19 2 6 2 0 0 2 1
Inachis io 0 0 0 0 0 0 0 0 0 0 0 0
Issoria lathonia 0 0 0 0 1 0 0 0 0 0 0 0
Limenitis camilla 0 0 0 1 0 0 0 0 0 1 0 2
Maniola jurtina 77 23 13 6 18 15 6 47 3 27 150 90
Melanargia galathea
2 2 0 0 0 0 0 2 0 7 0 4
Melitaea didyma
9 2 0 0 7 0 0 0 0 0 0 2
Pararge aegeria 0 0 0 0 0 0 0 0 0 0 0 0
Polygonia c-album
0 1 2 0 0 0 2 0 1 2 0 0
Vanessa atalanta
0 0 0 0 0 0 0 0 0 0 0 0
14 15 16 17 18 26 36 37 38 39 40 44
1 2 5 8 11 12 13 22 23 29 31 34 45 47 48 50
S2 S3 S1 S13 S2 S4 S5
Hesperiidae
Carterocephalus palaemon
0 0 0 0 0 1 0 0 0 0 0 0 0 0 0 0
Erynnis tages 0 0 0 0 0 0 0 0 0 0 0 0 0 0 0 0
Heteropterus morpheus
0 0 0 0 0 0 0 0 0 0 0 0 0 0 0 0
Ochlodes sylvanus
0 0 0 0 0 0 0 0 0 0 0 0 0 0 0 0
Pyrgus malvae 0 0 0 0 0 1 1 0 0 0 0 0 0 0 0 0
Thymelicus lineola
0 0 0 2 0 0 0 0 0 0 0 0 0 0 0 0
Thymelicus sylvestris
0 0 0 3 0 0 0 0 0 0 0 0 0 0 0 0
Papilionidae
Zerynthia polyxena
0 0 0 0 0 0 0 0 0 0 0 0 0 0 0 0
Pieridae
Antocharis cardamines
0 0 0 1 0 0 0 0 0 0 0 0 0 0 0 0
Colias hyale 0 4 0 0 0 0 0 0 0 0 0 0 0 0 0 0
Gonepteryx rhamni
0 0 0 0 0 0 0 0 0 0 0 0 0 0 0 0
Pieris napi 36 0 0 1 1 3 0 0 0 1 2 1 1 1 1 1

62
Pieris rapae 4 3 2 0 1 1 1 1 0 0 0 0 0 1 0 2
Pontia edusa 0 0 0 0 0 0 0 0 1 0 0 0 0 0 0 0
Lycaenidae
Aricia agestis 0 0 0 0 0 0 0 0 0 0 0 0 0 0 0 0
Celastrina argiolus
0 0 0 0 0 0 0 0 0 0 0 0 0 0 0 0
Cupido argiades 0 0 0 1 0 0 0 0 0 0 0 0 0 0 0 0
Lycaena dispar 0 0 0 0 0 1 0 0 0 2 0 0 0 0 0 0
Lycaena phlaeas 1 1 0 0 0 0 0 0 0 0 0 0 0 0 0 0
Lycaena tityrus 1 5 3 0 0 1 1 0 0 0 0 0 0 0 0 0
Plebeius argyrognomon
0 0 0 0 0 0 0 0 0 0 0 0 0 0 0 0
Polyommatus icarus
1 1 0 7 1 0 0 13 0 1 2 2 0 1 4 0
Polyommatus thersites
0 0 0 0 0 0 0 1 0 0 0 0 0 0 0 0
Satyrium pruni 0 0 0 0 0 0 0 0 0 0 0 0 0 0 0 0
Nymphalidae
Aglais urticae 0 0 0 0 0 0 0 0 0 0 0 0 0 0 0 0
Apatura ilia 0 0 0 0 0 0 0 0 0 0 0 1 0 2 1 1
Araschnia levana
2 0 0 0 0 1 0 0 0 0 0 0 0 0 0 0
Argynnis adippe 0 0 0 0 0 0 0 0 0 0 0 0 0 0 0 0
Brenthis daphne 0 0 0 0 0 0 0 0 0 0 0 0 1 0 0 0
Coenonympha glycerion
0 5 0 5 0 1 12 6 1 3 0 14 0 7 2 0
Coenonympha pamphilus
3 36 2 19 4 2 24 2 0 7 0 7 1 0 1 0
Inachis io 1 0 0 0 0 0 0 0 0 0 0 0 0 0 0 0
Issoria lathonia 0 0 0 0 0 0 0 0 0 0 0 0 0 0 0 0
Limenitis camilla 0 0 0 0 0 0 0 0 0 0 0 0 0 0 0 0
Maniola jurtina 7 52 12 1 28 34 52 158 4 29 6 26 27 37 54 6
Melanargia galathea
0 0 1 0 0 0 0 0 0 0 0 0 0 0 1 0
Melitaea didyma
0 0 0 0 0 0 0 0 0 0 0 0 0 0 0 0
Pararge aegeria 0 0 2 0 0 0 0 0 0 0 0 0 1 0 0 0
Polygonia c-album
0 0 2 1 1 0 0 0 0 1 0 0 4 0 0 0
Vanessa atalanta
0 0 0 0 0 0 0 0 0 0 0 0 0 0 0 0

63
Table 19. Functional traits of the butterfly species of the 2013 survey. Phagism: 0=monophagous, 0.5 = uniphagous, 1=polyphagous species (BINK 1992). Grass: 0=never grass-feeding, 0.5=grass-feeding, 1=exclusively grass-feeding species. Herb: 0=never herb-feeding, 0.5=herb and woody plants feeding, 1=exclusively herb feeding species. Wood: 0=never woody plants feeding, 0.5=woody plants and herb feeding, 1=exclusively woody plants feeding species. Fabaceae: 0=never Fabaceae feeding, 0.5= Fabaceae feeding, 1=exclusively Fabaceae feeding species. Brassicaceae: 0=never Brassicaceae feeding, 0.5=Brassicaceae feeding, 1= Brassicaceae feeding species. Habitat: 1=true meadow species, 1.5=species inhabiting meadows and margins, 2=species inhabiting margins, 2.5= species inhabiting forest margins, 3=species inhabiting forest (BINK 1992, SETTELE et al. 2005). Lifespan: species living 1=10-15 days, 1.5=16-20 days, 2=21-25 days, 2.5=26-35 days, 3=36-45 days, 3.50 >45 days. Length of the forewing: in mm (SLAMKA 2004). Voltinism: 1= univoltine, 2=polyvoltine species. Fecundity: Species laying 1=40-89 eggs, 1.5=90-134 eggs, 2=135-202 eggs, 2.5=203-303 eggs, 3=304-455 eggs, 3.5=465-1024 eggs (SETTELE et al. 2005). Mean temperature index, mean precipitation index and mean soil water content are taken from (SCHWEIGER et al. 2014).
Ph
agism
grass
herb
s
wo
od
Fabaceae
Brassicaceae
Hab
itat
Lifespan
length
of th
e fo
rewin
g
Vo
ltinism
Fecun
dity
larval
residen
ce
STI (tem
peratu
re
ind
ex)
mean
precip
itation
in
dex
mean
soil
water co
nten
t
Hesperiidae
Erynnis tages 0.5 0 1 0 1 0 1 1 13.5 1 1 1 9.12 807.99 0.44
Hesperia comma
0.5 1 0 0 0 0 1 2 15 1 1 1 8.47 769.27 0.43
Heteropterus morpheus
0.5 1 0 0 0 0 2 1 17 1 1 1 9.52 764.79 0.42
Ochlodes sylvanus
0.5 1 0 0 0 0 2 1.5 15 1 1.5 1 8.58 777.08 0.44
Pyrgus malvae 0.5 0 1 0 0 0 1 1 12 2 1 1 8.74 765.57 0.43
Thymelicus lineola
0.5 1 0 0 0 0 2 1 14 1 2 1 8.69 736.42 0.42
Thymelicus sylvestris
0.5 1 0 0 0 0 2 1 13.5 1 2 1 9.87 783.58 0.43
Papilionidae
Iphiclides podalirius
0.5 0 0 1 0 0 1.5 1.5 38.5 2 2 2 10.87 780.33 0.42
Papilio machaon
1 0 1 0 0 0 1 1.5 45 2 1.5 1 9.28 737.43 0.42
Zerynthia polyxena
0 0 1 0 0 0 2.5 2 26.5 1 1 1 10.67 777.33 0.39
Pieridae
Anthocharis cardamines
0.5 0 1 0 0 1 1.5 1 21 1 1 1 8.3 778.77 0.44
Colias alfacariensis /hyale
0.5 0 1 0 1 0 1 2 25 2 3 1 9.94 811.35 0.43
Colias crocea 0.5 0 1 0 1 0 1 2 25 2 3 1 10.69 798.28 0.43
Colias erate 0.5 0 1 0 1 0 1 1.5 23.5 2 2.5 1 10.03 632.06 0.34
Gonepteryx rhamni
0.5 0 0 1 0 0 2.5 3.5 28.5 1 2.5 2 8.81 772.47 0.43
Leptidea juvernica/reali
0.5 0 1 0 1 0 1 1 20.5 2 1 1 9.11 770.01 0.43
Pieris brassicae
0.5 0 1 0 0 1 1 1.5 30.5 2 2.5 1 9.29 789.63 0.44
Pieris napi 0.5 0 1 0 0 1 1.5 1 22 2 1.5 1 8.21 793.11 0.45

64
Pieris rapae 0.5 0 1 0 0 1 1 1.5 23 2 1.5 1 9.63 778.96 0.43
Pontia edusa 1 0 1 0 0 0.5 1 1.5 22 2 2 1 10.43 730.71 0.4
Lycaenidae
Celastrina argiolus
1 0 0.5 0.5 0.5 0 2.5 1 15 2 1.5 2 9.14 763.1 0.43
Cupido alcetas 0.5 0 1 0 1 0 2 1 14.5 2 1.5 1 10.81 844.04 0.43
Cupido argiades
0.5 0 1 0 1 0 1 1.5 13.5 2 2 1 9.42 766.25 0.42
Cupido decoloratus
0 0 1 0 1 0 1 1 12.5 2 1.5 1 9.57 645.13 0.35
Cupido minimus
0 0 1 0 1 0 1.5 1 12.5 2 1.5 1 8.76 817.26 0.45
Lycaena dispar 0 0 1 0 0 0 1 2 17.5 2 3 1 9.34 706.61 0.39
Lycaena phlaeas
0 0 1 0 0 0 1 1.5 13.5 2 2 1 9.29 787.04 0.44
Lycaena tityrus
0 1 0 0 0 0 1 1 15 2 2 1 9.35 778.38 0.43
Satyrium w-album
0 0 0 1 0 0 3 2.5 15 1 1 3 8.87 768.93 0.43
Plebejus argus 1 0 0.5 0.5 0.5 0 1 2 13.5 2 1 1 8.61 778.56 0.43
Plebejus argyrognomon
0.5 0 1 0 1 0 1 1.5 15 2 2.5 1 9.51 766.48 0.41
Polyommatus coridon
0 0 1 0 1 0 1 2.5 17 1 2 1 9.31 801.21 0.44
Polyommatus dorylas
0 0 1 0 1 0 1 2 16 1 1.5 1 9.32 869.36 0.45
Polyommatus icarus
0.5 0 1 0 1 0 1 1.5 16 2 2.5 1 9.07 789.28 0.44
Polyommatus semiargus
0.5 0 1 0 1 0 1 1.5 15.5 2 2.5 1 7.91 755.5 0.44
Polyommatus thersites
0 0 1 0 1 0 1 1.5 14.5 2 2 1 10.59 791.04 0.42
Nymphalidae
Aglais urticae 0 0 1 0 0 0 1 3 23.5 2 3.5 1 8.12 781.52 0.44
Apatura ilia 0 0 0 1 0 0 2.5 2 36.5 1 2 3 9.03 776.95 0.42
Apatura iris 0 0 0 1 0 0 2.5 2 37.5 1 1.5 3 8.51 774.96 0.43
Aphantopus hyperantus
0.5 1 0 0 0 0 1 1.5 22 1 2.5 1 7.9 770.27 0.44
Araschina levana
0 0 1 0 0 0 2.5 1 18 2 3 1 8.62 739.43 0.42
Argynnis adippe
0 0 1 0 0 0 2.5 2.5 27 1 1.5 1 8.37 772.92 0.43
Argynnis aglaja
0 0 1 0 0 0 2.5 2 27.5 1 2.5 1 7.79 814.41 0.46
Argynnis paphia
0 0 1 0 0 0 2.5 3 35 1 1.5 1 9.02 777.2 0.43
Brenthis daphne
0 0 0 1 0 0 2.5 2 23.5 1 2 1 10.6 822.57 0.42
Brintesia circe 0.5 1 0 0 0 0 1 2.5 35.5 1 3 1 11.07 796.98 0.41
Boloria dia 0 0 1 0 0 0 1.5 1.5 17 2 1.5 1 9.28 784.27 0.43
Coenonympha glycerion
0.5 1 0 0 0 0 1 1 17 2 1 1 8.06 736.54 0.42
Coenonympha pamphilus
0.5 1 0 0 0 0 1 1.5 15 2 1.5 1 8.96 793.06 0.44
Limenitis camilla
0 0 0 1 0 0 3 1.5 27 1 1.5 2 8.85 815.11 0.45

65
Limenitis populi
0 0 0 1 0 0 3 1.5 39.5 1 2 3 7.48 769.55 0.44
Maniola jurtina
1 1 0 0 0 0 2.5 2.5 24.5 1 3 1 9.85 797.53 0.43
Melitaea aurelia
1 0 1 0 0 0 1 1.5 16.5 1 3.5 1 8.68 833.3 0.45
Melitaea didyma
1 0 1 0 0 0 1 1.5 20 2 2.5 1 10.42 783.05 0.42
Minois dryas 0.5 1 0 0 0 0 1 2 29 1 2 1 9.52 807.1 0.43
Neptis rivularis
0.5 0 0 1 0 0 2.5 2 25 1 1.5 2 8.23 856.9 0.46
Nymphalis polychloros
1 0 0 1 0 0 2.5 3.5 29.5 1 3.5 3 9.68 760.71 0.42
Inachis io 0.5 0 0.5 0.5 0 0 1 3 30 2 3.5 1 8.12 781.52 0.44
Issoria lathonia
0 0 1 0 0 0 1 1.5 20.5 2 3 1 9.33 748.91 0.41
Melanargia galathea
0.5 1 0 0 0 0 1 2 25.5 1 1.5 1 9.71 782.6 0.43
Pararge aegeria
0.5 1 0 0 0 0 2 1.5 20.5 2 1 1 9.71 775.84 0.43
Polygonia c-album
1 0 0.5 0.5 0 0 2.5 3 23.5 2 1.5 2 8.6 759.35 0.43
Vanessa atalanta
0 0 1 0 0 0 2 3 30 2 2.5 1 9.07 785.78 0.44
Vanessa cardui
1 0 1 0 0 0 1 3 29 2 2.5 1 9.04 770.51 0.43

66
Abstract
The impact of flooding regimes on temperate-zone butterfly communities has thus far
received little attention. Along the river Danube in eastern Austria, a levee built in the late
19th century nowadays largely interrupts natural river dynamics. Only a fraction of the
floodplain area still experiences annual inundations during summer after snow-melt in the
Alps. Butterfly communities on meadows have to face another crucial and unpredictable
event, viz. mowing. To study the influence of these two factors on butterfly communities we
repeatedly counted butterflies over a vegetation period on 18 flooded and 20 non flooded
meadows. Also a dataset from an earlier survey (2012) at the same region was used, to
compare the influence of a strong summer inundation (my survey, 2013) to the influences of
a softer inundation (2012). We also assessed the availability of nectar sources and the
nutrient status of the meadows. The butterfly species list, containing species that were
found in 2013, 2012, 2005 and in the Viennese part (listed by HÖTTINGER et al. 2013) contains
84 species, of which three species are listed as strongly endangered and 24 as endangered,
on the Red list of Lower Austria. Species number per meadow was exclusively influenced by
overall butterfly abundance; in turn, overall butterfly abundance, as expected, was lower on
meadows affected by annual flooding. But nevertheless, species accumulation curves
suggest that the species richness on the flooded, southern meadows was smaller than on
the not flooded, northern meadows. Likewise, as expected, species composition differed
significantly relative to flooding regime. Butterfly species which were more common on
flooded meadows were not typical wetland species, but rather the most abundant
ubiquitous species. Grass-feeders were more affected by flood regime than herb-feeders in
general. In particular, Brassicaceae-feeding species of the family Pieridae were relatively
more prevalent on nutrient-rich flood-prone meadows. The proportion of migratory and
dispersive butterflies, but also butterflies showing a high fecundity and a long lifespan, was
higher on flood-prone meadows. On flood-impacted meadows more butterflies were found
which are characteristic for more humid habitats. Against expectations, disturbance effects
of mowing were outweighed by flooding; mowing shaped species composition only if the
annual inundation was less intense. Meadows with medium flooding impact by uprising
groundwater (N_O) and annually flooded meadows are ruled by niche differentiation,
whereas the butterfly assemblages on meadows without flooding impact are rather ruled by
the limiting similarity theory.

67
Zusammenfassung
Der Einfluss von Überflutung auf Tagfaltergemeinschaften wurde bisher kaum untersucht.
Im Nationalpark Donau-Auen erfahren die Tagfaltergemeinschaften südlich des Marchfeld-
Schutzdamms, welcher im späten 19. Jahrhundert erbaut wurde, regelmäßige
Überflutungen. Die Wiesen nördlich des Damms sind von der Dynamik des Hochwassers
abgetrennt. Die Überflutung wird jährlich im Sommer in unterschiedlichem Ausmaße durch
die Schneeschmelze in den Alpen verursacht. Neben der Überflutung ist die Mahd der zweite
unvorhersehbare Faktor mit welchen die Tagfaltergemeinschaften umgehen müssen. In
dieser Studie wurde der Einfluss der Überflutung sowie der Mahd auf die
Tagfaltergemeinschaften untersucht. Dazu wurden die Tagfalter auf 20 nicht überfluteten
und 18 überfluteten Wiesen über eine Vegetationsperiode hinweg regelmäßig erfasst. Um
die Auswirkungen unterschiedlich starker Überflutung auf die Tagfaltergemeinschaften
abschätzen zu können wurden Daten aus dem Jahr 2012 und 2005, Jahre mit sehr geringem
Hochwasser, mit den Daten dieser Arbeit (2013), mit einem sehr starken Hochwasser,
verglichen. Zudem wurde auf jeder Wiese die Nektarverfügbarkeit bewertet sowie der
Nährstoffgehalt der Wiesen erfasst. Regressionsanalysen ergaben, dass einzig die Abundanz
einen Einfluss auf den lokalen Artenreichtum nimmt. Hingegen zeigen
Artenakkumulationskurven, dass weniger Arten des regionalen Artenpools auf den südlichen
Wiesen vorkommen. Im Gegensatz zum lokalen Artenreichtum ist jedoch die Abundanz
signifikant geringer auf den Wiesen mit Hochwasserreinfluss. Auch die Futtergilden wurden
vom Hochwasser verändert. Auf den südlichen Wiesen gab es einen höheren Anteil an Kraut-
fressenden und innerhalb dieser Gilde an Brassicaceae-fressenden Schmetterlingen. Auf den
nördlichen Wiesen waren die Gras-fressenden Tagfalter relativ gesehen häufiger. Es wurde
zudem ein signifikant höherer Anteil an Wanderfaltern, dispersiven Tagfaltern und
Tagfaltern mit einer sehr langen Lebensspanne und einer hohen Fekundität auf den
überfluteten Wiesen angetroffen. Die Artenzusammensetzung der Tagfalter wurde ebenfalls
stark vom Hochwasser beeinflusst. Ebenso wie der Einfluss der Flut, beeinflusste auch der
Nährstoffgehalt die Artenzusammensetzung. Entgegen der Erwartungen konnte keine
charakteristische Tagfaltergemeinschaft bestehend aus Arten, welche auf feuchte Habitate
spezialisiert sind, für die regelmäßig überfluteten Wiesen gefunden werden. In beiden
Jahren machten die drei insgesamt häufigsten Arten fast die Hälfte des Unterschiedes
zwischen der Artenzusammensetzung im nördlichen und südlichen Teil aus. Dennoch
konnten auf den südlichen Wiesen mehr Arten nachgewiesen werden, welche in relativ
feuchten Lebensräumen vorkommen. Entgegen aller Erwartungen stellte sich heraus, dass
der Faktor Mahd von dem Faktor Flut überlagert wird und nur geringfügigen Einfluss auf die
Artenzusammensetzung im Jahr 2012 nahm. Die Tagfaltergemeinschaften der Wiesen mit
einem mittleren Einfluss durch den Faktor Flut (N_O) werden von der Niche Differentiation
theory bestimmt, die nördlichen Wiesen ohne Einfluss durch die Flut eher durch die Limiting
Similarity theory.

68
Curriculum Vitae
Personal Information
Name: Rebecca Fies
Nationality: Germany
Date of birth: 06.03.1988
Location of birth: Mannheim
Education
since 10/2011 University of Vienna / Vienna / Master’s programme
Naturschutz und Biodiversitätsmanagement
Master’ thesis: “Impact of flood control on the communities of
meadow butterflies in the Nationalpark Donau-Auen.“
since 03/2012 University of Vienna / Vienna / Master’s programme
Botany
2007- 2011 University of Konstanz / Konstanz / Bachelor’s Programme
Biological Science
Bachelor Thesis: “Futterqualität im Wirt-Parasit-System Daphnia
magna- Pasteuria ramosa: Einfluss auf die nächste Generation.“
2005-2007 Max-Slevogt-Gymnasium / Landau i.d. Pfalz / Abitur
1998-2005 Marienschule (Gymnasium) / Krefeld
1994- 1998 Sollbrüggenschule (Primary School) / Krefeld
Extracurricular activities
04/2007- 07/2007 Wellington / New Zealand
Voluntary service at Global Volunteer Network
02/2011-05/2011 Konstanz / Wollmatinger Ried
Placement at Naturschutzbund (NABU)
02/2012 Thailand
Study tour with the Division of Systematic and Evolutionary Botany
through Thailand
04-06/04/2014 University of Southampton / Southampton
Oral presentation at the Butterfly conservation 7 International
Symposium

69
Professional experience
02-04/2009 University of Konstanz / Konstanz
Research assistant, Zoology
07-09/2010 University of Konstanz / Konstanz
Research assistant, Limnology
07-09/2011 Botanical garden of the University of Konstanz / Konstanz
Research assistant, Botany
Language skills
English, excellent written and spoken
French, good written and spoken
Computer literacy
Microsoft Office, R, ArcGIS, SPADE