master thesis voorblad appendices
TRANSCRIPT

Master Thesis
The elevated metro structure in concrete, UHPC and composite
Appendices design study
Rotterdam, October 2010
Author R.J.A. Kenter
1213059
Delft University of Technology Faculty of Civil Engineering &
Geosciences Department of Design & Construction
Section of Structural & Building Engineering
Rotterdam Public Works Engineering Office
Department of Civil Engineering
Graduation Committee
Prof.dr.ir. J.C. Walraven Dr.ing. A. Romeijn Ir. S. Pasterkamp
Dr.ir. C.B.M. Blom

Appendices
The elevated metro structure in concrete, UHPC and composite
Figure front page: the Bangkok Mass Transit System [i6]

Design study 113
Appendices
Appendix A: Concrete concepts ...................................................................................................... 117 A.1 Inverted T-beam bridge ............................................................................................................. 117 A.2 Box beam bridge ....................................................................................................................... 118 A.3 Cast in-situ box girder bridge (internal prestressing) ................................................................ 119 A.4 Precast segmental box girder bridge (external prestressing) ................................................... 120 A.5 Trough bridge ............................................................................................................................ 121
Appendix B: Calculations concrete box girder C50/60 ................................................................. 123 B.1 Introduction................................................................................................................................ 123 B.2 Material characteristics.............................................................................................................. 124
B.2.1 Concrete C50/60................................................................................................................. 124 B.2.2 Reinforcing steel FeB 500 .................................................................................................. 124 B.2.3 Prestressing steel FeP 1860............................................................................................... 125
B.3 Geometry box girder.................................................................................................................. 126 B.3.1 General ............................................................................................................................... 126 B.3.2 Determination of cantilever length ...................................................................................... 127 B.3.3 Concrete cover.................................................................................................................... 127 B.3.4 Effective width of flanges .................................................................................................... 128 B.3.5 Cross-sectional properties .................................................................................................. 129
B.4 Loads......................................................................................................................................... 131 B.4.1 General ............................................................................................................................... 131 B.4.2 Vertical loads ...................................................................................................................... 131 B.4.3 Horizontal loads .................................................................................................................. 132 B.4.4 Load schematisation in longitudinal direction ..................................................................... 132 B.4.5 Load schematisation in transversal direction...................................................................... 133
B.5 Prestressing tendons................................................................................................................. 134 B.5.1 Layout prestressing tendons............................................................................................... 134 B.5.2 Bending moments due to prestressing ............................................................................... 134 B.5.3 Bending moments due to loads .......................................................................................... 136 B.5.4 Stresses due to loading ...................................................................................................... 137 B.5.5 Prestressing losses............................................................................................................. 139
B.6 Deflection................................................................................................................................... 144 B.7 Shear + torsion .......................................................................................................................... 146
B.7.1 Shear + torsion in webs ...................................................................................................... 146 B.7.2 Shear + torsion in flanges ................................................................................................... 151
B.8 Ultimate resistance moment...................................................................................................... 155 B.8.1 General ............................................................................................................................... 155 B.8.2 Bending moments due to the loads and prestressing ........................................................ 156 B.8.3 Ultimate resistance moment at t=0 ..................................................................................... 157 B.8.4 Ultimate resistance moment at t=∞ .................................................................................... 159
B.9 Deck .......................................................................................................................................... 161 B.9.1 Schematisation load input in Scia Engineer ....................................................................... 161 B.9.2 Verifications of shear and ultimate resistance moment ...................................................... 167
B.10 Fatigue + vibration................................................................................................................... 172 B.10.1 Fatigue prestressing steel................................................................................................. 172 B.10.2 Fatigue concrete ............................................................................................................... 174 B.10.3 Vibration............................................................................................................................ 179
B.11 Buckling webs.......................................................................................................................... 182 Appendix C: Calculations UHPC box girder C180 ......................................................................... 185
C.1 Introduction................................................................................................................................ 185 C.2 Material characteristics ............................................................................................................. 186
C.2.1 UHPC C180: Ductal®-AF ................................................................................................... 186 C.2.2 Reinforcing steel FeB 500 .................................................................................................. 186 C.2.3 Prestressing steel FeP 1860 .............................................................................................. 187
C.3 Geometry box girder.................................................................................................................. 188 C.3.1 General ............................................................................................................................... 188 C.3.2 Determination of cantilever length ...................................................................................... 189

Appendices
114 The elevated metro structure in concrete, UHPC and composite
C.3.3 Concrete cover ................................................................................................................... 189 C.3.4 Effective width of flanges .................................................................................................... 189 C.3.5 Cross-sectional properties.................................................................................................. 190
C.4 Loads......................................................................................................................................... 192 C.4.1 General ............................................................................................................................... 192 C.4.2 Vertical loads ...................................................................................................................... 192 C.4.3 Horizontal loads .................................................................................................................. 193 C.4.4 Load schematisation in longitudinal direction..................................................................... 193 C.4.5 Load schematisation in transversal direction ..................................................................... 194
C.5 Prestressing tendons................................................................................................................. 195 C.5.1 Layout prestressing tendons .............................................................................................. 195 C.5.2 Bending moments due to prestressing ............................................................................... 195 C.5.3 Bending moments due to loads .......................................................................................... 197 C.5.4 Stresses due to loading ...................................................................................................... 198 C.5.5 Prestressing losses ............................................................................................................ 200
C.6 Deflection .................................................................................................................................. 205 C.7 Shear + torsion.......................................................................................................................... 207
C.7.1 Shear + torsion in webs ...................................................................................................... 207 C.7.2 Shear + torsion in flanges................................................................................................... 212
C.8 Ultimate resistance moment...................................................................................................... 216 C.8.1 General ............................................................................................................................... 216 C.8.2 Bending moments due to the loads and prestressing ........................................................ 217 C.8.3 Ultimate resistance moment at t=0 ..................................................................................... 218 C.8.4 Ultimate resistance moment at t=∞ .................................................................................... 220
C.9 Deck .......................................................................................................................................... 222 C.9.1 Schematisation load input in Scia Engineer ....................................................................... 222 C.9.2 Verifications of shear and ultimate resistance moment...................................................... 228
C.10 Fatigue + vibration................................................................................................................... 233 C.10.1 Fatigue prestressing steel ................................................................................................ 233 C.10.2 Fatigue concrete ............................................................................................................... 235 C.10.3 Vibration............................................................................................................................ 236
C.11 Buckling webs ......................................................................................................................... 239 Appendix D: Results optimisation process .................................................................................... 241
D.1 Results optimisation process concrete box girder C50/60........................................................ 241 D.1.1 Box girder with 6 tendons ................................................................................................... 241 D.1.2 Box girder with 8 tendons ................................................................................................... 242 D.1.3 Box girder with 4 tendons ................................................................................................... 243
D.2 Results optimisation process UHPC box girder C180 .............................................................. 244 D.2.1 Box girder with 6 tendons ................................................................................................... 244 D.2.2 Box girder with 8 tendons ................................................................................................... 245 D.2.3 Box girder with 4 tendons ................................................................................................... 246
Appendix E: Calculations FRP ......................................................................................................... 247 E.1 Introduction................................................................................................................................ 247 E.2 Material characteristics.............................................................................................................. 247
E.2.1 Carbon fibres, polyacrylonitrile, fibre type: graphite, table 3.3 [7] ...................................... 247 E.2.2 Epoxy, Appendix 8 [17] ....................................................................................................... 247
E.3 Geometry sandwich girder ........................................................................................................ 247 E.3.1 General ............................................................................................................................... 248 E.3.2 Skin ..................................................................................................................................... 248 E.3.3 Core .................................................................................................................................... 248
E.4 Loads and partial factors ........................................................................................................... 250 E.4.1 General ............................................................................................................................... 250 E.4.2 Vertical loads ...................................................................................................................... 251 E.4.3 Loads in the serviceability limit state .................................................................................. 252 E.4.4 Loads in the ultimate limit state .......................................................................................... 252
E.5 Deflection................................................................................................................................... 252 E.6 Vibration .................................................................................................................................... 253 E.7 Stresses..................................................................................................................................... 256
E.7.1 Skin ..................................................................................................................................... 256 E.7.2 Core .................................................................................................................................... 257

Design study 115
E.7.3 Flexural strength ................................................................................................................. 257 E.8 Shear ......................................................................................................................................... 257
E.8.1 Transverse shear ................................................................................................................ 258 E.8.2 Parallel shear ...................................................................................................................... 258
E.9 Buckling of the core................................................................................................................... 258 Appendix F: Infracore principle ....................................................................................................... 259 Appendix G: Calculations column + foundation ............................................................................ 261
G.1 Column + foundation in combination with a concrete box girder .............................................. 261 G.1.1 General............................................................................................................................... 261 G.1.2 Column C50/60................................................................................................................... 261 G.1.3 Loads at the top of the column ........................................................................................... 262 G.1.4 Foundation.......................................................................................................................... 263 G.1.5 Stability ............................................................................................................................... 265 G.1.6 Stiffness.............................................................................................................................. 266 G.1.7 Foundation piles ................................................................................................................. 266 G.1.8 Stresses in column ............................................................................................................. 269 G.1.9 Overview weight contribution of elements.......................................................................... 270
G.2 Column + foundation in combination with a UHPC box girder.................................................. 270 G.2.1 General............................................................................................................................... 270 G.2.2 Column C50/60................................................................................................................... 270 G.2.3 Loads at the top of the column ........................................................................................... 271 G.2.4 Foundation.......................................................................................................................... 273 G.2.5 Stability ............................................................................................................................... 274 G.2.6 Stiffness.............................................................................................................................. 275 G.2.7 Foundation piles ................................................................................................................. 276 G.2.8 Stresses in column ............................................................................................................. 278 G.2.9 Overview weight contribution of elements.......................................................................... 279
G.3 Column + foundation in combination with a FRP sandwich girder ........................................... 279 G.3.1 General............................................................................................................................... 279 G.3.2 Column C50/60................................................................................................................... 280 G.3.3 Loads at the top of the column ........................................................................................... 280 G.3.4 Foundation.......................................................................................................................... 282 G.3.5 Stability ............................................................................................................................... 283 G.3.6 Stiffness.............................................................................................................................. 284 G.3.7 Foundation piles ................................................................................................................. 285 G.3.8 Stresses in column ............................................................................................................. 287 G.3.9 Overview weight contribution of elements.......................................................................... 288
Appendix H: 3D-impressions three designs................................................................................... 289 Appendix I: Alternative solutions and assumptions for the substructure .................................. 291
I.1 The application of columns made of UHPC instead of concrete ................................................ 291 I.2 Changing the spring stiffness of the piles................................................................................... 292 I.3 Changing the height of the columns ........................................................................................... 293
Appendix J: Costs ............................................................................................................................. 295 J.1 Costs elevated metro structure C50/60 ..................................................................................... 295 J.2 Costs elevated metro structure C180 ........................................................................................ 296 J.3 Costs elevated metro structure FRP.......................................................................................... 297
Appendix K: Comparison fatigue verifications for concrete ........................................................ 299 K.1 General...................................................................................................................................... 299 K.2 Verification according to Annex NN.3.2 [12] (Eurocode)........................................................... 299 K.3 Verification according to the National Annex [13] (Eurocode) .................................................. 300 K.4 Verification according to 9.6.2.2.a.1 [14] (NEN 6723)............................................................... 301 K.5 Verification according to 9.6.2.2.a.2 [14] (NEN 6723)............................................................... 301 K.6 Comparison different verifications ............................................................................................. 302

Appendices
116 The elevated metro structure in concrete, UHPC and composite

Appendix A: Concrete concepts
Design study 117
Appendix A: Concrete concepts
A.1 Inverted T-beam bridge Dimensions: ZIP1700 [21]
Figure 59: Cross-section superstructure with inverted T-beam bridge
Figure 60: Dimensions inverted T-beam

Appendices
118 The elevated metro structure in concrete, UHPC and composite
A.2 Box beam bridge Dimensions: SKK1600 [21]
Figure 61: Cross-section superstructure with box beam bridge
Figure 62: Dimensions box beam
Appendix A: Concrete concepts
Design study 119
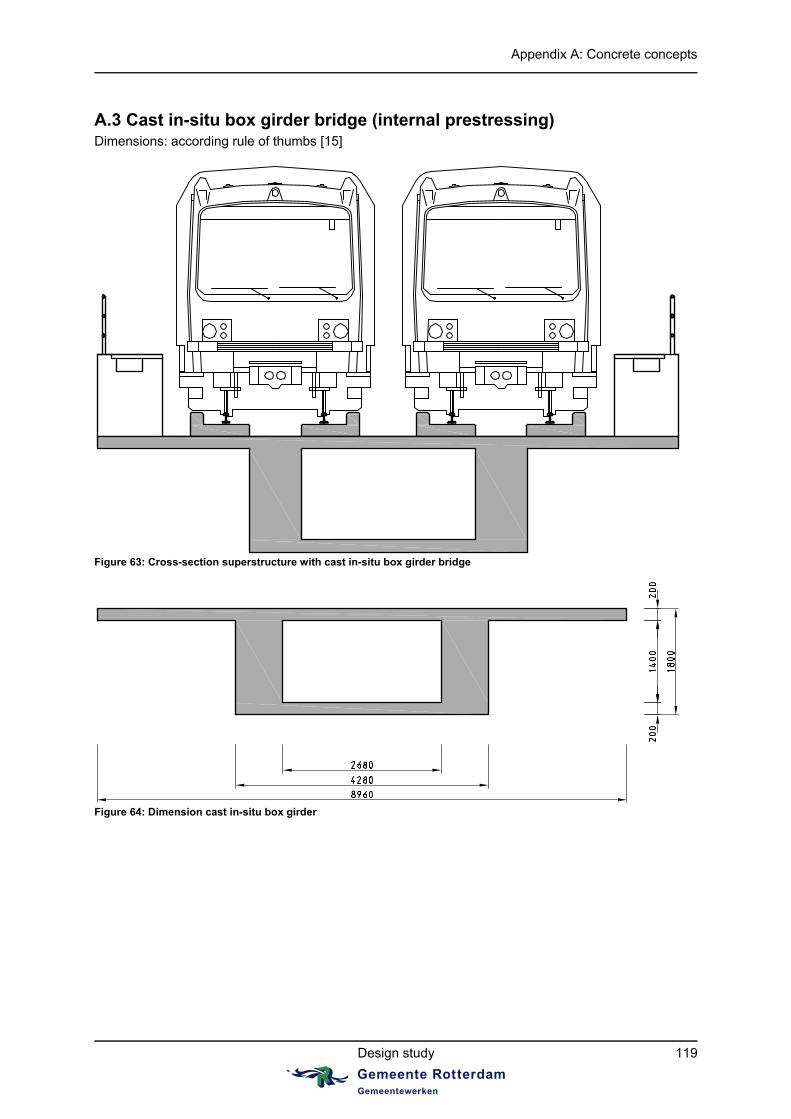
A.3 Cast in-situ box girder bridge (internal prestressing) Dimensions: according rule of thumbs [15]
Figure 63: Cross-section superstructure with cast in-situ box girder bridge
Figure 64: Dimension cast in-situ box girder

Appendices
120 The elevated metro structure in concrete, UHPC and composite
A.4 Precast segmental box girder bridge (external prestressing) Dimensions: deduced from reference projects [6]
Figure 65: Cross-section superstructure with precast segmental box girder bridge
Figure 66: Dimensions precast segmental box girder

Appendix A: Concrete concepts
Design study 121
A.5 Trough bridge Dimensions: deduced from reference projects [5]
Figure 67: Cross-section superstructure with trough bridge
Figure 68: Dimensions trough bridge

Appendices
122 The elevated metro structure in concrete, UHPC and composite

Appendix B: Calculations concrete box girder C50/60
Design study 123
Appendix B: Calculations concrete box girder C50/60
B.1 Introduction This Appendix presents the calculations of the optimal box girder in concrete C50/60. First the material characteristics of the concrete and steel are described. Paragraph 3 deals with the geometry and the structural schematisation of the box girder and its characteristics. The loads to which the box girder is subjected are treated in paragraph 4. In the next paragraph the layout of the external prestressing tendons is shown and the stresses in the box girder due to loading and prestressing are calculated. It also contains the calculations of the prestressing losses. Furthermore this Appendix describes the calculations on deflection, shear + torsion and the ultimate resistance moment of the box girder in respectively the paragraphs 6, 7 and 8. The calculations on the deck thickness are treated in paragraph 9. Finally this Appendix deals with the calculations on fatigue and vibration of the box girder and buckling of the webs. The formulas and values used in the calculations are taken from [11] and other references, which are then stated in the text.

Appendices
124 The elevated metro structure in concrete, UHPC and composite
B.2 Material characteristics
B.2.1 Concrete C50/60
Density of concrete [8] c 2500 kg/m3
Partial factor for concrete c 1.5
Coefficient taking account of long term effects on the compressive strength and of unfavourable effects resulting from the way the load is applied [12]
cc 0.85
Coefficient taking account of long term effects on the tensile strength and of unfavourable effects resulting from the way the load is applied.
ct 1.0
Characteristic compressive cylinder strength of concrete at 28 days ckf 50 N/mm2
Mean value of concrete cylinder compressive strength
8 ckcm ff 58 N/mm2
Mean value of axial tensile strength of concrete
)3/2(*30.0 ckctm ff 4.07 N/mm2
5% fractile characteristic axial tensile strength of concrete ctmctk ff *7.005.0, 2.85 N/mm2
Secant modulus of elasticity of concrete
3.0]10/)[(22 cmcm fE 37277.87 N/mm2
Compressive strain in the concrete at the end of the linear part 3c 1.75 ‰
Ultimate compressive strain in the concrete 3cu 3.5 ‰
Design value of concrete compressive strength cckcccd ff / 28.33 N/mm2
Design value of concrete tensile strength cctkctctd ff /05.0, 1.90 N/mm2
B.2.2 Reinforcing steel FeB 500
Density of reinforcing steel s 7850 kg/m3
Characteristic yield strength of reinforcement ykf 500 N/mm2
Partial factor for reinforcing steel s 1.15
Design yield strength of reinforcement sykyd ff / 435 N/mm2
Design value of modulus of elasticity of reinforcing steel sE 200,000 N/mm2

Appendix B: Calculations concrete box girder C50/60
Design study 125
B.2.3 Prestressing steel FeP 1860
Density of prestressing steel p 7850 kg/m3
Characteristic tensile strength of prestressing steel [24] pkf 1860 N/mm2
Characteristic 0.1% proof-stress of prestressing steel [24] kpf 1.0 1600 N/mm2
Partial factor for prestressing steel s 1.15
Design tensile strength of prestressing steel skppd ff /1.0 1391 N/mm2
Ultimate tensile strength of prestressing steel spkf / 1617 N/mm2
Design value of modulus of elasticity of prestressing steel pE 200,000 N/mm2
Factor 1k 0.8
Factor 2k 0.9
Factor 7k 0.75
Factor 8k 0.85
Maximum tensile stress in the tendon (during tensioning)
}*;*min{ 1.021max, kppkp fkfk 1440 N/mm2
Maximum tensile stress in the tendon (after tensioning, initial stress at t=0)
}*;*min{ 1.0870 kppkpm fkfk 1360 N/mm2

Appendices
126 The elevated metro structure in concrete, UHPC and composite
B.3 Geometry box girder
Figure 69: Statically determinate box girders supported by columns
Figure 70: Cross-section of the box girder
B.3.1 General Length span L 45 m Depth box girder H 2.8 m
Width top flange tfb 8.96 m
Thickness top flange tft 0.25 m
Width web wb 0.16 m
Width bottom flange bfb 4 m
Thickness bottom flange bft 0.3 m
Width box top side boxtsb 5 m
Cantilever length top flange cantL 1.98 m
Depth webs boxH 2.25 m
Angle of webs with vertical axis
1.11
2/)(tan 1
bfbox
bfboxtsw tH
bb
P
m45 m45
P

Appendix B: Calculations concrete box girder C50/60
Design study 127
B.3.2 Determination of cantilever length Rule of thumbs to determine the top flange thickness:
canttf Lt10
1
))(2(*30
1cantwtftf Lbbt
This gives:
mbbL
bbL
LbbL
wtfcant
wtfcant
cantwtfcant
728.1)*2(*30
6
)*2(*30
1*)
30
2
10
1(
))(2(*30
1
10
1
As the main forces act in the middle of the deck (metros) it is chosen to bring the webs more underneath the metros, see Figure 73. Therefore the following dimensions are chosen:
boxtsb 5 m
cantL 1.98 m
bfb 4 m
The width of the bottom flange bfb is chosen smaller than the width of the box top side boxtsb . This way
the railway girder requires a smaller support and the angle w is still small enough for the webs to
transfer the vertical loads mainly by normal forces than by bending. The dimensions bfb and boxtsb
are deduced from reference projects, see Figure 18 [6].
B.3.3 Concrete cover The concrete cover for this box girder made of C50/60 is:
mmccc devnom 40min
Where: Minimum cover
mmmmcccccc adddurstdurdurdurb 35}10;;max{ ,,,min,min,min
bcmin, Minimum cover due to bond requirement
Minimum cover = diameter of bar = 16 mm.
durcmin, Minimum cover due to environmental conditions
It is assumed that exposure class XF1 and XF3 can be classified as exposure class XD1 for the determination of the concrete cover. With the recommended structural class S4, exposure class XD1, a design working life of 100 years, strength class C50 and an ensured special quality control of the concrete production table 4.3N and
4.4N [11] give that mmc dur 35min, .
,durc Additive safety element
Recommended value is 0 mm.

Appendices
128 The elevated metro structure in concrete, UHPC and composite
stdurc , Reduction for use of stainless steel
Recommended value is 0 mm.
adddurc , Reduction for use of additional protection
Recommended value is 0 mm. Allowance in design for deviation
mmcdev 5
(Precast element)
B.3.4 Effective width of flanges
The effective width of the flanges is based on the distance 0l between points of zero moment, see
Figure 71. However, with a structural schematisation as given in Figure 69 the distance 0l is 45
metres.
Figure 71: Definition of 0l , for calculation of effective flange width
Figure 72: Effective flange width parameters This gives:
ml 450
Cantilever length top flange mLb cant 98.11
Width inner top flange mbbb wboxts 34.22/2
Width bottom flange mbbb wbf 84.12/3
Effective flange width:
bbbb wieffeff ,
Where:
00, 2.01.02.0 llbb iieff
And
iieff bb ,

Appendix B: Calculations concrete box girder C50/60
Design study 129
Effective width of flanges Value
Effective width cantilever length top flange 1,effb 1.98 m
Effective width inner top flange 2,effb 2.34 m
Effective width bottom flange 3,effb 1.84 m
Total effective flange width Value
Effective width top flange teffb , 8.96 m
Effective width bottom flange beffb , 4 m
B.3.5 Cross-sectional properties Cross-sectional area of concrete
bfbfboxwtftfc tbHbtbA ***2*
Distance from bottom to centroidal axis
ctfbfbfbfboxboxwtftftfcb AttbtHHbtHtbZ /))2/(**)2/(***2)2/(**(
Distance from top to centroidal axis
cbct ZHZ
Moment of inertia of concrete section
2,
3,
23
2,
3,
)2/(****12
1
)2/(***2**12
1*2
)2/(****12
1
bfcbbfbeffbfbeff
bfboxcbboxwboxw
tfcttftefftfteffc
tZtbtb
tHZHbHb
tZtbtbI
Section modulus bottom
cbcb ZIW /
Section modulus top
ctct ZIW /
Perimeter concrete box girder
bfbfboxbfboxtscanttftf btHbbLtbu 22 )()2/)((*2*2*2

Appendices
130 The elevated metro structure in concrete, UHPC and composite
Values cross-sectional properties box girder Value
Cross-sectional area of concrete cA 4.16 m2
Distance from bottom to centroidal axis cbZ 1.730 m
Distance from top to centroidal axis ctZ 1.070 m
Second moment of area of the concrete section cI 5.387 m4
Section modulus bottom bW 3.114 m3
Section modulus top tW 5.036 m3
Perimeter concrete box girder u 22.617 m

Appendix B: Calculations concrete box girder C50/60
Design study 131
B.4 Loads
Figure 73: Cross-section top part superstructure
B.4.1 General Acceleration due to gravity g 9.81 m/s2
Dynamic factor [8] )10/(41 L 1.07
Partial factor for permanent actions, favourable [9] favG , 1.0
Partial factor for permanent actions, unfavourable [9] unfavG , 1.35
Partial factor for variable actions, favourable [9] favQ, 0
Partial factor for variable actions, unfavourable [9] unfavQ, 1.5
Partial factor for prestress, favourable favP, 1
Partial factor for prestress, unfavourable unfavP, 1.3
Factor for combination value of snow load [9] snow,0 0.8
Factor for combination value of wind load [9] wind,0 0.75
Factor for combination value of sideward force [9] sidewf,0 0.8
B.4.2 Vertical loads
Dead load box girder gAg ccdead ** 102.02 kN/m
Permanent loads [8]: Concrete plinths 10 kN/m per track Rail (S49) 0.97 kN/m per track
Cables 1.2 kN/m per cable duct
Walkway + guard-rail 2 kN/m per walkway
Sound insulation 1.3 kN/m per walkway

Appendices
132 The elevated metro structure in concrete, UHPC and composite
Concrete slope (drainage between walkways)
0.5 kN/m2
Variable loads [8]:
Mobile load (metros) mobq 25.5 kN/m per track
Snow load snowq 0.5 kN/m2
Concentrated load due to the metro (for local schematisation) locmobQ , 130 kN per track
B.4.3 Horizontal loads
Wind load4 [8] windq 1.5 kN/m2
Sideward force due to the metro5 [8] sidewfQ 30 kN per track
B.4.4 Load schematisation in longitudinal direction Serviceability limit state (SLS) Vertical loads
Dead load box girder deadg 102.02 kN/m
Permanent loads: Concrete plinths (* 2 tracks) 20 kN/m Rail (S49) (* 2 tracks) 1.94 kN/m Cables (* 2 cable ducts) 2.4 kN/m Walkways + guardrails (* 2 walkways) 4 kN/m Sound insulation (* 2 walkways) 2.6 kN/m Concrete slope (drainage between walkways)
(*( tfb - 2 * 1 m)) 3.48 kN/m
Total permanent load permg 34.42 kN/m
Variable loads:
Mobile load (metros) mobq * 2 tracks * 54.71 kN/m
Snow load tfsnowsnow bq **,0 3.58 kN/m
Total variable load varq 58.29 kN/m
Ultimate limit state (ULS) Vertical loads
Dead load box girder deadunfavG g*, 137.73 kN/m
Total permanent load permunfavG g*, 46.47 kN/m
Total variable load var, * qunfavQ 87.44 kN/m
4 The viaduct is subjected to wind forces up to a height of 3.6 metres above the upper side of the rail. 5 The sideward force acts at 1.5 metres above the upper side of the rail, in the centre of the track.

Appendix B: Calculations concrete box girder C50/60
Design study 133
B.4.5 Load schematisation in transversal direction Serviceability limit state (SLS) Vertical loads Permanent loads:
Concrete plinths (/ 2 plinths per track / 0.9 m (width plinth))
5.56 kN/m
Rail (S49) (/ 2 rails per track) 0.485 kN per rail Cables 1.2 kN per cable duct Walkway + guardrail (/ 1 m (width walkway)) 2 kN/m Sound insulation 1.3 kN per walkway Concrete slope (drainage between walkways)
0.5 kN/m
Variable loads:
Concentrated load due to the metro (for local schematisation)
locmobQ , / 2 rails per track *
69.73 kN per rail
Snow load snowsnow q*,0 0.4 kN/m
Horizontal loads
Wind load windwind q*,0 1.125 kN/m2
Sideward force due to the metro sidewfsidewf Q*,0 24 kN per track
Ultimate limit state (ULS) Vertical loads Permanent loads:
Concrete plinths 5.56 * unfavG , 7.5 kN/m
Rail (S49) 0.485 * unfavG , 0.65 kN per rail
Cables 1.2 * unfavG , 1.62 kN per cable duct
Walkway + guardrail 2 * unfavG , 2.7 kN/m
Sound insulation 1.3 * unfavG , 1.76 kN per walkway
Concrete slope (drainage between walkways)
0.5 * unfavG , 0.68 kN/m
Variable loads: Concentrated load due to the metro (for local schematisation)
69.73 * unfavQ , 104.59 kN per rail
Snow load 0.4 * unfavQ, 0.6 kN/m
Horizontal loads
Wind load 1.125 * unfavQ , 1.69 kN/m2
Sideward force due to the metro 24 * unfavQ , 36 kN per track
Appendices
134 The elevated metro structure in concrete, UHPC and composite
B.5 Prestressing tendons
B.5.1 Layout prestressing tendons
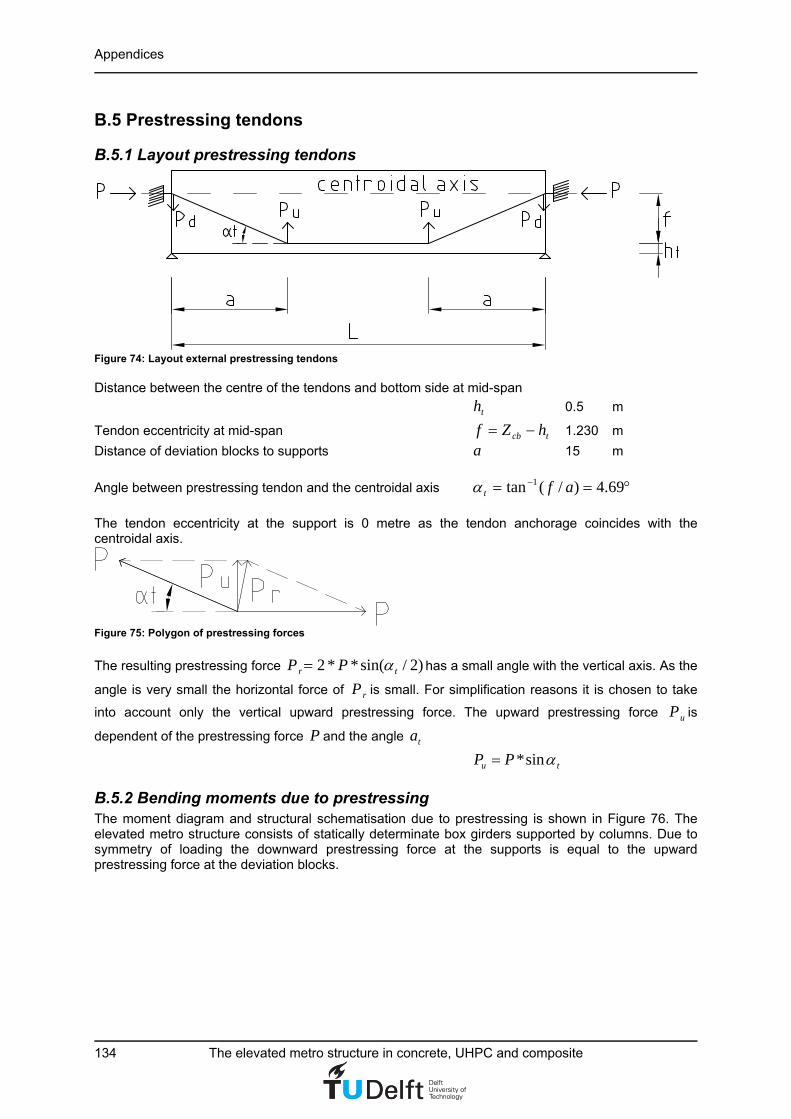
Figure 74: Layout external prestressing tendons Distance between the centre of the tendons and bottom side at mid-span
th 0.5 m
Tendon eccentricity at mid-span tcb hZf 1.230 m
Distance of deviation blocks to supports a 15 m
Angle between prestressing tendon and the centroidal axis 69.4)/(tan 1 aft
The tendon eccentricity at the support is 0 metre as the tendon anchorage coincides with the centroidal axis.
Figure 75: Polygon of prestressing forces
The resulting prestressing force )2/sin(**2 tr PP has a small angle with the vertical axis. As the
angle is very small the horizontal force of rP is small. For simplification reasons it is chosen to take
into account only the vertical upward prestressing force. The upward prestressing force uP is
dependent of the prestressing force P and the angle ta
tu PP sin*
B.5.2 Bending moments due to prestressing The moment diagram and structural schematisation due to prestressing is shown in Figure 76. The elevated metro structure consists of statically determinate box girders supported by columns. Due to symmetry of loading the downward prestressing force at the supports is equal to the upward prestressing force at the deviation blocks.

Appendix B: Calculations concrete box girder C50/60
Design study 135
Figure 76: Structural schematisation of the box girder subjected to prestressing forces Where:
ud PP
kNmM ps 0,
aPaPM udpm **,
The box girder has 6 tendons externally placed inside the girder according the layout shown in Figure 74. One tendon consists of 37 strands with a diameter of 15.7 mm and a cross-sectional area of 150 mm2 per strand. The cross-sectional area of one tendon is:
25550150*37 mmAp
The number of tendons is:
tendonsn 6
The estimated prestressing losses are 20% at t = ∞ The working prestress at t = ∞ then becomes:
20 /1088*8.0 mmNpmpm
Hereunder the prestressing forces and bending moments are calculated for the two phases: the construction phase at t = 0 and the end phase at t = ∞. Construction phase at t = 0 Total prestressing force:
kNAnP pmp 45288** 00
(1) Total upward prestressing force:
kNPP tu 3702sin*00
(2) Bending moment between the two deviation blocks
, 0 0 * 55531 ( )m p uM P a kNm
End phase at t = ∞ The estimated prestressing losses are 20% The working prestress at t = ∞ then becomes:
20 /1088*8.0 mmNpmpm
Total prestressing force:
kNAnP pmp 36230**
(3)

Appendices
136 The elevated metro structure in concrete, UHPC and composite
Total upward prestressing force:
kNPP tu 2962sin* (4)
Bending moment between the two deviation blocks
)(44425*, kNmaPM upm
B.5.3 Bending moments due to loads The bending moments due to the loads are determined according the structural load schematisation shown in Figure 77.
Figure 77: Structural schematisation of the box girder subjected to loads Where:
qLVV ba 2
1
kNmM s 0
2
8
1qLM m
2**5.0*2
1aqaqLM a
Bending moments in the construction phase at t = 0 At deviation blocks
)(22955**5.0***2
1 20, kNmagaLgM deaddeada
At mid-span
)(25825**8
1 20, kNmLgM deadm
Bending moments in the end phase at t = ∞ At deviation blocks
)(43816*)(*5.0**)(*2
1 2varvar, kNmaqggaLqggM permdeadpermdeada
At mid-span
)(49293*)(*8
1 2var, kNmLqggM permdeadm

Appendix B: Calculations concrete box girder C50/60
Design study 137
Bending moments due to the variable load At deviation blocks
)(13116**5.0***2
1 2varvar, kNmaqaLqM va
At mid-span
)(14755**8
1 2var, kNmLqM vm
B.5.4 Stresses due to loading As the railway girder is a prefabricated segmental box girder the joints between the segments cannot resist tensile stresses without opening of the joints. Opening of the joints is however not allowed so
the concrete cannot resist tensile stresses: 2/0 mmNc . Furthermore the concrete stress may not
become too large. In order to rule out the non-linearity of creep the concrete compressive stress
should not exceed 2/5.22*45.0 mmNfckc . Beneath the stresses at the top and bottom
side of the box girder are calculated for different phases. The negative stresses refer to compression and positive stresses to tension. Construction phase at t = 0 At deviation block, top side
20,0,0 /42.4 mmNW
M
W
M
A
P
t
a
t
pm
cct
(5)
OkmmNmmNmmN ct 222 /0/42.4/5.22
At deviation block, bottom side
20,0,0 /35.21 mmNW
M
W
M
A
P
b
a
b
pm
ccb
(6)
OkmmNmmNmmN cb 222 /0/35.21/5.22
At mid-span, top side
20,0,0 /99.4 mmNW
M
W
M
A
P
t
m
t
pm
cct
(7)
OkmmNmmNmmN ct 222 /0/99.4/5.22
At mid-span, bottom side
20,0,0 /43.20 mmNW
M
W
M
A
P
b
m
b
pm
ccb
(8)
OkmmNmmNmmN cb 222 /0/43.20/5.22
End phase at t = ∞ fully loaded At deviation block, top side
2,, /59.8 mmNW
M
W
M
A
P
t
a
t
pm
cct
(9)

Appendices
138 The elevated metro structure in concrete, UHPC and composite
OkmmNmmNmmN ct 222 /0/59.8/5.22
At deviation block, bottom side
2,, /90.8 mmNW
M
W
M
A
P
b
a
b
pm
ccb
(10)
OkmmNmmNmmN cb 222 /0/90.8/5.22
At mid-span, top side
2,, /68.9 mmNW
M
W
M
A
P
t
m
t
pm
cct
(11)
OkmmNmmNmmN ct 222 /0/68.9/5.22
At mid-span, bottom side
2,, /15.7 mmNW
M
W
M
A
P
b
m
b
pm
ccb
(12)
OkmmNmmNmmN cb 222 /0/15.7/5.22
End phase at t = ∞ without variable load At deviation block, top side
2,,, /98.5 mmNW
MM
W
M
A
P
t
vaa
t
pm
cct
(13)
OkmmNmmNmmN ct 222 /0/98.5/5.22
At deviation block, bottom side
2,,, /12.13 mmNW
MM
W
M
A
P
b
vsa
b
pm
ccb
(14)
OkmmNmmNmmN cb 222 /0/12.13/5.22
At mid-span, top side
2,,, /75.6 mmNW
MM
W
M
A
P
t
vmm
t
pm
cct
(15)
OkmmNmmNmmN ct 222 /0/75.6/5.22
At mid-span, bottom side
2,,, /88.11 mmNW
MM
W
M
A
P
b
vmm
b
pm
ccb
(16)
OkmmNmmNmmN cb 222 /0/88.11/5.22

Appendix B: Calculations concrete box girder C50/60
Design study 139
B.5.5 Prestressing losses Losses due to the instantaneous deformation of concrete During tensioning the box girder will shorten. As the tendons are prestressed successively there arises an immediate prestressing loss which can be calculated for each tendon with the following formula:
cm
cppel E
tjEAP
)(***
Where: 25550mmAp Cross-sectional area per prestressing tendon
2/000,200 mmNE p Modulus of elasticity of prestressing steel
2/87.37277 mmNEcm Secant modulus of elasticity of concrete 2
0 /81.1/*)( mmNAAt cppmc Is the variation of stress in the concrete at the centre
of gravity of the tendons applied at time t. 24160000mmAc Cross-sectional area of concrete
20 /1360 mmNpm Maximum initial tensile stress in the tendon
nnj 2/)1( Is a coefficient where n is the number of identical
tendons successively prestressed. This prestressing loss taking into account the order in which the tendons are stressed can be compensated by slightly overstressing the tendons. The maximum overstress is needed in the first prestressed tendon as this tendon has the largest loss due the instantaneous deformation of concrete.
The required overstress overstr in the first prestressed tendon to compensate the losses due to
instantaneous deformation of concrete can be calculated out of the formula below:
)(**
** 01, pmoverstrpcm
overstrppel A
E
jEAP
(17)
Where:
cpoverstroverstrc AAt /*)(, Variation of stress in the concrete
For the first prestressed tendon 6n
4167.012/52/)1( nnj
Now fill in formula (17):
200
00
/07.1364
*
**1
1*
**
*
***)(*
***
mmN
AE
AjE
AE
AjE
AE
AjEA
E
jEA
ccm
pp
pmoverstr
overstr
pm
ccm
pp
pmoverstrccm
poverstrppmoverstrp
cm
overstrpp
The maximum allowed tensile stress of the tendons during tensioning is 2max, /1440 mmNp . The
stress caused by overstressing is far below this value and as also the concrete compressive stress
during tensioning is limited to 2/30*6.0 mmNfckc this small overstressing will not cause any
problems for the structure. It can be concluded that the losses due to the instantaneous deformation of concrete can be compensated by overstressing the tendons. By overstressing the tendons the initial tensile stress in all the tendons after tensioning can be the maximum tensile
stress 20 /1360 mmNpm .

Appendices
140 The elevated metro structure in concrete, UHPC and composite
Losses due to friction The loss due to friction in post-tensioned tendons is:
)1()( )(max
kxePxP
Where: Is the sum of the angular displacement over a distance x (irrespective of
direction or sign). Is the coefficient of friction between the tendon and its duct.
k Is the unintentional angular displacement for internal tendons (per unit length). x Is the distance along the tendon from the point where the prestressing force is
equal to maxP (the force at the active end during tensioning).
Figure 78: Layout prestressing tendons
Figure 79: Angular displacement at a deviation block There are four places where tendon deviation takes place, namely: at the two supports and at the two deviation blocks at a distance a of the supports.
The angular displacement of the tendon per deviation is: rada
ft 08.0
For external tendons, the losses of prestress due to unintentional angles may be ignored [11], so the loss due to friction per deviation is:
kNePxP 11.369)1()( *max
Where
kNAnPP pmp 45288** 00max
1.0 See table 5.1 [11] (external unbonded tendons; HDPE duct / lubricated;
strand)

Appendix B: Calculations concrete box girder C50/60
Design study 141
Time dependent losses of prestress for post-tensioning The time dependent loss of prestress for post-tensioning at a location x is calculated according the formula below:
)],(8.01)[1(*
1
*),(8.0
02
,0
,
ttzI
A
A
An
E
E
tE
EE
AAP
cpc
c
c
p
cm
p
QPccm
pprpcs
prscpprsc
Where: Creep
2.1),( 0 t Is the final creep coefficient according Figure 3.1b [11]
(outside conditions; C50/60; Class R; 280 t days;
mmuAh c 368/*20 )
Shrinkage
0.0001651‰1651.0 cacdcs Is the estimated shrinkage strain in absolute value
Where
‰165.0**),()( 0, cdhsdscd kt Is the drying shrinkage strain
‰22.00, cd Is the nominal unrestrained drying shrinkage value
according Table 3.2 [11] (Relative humidity 80%; C50/60)
3004.0)(
)(),(
htt
tttt
s
ssds
With 0.1),( sds tt
75.0hk Is a coefficient depending on the notional size 0h
according to Table 3.3 [11]
( ) ( )* ( ) 0.0001‰ca as ca Is the autogenous shrinkage
)2.0exp(1)( 5.0ttas With 0.1)( ast
‰0001.010*)10(5.2)( 6 ckca f
Relaxation Relaxation class 2 (wire or strand):
25)1(75.0
1.91000 /93.6010*
1000**66.0* mmN
tepipr
Where:
20 /1360 mmNpmpi
Relaxation class 2 %5.21000
73.0/ pkpi f
2/1860 mmNf pk
The long term (final) values of the relaxation losses may be estimated for a time equal to: hourst 000,500 .

Appendices
142 The elevated metro structure in concrete, UHPC and composite
Concrete stress
QPc, Is the stress in the concrete adjacent to the tendons, due to self-weight and initial
prestress and other quasi-permanent actions where relevant. The value of QPc, may
be the effect of part of self-weight and initial prestress or the effect of a full quasi-
permanent combination of action )( 20 QPG mcc , depending on the stage
of construction considered.
This means that QPc, is the stress at the centroidal axis at t=0.
This gives:
20, /89.10 mmN
A
P
cQPc
Where:
kNAnP pmp 45288** 00
Other values
24160000mmAc Cross-sectional area of concrete 25550mmAp Cross-sectional area per prestressing tendon
6n Number of tendons 2/37278 mmNEcm Secant modulus of elasticity of concrete
2/000,200 mmNEp Modulus of elasticity of prestressing steel
41210*387.5 mmIc Moment of inertia of concrete section
Time dependent loss of prestress for post-tensioning at support
kN
ttzI
A
A
An
E
E
tE
EE
nAnAP
scpsc
c
c
p
cm
p
QPccm
pprpcs
prscppsrsc 4664
)],(8.01)[1(*
1
*),(8.0
02
,,
,0
,,
Where:
mmz scp 0, The tendon eccentricity at the support is 0 m as the tendons
anchorage coincides with the centroidal axis. Time dependent loss of prestress for post-tensioning at mid-span
kN
ttzI
A
A
An
E
E
tE
EE
nAnAP
mcpmc
c
c
p
cm
p
QPccm
pprpcs
prscppmrsc 4276
)],(8.01)[1(*
1
*),(8.0
02
,,
,0
,,
Where:
, 1230cp mz f mm
Appendix B: Calculations concrete box girder C50/60
Design study 143
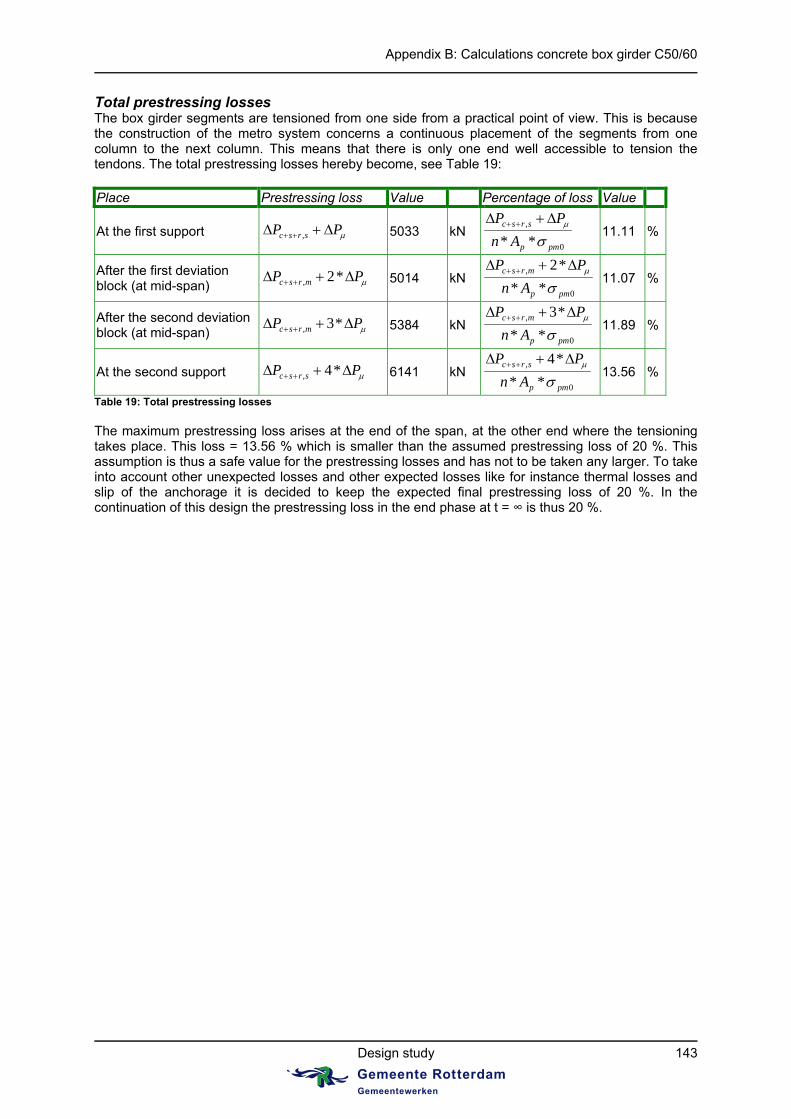
Total prestressing losses The box girder segments are tensioned from one side from a practical point of view. This is because the construction of the metro system concerns a continuous placement of the segments from one column to the next column. This means that there is only one end well accessible to tension the tendons. The total prestressing losses hereby become, see Table 19: Place Prestressing loss Value Percentage of loss Value
At the first support PP srsc , 5033 kN 0
,
** pmp
srsc
An
PP
11.11 %
After the first deviation block (at mid-span) PP mrsc *2, 5014 kN
0
,
**
*2
pmp
mrsc
An
PP
11.07 %
After the second deviation block (at mid-span) PP mrsc *3, 5384 kN
0
,
**
*3
pmp
mrsc
An
PP
11.89 %
At the second support PP srsc *4, 6141 kN 0
,
**
*4
pmp
srsc
An
PP
13.56 %
Table 19: Total prestressing losses The maximum prestressing loss arises at the end of the span, at the other end where the tensioning takes place. This loss = 13.56 % which is smaller than the assumed prestressing loss of 20 %. This assumption is thus a safe value for the prestressing losses and has not to be taken any larger. To take into account other unexpected losses and other expected losses like for instance thermal losses and slip of the anchorage it is decided to keep the expected final prestressing loss of 20 %. In the continuation of this design the prestressing loss in the end phase at t = ∞ is thus 20 %.

Appendices
144 The elevated metro structure in concrete, UHPC and composite
B.6 Deflection The bending moments due to the loads are determined according the structural load schematisation
shown in Figure 80. This schematisation means a deflection at mid-span of: EI
qLw
4
384
5
Figure 80: Structural schematisation of the box girder subjected to loads The moment diagram and structural schematisation due to prestressing is given in Figure 81. The exact upward deflection of this schematisation is more difficult to determine. Therefore it is chosen to re-schematise the schematisation into a more easy and conservative schematisation to calculate the deflection. It can be seen that the moment diagram due to prestressing looks like the one due to the loads but then upside-down and angular. It is therefore chosen to change the structural schematisation of the box girder subjected to prestressing forces into a schematisation with a uniform distributed load like in Figure 80, but then with an upward uniform distributed load.
Figure 81: Structural schematisation of the box girder subjected to prestressing forces For the new schematisation the corresponding uniform distributed load has to be determined: At t=0: The bending moment generated by prestressing at mid-span:
kNmaPM upm 55531*00,
The bending moment due to a uniform distributed load at mid-span:
2**8
1LqM m
For the new schematisation those two moments have to be the same value:
mkNqMM ptmpm /21900,
Appendix B: Calculations concrete box girder C50/60
Design study 145
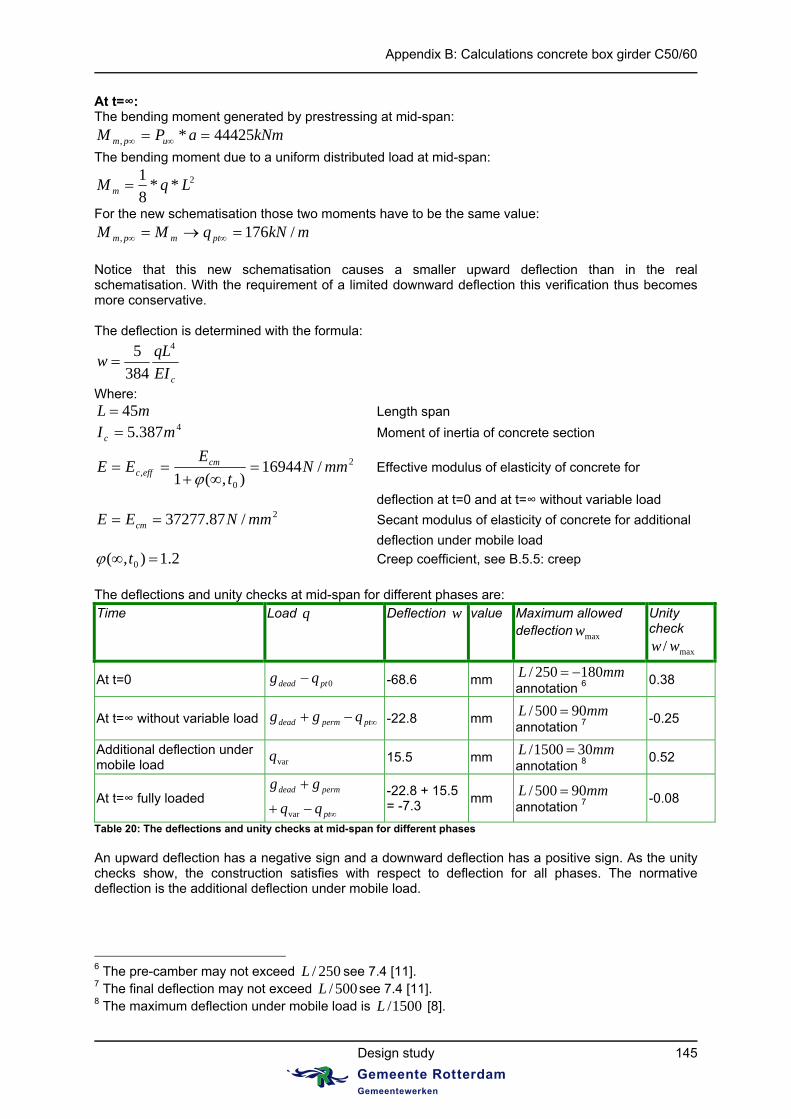
At t=∞: The bending moment generated by prestressing at mid-span:
kNmaPM upm 44425*,
The bending moment due to a uniform distributed load at mid-span:
2**8
1LqM m
For the new schematisation those two moments have to be the same value:
mkNqMM ptmpm /176,
Notice that this new schematisation causes a smaller upward deflection than in the real schematisation. With the requirement of a limited downward deflection this verification thus becomes more conservative. The deflection is determined with the formula:
cEI
qLw
4
384
5
Where: mL 45 Length span
4387.5 mIc Moment of inertia of concrete section
2
0, /16944
),(1mmN
t
EEE cm
effc
Effective modulus of elasticity of concrete for
deflection at t=0 and at t=∞ without variable load 2/87.37277 mmNEE cm Secant modulus of elasticity of concrete for additional
deflection under mobile load
2.1),( 0 t Creep coefficient, see B.5.5: creep
The deflections and unity checks at mid-span for different phases are: Time Load q Deflection w value
Maximum allowed deflection maxw
Unity check
max/ ww
At t=0 0ptdead qg -68.6 mm mmL 180250/ annotation 6
0.38
At t=∞ without variable load ptpermdead qgg -22.8 mm mmL 90500/ annotation 7
-0.25
Additional deflection under mobile load varq 15.5 mm mmL 301500/
annotation 8 0.52
At t=∞ fully loaded
pt
permdead
gg
var
-22.8 + 15.5 = -7.3
mm mmL 90500/ annotation 7
-0.08
Table 20: The deflections and unity checks at mid-span for different phases An upward deflection has a negative sign and a downward deflection has a positive sign. As the unity checks show, the construction satisfies with respect to deflection for all phases. The normative deflection is the additional deflection under mobile load.
6 The pre-camber may not exceed 250/L see 7.4 [11]. 7 The final deflection may not exceed 500/L see 7.4 [11]. 8 The maximum deflection under mobile load is 1500/L [8].

Appendices
146 The elevated metro structure in concrete, UHPC and composite
B.7 Shear + torsion
B.7.1 Shear + torsion in webs General The webs have to resist the vertical shear and torsion. As it concerns a segmental box girder the joints between the segments consists of shear keys, see Figure 82 and Figure 83.
Figure 82: Shear keys in the flanges and in the webs
Figure 83: Section A-A’
Each web has 15 shear keys with a height sH of 150 mm per shear key, see Figure 84. The shear
force is taken by compression in the sloped part of the shear key, see Figure 85. Friction of the remaining parts of the shear keys and flanges is not taken into account.

Appendix B: Calculations concrete box girder C50/60
Design study 147
Figure 84: Dimensions shear key in mm
Figure 85: Schematisation of the shear resistance in a
shear key by compression in the sloped part shearL
Figure 86: Angle of the webs with the vertical axis The shear strength of the webs: The vertical shear strength of one web is:
kNntLfV swwsshearcdRd 2292**cos*cos**1,
Where:
2/33.28 mmNfcd Design value of concrete compressive
strength
mmLshear 433525 22 Sloped part of a shear key under compression
5.35)35/25(tan 1s Angle between shear key and beam axis
1.11
2/)(tan 1
bfbox
bfboxtsw tH
bb Angle of webs with vertical axis
mmbt www 157cos* Is the thickness of the web, see Figure 70
15/ sboxs HHn Is the number of shear keys per web
mmH s 150 Height shear key, see Figure 84

Appendices
148 The elevated metro structure in concrete, UHPC and composite
The vertical shear strength of two webs is:
kNVV RdRd 4584*2 1,2,
Shear resistance at t=0 in the webs Shear forces The shear diagram at t=0 is shown in Figure 87.
Figure 87: Shear force diagram at t=0 With:
mL 45
ma 15
mkNgq deadfavG /02.102*,
kNPP uunfavPu 4813* 0,
kNPu 37020 See Eq. (2)
This gives the following shear forces
, 0 *( / 2 ) 765Ed drV q L a kN
, 0 , 0 4047Ed dl Ed dr uV V P kN
, 0 , 0 * 2517Ed s Ed dlV V q a kN
The maximum shear force is (absolute value):
, 0 4047Ed dlV kN
(18)
Unity check The unity check for shear in the webs at t=0 is:
, 0 ,2/ 0.88 1.0Ed dl RdV V Ok
Shear and torsion resistance at t=∞ in the webs Shear forces The shear diagram at t=∞ is shown in Figure 88
Appendix B: Calculations concrete box girder C50/60
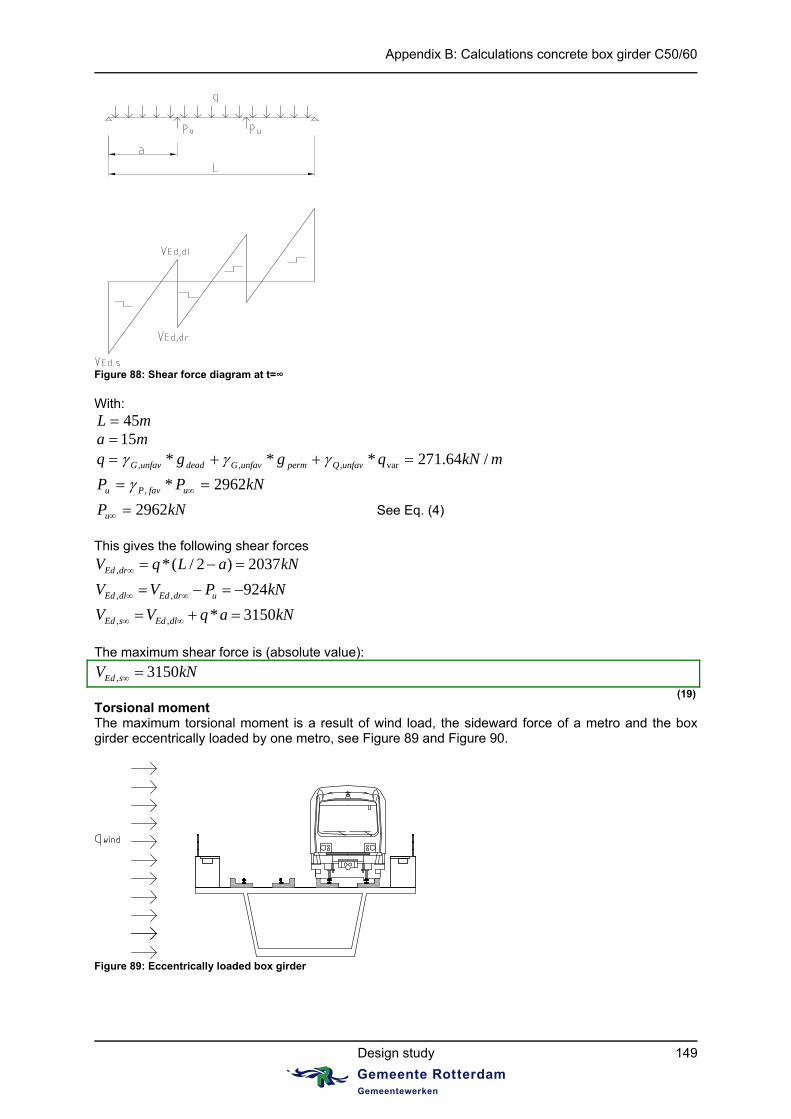
Design study 149
Figure 88: Shear force diagram at t=∞ With:
mL 45 ma 15
mkNqggq unfavQpermunfavGdeadunfavG /64.271*** var,,,
kNPP ufavPu 2962*,
kNPu 2962 See Eq. (4)
This gives the following shear forces
, *( / 2 ) 2037Ed drV q L a kN
, , 924Ed dl Ed dr uV V P kN
, , * 3150Ed s Ed dlV V q a kN
The maximum shear force is (absolute value):
, 3150Ed sV kN
(19) Torsional moment The maximum torsional moment is a result of wind load, the sideward force of a metro and the box girder eccentrically loaded by one metro, see Figure 89 and Figure 90.
Figure 89: Eccentrically loaded box girder

Appendices
150 The elevated metro structure in concrete, UHPC and composite
Figure 90: Load schematisation for maximum torsional moment The maximum torsional moment is:
kNmzQZHHQ
ZZZHHZZHHLqT
metrometroctusrsidewsidew
cbcbctusrwindcbctusrwindwindEd
2133*)(*
))2/)(((*)(*2/*
(20) Where:
2/69.1 mkNqwind See B.4.5 ULS
kNQsidew 36 See B.4.5 ULS
kNLqQ mobunfavQmetro 9232/***, See B.4.1 and B.4.2, divided by 2 as half the torsion
goes to the support of one span
mH wind 6.3 See B.4.3
mHsidew 5.1 See B.4.3
mHusr 35.0 Height upper side rail, see Figure 73
mzmetro 74.1 See Figure 73
mZct 07.1
mZcb 73.1
The lever arm of the webs is:
mbbbz wbfboxtswebs 34.42/)( See Figure 70
The extra shear force in the webs due to torsion is:
/ 491Ed w ed websV T z kN
(21) Unity checks The unity check for shear in the webs at t=∞ is:
, ,2/ 0.69 1.0Ed s RdV V Ok
The unity check for shear + torsion in the webs at t=∞ is:
, ,2 ,1/ / 0.90 1.0Ed s Rd ed w RdV V V V Ok
The webs satisfy with respect to shear and torsion. The shear and torsion resistance is more than what is required and friction of the remaining parts of the shear keys and flanges is not even taken

Appendix B: Calculations concrete box girder C50/60
Design study 151
along. When this verification is not satisfied, the depth of the webs boxH should be increased to place
more shear keys in the webs. Also increasing the web thickness is an option. For this design this is however not necessary as the verification is satisfied.
B.7.2 Shear + torsion in flanges General The flanges have to resist the horizontal shear and torsion. As it concerns a segmental box girder the joints between the segments consists of shear keys see, Figure 91 and Figure 92.
Figure 91: Shear keys in the flanges and in the webs
Figure 92: Section B-B’ The top flange has 5 shear keys and the bottom flange has 4 shear keys with a thickness which is the same as the flange thickness, see Figure 91. The shear force is taken by compression in the sloped part of the shear key, see Figure 94. Friction of the remaining parts of the shear keys and flanges and webs is not taken into account.
Figure 93: Dimensions shear key in mm

Appendices
152 The elevated metro structure in concrete, UHPC and composite
Figure 94: Schematisation of the shear resistance in a shear key by compression in the sloped part shearL
The shear strength of the flanges: The horizontal shear strength of the top flange is:
, ,* *cos * * 1240Rd tf cd shear s tf s tfV f L t n kN
The horizontal shear strength of the bottom flange is:
, ,* *cos * * 1190Rd bf cd shear s bf s bfV f L t n kN
Where:
2/33.28 mmNfcd Design value of concrete compressive
strength
mmLshear 433525 22 Sloped part of a shear key under compression
5.35)35/25(tan 1s Angle between shear key and beam axis
0.25tft m Is the thickness of the top flange
0.3bft m Is the thickness of the bottom flange
, 5s tfn Is the number of shear keys in the top flange
, 4s bfn Is the number of shear keys in the bottom
flange

Appendix B: Calculations concrete box girder C50/60
Design study 153
Shear resistance at t=∞ in the flanges Shear forces in the flanges
Figure 95: Load schematisation for maximum torsional moment The shear force in the top flange is:
, * / 2*( / 2) 239Ed tf wind wind usr sidewV q L H H H Q kN
The shear force in the bottom flange is:
, * / 2* / 2 53Ed bf windV q L H kN
Where:
2/69.1 mkNqwind See B.4.5 ULS
kNQsidew 36 See B.4.5 ULS
mH wind 6.3 See B.4.3
mHsidew 5.1 See B.4.3
mHusr 35.0 See Figure 73
Torsional moment The maximum torsional moment is a result of wind load, the sideward force of a metro and the box girder eccentrically loaded by one metro, see Figure 95. The lever arm of the flanges is:
/ 2 / 2 2.53f tf bfz H t t m See Figure 70
The extra shear force in the flanges due to torsion is:
/ 845Ed f ed fV T z kN
Where:
2133EdT kNm See Eq. (20)

Appendices
154 The elevated metro structure in concrete, UHPC and composite
Unity checks Top flange The unity check for shear in the top flange at t=∞ is:
, ,/ 0.19 1.0Ed tf Rd tfV V Ok
The unity check for shear + torsion in the top flange at t=∞ is:
, , ,/ / 0,87 1.0Ed tf Rd tf Ed f Rd tfV V V V Ok
Bottom flange The unity check for shear in the bottom flange at t=∞ is:
, ,/ 0.04 1.0Ed bf Rd bfV V Ok
The unity check for shear + torsion in the bottom flange at t=∞ is:
, , ,/ / 0,75 1.0Ed bf Rd bf Ed f Rd bfV V V V Ok
The flanges satisfy with respect to shear and torsion. The shear and torsion resistance is not much more than what is required. Friction of the remaining parts of the shear keys and flanges is however not even taken along. When this verification is not satisfied, more shear keys should be placed in the flanges. As the flanges offer enough space for additional shear keys this verification will never be normative for the design and will easily satisfy.

Appendix B: Calculations concrete box girder C50/60
Design study 155
B.8 Ultimate resistance moment
B.8.1 General
In all phases during the lifetime of the box girder the concrete force cN due to the compressive
stresses in the concrete should balance the prestressing force P , see Figure 96.
Figure 96: Equilibrium between axial forces P and cN in the cross-section of the box girder
Figure 97: Overview for the calculation of the ultimate resistance moment
At the same time the bending moment dM due to loading should be resisted by the ultimate
resistance moment uM of the box girder. The ultimate resistance moment arises when the strain
difference between the top and bottom flange is as large as possible taking into account that tensile
stresses are not allowed. This means that 2min /0 mmNc . In which flange the maximum strain
arises depends on the stage of loading. For the example given above it would mean that:
The concrete force cbfcwctfc NNNN and should be equal to P , see Figure 97.
The ultimate resistance moment * * *u ctf tf cw w cbf bfM N z N z N z and should be larger than the
bending moment dM . Where ,tf w bfz z and z are positive or negative values considering the location of
the force with regard to the centroidal axis.

Appendices
156 The elevated metro structure in concrete, UHPC and composite
For this calculation there is made use of the Bi-linear stress-strain relation, see Figure 98.
Figure 98: Bi-linear stress-strain relation Where:
‰75.13 c Is the maximum elastic compressive strain in the concrete
‰5.33 cu Is the ultimate compressive strain in the concrete
B.8.2 Bending moments due to the loads and prestressing
Bending moment dM at t=0
In the construction phase at t=0 the loads on the box girder are the dead load and the prestressing force. As the permanent and variable loads are missing and the initial prestressing force is large the box girder has a camber. The normative hogging moment in this phase arises at the deviation blocks, see Figure 99. The maximum strain arises in the bottom flange.
Figure 99: The bending moments due to prestressing minus the bending moments due to dead load results in the largest bending moment Ma at the deviation blocks
At deviation blocks
)(49235***5.0****2
1** 2
,,0,0, kNmagaLgaPM deadfavGdeadfavGuunfavPda
Where:
kNPu 37020 See Eq. (2)
Bending moment dM at t=∞
In the end phase at t=∞ the box girder is fully loaded by the dead, permanent and variable load and is partly resisted by the prestressing force. This load case causes a downward deflection, which means that the normative sagging moment arises at mid-span, see Figure 100. The maximum strain arises in the top flange.

Appendix B: Calculations concrete box girder C50/60
Design study 157
Figure 100: The bending moments due to dead, permanent and variable load minus the bending moments due to prestressing results in the largest bending moment Mm at mid-span At mid-span
)(24334
***)***(*8
1,
2var,,,,
kNm
aPLqggM ufavPunfavQpermunfavGdeadunfavGdm
Where:
kNPu 2962 See Eq. (4)
B.8.3 Ultimate resistance moment at t=0 Ultimate resistance moment at deviation blocks The prestressing force at t=0 is:
kNP 452880 See Eq. (1)
)(492350, kNmM da means that the maximum compressive strain arises in the bottom flange.
The schematisation of the forces in the cross-section is shown in Figure 101 and Figure 102.
Figure 101: Stress and strain schematisation in the cross-section at the deviation blocks at t=0
Figure 102: Concrete forces and lever arms in the cross-section at the deviation blocks at t=0
To determine the maximum strain for which holds that 0PNc everything is filled in a spreadsheet
program (Microsoft Excel) and solved with the function goal seek. With the function goal seek the
concrete force cN is set to be equal to the prestressing force 0P by changing the maximum
compressive strain in the cross-section maxc .

Appendices
158 The elevated metro structure in concrete, UHPC and composite
The maximum strain in the cross-section which causes equilibrium between cN and 0P is:
‰760.1max c
This gives:
max * / 0.157‰ctf c tft H
max *( ) / 1.572‰cbf c bfH t H
2min /0 mmNc
3 3 max/ * 0.016c c cz H H m
min,
3
(( ) / 2)* * * 2849ctf c
ctf cd eff t tfc
N f b t kN
3
(( ) / 2)* *2 * 10077ctf cbf
cw cd w boxc
N f b H kN
, 3 , 33
* * ( * ) / 2* *( ) 32362cbfcbf cd eff b c cd cd eff b bf c
c
N f b z f f b t z kN
Where:
mb teff 96.8, See B.3.4
mb beff 4, See B.3.4
The total concrete compressive force is:
045288 PkNNNNN cbfcwctfc
The lever arms of the concrete forces are:
2* 0.90
3tf tf ctz t Z m
1 1*( * ) *( * ) / 0.61
2 2 3 2cbf ctf cbf ctf
w cb ctf box bf box bf ctfz Z H t H t m
3 3 3 3 33
3 3 33
3 3 33 3
1* * / 2 ( * ) / 2*( )*(( )* )
3
* *( )*(( ) / 2 )
1.58
* ( * ) / 2*( ) * *( )
cbfcd c c cd cd bf c bf c c
c
cbfcd bf c bf c c
cbf cb
cbf cbfcd c cd cd bf c cd bf c
c c
f z z f f t z t z z
f t z t z z
z Z m
f z f f t z f t z
The ultimate resistance moment is:
* * * 54826u ctf tf cw w cbf bfM N z N z N z kNm
Unity check of the ultimate resistance moment:
,0 / 0.90 1.0da uM M Ok
The ultimate resistance moment of the box girder is thus large enough to resist the bending moments in the construction phase at t=0. The unity check however approaches the limit 1.0, so this verification

Appendix B: Calculations concrete box girder C50/60
Design study 159
needs attention. When this verification is not satisfied the depth of the webs boxH should be
decreased, see Figure 70. This way the upward prestressing force becomes smaller, see Figure 74, and thus the hogging moment due to prestressing decreases. Another option is to make the box girder
heavier such that the hogging moment dM becomes smaller.
B.8.4 Ultimate resistance moment at t=∞ Ultimate resistance moment at mid-span The prestressing force at t=∞ is:
36230P kN See Eq. (3)
, 24334 ( )dmM kNm means that the maximum compressive strain arises in the top flange.
The schematisation of the forces in the cross-section is shown in Figure 103 and Figure 104.
Figure 103: Stress and strain schematisation in the cross-section at mid-span at=∞
Figure 104: Concrete forces and lever arms in the cross-section at mid-span at=∞
To determine the maximum strain for which holds that cN P everything is filled in a spreadsheet
program (Microsoft Excel) and solved with the function goal seek. With the function goal seek the
concrete force cN is set to be equal to the prestressing force P by changing the maximum
compressive strain in the cross-section maxc .
The maximum strain in the cross-section which causes equilibrium between cN and P is:
max 0.870‰c
This gives:
max *( ) / 0.793‰ctf c tfH t H
max * / 0.093‰cbf c bft H
2min /0 mmNc
max,
3
(( ) / 2)* * * 30160c ctf
ctf cd eff t tfc
N f b t kN

Appendices
160 The elevated metro structure in concrete, UHPC and composite
3
(( ) / 2)* *2 * 5164ctf cbf
cw cd w boxc
N f b H kN
min,
3
(( ) / 2)* * * 906cbf c
cbf cd eff b bfc
N f b t kN
Where:
, 8.96eff tb m See B.3.4
mb beff 4, See B.3.4
The total concrete compressive force is:
36230c ctf cw cbfN N N N kN P
The lever arms of the concrete forces are:
max max1 1* * * * / 0.95
2 3 2 2c ctf c ctf
tf ct tf ctf tf ctfz Z t t m
2 1*( * ) *( * ) / 0.01
2 3 2 2ctf cbf ctf cbf
w box bf cbf box bf cbf cbz H t H t Z m
2* 1.53
3bf bf cbz t Z m
The ultimate resistance moment is:
* * * 27117u ctf tf cw w cbf bfM N z N z N z kNm
Unity check of the ultimate resistance moment:
, / 0.90 1.0dm uM M Ok
The ultimate resistance moment of the box girder is thus enough to resist the bending moments in the end phase at t=∞. The unity check however approaches the limit 1.0, so this verification needs
attention. When this verification is not satisfied the depth of the webs boxH should be increased, see
Figure 70. This way the lever arms z become larger which has a positive effect on the ultimate resistance moment. Also the upward prestressing force then becomes larger, see Figure 74. The
bending moment dM should be kept as small as possible by creating a light as possible box girder.

Appendix B: Calculations concrete box girder C50/60
Design study 161
B.9 Deck To determine if the thickness of the top flange / deck meet the requirements of shear and bending moments, the local schematisation is considered. The deck is schematised in the transversal direction as a floor of 1 metre wide with two fixed supports (the webs). The width of 1 metre in longitudinal direction comes from [8], which says that for the calculation of the deck the wheel pressure in longitudinal direction of the track may be spread to two sides over a distance of 1 metre + twice the height of the concrete plinth. For a more conservative calculation only the width of 1 metre is taken. To calculate the shear and bending moments in the deck there is made use of the program Scia Engineer. In the next section the input in Scia Engineer is given. For the geometry of the deck the assumption was made that the web width should be 0.2 metres. With this width the geometry in Figure 105 becomes:
mbLL wcantcentrecant 08.22/,
mLbL centrecanttfspan 8.4*2 ,
For the load schematisation in the next section reference is made to Section B.4.5. With the shear and bending moments due to loading as result from the input in Scia Engineer next the verification of shear and ultimate resistance moment for the deck is done.
B.9.1 Schematisation load input in Scia Engineer
Geometry deck
Figure 105: Structural schematisation deck box girder
Figure 106: Nodes left side of the deck

Appendices
162 The elevated metro structure in concrete, UHPC and composite
Figure 107: Nodes right side of the deck
Figure 108: Bars Nodes Name Coordinate X
[m] Coordinate Z [m]
K1 0,000 6,000 K2 1,000 6,000 K3 1,440 6,000 K4 1,986 6,000 K5 2,340 6,000 K6 2,740 6,000 K7 3,140 6,000 K8 3,494 6,000 K9 4,040 6,000 K10 4,920 6,000 K11 5,466 6,000 K12 5,820 6,000 K13 6,220 6,000 K14 6,620 6,000 K15 6,974 6,000 K16 7,520 6,000 K17 7,960 6,000 K18 8,960 6,000 K19 2,080 6,000 K20 6,880 6,000 1D-bar Name Cross-section Length
[m] Form
Start node End node Type EEM-type
Layer
S1 CS1 - Rectangle (250; 1000)
1,000 Line K1 K2 floor strip (99) standard Layer1
S2 CS1 - Rectangle (250; 1000)
0,440 Line K2 K3 floor strip (99) standard Layer1

Appendix B: Calculations concrete box girder C50/60
Design study 163
S3 CS1 - Rectangle (250; 1000)
0,546 Line K3 K4 floor strip (99) standard Layer1
S4 CS1 - Rectangle (250; 1000)
0,354 Line K4 K5 floor strip (99) standard Layer1
S5 CS1 - Rectangle (250; 1000)
0,400 Line K5 K6 floor strip (99) standard Layer1
S6 CS1 - Rectangle (250; 1000)
0,400 Line K6 K7 floor strip (99) standard Layer1
S7 CS1 - Rectangle (250; 1000)
0,354 Line K7 K8 floor strip (99) standard Layer1
S8 CS1 - Rectangle (250; 1000)
0,546 Line K8 K9 floor strip (99) standard Layer1
S9 CS1 - Rectangle (250; 1000)
0,880 Line K9 K10 floor strip (99) standard Layer1
S10 CS1 - Rectangle (250; 1000)
0,546 Line K10 K11 floor strip (99) standard Layer1
S11 CS1 - Rectangle (250; 1000)
0,354 Line K11 K12 floor strip (99) standard Layer1
S12 CS1 - Rectangle (250; 1000)
0,400 Line K12 K13 floor strip (99) standard Layer1
S13 CS1 - Rectangle (250; 1000)
0,400 Line K13 K14 floor strip (99) standard Layer1
S14 CS1 - Rectangle (250; 1000)
0,354 Line K14 K15 floor strip (99) standard Layer1
S15 CS1 - Rectangle (250; 1000)
0,546 Line K15 K16 floor strip (99) standard Layer1
S16 CS1 - Rectangle (250; 1000)
0,440 Line K16 K17 floor strip (99) standard Layer1
S17 CS1 - Rectangle (250; 1000)
1,000 Line K17 K18 floor strip (99) standard Layer1
Node support Name Node System Type X Z Ry Sn1 K19 GCS Standard Fixed Fixed Fixed Sn2 K20 GCS Standard Fixed Fixed Fixed
Load input The values of the loads are taken from section: B.4.5 Load schematisation in transversal direction in the SLS.
Figure 109: Permanent loads left side of the deck
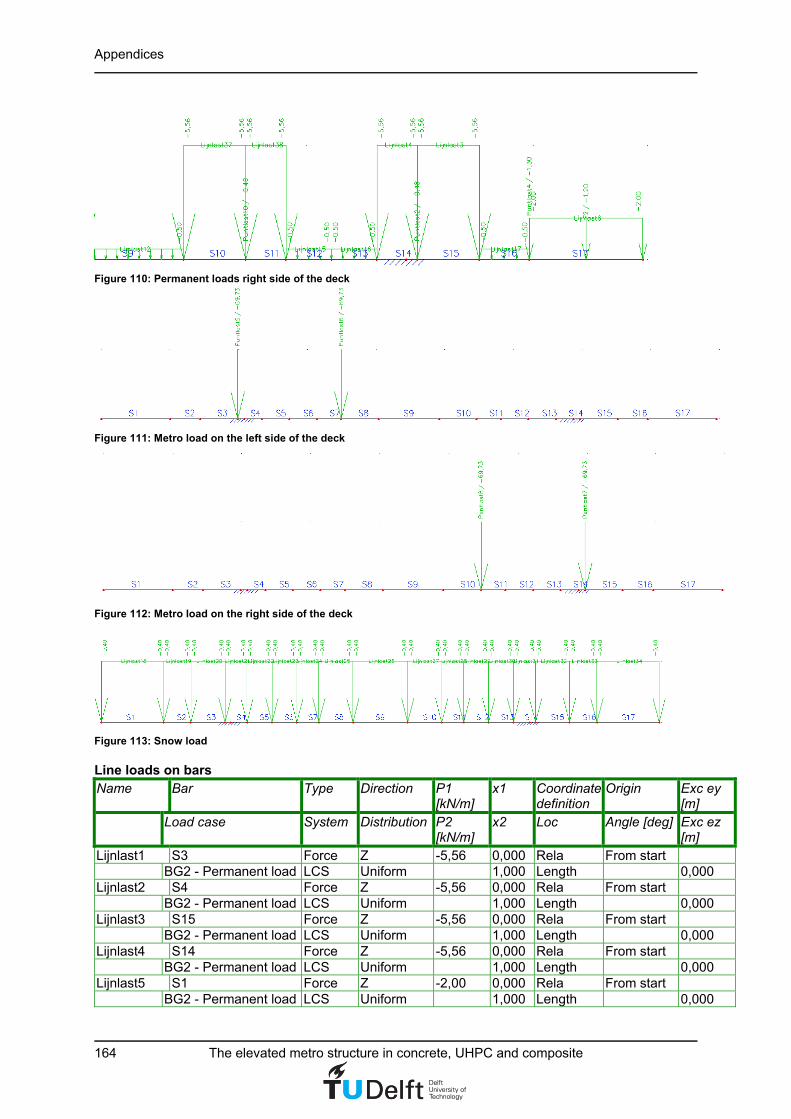
Appendices
164 The elevated metro structure in concrete, UHPC and composite
Figure 110: Permanent loads right side of the deck
Figure 111: Metro load on the left side of the deck
Figure 112: Metro load on the right side of the deck
Figure 113: Snow load Line loads on bars Name Bar Type Direction P1
[kN/m] x1 Coordinate
definition Origin Exc ey
[m] Load case System Distribution P2
[kN/m] x2 Loc Angle [deg] Exc ez
[m] Lijnlast1 S3 Force Z -5,56 0,000 Rela From start BG2 - Permanent load LCS Uniform 1,000 Length 0,000 Lijnlast2 S4 Force Z -5,56 0,000 Rela From start BG2 - Permanent load LCS Uniform 1,000 Length 0,000 Lijnlast3 S15 Force Z -5,56 0,000 Rela From start BG2 - Permanent load LCS Uniform 1,000 Length 0,000 Lijnlast4 S14 Force Z -5,56 0,000 Rela From start BG2 - Permanent load LCS Uniform 1,000 Length 0,000 Lijnlast5 S1 Force Z -2,00 0,000 Rela From start BG2 - Permanent load LCS Uniform 1,000 Length 0,000
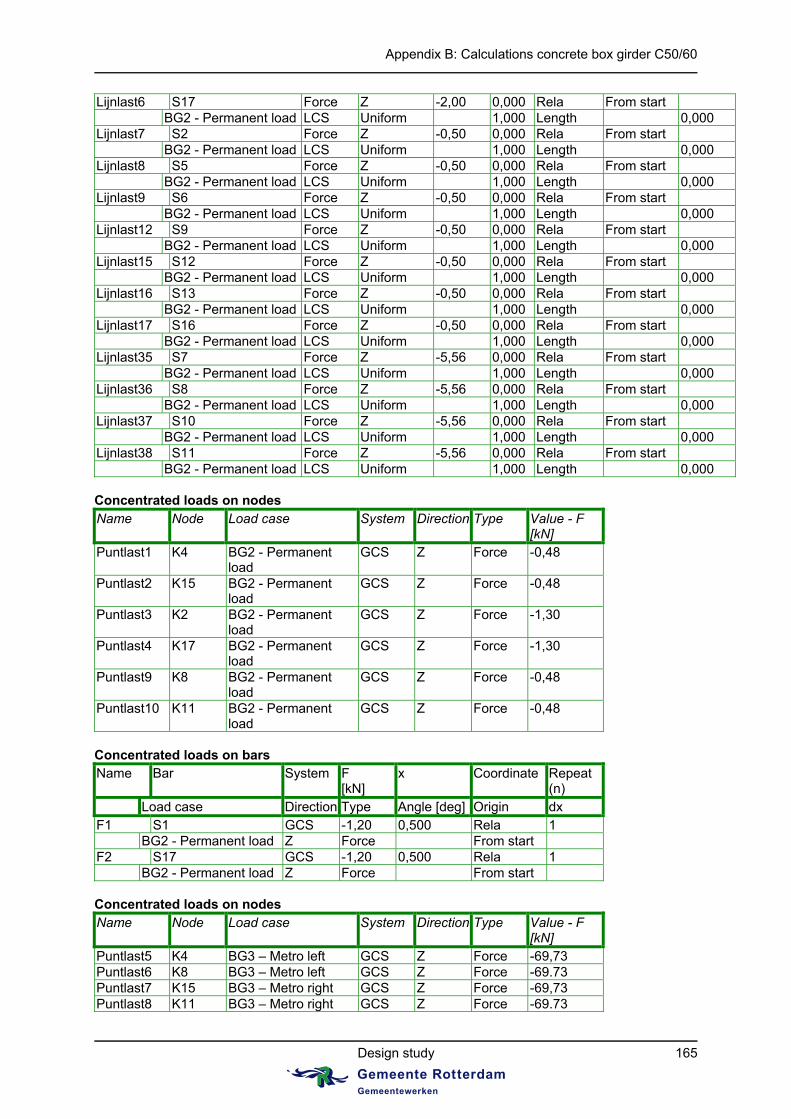
Appendix B: Calculations concrete box girder C50/60
Design study 165
Lijnlast6 S17 Force Z -2,00 0,000 Rela From start BG2 - Permanent load LCS Uniform 1,000 Length 0,000 Lijnlast7 S2 Force Z -0,50 0,000 Rela From start BG2 - Permanent load LCS Uniform 1,000 Length 0,000 Lijnlast8 S5 Force Z -0,50 0,000 Rela From start BG2 - Permanent load LCS Uniform 1,000 Length 0,000 Lijnlast9 S6 Force Z -0,50 0,000 Rela From start BG2 - Permanent load LCS Uniform 1,000 Length 0,000 Lijnlast12 S9 Force Z -0,50 0,000 Rela From start BG2 - Permanent load LCS Uniform 1,000 Length 0,000 Lijnlast15 S12 Force Z -0,50 0,000 Rela From start BG2 - Permanent load LCS Uniform 1,000 Length 0,000 Lijnlast16 S13 Force Z -0,50 0,000 Rela From start BG2 - Permanent load LCS Uniform 1,000 Length 0,000 Lijnlast17 S16 Force Z -0,50 0,000 Rela From start BG2 - Permanent load LCS Uniform 1,000 Length 0,000 Lijnlast35 S7 Force Z -5,56 0,000 Rela From start BG2 - Permanent load LCS Uniform 1,000 Length 0,000 Lijnlast36 S8 Force Z -5,56 0,000 Rela From start BG2 - Permanent load LCS Uniform 1,000 Length 0,000 Lijnlast37 S10 Force Z -5,56 0,000 Rela From start BG2 - Permanent load LCS Uniform 1,000 Length 0,000 Lijnlast38 S11 Force Z -5,56 0,000 Rela From start BG2 - Permanent load LCS Uniform 1,000 Length 0,000 Concentrated loads on nodes Name Node Load case System Direction Type Value - F
[kN] Puntlast1 K4 BG2 - Permanent
load GCS Z Force -0,48
Puntlast2 K15 BG2 - Permanent load
GCS Z Force -0,48
Puntlast3 K2 BG2 - Permanent load
GCS Z Force -1,30
Puntlast4 K17 BG2 - Permanent load
GCS Z Force -1,30
Puntlast9 K8 BG2 - Permanent load
GCS Z Force -0,48
Puntlast10 K11 BG2 - Permanent load
GCS Z Force -0,48
Concentrated loads on bars Name Bar System F
[kN] x Coordinate Repeat
(n) Load case Direction Type Angle [deg] Origin dx F1 S1 GCS -1,20 0,500 Rela 1 BG2 - Permanent load Z Force From start F2 S17 GCS -1,20 0,500 Rela 1 BG2 - Permanent load Z Force From start Concentrated loads on nodes Name Node Load case System Direction Type Value - F
[kN] Puntlast5 K4 BG3 – Metro left GCS Z Force -69,73 Puntlast6 K8 BG3 – Metro left GCS Z Force -69.73 Puntlast7 K15 BG3 – Metro right GCS Z Force -69,73 Puntlast8 K11 BG3 – Metro right GCS Z Force -69.73

Appendices
166 The elevated metro structure in concrete, UHPC and composite
Line loads on bars Name Bar Type Direction P1
[kN/m] x1 Coordinate
definition Origin Exc ey
[m] Load case System Distribution P2
[kN/m] x2 Loc Angle [deg] Exc ez
[m] Lijnlast18 S1 Force Z -0,4 0,000 Rela From start BG5 – Snow load LCS Uniform 1,000 Length 0,000 Lijnlast19 S2 Force Z -0,4 0,000 Rela From start BG5 – Snow load LCS Uniform 1,000 Length 0,000 Lijnlast20 S3 Force Z -0,4 0,000 Rela From start BG5 – Snow load LCS Uniform 1,000 Length 0,000 Lijnlast21 S4 Force Z -0,4 0,000 Rela From start BG5 – Snow load LCS Uniform 1,000 Length 0,000 Lijnlast22 S5 Force Z -0,4 0,000 Rela From start BG5 – Snow load LCS Uniform 1,000 Length 0,000 Lijnlast23 S6 Force Z -0,4 0,000 Rela From start BG5 – Snow load LCS Uniform 1,000 Length 0,000 Lijnlast24 S7 Force Z -0,4 0,000 Rela From start BG5 – Snow load LCS Uniform 1,000 Length 0,000 Lijnlast25 S8 Force Z -0,4 0,000 Rela From start BG5 – Snow load LCS Uniform 1,000 Length 0,000 Lijnlast26 S9 Force Z -0,4 0,000 Rela From start BG5 – Snow load LCS Uniform 1,000 Length 0,000 Lijnlast27 S10 Force Z -0,4 0,000 Rela From start BG5 – Snow load LCS Uniform 1,000 Length 0,000 Lijnlast28 S11 Force Z -0,4 0,000 Rela From start BG5 – Snow load LCS Uniform 1,000 Length 0,000 Lijnlast29 S12 Force Z -0,4 0,000 Rela From start BG5 – Snow load LCS Uniform 1,000 Length 0,000 Lijnlast30 S13 Force Z -0,4 0,000 Rela From start BG5 – Snow load LCS Uniform 1,000 Length 0,000 Lijnlast31 S14 Force Z -0,4 0,000 Rela From start BG5 – Snow load LCS Uniform 1,000 Length 0,000 Lijnlast32 S15 Force Z -0,4 0,000 Rela From start BG5 – Snow load LCS Uniform 1,000 Length 0,000 Lijnlast33 S16 Force Z -0,4 0,000 Rela From start BG5 – Snow load LCS Uniform 1,000 Length 0,000 Lijnlast34 S17 Force Z -0,4 0,000 Rela From start BG5 – Snow load LCS Uniform 1,000 Length 0,000

Appendix B: Calculations concrete box girder C50/60
Design study 167
Results The shear forces and moments in the deck due to the permanent and variable loads in the ULS are shown below. This does not include the dead load of the deck.
Figure 114: Shear forces in the deck due to permanent and variable loads
Figure 115: Moments in the deck due to permanent and variable loads
B.9.2 Verifications of shear and ultimate resistance moment Total shear force and bending moment The maximum shear force due to permanent and variable loads in the ULS is:
, var 117.67Ed permV kN See Figure 114
The extra shear force due to the dead load is:
, , ,* * * * * 17.22Ed dead tf deck cant centre c G unfavV t b L g kN
Where:
1.0deckb m
, 2.08cant centreL m
The total shear force is:
, var , 134.89Ed Ed perm Ed deadV V V kN
The maximum bending moment due to permanent and variable loads in the ULS is:
, var 113.93d permM kNm See Figure 115
The extra bending moment due to the dead load at the webs is:
kNmLgbtM spanunfavGcdecktfdeadd 89.15*)****(12
1 2,,

Appendices
168 The elevated metro structure in concrete, UHPC and composite
Where:
4.8spanL m
The total bending moment is:
, , var 129.82d d dead d permM M M kNm
Shear resistance The minimum shear strength of concrete is:
, 1 min 1( ) 135.8Rd c cp deckV v k b d kN
Where:
inf
1194
2tf nom re stirrupsd t c mm Is the effective structural depth
40nomc mm Is the concrete cover, see B.3.3
inf 16re mm Is the diameter of the longitudinal reinforcement
8stirrups mm Is the diameter of the stirrups
20 /cp N mm No axial force in this direction due to prestressing
3/ 2 1/ 2 2min 0.035* * 0.7 /ckv k f N mm
2001 2.0 2k
d
Unity check:
, 1/ 0.99 1.0Ed Rd cV V Ok
As the unity check shows, the minimum shear strength of concrete is already sufficient. For the ultimate resistance moment the deck however needs longitudinal reinforcement, see Figure 116. The shear strength of concrete with longitudinal reinforcement is:
1/3, 2 , 1[ (100 ) ] 167.59Rd c Rd c l ck cp deckV C k f k b d kN
Where:
, 0.18 / 0.12Rd c cC
0.02 0.009*
sll
deck
A
b d
2 2inf inf
1* *( * ) 1810
2sl re reA n mm Is the area of tensile reinforcement, see Figure 116
inf inf/ 9.09 9 /re deck ren b S bars m Is the number of reinforcement bars
inf 110reS mm Is the spacing of the reinforcement bars
Unity check:
, 2/ 0.80 1.0Ed Rd cV V Ok
With longitudinal reinforcement the deck easily satisfies with respect to local shear.

Appendix B: Calculations concrete box girder C50/60
Design study 169
Figure 116: Definition of slA
Furthermore the shear force in the deck should always satisfy the condition:
cddeckEd fdbV ****5.0
Where:
48.0250
16.0
ckf
Is a strength reduction factor for concrete cracked in shear
Filling in the formula gives:
134.89 0.5* * * * 1319Ed deck cdV kN b d f kN Ok
Ultimate resistance moment The ultimate resistance moment of the deck is calculated according to the schematisation in Figure 117. In this case however the schematisation should be mirrored along the centre line as the tension arises at the top side and the compression zone is at the bottom side of the deck, see Figure 116.
Figure 117: Rectangular stress distribution
The two horizontal forces cF and sF should be in equilibrium:
0 sc FF
This is the same as:
0******5.03
slsscdc
cdeck AEfbx
Where:
tftot
c tx *
Concrete compressive zone
sctot Total strain in the deck

Appendices
170 The elevated metro structure in concrete, UHPC and composite
‰174.2s
yds E
f Tensile strain in the reinforcement
‰75.13 c Compressive strain in the concrete at the end of the linear part 21810mmAsl Area of tensile reinforcement
Solving the formula gives the compressive strain in the concrete:
‰134.10 csc FF
The concrete compressive zone is:
mmtx tftot
c 7.85*
The ultimate resistance moment of the deck is:
kNmxdAEM slssu 16.130)3
1(***
Unity check for the ultimate resistance moment of the deck is:
OkMM ud 0.1997.0/
The ultimate resistance moment of the deck is thus just enough to resist the bending moments. If this
verification is not satisfied the lever arm between the two forces cF and sF should be increased. This
means that the deck becomes thicker. Another option is to add more reinforcement bars. This however has a strong influence on the rotation capacity, see hereunder. Furthermore: The cracking moment is:
2,
1* * * 57.26
6r ctm fl deck tfM f b t kNm
Where: 2
, max{(1.6 /1000) ; } 5.50 /ctm fl ctm ctmf h f f N mm
250tfh t mm
Because r uM M , the deck satisfies with respect to the minimum required percentage of
reinforcement. The cross-sectional area of longitudinal reinforcement is:
2 2inf inf
1* *( * ) 1810
2sl re reA n mm
The maximum allowed cross-sectional area of longitudinal reinforcement is:
2,max 0.04* 0.04* * 10000s c tf deckA A t b mm Ok
The minimum required cross-sectional area of longitudinal reinforcement is:
2,min 0.26* * 411ctm
s deckyk
fA b d mm Ok
f
The height of the compression zone should satisfy: See 5.6.3 [11]
/ 0.44 0.45x d Ok

Appendix B: Calculations concrete box girder C50/60
Design study 171
This verification considers the rotation capacity of the deck at the supports (the webs). It shows that the rotation capacity of the deck is sufficient, but is very close to the limit so attention is needed. If this verification is not satisfied the thickness of the deck should be increased. Another option is to diminish the number of reinforcement bars which will result in a smaller compressive zone x . This will however also reduce the ultimate resistance moment. The maximum deflection under dead load, permanent load and variable load in the SLS is calculated with the program Scia Engineer and is:
mmwz 4.1 See Figure 118
The maximum allowed deflection is:
OkmmLw span 6.9500/max
Figure 118: Deflection of the deck in mm under dead load, permanenet load and variable load.

Appendices
172 The elevated metro structure in concrete, UHPC and composite
B.10 Fatigue + vibration
B.10.1 Fatigue prestressing steel For prestressing steel adequate fatigue resistance should be assumed if the following expression is satisfied:
, ,,
( *)* ( *) Rsk
F fat S equs fat
NN
Where:
, 1.0F fat Is the partial factor for fatigue loads
, 1.15s fat s Is the partial factor for prestressing steel for the fatigue verification
2( *) 150 /Rsk N N mm Is the stress range at N* cycles, see table 6.4N [11]: straight tendons
or curved tendons in plastic ducts
1 5k See Figure 119
2 10k See Figure 119
* 1000000N loading cycles See Figure 119
Figure 119: Shape of the characteristic fatigue strength curve (S-N-curves for prestressing steel) The damage equivalent stress range for prestressing steel is calculated according to Equation NN.106 [12]:
, ( *) * *S equ s sN
Where:
s Is the steel stress range due to the variable load
Is the dynamic factor
,1 ,2 ,3 ,4* * *s s s s s Is a correction factor to calculate the damage equivalent stress range
from the stress range caused by * s
,1s Is a factor accounting for element type (eg. continuous beam) and takes into account
the damaging effect of traffic depending on the length of the influence line or area.
,2s Is a factor taking into account the traffic volume
,3s Is a factor that takes into account the design life of the bridge
,4s Is a factor to be applied when the structural element is loaded by more than one track

Appendix B: Calculations concrete box girder C50/60
Design study 173
,1 0.65s See Table NN.2 [12]: (1) post tensioning straight tendons, s* standard traffic mix and
simply supported beam
2,2 6
0.9625*10
ks
Vol
Where:
2 10k See Figure 119
/ *6*24*365 15848367 / /metroVol Q g tonnes year track Assumption of 6 metros per hour
*116 2958metro mobQ q m kN 116 metres is the length of a metro
2,3 1
100yearsk
s
N
Where:
100yearsN years Is the design life of the viaduct
2 22,4 1 2(1 )* (1 )* 0.81k kk
s n n s n s
Where: 0.12n Is the proportion of traffic that crosses the bridge simultaneously, 0.12
is the suggested value
0js Only compressive stresses occur under traffic loads on a track
,1 ,2 ,3 ,4* * * 0.50s s s s s
The dynamic factor is determined according [8] and not according [10] as this dynamic factor is normative (larger):
1 4 /(10 ) 1.07L
The deflection at mid-span at t=∞ due to the dead load, the permanent load and prestressing is:
1 23w mm Upwards, see Table 20
The deflection at mid-span at t=∞ due to the dead load, the permanent load, the variable load and
prestressing is: 2 7w mm Downwards, see Table 20
It is assumed that the deflection at the deviation blocks is the same as at mid-span (conservative assumption).
Figure 120: Schematisation for determining the elongation of the tendons
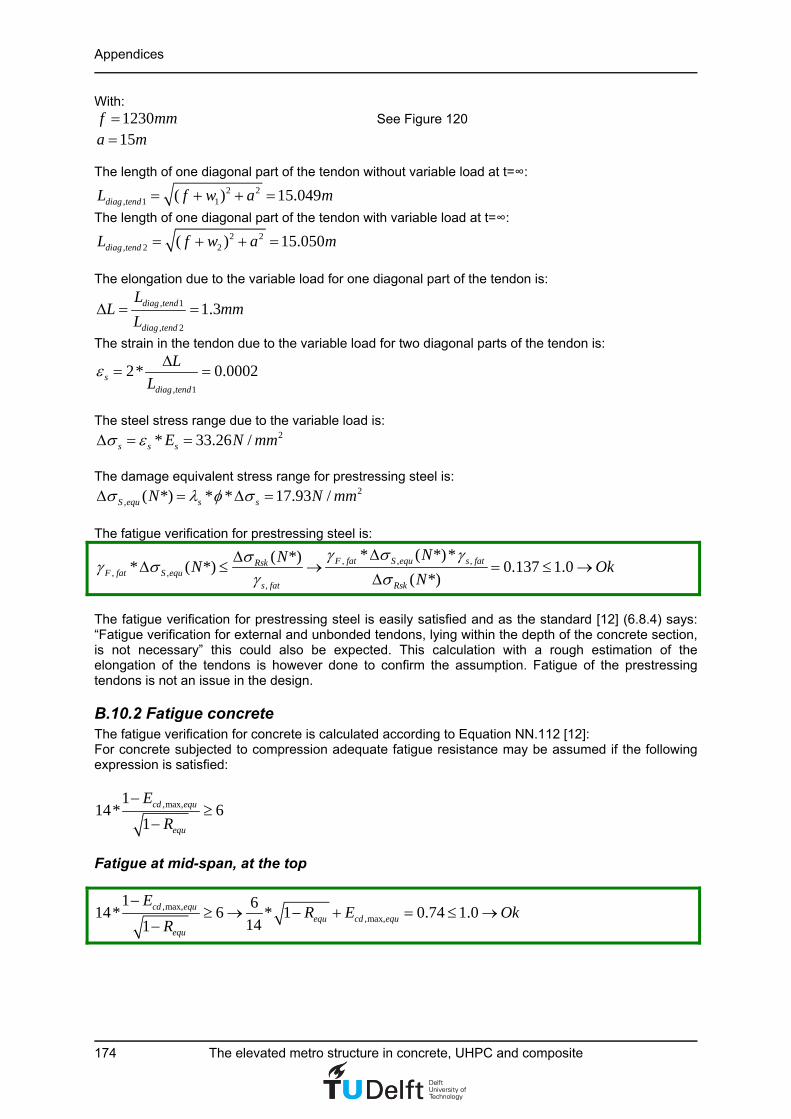
Appendices
174 The elevated metro structure in concrete, UHPC and composite
With: 1230f mm See Figure 120
15a m The length of one diagonal part of the tendon without variable load at t=∞:
2 2, 1 1( ) 15.049diag tendL f w a m
The length of one diagonal part of the tendon with variable load at t=∞: 2 2
, 2 2( ) 15.050diag tendL f w a m
The elongation due to the variable load for one diagonal part of the tendon is:
, 1
, 2
1.3diag tend
diag tend
LL mm
L
The strain in the tendon due to the variable load for two diagonal parts of the tendon is:
, 1
2* 0.0002sdiag tend
L
L
The steel stress range due to the variable load is:
2* 33.26 /s s sE N mm
The damage equivalent stress range for prestressing steel is:
2, ( *) * * 17.93 /S equ s sN N mm
The fatigue verification for prestressing steel is:
, , ,, ,
,
* ( *)*( *)* ( *) 0.137 1.0
( *)F fat S equ s fatRsk
F fat S equs fat Rsk
NNN Ok
N
The fatigue verification for prestressing steel is easily satisfied and as the standard [12] (6.8.4) says: “Fatigue verification for external and unbonded tendons, lying within the depth of the concrete section, is not necessary” this could also be expected. This calculation with a rough estimation of the elongation of the tendons is however done to confirm the assumption. Fatigue of the prestressing tendons is not an issue in the design.
B.10.2 Fatigue concrete The fatigue verification for concrete is calculated according to Equation NN.112 [12]: For concrete subjected to compression adequate fatigue resistance may be assumed if the following expression is satisfied:
,max,114* 6
1cd equ
equ
E
R
Fatigue at mid-span, at the top
,max,,max,
1 614* 6 * 1 0.74 1.0
141cd equ
equ cd equ
equ
ER E Ok
R

Appendix B: Calculations concrete box girder C50/60
Design study 175
Where:
,min,
,max,
0.76cd equequ
cd equ
ER
E Stress ratio
,min,,min,
,
0.40cd equcd equ sd
cd fat
Ef
Minimum compressive stress level
,max,,max,
,
0.53cd equcd equ sd
cd fat
Ef
Maximum compressive stress level
2, 1 0( ) 1 19.27 /
250ck
cd fat cc cd
ff k t f N mm
Design fatigue strength of concrete
1/ 228
( ) exp 1 ( 28) 1.0cc cct s tt
Coefficient for concrete strength at first load
application
1 0.85k Recommended value for 610N cycles
1.15sd Is the partial factor for model uncertainty for action/action effort 2
,max, , ,max ,( ) 8.91 /cd equ c perm c c c perm N mm Upper stress of the ultimate amplitude
for N cycles 2
,min, , , ,min( ) 6.75 /cd equ c perm c c perm c N mm Lower stress of the ultimate amplitude
for N cycles
2, 6.75 /c perm N mm Permanent stress, without variable load, see Eq. (15)
2,max 9.68 /c N mm Maximum compressive stress, with variable load, see
Eq. (11) 2
,min 6.75 /c N mm Minimum compressive stress, without variable load,
see Eq. (15)
,0 ,1 ,2,3 ,4* * * 0.74c c c c c Correction factor to calculate the upper and lower
stresses of the damage equivalent stress
,,0
,
0.94 0.2 1 1.01c permc
cd fatf
Is a factor to take account of the permanent stress
,1 0.75c Is a factor accounting for element type, see Table
NN.3 [12]: (1) compression zone, s* standard traffic mix and simply supported beam
,2,3 6
1 11 log log 0.98
8 25*10 8 100years
c
NVol
Is a factor to take account of the traffic volume
and the design life of the bridge
/ *6*24*365 15848367 / /metroVol Q g tonnes year track Assumption of 6 metros per hour
*116 2958metro mobQ q m kN 116 metres is the length of a metro
100yearsN years Is the design life of the viaduct
,4 1.0c Is a factor to be applied when the structure is loaded
by more than one track, is the most conservative value

Appendices
176 The elevated metro structure in concrete, UHPC and composite
Fatigue at mid-span, at the bottom
,max,,max,
1 614* 6 * 1 0.95 1.0
141cd equ
equ cd equ
equ
ER E Ok
R
Where:
,min,
,max,
0.69cd equequ
cd equ
ER
E Stress ratio
,min,,min,
,
0.49cd equcd equ sd
cd fat
Ef
Minimum compressive stress level
,max,,max,
,
0.71cd equcd equ sd
cd fat
Ef
Maximum compressive stress level
2, 1 0( ) 1 19.27 /
250ck
cd fat cc cd
ff k t f N mm
Design fatigue strength of concrete
1/ 228
( ) exp 1 ( 28) 1.0cc cct s tt
Coefficient for concrete strength at first load
application
1 0.85k Recommended value for 610N cycles
1.15sd Is the partial factor for model uncertainty for action/action effort
2
,max, , ,max ,( ) 11.88 /cd equ c perm c c c perm N mm Upper stress of the ultimate amplitude
for N cycles 2
,min, , , ,min( ) 8.20 /cd equ c perm c c perm c N mm Lower stress of the ultimate amplitude
for N cycles
2, 11.88 /c perm N mm Permanent stress, without variable load, see Eq. (16)
2,max 11.88 /c N mm Maximum compressive stress, without variable load,
see Eq. (16) 2
,min 7.15 /c N mm Minimum compressive stress, with variable load, see
Eq. (12)
,0 ,1 ,2,3 ,4* * * 0.78c c c c c Correction factor to calculate the upper and lower
stresses of the damage equivalent stress
,,0
,
0.94 0.2 1 1.06c permc
cd fatf
Is a factor to take account of the permanent stress
,1 0.75c Is a factor accounting for element type, see Table
NN.3 [12]: (1) compression zone, s* standard traffic mix and simply supported beam
,2,3 6
1 11 log log 0.98
8 25*10 8 100years
c
NVol
Is a factor to take account of the traffic volume
and the design life of the bridge
/ *6*24*365 15848367 / /metroVol Q g tonnes year track Assumption of 6 metros per hour

Appendix B: Calculations concrete box girder C50/60
Design study 177
*116 2958metro mobQ q m kN 116 metres is the length of a metro
100yearsN years Is the design life of the viaduct
,4 1.0c Is a factor to be applied when the structure is loaded
by more than one track, is the most conservative value
Fatigue at the deviation blocks, at the top
,max,,max,
1 614* 6 * 1 0.68 1.0
141cd equ
equ cd equ
equ
ER E Ok
R
Where:
,min,
,max,
0.76cd equequ
cd equ
ER
E Stress ratio
,min,,min,
,
0.36cd equcd equ sd
cd fat
Ef
Minimum compressive stress level
,max,,max,
,
0.47cd equcd equ sd
cd fat
Ef
Maximum compressive stress level
2, 1 0( ) 1 19.27 /
250ck
cd fat cc cd
ff k t f N mm
Design fatigue strength of concrete
1/ 228
( ) exp 1 ( 28) 1.0cc cct s tt
Coefficient for concrete strength at first load
application
1 0.85k Recommended value for 610N cycles
1.15sd Is the partial factor for model uncertainty for action/action effort
2
,max, , ,max ,( ) 7.89 /cd equ c perm c c c perm N mm Upper stress of the ultimate amplitude
for N cycles 2
,min, , , ,min( ) 5.98 /cd equ c perm c c perm c N mm Lower stress of the ultimate amplitude
for N cycles
2, 5.98 /c perm N mm Permanent stress, without variable load, see Eq. (13)
2,max 8.59 /c N mm Maximum compressive stress, with variable load, see
Eq. (9) 2
,min 5.98 /c N mm Minimum compressive stress, without variable load,
see Eq. (13)
,0 ,1 ,2,3 ,4* * * 0.73c c c c c Correction factor to calculate the upper and lower
stresses of the damage equivalent stress
,,0
,
0.94 0.2 1 1.00c permc
cd fatf
Is a factor to take account of the permanent stress

Appendices
178 The elevated metro structure in concrete, UHPC and composite
,1 0.75c Is a factor accounting for element type, see Table
NN.3 [12]: (1) compression zone, s* standard traffic mix and simply supported beam
,2,3 6
1 11 log log 0.98
8 25*10 8 100years
c
NVol
Is a factor to take account of the traffic volume
and the design life of the bridge
/ *6*24*365 15848367 / /metroVol Q g tonnes year track Assumption of 6 metros per hour
*116 2958metro mobQ q m kN 116 metres is the length of a metro
100yearsN years Is the design life of the viaduct
,4 1.0c Is a factor to be applied when the structure is loaded
by more than one track, is the most conservative value
Fatigue at the deviation blocks, at the bottom
,max,,max,
1 614* 6 * 1 0.998 1.0
141cd equ
equ cd equ
equ
ER E Ok
R
Where:
,min,
,max,
0.75cd equequ
cd equ
ER
E Stress ratio
,min,,min,
,
0.59cd equcd equ sd
cd fat
Ef
Minimum compressive stress level
,max,,max,
,
0.78cd equcd equ sd
cd fat
Ef
Maximum compressive stress level
2, 1 0( ) 1 19.27 /
250ck
cd fat cc cd
ff k t f N mm
Design fatigue strength of concrete
1/ 228
( ) exp 1 ( 28) 1.0cc cct s tt
Coefficient for concrete strength at first load
application
1 0.85k Recommended value for 610N cycles
1.15sd Is the partial factor for model uncertainty for action/action effort
2
,max, , ,max ,( ) 13.12 /cd equ c perm c c c perm N mm Upper stress of the ultimate amplitude
for N cycles 2
,min, , , ,min( ) 9.80 /cd equ c perm c c perm c N mm Lower stress of the ultimate amplitude
for N cycles
2, 13.12 /c perm N mm Permanent stress, without variable load, see Eq. (14)
2,max 13.12 /c N mm Maximum compressive stress, without variable load,
see Eq. (14)

Appendix B: Calculations concrete box girder C50/60
Design study 179
2,min 8.90 /c N mm Minimum compressive stress, with variable `
load, see Eq. (10)
,0 ,1 ,2,3 ,4* * * 0.79c c c c c Correction factor to calculate the upper and lower
stresses of the damage equivalent stress
,,0
,
0.94 0.2 1 1.08c permc
cd fatf
Is a factor to take account of the permanent stress
,1 0.75c Is a factor accounting for element type, see Table
NN.3 [12]: (1) compression zone, s* standard traffic mix and simply supported beam
,2,3 6
1 11 log log 0.98
8 25*10 8 100years
c
NVol
Is a factor to take account of the traffic volume
and the design life of the bridge
/ *6*24*365 15848367 / /metroVol Q g tonnes year track Assumption of 6 metros per hour
*116 2958metro mobQ q m kN 116 metres is the length of a metro
100yearsN years Is the design life of the viaduct
,4 1.0c Is a factor to be applied when the structure is loaded
by more than one track, is the most conservative value
Conclusion The fatigue verification for concrete is satisfied but it is an important issue in the design of the box girder as some unity checks are near the limit 1.0. When this verification is not satisfied the best way is to increase the thickness of the bottom flange which decreases the compressive stress in the concrete at the bottom and also brings down the centroidal axis of the box girder and thus reduces the upward prestressing force, see Figure 74.
B.10.3 Vibration For the box girder only the static analysis is considered. The dynamic metro load is multiplied by the dynamic factor to take into account the dynamic loading. This method of calculation holds when the
first natural frequency of the box girder stays within the prescribed limits [10]. When the limits are exceeded a dynamic analysis is required. A dynamic analysis can prove that the box girder is still determined against the dynamic effects. Such an analysis is however extensive and more difficult and is therefore left out of the design of the box girder. For this design the first natural frequency of the box girder should stay within the limits such that a static analysis is sufficient and a dynamic analysis is not necessary. The check for determining whether a dynamic analysis is required is done according two verifications which are elaborated below. Verification according Annex F [10] The first natural bending frequency of the box girder is [20]:
0 43.43
2end cm c
c c
C E In Hz
A L
Where:
9.94endC Boundary condition coefficient [20] 45.387cI m Moment of inertia
The velocity of the metros is:
100 / 27.78 /v km h m s

Appendices
180 The elevated metro structure in concrete, UHPC and composite
Table 21 gives the maximum value of the velocity divided by the first natural frequency of:
0 lim( / ) 14.73v n m
Table 21: Maximum value of lim0 )/( nv for a simply supported beam or slab and a maximum permitted acceleration of
2max /5.3 sm , Table F.1 [10]
With:
3* 10.4*10 /c cm A kg m
45L m The verification of the ratio of the velocity over the first natural frequency is:
0/ 8.09 14.73v n m m Ok
Verification according to Figure 6.10 [10]
Limits of natural frequency 0n (Hz) as a function of L (m)
Figure 121: Limits of bridge natural frequency 0n (Hz) as a function of L (m)

Appendix B: Calculations concrete box girder C50/60
Design study 181
According this verification the first natural frequency of the box girder should be in the grey area, see Figure 121. Where: The upper limit of natural frequency is governed by dynamic enhancements due to track irregularities and is given by:
0.7480max 94.76* 5.5n L Hz
The lower limit of natural frequency is governed by dynamic impact criteria and is given by: 0.592
0min 23.58* 2.48n L Hz
The first natural frequency of the box girder is:
0 43.43
2end cm c
c c
C E In Hz Ok
A L
Conclusion Both verifications show that the box girder does not require a dynamic analysis and a static analysis is sufficient. As the first natural frequency of the girder easily stays within the limits, the box girder is well determined against the dynamic effects. The increasing and decreasing of static stresses and deformations under the effects of moving traffic should, considering the calculations, not give any problems for this box girder.

Appendices
182 The elevated metro structure in concrete, UHPC and composite
B.11 Buckling webs Verification of buckling is needed for the webs of the box girder. The buckling strength of the webs should meet the requirement:
*k cr dF F
Where:
2
20
k
EIF
l
Euler buckling force
10cr Force amplifier to reach the elastic
critical buckling
, 0 ,{ / 2; / 2 }*cos 2106d Ed dl Ed s Ed w wF Max V V V kN Buckling force in one web, see B.7
, 0 4047Ed dlV kN See Eq. (18)
, 3150Ed sV kN See Eq. (19)
491Ed wV kN See Eq. (21)
11.1w Angle of webs with vertical axis, see
Figure 123 237278 /cmE N mm Secant modulus of elasticity of concrete
Figure 122: Examples of different buckling modes and corresponding effective lengths for isolated members
Figure 123: Cross-section of the box girder

Appendix B: Calculations concrete box girder C50/60
Design study 183
The webs are fixed to the flanges. This would mean that buckling mode d, see Figure 122, can be considered to determine the effective buckling length. But as the webs and flanges are relatively slender full rotation stiffness is not likely to occur. In reality buckling mode f should be taken to calculate the effective buckling length of the webs. The rotation stiffness is dependent on the stiffness of the flanges. To determine this rotation stiffness a more extensive calculation is necessary. To be able to make a simple verification of buckling it is therefore chosen to schematise the webs as buckling mode a, see Figure 122. This is the most conservative buckling mode for the webs, where the effective buckling length equals the length of the webs:
2 20 (( ) / 2) 2.305box boxts bfl H b b m
Now the required moment of inertia of the webs can be calculated:
2240
2 20
* ** 304085832
*cr d
cr d
l FEIF I mm
l E
The formula for the moment of inertia of the web is:
3 41* * 304085832
12 webs wI L t mm
In this formula websL is the effective length of the webs in longitudinal direction of the box girder which
can be taken for the buckling resistance. It is hard to determine this effective length, especially for a segmental box girder with its joints between the segments creating discontinuities in the webs. For this calculation it is chosen to take effective length of the webs as 1 metre. This is chosen as in the local schematisation of the deck, see B.9.2, the local metro point load is distributed over 1 metre in the longitudinal direction of the box girder. In the deck schematisation it is therefore chosen to take a deck width of 1 metre. This local deck load should be taken by the webs. For this reason an effective length of the webs of 1 metre is chosen in respect of buckling of the webs. Besides, this assumption is considered as quite conservative as buckling of the webs will probably concern more than 1 metre. Most likely the effective length of the webs equals the length of a segmental box girder, which means a length of 3 metres. However, in this buckling verification a safe assumption of the effective length is taken:
1websL m
The minimum required thickness of the webs hereby becomes:
3,
304085832*12154w req
webs
t mmL
The minimum required width of the webs hereby becomes:
, / cos 157w req w wb t mm
Verification of buckling of the webs:
,160 157w w reqb mm b mm Ok
The webs thus satisfy with respect to buckling. The thickness/width of the webs is however just enough to resist buckling. When this verification is not satisfied the thickness of the webs should be increased.

Appendices
184 The elevated metro structure in concrete, UHPC and composite

Appendix C: Calculations UHPC box girder C180
Design study 185
Appendix C: Calculations UHPC box girder C180
C.1 Introduction This Appendix presents the calculations of the optimal box girder in Ultra High Performance Concrete (UHPC) C180. First the material characteristics of UHPC and steel are described. Paragraph 3 deals with the geometry and the structural schematisation of the box girder and its characteristics. The loads to which the box girder is subjected are treated in paragraph 4. In the next paragraph the layout of the external prestressing tendons is shown and the stresses in the box girder due to loading and prestressing are calculated. It also contains the calculations of the prestressing losses. Furthermore this Appendix describes the calculations on deflection, shear and torsion and the ultimate resistance moment of the box girder in respectively the paragraphs 6, 7 and 8. The calculations on the deck thickness are treated in paragraph 9. Finally this Appendix deals with the calculations on fatigue and vibration of the box girder and buckling of the webs. The formulas and values used in the calculations are taken from [11] and other references, which are then stated in the text.

Appendices
186 The elevated metro structure in concrete, UHPC and composite
C.2 Material characteristics
C.2.1 UHPC C180: Ductal®-AF
Density of UHPC [8] [i5] c 2600 kg/m3
Partial factor for UHPC c 1.5
Additional partial safety factor [16] 'c 1.25
Characteristic compressive cylinder strength of UHPC [i5] ckf 180 N/mm2
Characteristic axial tensile strength of UHPC [i5] ctkf 8.0 N/mm2
Secant modulus of elasticity of UHPC [i5] cmE 50000 N/mm2
Orientation coefficient global effects [18] K 1.25 Orientation coefficient local effects [18] K 1.75 Partial safety factor fundamental combinations [18] bf 1.3
Design value of UHPC compressive strength, SLS [18] ckslscd ff *6.0, 108 N/mm2
Design value of UHPC compressive strength, ULS [18] [16]
)*/(*85.0 ', ccckulscd ff 81.6 N/mm2
Design value of UHPC tensile strength, SLS global effects [18]
Kff ctkslsGctd /, 6.4 N/mm2
Design value of UHPC tensile strength, ULS global effects [18]
)*/(, bfctkulsGctd Kff 4.92 N/mm2
Design value of UHPC tensile strength, ULS local effects [18]
)*/(, bfctkulsLctd Kff 3.52 N/mm2
Flexural tensile strength UHPC [i5] flctmf , 30 N/mm2
Compressive strain in the UHPC at the end of the linear part [18] cmulscdc Ef /,3 1.632 ‰
Ultimate compressive strain in the UHPC [18] 3cu 3.0 ‰
C.2.2 Reinforcing steel FeB 500
Density of reinforcing steel s 7850 kg/m3
Characteristic yield strength of reinforcement ykf 500 N/mm2
Partial factor for reinforcing steel s 1.15
Design yield strength of reinforcement sykyd ff / 435 N/mm2
Design value of modulus of elasticity of reinforcing steel sE 200,000 N/mm2

Appendix C: Calculations UHPC box girder C180
Design study 187
C.2.3 Prestressing steel FeP 1860
Density of prestressing steel p 7850 kg/m3
Characteristic tensile strength of prestressing steel [24] pkf 1860 N/mm2
Characteristic 0.1% proof-stress of prestressing steel [24] kpf 1.0 1600 N/mm2
Partial factor for prestressing steel s 1.15
Design tensile strength of prestressing steel skppd ff /1.0 1391 N/mm2
Ultimate tensile strength of prestressing steel spkf / 1617 N/mm2
Design value of modulus of elasticity of prestressing steel pE 200,000 N/mm2
Factor 1k 0.8
Factor 2k 0.9
Factor 7k 0.75
Factor 8k 0.85
Maximum tensile stress in the tendon (during tensioning)
}*;*min{ 1.021max, kppkp fkfk 1440 N/mm2
Maximum tensile stress in the tendon (after tensioning, initial stress at t=0)
}*;*min{ 1.0870 kppkpm fkfk 1360 N/mm2

Appendices
188 The elevated metro structure in concrete, UHPC and composite
C.3 Geometry box girder
Figure 124: Statically determinate box girders supported by columns
Figure 125: Cross-section of the box girder
C.3.1 General Length span L 45 m Depth box girder H 2.41 m
Width top flange tfb 8.96 m
Thickness top flange tft 0.18 m
Width web wb 0.14 m
Width bottom flange bfb 4 m
Thickness bottom flange bft 0.13 m
Width box top side boxtsb 5 m
Cantilever length top flange cantL 1.98 m
Depth webs boxH 2.1 m
Angle of webs with vertical axis 1 ( ) / 2tan 12.64boxts bf
wbox bf
b b
H t
P
m45 m45
P
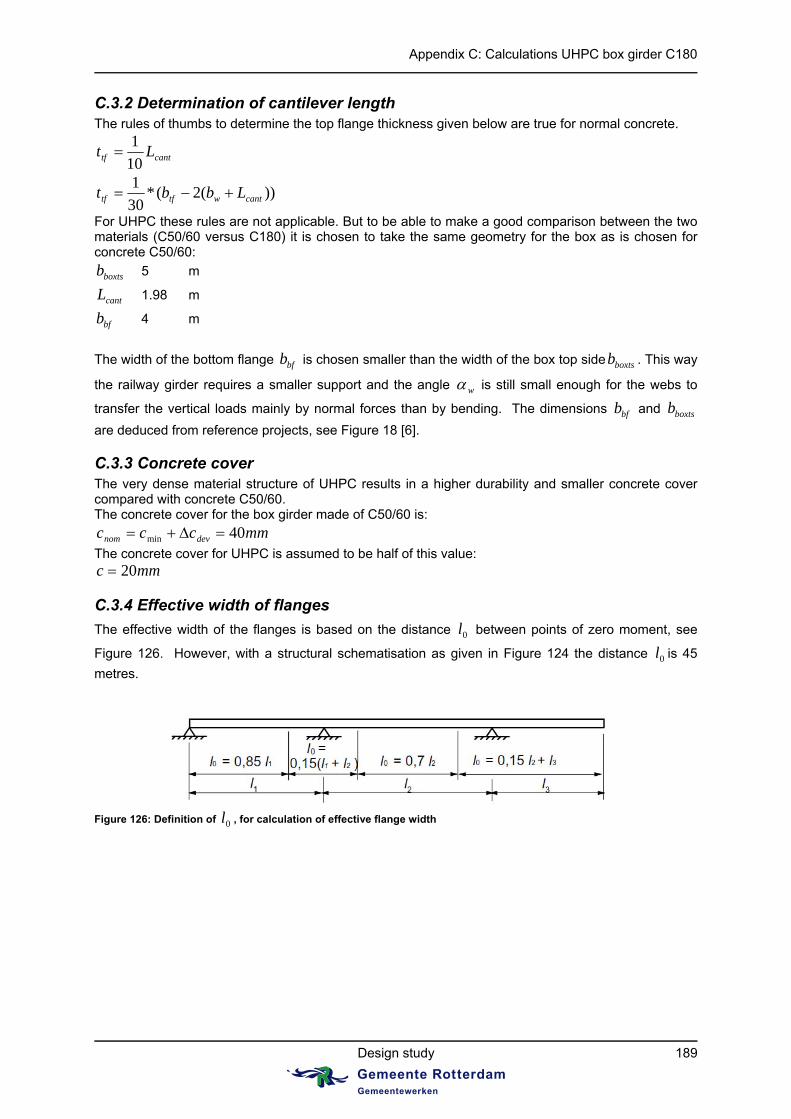
Appendix C: Calculations UHPC box girder C180
Design study 189
C.3.2 Determination of cantilever length The rules of thumbs to determine the top flange thickness given below are true for normal concrete.
canttf Lt10
1
))(2(*30
1cantwtftf Lbbt
For UHPC these rules are not applicable. But to be able to make a good comparison between the two materials (C50/60 versus C180) it is chosen to take the same geometry for the box as is chosen for concrete C50/60:
boxtsb 5 m
cantL 1.98 m
bfb 4 m
The width of the bottom flange bfb is chosen smaller than the width of the box top side boxtsb . This way
the railway girder requires a smaller support and the angle w is still small enough for the webs to
transfer the vertical loads mainly by normal forces than by bending. The dimensions bfb and boxtsb
are deduced from reference projects, see Figure 18 [6].
C.3.3 Concrete cover The very dense material structure of UHPC results in a higher durability and smaller concrete cover compared with concrete C50/60. The concrete cover for the box girder made of C50/60 is:
mmccc devnom 40min
The concrete cover for UHPC is assumed to be half of this value: mmc 20
C.3.4 Effective width of flanges
The effective width of the flanges is based on the distance 0l between points of zero moment, see
Figure 126. However, with a structural schematisation as given in Figure 124 the distance 0l is 45
metres.
Figure 126: Definition of 0l , for calculation of effective flange width

Appendices
190 The elevated metro structure in concrete, UHPC and composite
Figure 127: Effective flange width parameters This gives:
ml 450
Cantilever length top flange mLb cant 98.11
Width inner top flange mbbb wboxts 36.22/2
Width bottom flange mbbb wbf 86.12/3
Effective flange width:
bbbb wieffeff ,
Where:
00, 2.01.02.0 llbb iieff
And
iieff bb ,
Effective width of flanges Value
Effective width cantilever length top flange 1,effb 1.98 m
Effective width inner top flange 2,effb 2.36 m
Effective width bottom flange 3,effb 1.86 m
Total effective flange width Value
Effective width top flange teffb , 8.96 m
Effective width bottom flange beffb , 4 m
C.3.5 Cross-sectional properties Cross-sectional area of UHPC
bfbfboxwtftfc tbHbtbA ***2*
Distance from bottom to centroidal axis
ctfbfbfbfboxboxwtftftfcb AttbtHHbtHtbZ /))2/(**)2/(***2)2/(**(
Distance from top to centroidal axis
cbct ZHZ

Appendix C: Calculations UHPC box girder C180
Design study 191
Moment of inertia of UHPC section
2,
3,
23
2,
3,
)2/(****12
1
)2/(***2**12
1*2
)2/(****12
1
bfcbbfbeffbfbeff
bfboxcbboxwboxw
tfcttftefftfteffc
tZtbtb
tHZHbHb
tZtbtbI
Section modulus bottom
cbcb ZIW /
Section modulus top
ctct ZIW /
Perimeter UHPC box girder
bfbfboxbfboxtscanttftf btHbbLtbu 22 )()2/)((*2*2*2
Values cross-sectional properties box girder Value Cross-sectional area of UHPC
cA 2.721 m2
Distance from bottom to centroidal axis cbZ
1.643 m
Distance from top to centroidal axis ctZ
0.767 m
Second moment of area of the UHPC section
cI 2.381 m4
Section modulus bottom bW
1.450 m3
Section modulus top tW
3.103 m3
Perimeter UHPC box girder u 21.851 m

Appendices
192 The elevated metro structure in concrete, UHPC and composite
C.4 Loads
Figure 128: Cross-section top part superstructure
C.4.1 General Acceleration due to gravity g 9.81 m/s2
Dynamic factor [8] )10/(41 L 1.07
Partial factor for permanent actions, favourable [9] favG , 1.0
Partial factor for permanent actions, unfavourable [9] unfavG , 1.35
Partial factor for variable actions, favourable [9] favQ, 0
Partial factor for variable actions, unfavourable [9] unfavQ, 1.5
Partial factor for prestress, favourable favP, 1
Partial factor for prestress, unfavourable unfavP, 1.3
Factor for combination value of snow load [9] snow,0 0.8
Factor for combination value of wind load [9] wind,0 0.75
Factor for combination value of sideward force [9] sidewf,0 0.8
C.4.2 Vertical loads
Dead load box girder gAg ccdead ** 69.4 kN/m
Permanent loads [8]: Concrete plinths 10 kN/m per track Rail (S49) 0.97 kN/m per track
Cables 1.2 kN/m per cable duct
Walkway + guard-rail 2 kN/m per walkway
Sound insulation 1.3 kN/m per walkway

Appendix C: Calculations UHPC box girder C180
Design study 193
Concrete slope (drainage between walkways)
0.5 kN/m2
Variable loads [8]:
Mobile load (metros) mobq 25.5 kN/m per track
Snow load snowq 0.5 kN/m2
Concentrated load due to the metro (for local schematisation) locmobQ , 130 kN per track
C.4.3 Horizontal loads
Wind load9 [8] windq 1.5 kN/m2
Sideward force due to the metro10 [8] sidewfQ 30 kN per track
C.4.4 Load schematisation in longitudinal direction Serviceability limit state (SLS) Vertical loads
Dead load box girder deadg 69.4 kN/m
Permanent loads: Concrete plinths (* 2 tracks) 20 kN/m Rail (S49) (* 2 tracks) 1.94 kN/m Cables (* 2 cable ducts) 2.4 kN/m Walkways + guardrails (* 2 walkways) 4 kN/m Sound insulation (* 2 walkways) 2.6 kN/m Concrete slope (drainage between walkways)
(*( tfb - 2 * 1 m)) 3.48 kN/m
Total permanent load permg 34.42 kN/m
Variable loads:
Mobile load (metros) mobq * 2 tracks * 54.71 kN/m
Snow load tfsnowsnow bq **,0 3.58 kN/m
Total variable load varq 58.29 kN/m
Ultimate limit state (ULS) Vertical loads
Dead load box girder deadunfavG g*, 93.69 kN/m
Total permanent load permunfavG g*, 46.47 kN/m
Total variable load var, * qunfavQ 87.44 kN/m
9 The viaduct is subjected to wind forces up to a height of 3.6 metres above the upper side of the rail. 10 The sideward force acts at 1.5 metres above the upper side of the rail, in the centre of the track.
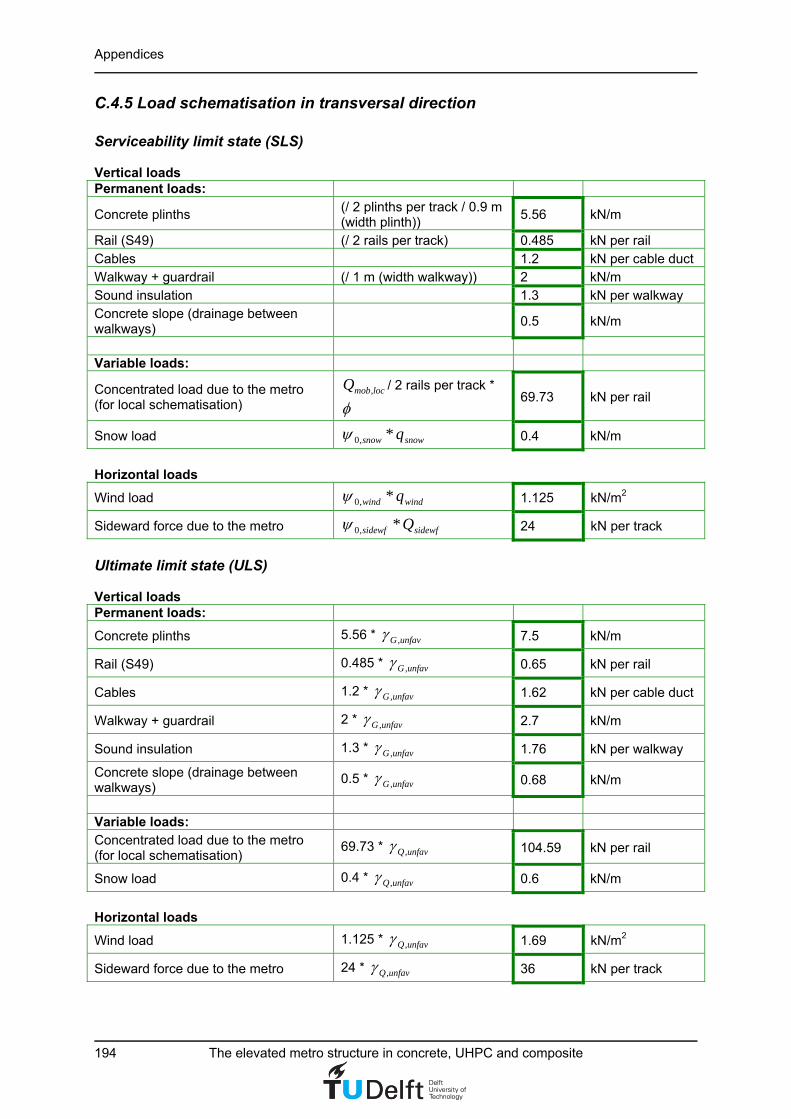
Appendices
194 The elevated metro structure in concrete, UHPC and composite
C.4.5 Load schematisation in transversal direction Serviceability limit state (SLS) Vertical loads Permanent loads:
Concrete plinths (/ 2 plinths per track / 0.9 m (width plinth))
5.56 kN/m
Rail (S49) (/ 2 rails per track) 0.485 kN per rail Cables 1.2 kN per cable duct Walkway + guardrail (/ 1 m (width walkway)) 2 kN/m Sound insulation 1.3 kN per walkway Concrete slope (drainage between walkways)
0.5 kN/m
Variable loads:
Concentrated load due to the metro (for local schematisation)
locmobQ , / 2 rails per track *
69.73 kN per rail
Snow load snowsnow q*,0 0.4 kN/m
Horizontal loads
Wind load windwind q*,0 1.125 kN/m2
Sideward force due to the metro sidewfsidewf Q*,0 24 kN per track
Ultimate limit state (ULS) Vertical loads Permanent loads:
Concrete plinths 5.56 * unfavG , 7.5 kN/m
Rail (S49) 0.485 * unfavG , 0.65 kN per rail
Cables 1.2 * unfavG , 1.62 kN per cable duct
Walkway + guardrail 2 * unfavG , 2.7 kN/m
Sound insulation 1.3 * unfavG , 1.76 kN per walkway
Concrete slope (drainage between walkways)
0.5 * unfavG , 0.68 kN/m
Variable loads: Concentrated load due to the metro (for local schematisation)
69.73 * unfavQ , 104.59 kN per rail
Snow load 0.4 * unfavQ, 0.6 kN/m
Horizontal loads
Wind load 1.125 * unfavQ , 1.69 kN/m2
Sideward force due to the metro 24 * unfavQ , 36 kN per track

Appendix C: Calculations UHPC box girder C180
Design study 195
C.5 Prestressing tendons
C.5.1 Layout prestressing tendons
Figure 129: Layout prestressing tendons Distance between the centre of the tendons and bottom side at mid-span
th 0.5 m
Tendon eccentricity at mid-span tcb hZf 1.143 m
Distance of deviation blocks to supports a 17 m
Angle between prestressing tendon and the centroidal axis 845.3)/(tan 1 aft
The tendon eccentricity at the support is 0 m as the tendon anchorage coincides with the centroidal axis.
Figure 130: Polygon of prestressing forces
The resulting prestressing force )2/sin(**2 tr PP has a small angle with the vertical axis. As the
angle is very small the horizontal force of rP is small. For simplification reasons it is chosen to take
into account only the vertical upward prestressing force. The upward prestressing force uP is
dependent of the prestressing force P and the angle ta
tu PP sin*
C.5.2 Bending moments due to prestressing The moment diagram and structural schematisation due to prestressing is shown in Figure 131. The elevated metro structure consists of statically determinate box girders supported by columns. Due to symmetry of loading the downward prestressing force at the supports is equal to the upward prestressing force at the deviation blocks.

Appendices
196 The elevated metro structure in concrete, UHPC and composite
Figure 131: Structural schematisation of the box girder subjected to prestressing forces Where:
ud PP
kNmM ps 0,
aPaPM udpm **,
The box girder has 6 tendons externally placed inside the girder according the layout shown in Figure 129. One tendon consists of 37 strands with a diameter of 15.7 mm and a cross-sectional area of 150 mm2 per strand. The cross-sectional area of one tendon is:
25550150*37 mmAp
The number of tendons is:
tendonsn 6
The estimated prestressing losses are 20% at t = ∞ The working prestress at t = ∞ then becomes:
20 /1088*8.0 mmNpmpm
Hereunder the prestressing forces and bending moments are calculated for the two phases: the construction phase at t = 0 and the end phase at t = ∞. Construction phase at t = 0 Total prestressing force:
kNAnP pmp 45288** 00
(22) Total upward prestressing force:
kNPP tu 3037sin*00
(23) Bending moment between the two deviation blocks
)(51632*00, kNmaPM upm
End phase at t = ∞ The estimated prestressing losses are 20% The working prestress at t = ∞ then becomes:
20 /1088*8.0 mmNpmpm
Total prestressing force:
kNAnP pmp 36230**
(24)

Appendix C: Calculations UHPC box girder C180
Design study 197
Total upward prestressing force:
kNPP tu 2430sin* (25)
Bending moment between the two deviation blocks
)(41306*, kNmaPM upm
C.5.3 Bending moments due to loads The bending moments due to the loads are determined according the structural load schematisation shown in Figure 132.
Figure 132: Structural schematisation of the box girder subjected to loads Where:
qLVV ba 2
1
kNmM s 0
2
8
1qLM m
2**5.0*2
1aqaqLM a
Bending moments in the construction phase at t = 0 At deviation blocks
)(16516**5.0***2
1 20, kNmagaLgM deaddeada
At mid-span
)(17566**8
1 20, NmLgM deadm
Bending moments in the end phase at t = ∞ At deviation blocks
)(38582*)(*5.0**)(*2
1 2varvar, kNmaqggaLqggM permdeadpermdeada
At mid-span
)(41034*)(*8
1 2var, kNmLqggM permdeadm

Appendices
198 The elevated metro structure in concrete, UHPC and composite
Bending moments due to the variable load At deviation blocks
)(13874**5.0***2
1 2varvar, kNmaqaLqM va
At mid-span
)(14755**8
1 2var, kNmLqM vm
C.5.4 Stresses due to loading As the railway girder is a prefabricated segmental box girder the joints between the segments cannot resist tensile stresses without opening of the joints. Opening of the joints is however not allowed so
the concrete cannot resist tensile stresses: 2/0 mmNc . Furthermore the concrete stress may not
become too large. In order to rule out the non-linearity of creep the concrete compressive stress
should not exceed 2/81*45.0 mmNfckc . Beneath the stresses at the top and bottom side
of the box girder are calculated for different phases. The negative stresses refer to compression and positive stresses to tension. Construction phase at t = 0 At deviation block, top side
20,0,0 /33.5 mmNW
M
W
M
A
P
t
a
t
pm
cct
(26)
OkmmNmmNmmN ct 222 /0/33.5/81
At deviation block, bottom side
20,0,0 /87.40 mmNW
M
W
M
A
P
b
a
b
pm
ccb
(27)
OkmmNmmNmmN cb 222 /0/87.40/81
At mid-span, top side
20,0,0 /67.5 mmNW
M
W
M
A
P
t
m
t
pm
cct
(28)
OkmmNmmNmmN ct 222 /0/67.5/81
At mid-span, bottom side
20,0,0 /14.40 mmNW
M
W
M
A
P
b
m
b
pm
ccb
(29)
OkmmNmmNmmN cb 222 /0/14.40/81
End phase at t = ∞ fully loaded At deviation block, top side
2,, /44.12 mmNW
M
W
M
A
P
t
a
t
pm
cct
(30)

Appendix C: Calculations UHPC box girder C180
Design study 199
OkmmNmmNmmN ct 222 /0/44.12/81
At deviation block, bottom side
2,, /19.15 mmNW
M
W
M
A
P
b
a
b
pm
ccb
(31)
OkmmNmmNmmN cb 222 /0/19.15/81
At mid-span, top side
2,, /23.13 mmNW
M
W
M
A
P
t
m
t
pm
cct
(32)
OkmmNmmNmmN ct 222 /0/23.13/81
At mid-span, bottom side
2,, /50.13 mmNW
M
W
M
A
P
b
m
b
pm
ccb
(33)
OkmmNmmNmmN cb 222 /0/50.13/81
End phase at t = ∞ without variable load At deviation block, top side
2,,, /97.7 mmNW
MM
W
M
A
P
t
vaa
t
pm
cct
(34)
OkmmNmmNmmN ct 222 /0/97.7/81
At deviation block, bottom side
2,,, /77.24 mmNW
MM
W
M
A
P
b
vsa
b
pm
ccb
(35)
OkmmNmmNmmN cb 222 /0/77.24/81
At mid-span, top side
2,,, /47.8 mmNW
MM
W
M
A
P
t
vmm
t
pm
cct
(36)
OkmmNmmNmmN ct 222 /0/47.8/81
At mid-span, bottom side
2,,, /68.23 mmNW
MM
W
M
A
P
b
vmm
b
pm
ccb
(37)
OkmmNmmNmmN cb 222 /0/68.23/81

Appendices
200 The elevated metro structure in concrete, UHPC and composite
C.5.5 Prestressing losses Losses due to the instantaneous deformation of concrete During tensioning the box girder will shorten. As the tendons are prestressed successively there arises an immediate prestressing loss which can be calculated for each tendon with the following formula:
cm
cppel E
tjEAP
)(***
Where: 25550mmAp Cross-sectional area per prestressing tendon
2/000,200 mmNE p Modulus of elasticity of prestressing steel
2/50000 mmNEcm Secant modulus of elasticity of UHPC 2
0 /77.2/*)( mmNAAt cppmc Is the variation of stress in the UHPC at the centre of
gravity of the tendons applied at time t. 22720800mmAc Cross-sectional area of UHPC
20 /1360 mmNpm Maximum initial tensile stress in the tendon
nnj 2/)1( Is a coefficient where n is the number of identical
tendons successively prestressed. This prestressing loss taking into account the order in which the tendons are stressed can be compensated by slightly overstressing the tendons. The maximum overstress is needed in the first prestressed tendon as this tendon has the largest loss due the instantaneous deformation of UHPC.
The required overstress overstr in the first prestressed tendon to compensate the losses due to
instantaneous deformation of UHPC can be calculated out of the formula below:
)(**
** 01, pmoverstrpcm
overstrppel A
E
jEAP
(38)
Where:
cpoverstroverstrc AAt /*)(, Variation of stress in the concrete
For the first prestressed tendon 6n
4167.012/52/)1( nnj
Now fill in formula (38):
200
00
/64.1364
*
**1
1*
**
*
***)(*
***
mmN
AE
AjE
AE
AjE
AE
AjEA
E
jEA
ccm
pp
pmoverstr
overstr
pm
ccm
pp
pmoverstrccm
poverstrppmoverstrp
cm
overstrpp
The maximum allowed tensile stress of the tendons during tensioning is 2max, /1440 mmNp . The
stress caused by overstressing is far below this value and as also the UHPC compressive stress
during tensioning is limited to 2/108*6.0 mmNfckc this small overstressing will not cause
any problems for the structure. It can be concluded that the losses due to the instantaneous deformation of UHPC can be compensated by overstressing the tendons. By overstressing the tendons the initial tensile stress in all the tendons after tensioning can be the maximum tensile
stress 20 /1360 mmNpm .

Appendix C: Calculations UHPC box girder C180
Design study 201
Losses due to friction The loss due to friction in post-tensioned tendons is:
)1()( )(max
kxePxP
Where: Is the sum of the angular displacement over a distance x (irrespective of
direction or sign). Is the coefficient of friction between the tendon and its duct.
k Is the unintentional angular displacement for internal tendons (per unit length). x Is the distance along the tendon from the point where the prestressing force is
equal to maxP (the force at the active end during tensioning).
Figure 133: Layout prestressing tendons
Figure 134: Angular displacement at a deviation block There are four places where tendon deviation takes place, namely: at the two supports and at the two deviation blocks at a distance a from the supports.
The angular displacement per deviation is: rada
ft 07.0
For external tendons, the losses of prestress due to unintentional angles may be ignored [11], so the loss due to friction per deviation is:
kNePxP 93.302)1()( *max
Where
kNAnPP pmp 45288** 00max
1.0 See table 5.1 [11] (external unbonded tendons; HDPE duct / lubricated;
strand)

Appendices
202 The elevated metro structure in concrete, UHPC and composite
Time dependent losses of prestress for post-tensioning The time dependent loss of prestress for post-tensioning at a location x is calculated according the formula below:
)],(8.01)[1(*
1
*),(8.0
02
,0
,
ttzI
A
A
An
E
E
tE
EE
AAP
cpc
c
c
p
cm
p
QPccm
pprpcs
prscpprsc
Where: Creep
3.0),( 0 t Is the final creep coefficient [i5]
Shrinkage
0.00001‰01.0 cs Total shrinkage strain in absolute value [i5]
Relaxation Relaxation class 2 (wire or strand):
25)1(75.0
1.91000 /93.6010*
1000**66.0* mmN
tepipr
Where:
20 /1360 mmNpmpi
Relaxation class 2 %5.21000
73.0/ pkpi f
2/1860 mmNf pk
The long term (final) values of the relaxation losses may be estimated for a time equal to: hourst 000,500 .
Concrete stress
QPc, Is the stress in the UHPC adjacent to the tendons, due to self-weight and initial
prestress and other quasi-permanent actions where relevant. The value of QPc, may
be the effect of part of self-weight and initial prestress or the effect of a full quasi-
permanent combination of action )( 20 QPG mcc , depending on the stage
of construction considered.
This means that QPc, is the stress at the centroidal axis at t=0.
This gives:
20, /65.16 mmN
A
P
cQPc
Where:
kNAnP pmp 45288** 00
Other values
22720800mmAc Cross-sectional area of UHPC 25550mmAp Cross-sectional area per prestressing tendon

Appendix C: Calculations UHPC box girder C180
Design study 203
6n Number of tendons 2/50000 mmNEcm Secant modulus of elasticity of UHPC
2/000,200 mmNEp Modulus of elasticity of prestressing steel
41210*381.2 mmIc Moment of inertia of UHPC section
Time dependent loss of prestress for post-tensioning at support
kN
ttzI
A
A
An
E
E
tE
EE
nAnAP
scpsc
c
c
p
cm
p
QPccm
pprpcs
prscppsrsc 2220
)],(8.01)[1(*
1
*),(8.0
02
,,
,0
,,
Where:
mmz scp 0, The tendon eccentricity at the support is 0 m as the tendons
anchorage coincides with the centroidal axis. Time dependent loss of prestress for post-tensioning at mid-span
kN
ttzI
A
A
An
E
E
tE
EE
nAnAP
mcpmc
c
c
p
cm
p
QPccm
pprpcs
prscppmrsc 2046
)],(8.01)[1(*
1
*),(8.0
02
,,
,0
,,
Where:
mmfz mcp 1143,
Total prestressing losses The box girder segments are tensioned from one side from a practical point of view. This is because the construction of the metro system concerns a continuous placement of the segments from one column to the next column. This means that there is only one end well accessible to tension the tendons. The total prestressing losses hereby become, see Table 22: Place Prestressing loss Value Percentage of loss Value
At the first support PP srsc , 2523 kN 0
,
** pmp
srsc
An
PP
5.57 %
After the first deviation block (at mid-span) PP mrsc *2, 2651 kN
0
,
**
*2
pmp
mrsc
An
PP
5.85 %
After the second deviation block (at mid-span) PP mrsc *3, 2954 kN
0
,
**
*3
pmp
mrsc
An
PP
6.52 %
At the second support PP srsc *4, 3432 kN 0
,
**
*4
pmp
srsc
An
PP
7.58 %
Table 22: Total prestressing losses The maximum prestressing loss arises at the end of the span, at the other end where the tensioning takes place. This loss = 7.58 % which is smaller than the assumed prestressing loss of 20 %. This assumption is thus a safe value for the prestressing losses and has not to be taken any larger. To take into account other unexpected losses and other expected losses like for instance thermal losses and slip of the anchorage it is decided to keep the expected final prestressing losses of 20 %. Notice that these formulas for prestressing losses are from [11] which can be used for concrete C50/60. For UHPC there are no formulas to determine the prestressing losses, but as the method should be quite

Appendices
204 The elevated metro structure in concrete, UHPC and composite
similar this should give an impression of the losses. As the calculations show that the losses are far below the expected loss of 20 %, it is assumed to be on the safe side. In the continuation of this design the prestressing loss in the end phase at t = ∞ is thus 20 %.

Appendix C: Calculations UHPC box girder C180
Design study 205
C.6 Deflection The bending moments due to the loads are determined according the structural load schematisation
shown in Figure 135. This schematisation means a deflection at mid-span of: EI
qLw
4
384
5
Figure 135: Structural schematisation of the box girder subjected to loads The moment diagram and structural schematisation due to prestressing is given in Figure 136. The exact upward deflection of this schematisation is more difficult to determine. Therefore it is chosen to re-schematise the schematisation into a more easy and conservative schematisation to calculate the deflection. It can be seen that the moment diagram due to prestressing looks like the one due to the loads but then upside-down and angular. It is therefore chosen to change the structural schematisation of the box girder subjected to prestressing forces into a schematisation with a uniform distributed load like in Figure 135, but then with an upward uniform distributed load.
Figure 136: Structural schematisation of the box girder subjected to prestressing forces For the new schematisation the corresponding uniform distributed load has to be determined: At t=0: The bending moment generated by prestressing at mid-span:
kNmaPM upm 51632*00,
The bending moment due to a uniform distributed load at mid-span:
2**8
1LqM m
For the new schematisation those two moments have to be the same value:
mkNqMM ptmpm /20400,

Appendices
206 The elevated metro structure in concrete, UHPC and composite
At t=∞: The bending moment generated by prestressing at mid-span:
kNmaPM upm 41306*,
The bending moment due to a uniform distributed load at mid-span:
2**8
1LqM m
For the new schematisation those two moments have to be the same value:
mkNqMM ptmpm /163,
Notice that this new schematisation causes a smaller upward deflection than in the real schematisation. With the requirement of a limited downward deflection this verification thus becomes more conservative. The deflection is determined with the formula:
mcEI
qLw
,
4
384
5
Where: mL 45 Length span
4381.2 mIc Moment of inertia of UHPC section
2
0, /38462
),(1mmN
t
EEE cm
effc
Effective modulus of elasticity of UHPC for deflection
at t=0 and at t=∞ without variable load 2/50000 mmNEE cm Secant modulus of elasticity of UHPC for additional
deflection under mobile load
3.0),( 0 t Creep coefficient, see C.5.5: creep
The deflections and unity checks at mid-span for different phases are: Time Load q Deflection w value
Maximum allowed deflection maxw
Unity check
max/ ww
At t=0 0ptdead qg -78.5 mm mmL 180250/ annotation 11
0.44
At t=∞ without variable load ptpermdead qgg -34.6 mm mmL 90500/ annotation 12
-0.38
Additional deflection under mobile load varq 26.1 mm mmL 301500/
annotation 13 0.87
At t=∞ fully loaded
pt
permdead
gg
var
-34.6 + 26.1 = -8.5
mm mmL 90500/ annotation 12
-0.09
Table 23: The deflections and unity checks at mid-span for different phases An upward deflection has a negative sign and a downward deflection has a positive sign. As the unity checks show the construction satisfies with respect to deflection for all phases and always has a camber. The normative deflection is the additional deflection under mobile load.
11 The pre-camber may not exceed 250/L see 7.4 [11]. 12 The final deflection may not exceed 500/L see 7.4 [11]. 13 The maximum deflection under mobile load is 1500/L [8].

Appendix C: Calculations UHPC box girder C180
Design study 207
C.7 Shear + torsion
C.7.1 Shear + torsion in webs General The webs have to resist the vertical shear and torsion. As it concerns a segmental box girder the joints between the segments consists of shear keys, see Figure 137 and Figure 138.
Figure 137: Shear keys in the flanges and in the webs
Figure 138: Section A-A’
Each web has 14 shear keys with a height sH of 150 mm per shear key, see Figure 139. The shear
force is taken by compression in the sloped part of the shear key, see Figure 140. Friction of the remaining parts of the shear keys and flanges is not taken into account.
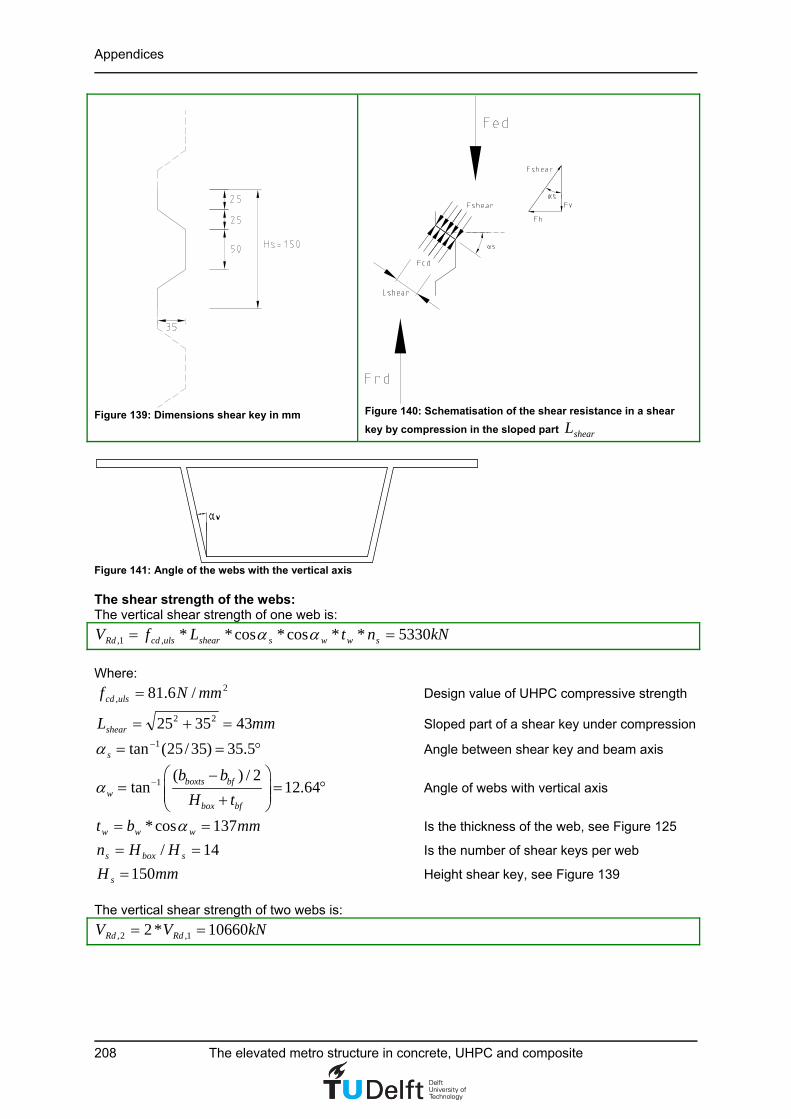
Appendices
208 The elevated metro structure in concrete, UHPC and composite
Figure 139: Dimensions shear key in mm
Figure 140: Schematisation of the shear resistance in a shear
key by compression in the sloped part shearL
Figure 141: Angle of the webs with the vertical axis The shear strength of the webs: The vertical shear strength of one web is:
kNntLfV swwsshearulscdRd 5330**cos*cos**,1,
Where:
2, /6.81 mmNf ulscd Design value of UHPC compressive strength
mmLshear 433525 22 Sloped part of a shear key under compression
5.35)35/25(tan 1s Angle between shear key and beam axis
1 ( ) / 2tan 12.64boxts bf
wbox bf
b b
H t
Angle of webs with vertical axis
mmbt www 137cos* Is the thickness of the web, see Figure 125
14/ sboxs HHn Is the number of shear keys per web
mmH s 150 Height shear key, see Figure 139
The vertical shear strength of two webs is:
kNVV RdRd 10660*2 1,2,

Appendix C: Calculations UHPC box girder C180
Design study 209
Shear resistance at t=0 in the webs Shear forces The shear diagram at t=0 is shown in Figure 142.
Figure 142: Shear force diagram at t=0 With:
mL 45 ma 17
mkNgq deadfavG /4.69*,
kNPP uunfavPu 3948* 0,
kNPu 30370 See Eq. (23)
This gives the following shear forces
, 0 *( / 2 ) 382Ed drV q L a kN
, 0 , 0 3567Ed dl Ed dr uV V P kN
, 0 , 0 * 2387Ed s Ed dlV V q a kN
The maximum shear force is (absolute value):
, 0 3567Ed dlV kN
(39) Unity check The unity check for shear in the webs at t=0 is:
, 0 ,2/ 0.33 1.0Ed dl RdV V Ok
Shear and torsion resistance at t=∞ in the webs Shear forces The shear diagram at t=∞ is shown in Figure 143.

Appendices
210 The elevated metro structure in concrete, UHPC and composite
Figure 143: Shear force diagram at t=∞ With:
mL 45 ma 17
mkNqggq unfavQpermunfavGdeadunfavG /59.227*** var,,,
kNPP ufavPu 2430*,
kNPu 2430 See Eq. (25)
This gives the following shear forces
, *( / 2 ) 1252Ed drV q L a kN
, , 1178Ed dl Ed dr uV V P kN
, , * 2691Ed s Ed dlV V q a kN
The maximum shear force is (absolute value):
, 2691Ed sV kN
(40)
Torsional moment The maximum torsional moment is a result of wind load, the sideward force of a metro and the box girder eccentrically loaded by one metro, see Figure 144 and Figure 145.
Figure 144: Eccentrically loaded box girder

Appendix C: Calculations UHPC box girder C180
Design study 211
Figure 145: Load schematisation for maximum torsional moment The maximum torsional moment is:
kNmzQZHHQ
ZZZHHZZHHLqT
metrometroctusrsidewsidew
cbcbctusrwindcbctusrwindwindEd
2072*)(*
))2/)(((*)(*2/*
(41) Where:
2/69.1 mkNqwind See C.4.5 ULS
kNQsidew 36 See C.4.5 ULS
kNLqQ mobunfavQmetro 9232/***, See C.4.1 and C.4.2, divided by 2 as half the torsion
goes to the support of one span
mH wind 6.3 See C.4.3
mHsidew 5.1 See C.4.3
mHusr 35.0 Height upper side rail, see Figure 128
mzmetro 74.1 See Figure 128
mZct 767.0
mZcb 643.1
The lever arm of the webs is:
mbbbz wbfboxtswebs 36.42/)( See Figure 125
The extra shear force in the webs due to torsion is:
/ 475Ed w ed websV T z kN
(42) Unity checks The unity check for shear in the webs at t=∞ is:
, ,2/ 0.25 1.0Ed s RdV V Ok
The unity check for shear + torsion in the webs at t=∞ is:
, ,2 ,1/ / 0.34 1.0Ed s Rd ed w RdV V V V Ok

Appendices
212 The elevated metro structure in concrete, UHPC and composite
The webs satisfy with respect to shear and torsion. The shear and torsion resistance is much more than what is required and friction of the remaining parts of the shear keys and flanges is not even taken along. It is thus possible to have less shear keys in the webs. When this verification is not
satisfied, the depth of the webs boxH should be increased to place more shear keys in the webs. Also
increasing the web thickness is an option. For this design this is however not necessary as the verification is easily satisfied.
C.7.2 Shear + torsion in flanges General The flanges have to resist the horizontal shear and torsion. As it concerns a segmental box girder the joints between the segments consists of shear keys see, Figure 146 and Figure 147.
Figure 146: Shear keys in the flanges and in the webs
Figure 147: Section B-B’ The top flange and the bottom flange both have 3 shear keys with a thickness which is the same as the flange thickness, see Figure 146. The shear force is taken by compression in the sloped part of the shear key, see Figure 149. Friction of the remaining parts of the shear keys and flanges and webs is not taken into account.
Figure 148: Dimensions shear key in mm

Appendix C: Calculations UHPC box girder C180
Design study 213
Figure 149: Schematisation of the shear resistance in a shear key by compression in the sloped part shearL
The shear strength of the flanges: The horizontal shear strength of the top flange is:
, ,* *cos * * 1028Rd tf cd shear s tf s tfV f L t n kN
The horizontal shear strength of the bottom flange is:
, ,* *cos * * 1114Rd bf cd shear s bf s bfV f L t n kN
Where:
2, /6.81 mmNf ulscd Design value of UHPC compressive strength
mmLshear 433525 22 Sloped part of a shear key under compression
5.35)35/25(tan 1s Angle between shear key and beam axis
0.18tft m Is the thickness of the top flange
0.13bft m Is the thickness of the bottom flange
, 3s tfn Is the number of shear keys in the top flange
, 3s bfn Is the number of shear keys in the bottom
flange

Appendices
214 The elevated metro structure in concrete, UHPC and composite
Shear resistance at t=∞ in the flanges Shear forces in the flanges
Figure 150: Load schematisation for maximum torsional moment The shear force in the top flange is:
, * / 2*( / 2) 232Ed tf wind wind usr sidewV q L H H H Q kN
The shear force in the bottom flange is:
, * / 2* / 2 46Ed bf windV q L H kN
Where:
2/69.1 mkNqwind See C.4.5 ULS
kNQsidew 36 See C.4.5 ULS
mH wind 6.3 See C.4.3
mHsidew 5.1 See C.4.3
mHusr 35.0 See Figure 128
Torsional moment The maximum torsional moment is a result of wind load, the sideward force of a metro and the box girder eccentrically loaded by one metro, see Figure 150. The lever arm of the flanges is:
/ 2 / 2 2.26f tf bfz H t t m See Figure 125
The extra shear force in the flanges due to torsion is:
/ 919Ed f ed fV T z kN
Where:
2072EdT kNm See Eq. (41)

Appendix C: Calculations UHPC box girder C180
Design study 215
Unity checks Top flange The unity check for shear in the top flange at t=∞ is:
, ,/ 0.15 1.0Ed tf Rd tfV V Ok
The unity check for shear + torsion in the top flange at t=∞ is:
, , ,/ / 0,75 1.0Ed tf Rd tf Ed f Rd tfV V V V Ok
Bottom flange The unity check for shear in the bottom flange at t=∞ is:
, ,/ 0.04 1.0Ed bf Rd bfV V Ok
The unity check for shear + torsion in the bottom flange at t=∞ is:
, , ,/ / 0,87 1.0Ed bf Rd bf Ed f Rd bfV V V V Ok
The flanges satisfy with respect to shear and torsion. The shear and torsion resistance is not much more than what is required. Friction of the remaining parts of the shear keys and flanges is however not even taken along. When this verification is not satisfied, more shear keys should be placed in the flanges. As the flanges offer enough space for additional shear keys this verification will never be normative for the design and will easily satisfy.

Appendices
216 The elevated metro structure in concrete, UHPC and composite
C.8 Ultimate resistance moment
C.8.1 General
In all phases during the lifetime of the box girder the concrete force cN due to the compressive
stresses in the UHPC should balance the prestressing force P , see Figure 151.
Figure 151: Equilibrium between axial forces P and cN in the cross-section of the box girder
Figure 152: Overview for the calculation of the ultimate moment
At the same time the bending moment dM due to loading should be resisted by the ultimate
resistance moment uM of the box girder. The ultimate resistance moment arises when the strain
difference between the top and bottom flange is as large as possible taking into account that tensile
stresses are not allowed. This means that 2min /0 mmNc . In which flange the maximum strain
arises depends on the stage of loading. For the example given above it would mean that:
The concrete force cbfcwctfc NNNN and should be equal to P , see Figure 152.
The ultimate resistance moment * * *u ctf tf cw w cbf bfM N z N z N z and should be larger than the
bending moment dM . Where ,tf w bfz z and z are positive or negative values considering the location of
the force with regard to the centroidal axis.

Appendix C: Calculations UHPC box girder C180
Design study 217
For this calculation there is made use of the stress-strain relation for UHPC according the strain softening law, see Figure 153.
Figure 153: Stress-strain relation for UHPC [18] Where:
3 1.632‰c bc Is the maximum elastic compressive strain in the UHPC
3 3.0‰cu u Is the ultimate compressive strain in the UHPC
C.8.2 Bending moments due to the loads and prestressing
Bending moment dM at t=0
In the construction phase at t=0 the loads on the box girder are the dead load and the prestressing force. As the permanent and variable loads are missing and the initial prestressing force is large the box girder has a camber. The normative bending moment in this phase arises at the deviation blocks, see Figure 154. The maximum strain arises in the bottom flange.
Figure 154: The bending moments due to prestressing minus the bending moments due to dead load results in the largest bending moment Ma at the deviation blocks
At deviation blocks
2,0 , 0 , ,
1* * * * * * 0.5* * * 50605 ( )
2da P unfav u G fav dead G fav deadM P a g L a g a kNm
Where:
0 3037uP kN See Eq. (23)
Bending moment dM at t=∞
In the end phase at t=∞ the box girder is fully loaded by the dead, permanent and variable load and is partly resisted by the prestressing force. This load case causes a downward deflection, which means that the normative bending moment arises at mid-span, see Figure 155. The maximum strain arises in the top flange.

Appendices
218 The elevated metro structure in concrete, UHPC and composite
Figure 155: The bending moments due to dead, permanent and variable load minus the bending moments due to prestressing results in the largest bending moment Mm at mid-span At mid-span
2, , , , var ,
1*( * * * )* * *
816304 ( )
dm G unfav dead G unfav perm Q unfav P fav uM g g q L P a
kNm
Where:
2430uP kN See Eq. (25)
C.8.3 Ultimate resistance moment at t=0 Ultimate resistance moment at deviation blocks The prestressing force at t=0 is:
kNP 452880 See Eq. (22)
,0 50605 ( )daM kNm means that the maximum compressive strain arises in the bottom flange.
The schematisation of the forces in the cross-section is shown in Figure 156 and Figure 157.
Figure 156: Stress and strain schematisation in the cross-section at the deviation blocks at t=0
Figure 157: Concrete forces and lever arms in the cross-section at the deviation blocks at t=0
To determine the maximum strain for which holds that 0PNc everything is filled in a spreadsheet
program (Microsoft Excel) and solved with the function goal seek. With the function goal seek the
concrete force cN is set to be equal to the prestressing force 0P by changing the maximum
compressive strain in the cross-section maxc .

Appendix C: Calculations UHPC box girder C180
Design study 219
The maximum strain in the cross-section which causes equilibrium between cN and 0P is:
max 1.046‰c
This gives:
max * / 0.078‰ctf c tft H
max *( ) / 0.989‰cbf c bfH t H
2min /0 mmNc
min, ,
3
(( ) / 2)* * * 3148ctf c
ctf cd uls eff t tfc
N f b t kN
,3
(( ) / 2)* *2 * 15688ctf cbf
cw cd uls w boxc
N f b H kN
max, ,
3
(( ) / 2)* * * 26451cbf c
cbf cd uls eff b bfc
N f b t kN
Where:
mb teff 96.8, See C.3.4
mb beff 4, See C.3.4
The total concrete compressive force is:
045288 PkNNNNN cbfcwctfc
The lever arms of the concrete forces are:
2* 0.65
3tf tf ctz t Z m
1 1*( * ) *( * ) / 0.76
2 2 3 2cbf ctf cbf ctf
w cb ctf box bf box bf ctfz Z H t H t m
max max1 1* * * * / 1.58
2 3 2 2c cbf c cbf
bf cb bf cbf bf cbfz Z t t m
The ultimate resistance moment is:
* * * 51654u ctf tf cw w cbf bfM N z N z N z kNm
Unity check of the ultimate resistance moment:
,0 / 0.98 1.0da uM M Ok
The ultimate resistance moment of the box girder is thus enough to resist the bending moments in the construction phase at t=0. The unity check however approaches the limit 1.0, so this verification needs
attention. When this verification is not satisfied the depth of the webs boxH should be decreased, see
Figure 125. This way the upward prestressing force becomes smaller, see Figure 129, and thus the hogging moment due to prestressing decreases. Another option is to make the box girder heavier
such that the hogging moment dM becomes smaller.

Appendices
220 The elevated metro structure in concrete, UHPC and composite
C.8.4 Ultimate resistance moment at t=∞ Ultimate resistance moment at mid-span The prestressing force at t=∞ is:
36230P kN See Eq. (24)
, 16304 ( )dmM kNm means that the maximum compressive strain arises in the top flange.
The schematisation of the forces in the cross-section is shown in Figure 158 and Figure 159.
Figure 158: Stress and strain schematisation in the cross-section at mid-span at=∞
Figure 159: Concrete forces and lever arms in the cross-section at mid-span at=∞
To determine the maximum strain for which holds that cN P everything is filled in a spreadsheet
program (Microsoft Excel) and solved with the function goal seek. With the function goal seek the
concrete force cN is set to be equal to the prestressing force P by changing the maximum
compressive strain in the cross-section maxc .
The maximum strain in the cross-section which causes equilibrium between cN and P is:
max 0.391‰c
This gives:
max *( ) / 0.362‰ctf c tfH t H
max * / 0.021‰cbf c bft H
2min /0 mmNc
max, ,
3
(( ) / 2)* * * 30332c ctf
ctf cd uls eff t tfc
N f b t kN
,3
(( ) / 2)* *2 * 5625ctf cbf
cw cd uls w boxc
N f b H kN

Appendix C: Calculations UHPC box girder C180
Design study 221
min, ,
3
(( ) / 2)* * * 274cbf c
cbf cd uls eff b bfc
N f b t kN
Where:
, 8.96eff tb m See C.3.4
mb beff 4, See C.3.4
The total concrete compressive force is:
36230c ctf cw cbfN N N N kN P
The lever arms of the concrete forces are:
max max1 1* * * * / 0.68
2 3 2 2c ctf c ctf
tf ct tf ctf tf ctfz Z t t m
2 1*( * ) *( * ) / 0.15
2 3 2 2ctf cbf ctf cbf
w box bf cbf box bf cbf cbz H t H t Z m
2* 1.56
3bf bf cbz t Z m
The ultimate resistance moment is:
* * * 19304u ctf tf cw w cbf bfM N z N z N z kNm
Unity check of the ultimate resistance moment:
, / 0.84 1.0dm uM M Ok
The ultimate resistance moment of the box girder is thus enough to resist the bending moments in the end phase at t=∞. The unity check however approaches the limit 1.0, so this verification needs
attention. When this verification is not satisfied the depth of the webs boxH should be increased, see
Figure 125. This way the lever arms z become larger which has a positive effect on the ultimate resistance moment. Also the upward prestressing force then becomes larger, see Figure 129. The
bending moment dM should be kept as small as possible by creating a light as possible box girder.
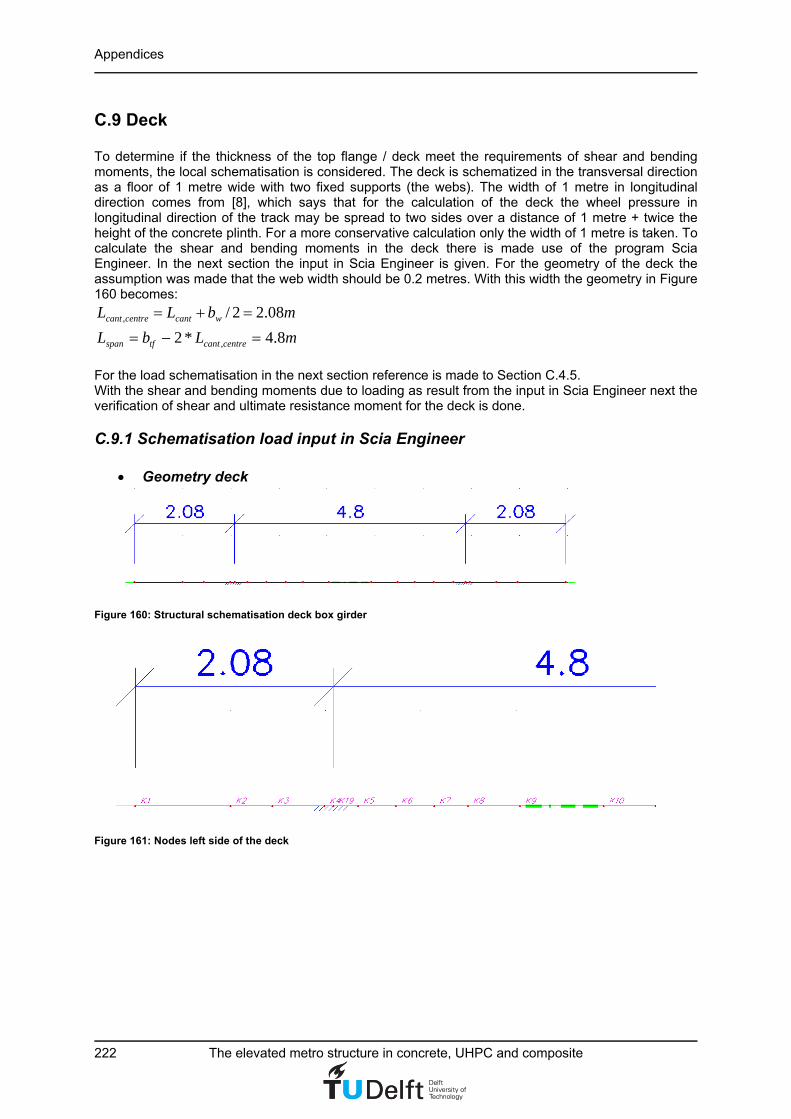
Appendices
222 The elevated metro structure in concrete, UHPC and composite
C.9 Deck To determine if the thickness of the top flange / deck meet the requirements of shear and bending moments, the local schematisation is considered. The deck is schematized in the transversal direction as a floor of 1 metre wide with two fixed supports (the webs). The width of 1 metre in longitudinal direction comes from [8], which says that for the calculation of the deck the wheel pressure in longitudinal direction of the track may be spread to two sides over a distance of 1 metre + twice the height of the concrete plinth. For a more conservative calculation only the width of 1 metre is taken. To calculate the shear and bending moments in the deck there is made use of the program Scia Engineer. In the next section the input in Scia Engineer is given. For the geometry of the deck the assumption was made that the web width should be 0.2 metres. With this width the geometry in Figure 160 becomes:
mbLL wcantcentrecant 08.22/,
mLbL centrecanttfspan 8.4*2 ,
For the load schematisation in the next section reference is made to Section C.4.5. With the shear and bending moments due to loading as result from the input in Scia Engineer next the verification of shear and ultimate resistance moment for the deck is done.
C.9.1 Schematisation load input in Scia Engineer
Geometry deck
Figure 160: Structural schematisation deck box girder
Figure 161: Nodes left side of the deck

Appendix C: Calculations UHPC box girder C180
Design study 223
Figure 162: Nodes right side of the deck
Figure 163: Bars Nodes Name Coordinate X
[m] Coordinate Z [m]
K1 0,000 6,000 K2 1,000 6,000 K3 1,440 6,000 K4 1,986 6,000 K5 2,340 6,000 K6 2,740 6,000 K7 3,140 6,000 K8 3,494 6,000 K9 4,040 6,000 K10 4,920 6,000 K11 5,466 6,000 K12 5,820 6,000 K13 6,220 6,000 K14 6,620 6,000 K15 6,974 6,000 K16 7,520 6,000 K17 7,960 6,000 K18 8,960 6,000 K19 2,080 6,000 K20 6,880 6,000 1D-bar Name Cross-section Length
[m] Form
Start node End node Type EEM-type
Layer
S1 CS1 - Rectangle (180; 1000)
1,000 Line K1 K2 floor strip (99) standard Layer1
S2 CS1 - Rectangle (180; 1000)
0,440 Line K2 K3 floor strip (99) standard Layer1

Appendices
224 The elevated metro structure in concrete, UHPC and composite
S3 CS1 - Rectangle (180; 1000)
0,546 Line K3 K4 floor strip (99) standard Layer1
S4 CS1 - Rectangle (180; 1000)
0,354 Line K4 K5 floor strip (99) standard Layer1
S5 CS1 - Rectangle (180; 1000)
0,400 Line K5 K6 floor strip (99) standard Layer1
S6 CS1 - Rectangle (180; 1000)
0,400 Line K6 K7 floor strip (99) standard Layer1
S7 CS1 - Rectangle (180; 1000)
0,354 Line K7 K8 floor strip (99) standard Layer1
S8 CS1 - Rectangle (180; 1000)
0,546 Line K8 K9 floor strip (99) standard Layer1
S9 CS1 - Rectangle (180; 1000)
0,880 Line K9 K10 floor strip (99) standard Layer1
S10 CS1 - Rectangle (180; 1000)
0,546 Line K10 K11 floor strip (99) standard Layer1
S11 CS1 - Rectangle (180; 1000)
0,354 Line K11 K12 floor strip (99) standard Layer1
S12 CS1 - Rectangle (180; 1000)
0,400 Line K12 K13 floor strip (99) standard Layer1
S13 CS1 - Rectangle (180; 1000)
0,400 Line K13 K14 floor strip (99) standard Layer1
S14 CS1 - Rectangle (180; 1000)
0,354 Line K14 K15 floor strip (99) standard Layer1
S15 CS1 - Rectangle (180; 1000)
0,546 Line K15 K16 floor strip (99) standard Layer1
S16 CS1 - Rectangle (180; 1000)
0,440 Line K16 K17 floor strip (99) standard Layer1
S17 CS1 - Rectangle (180; 1000)
1,000 Line K17 K18 floor strip (99) standard Layer1
Node support Name Node System Type X Z Ry Sn1 K19 GCS Standard Fixed Fixed Fixed Sn2 K20 GCS Standard Fixed Fixed Fixed
Load input The values of the loads are taken from section: C.4.5 Load schematisation in transversal directionin the SLS.
Figure 164: Permanent loads left side of the deck

Appendix C: Calculations UHPC box girder C180
Design study 225
Figure 165: Permanent loads right side of the deck
Figure 166: Metro load on the left side of the deck
Figure 167: Metro load on the right side of the deck
Figure 168: Snow load Line loads on bars Name Bar Type Direction P1
[kN/m] x1 Coordinate
definition Origin Exc ey
[m] Load case System Distribution P2
[kN/m] x2 Loc Angle [deg] Exc ez
[m] Lijnlast1 S3 Force Z -5,56 0,000 Rela From start BG2 - Permanent load LCS Uniform 1,000 Length 0,000 Lijnlast2 S4 Force Z -5,56 0,000 Rela From start BG2 - Permanent load LCS Uniform 1,000 Length 0,000 Lijnlast3 S15 Force Z -5,56 0,000 Rela From start BG2 - Permanent load LCS Uniform 1,000 Length 0,000 Lijnlast4 S14 Force Z -5,56 0,000 Rela From start BG2 - Permanent load LCS Uniform 1,000 Length 0,000 Lijnlast5 S1 Force Z -2,00 0,000 Rela From start BG2 - Permanent load LCS Uniform 1,000 Length 0,000

Appendices
226 The elevated metro structure in concrete, UHPC and composite
Lijnlast6 S17 Force Z -2,00 0,000 Rela From start BG2 - Permanent load LCS Uniform 1,000 Length 0,000 Lijnlast7 S2 Force Z -0,50 0,000 Rela From start BG2 - Permanent load LCS Uniform 1,000 Length 0,000 Lijnlast8 S5 Force Z -0,50 0,000 Rela From start BG2 - Permanent load LCS Uniform 1,000 Length 0,000 Lijnlast9 S6 Force Z -0,50 0,000 Rela From start BG2 - Permanent load LCS Uniform 1,000 Length 0,000 Lijnlast12 S9 Force Z -0,50 0,000 Rela From start BG2 - Permanent load LCS Uniform 1,000 Length 0,000 Lijnlast15 S12 Force Z -0,50 0,000 Rela From start BG2 - Permanent load LCS Uniform 1,000 Length 0,000 Lijnlast16 S13 Force Z -0,50 0,000 Rela From start BG2 - Permanent load LCS Uniform 1,000 Length 0,000 Lijnlast17 S16 Force Z -0,50 0,000 Rela From start BG2 - Permanent load LCS Uniform 1,000 Length 0,000 Lijnlast35 S7 Force Z -5,56 0,000 Rela From start BG2 - Permanent load LCS Uniform 1,000 Length 0,000 Lijnlast36 S8 Force Z -5,56 0,000 Rela From start BG2 - Permanent load LCS Uniform 1,000 Length 0,000 Lijnlast37 S10 Force Z -5,56 0,000 Rela From start BG2 - Permanent load LCS Uniform 1,000 Length 0,000 Lijnlast38 S11 Force Z -5,56 0,000 Rela From start BG2 - Permanent load LCS Uniform 1,000 Length 0,000 Concentrated loads on nodes Name Node Load case System Direction Type Value - F
[kN] Puntlast1 K4 BG2 - Permanent
load GCS Z Force -0,48
Puntlast2 K15 BG2 - Permanent load
GCS Z Force -0,48
Puntlast3 K2 BG2 - Permanent load
GCS Z Force -1,30
Puntlast4 K17 BG2 - Permanent load
GCS Z Force -1,30
Puntlast9 K8 BG2 - Permanent load
GCS Z Force -0,48
Puntlast10 K11 BG2 - Permanent load
GCS Z Force -0,48
Concentrated loads on bars Name Bar System F
[kN] x Coordinate Repeat
(n) Load case Direction Type Angle [deg] Origin dx F1 S1 GCS -1,20 0,500 Rela 1 BG2 - Permanent load Z Force From start F2 S17 GCS -1,20 0,500 Rela 1 BG2 - Permanent load Z Force From start Concentrated loads on nodes Name Node Load case System Direction Type Value - F
[kN] Puntlast5 K4 BG3 – Metro left GCS Z Force -69,73 Puntlast6 K8 BG3 – Metro left GCS Z Force -69.73 Puntlast7 K15 BG3 – Metro right GCS Z Force -69,73 Puntlast8 K11 BG3 – Metro right GCS Z Force -69.73

Appendix C: Calculations UHPC box girder C180
Design study 227
Line loads on bars Name Bar Type Direction P1
[kN/m] x1 Coordinate
definition Origin Exc ey
[m] Load case System Distribution P2
[kN/m] x2 Loc Angle [deg] Exc ez
[m] Lijnlast18 S1 Force Z -0,4 0,000 Rela From start BG5 – Snow load LCS Uniform 1,000 Length 0,000 Lijnlast19 S2 Force Z -0,4 0,000 Rela From start BG5 – Snow load LCS Uniform 1,000 Length 0,000 Lijnlast20 S3 Force Z -0,4 0,000 Rela From start BG5 – Snow load LCS Uniform 1,000 Length 0,000 Lijnlast21 S4 Force Z -0,4 0,000 Rela From start BG5 – Snow load LCS Uniform 1,000 Length 0,000 Lijnlast22 S5 Force Z -0,4 0,000 Rela From start BG5 – Snow load LCS Uniform 1,000 Length 0,000 Lijnlast23 S6 Force Z -0,4 0,000 Rela From start BG5 – Snow load LCS Uniform 1,000 Length 0,000 Lijnlast24 S7 Force Z -0,4 0,000 Rela From start BG5 – Snow load LCS Uniform 1,000 Length 0,000 Lijnlast25 S8 Force Z -0,4 0,000 Rela From start BG5 – Snow load LCS Uniform 1,000 Length 0,000 Lijnlast26 S9 Force Z -0,4 0,000 Rela From start BG5 – Snow load LCS Uniform 1,000 Length 0,000 Lijnlast27 S10 Force Z -0,4 0,000 Rela From start BG5 – Snow load LCS Uniform 1,000 Length 0,000 Lijnlast28 S11 Force Z -0,4 0,000 Rela From start BG5 – Snow load LCS Uniform 1,000 Length 0,000 Lijnlast29 S12 Force Z -0,4 0,000 Rela From start BG5 – Snow load LCS Uniform 1,000 Length 0,000 Lijnlast30 S13 Force Z -0,4 0,000 Rela From start BG5 – Snow load LCS Uniform 1,000 Length 0,000 Lijnlast31 S14 Force Z -0,4 0,000 Rela From start BG5 – Snow load LCS Uniform 1,000 Length 0,000 Lijnlast32 S15 Force Z -0,4 0,000 Rela From start BG5 – Snow load LCS Uniform 1,000 Length 0,000 Lijnlast33 S16 Force Z -0,4 0,000 Rela From start BG5 – Snow load LCS Uniform 1,000 Length 0,000 Lijnlast34 S17 Force Z -0,4 0,000 Rela From start BG5 – Snow load LCS Uniform 1,000 Length 0,000

Appendices
228 The elevated metro structure in concrete, UHPC and composite
Results The shear forces and moments in the deck due to the permanent and variable loads in the ULS are shown below. This does not include the dead load of the deck.
Figure 169: Shear forces in the deck due to permanent and variable loads
Figure 170: Moments in the deck due to permanent and variable loads
C.9.2 Verifications of shear and ultimate resistance moment Total shear force and bending moment The maximum shear force due to permanent and variable loads in the ULS is:
, var 117.67Ed permV kN See Figure 169
The extra shear force due to the dead load is:
kNgLbtV unfavGccentrecantdecktfdeadEd 89.12***** ,,,
Where:
1.0deckb m
, 2.08cant centreL m
The total shear force is:
kNVVV deadEdpermEdEd 56.130,var,
The maximum bending moment due to permanent and variable loads in the ULS is:
, var 113.93d permM kNm See Figure 170
The extra bending moment due to the dead load at the webs is:
kNmLgbtM spanunfavGcdecktfdeadd 90.11*)****(12
1 2,,

Appendix C: Calculations UHPC box girder C180
Design study 229
Where:
4.8spanL m
The total bending moment is:
kNmMMM permddeaddd 83.125var,,
Shear resistance The total shear strength of the UHPC deck is calculated according [18] with one exception which is explicitly stated below. The total shear strength of the UHPC deck is:
kNVVVV fRdsRdcRdRd 30.733,,,
Where:
kNzbfV deckckbE
cRd 20.278***24.0
*1
,
Shear strength due to participation of the
concrete, reinforced concrete according [1]
kNfs
AdV yd
swsRd 0)cos(sin****9.0, Shear strength due to participation of the
stirrup reinforcement. As there are no stirrups in the deck this does not contribute to the shear strength of the deck.
kNS
Vbf
pfRd 10.455
tan*
*,
Shear strength due to participation of the
fibres
5.1* bE Safety coefficient 2/180 mmNfck Caracteristic compressive cylinder strength of
UHPC
mbdeck 0.1 Width of the deck
mmdz 6.129*9.0 Lever arm of internal forces
mmctd stirrupsretf 1442/inf Effective depth of a cross-section
mmc 20 Concrete cover, see C.3.3
mmre 16inf Diameter longitudinal reinforcement
mmstirrups 8 Diameter stirrups
mmttf 180 Thickness of the top flange/deck
20mmAsw Cross-sectional area of shear reinforcement
per stirrup, there are no stirrups s Spacing of the stirrups
2/435 mmNf
fs
ykyd
Design yield strength of reinforcement
Angle between shear reinforcement and the beam axis perpendicular to the shear force ( may not be smaller than 45 )

Appendices
230 The elevated metro structure in concrete, UHPC and composite
2129600* mmzbS deck Area of fibre effect
2
0lim
/57.4)(*1
*1 lim
mmNdwwwK
w
p Residual tensile strength
For calculation of the residual tensile strength there is made use of the stress-strain relation for UHPC according the strain softening law, see Figure 171
Figure 171: Stress-strain relation for UHPC [18]
23.0
3.0
/57.4*)(**5.0(*1
*1
mmNffK ctklinuctklin
up
75.1K Orientation coefficient local effects
00007.0**
cmbf
ctklin EK
f
Strain at the end of the linear part
0251.0*
lim3.0
cmbf
ctk
cu E
f
l
w
Strain for the limited crack width
mmw 3lim Limited crack width
mmtl tfc 120*3
2 Characteristic length
2/8 mmNfctk Characteristic axial tensile strength of UHPC 2/50000 mmNEcm Secant modulus of elasticity of UHPC
3.1bf Partial safety factor fundamental combinations
45 Angle between the concrete compression strut and the beam axis perpendicular to the shear force ( is minimal 30 )
The ultimate shear stress must be no more than:
)2sin(*
85.014.1 3/2
ck
cEu f
This gives:
OkkNdbfV deckckcE
Ed 2966**)2sin(*
85.014.156.130 3/2

Appendix C: Calculations UHPC box girder C180
Design study 231
Unity check:
OkVV RdEd 0.118.0/
Without stirrup reinforcement the deck easily satisfies with respect to local shear. Ultimate resistance moment The ultimate resistance moment of the deck is calculated according to the schematisation in Figure 172. In this case however the schematisation should be mirrored along the centre line as the tension arises at the top side and the compression zone is at the bottom side of the deck, see Figure 173.
Figure 172: Rectangular stress distribution
Figure 173: Definition of slA
The reinforcement in the deck is:
2 2inf inf
1* *( * ) 2413
2sl re reA n mm Is the area of tensile reinforcement, see Figure 173
inf inf/ 12.5 12 /re deck ren b S bars m Is the number of reinforcement bars
inf 80reS mm Is the spacing of the reinforcement bars
The two horizontal forces cF and sF should be in equilibrium:
0 sc FF
This is the same as:
0******5.03
slsscdc
cdeck AEfbx
Where:
tftot
c tx *
Concrete compressive zone

Appendices
232 The elevated metro structure in concrete, UHPC and composite
sctot Total strain in the deck
‰174.2s
yds E
f Tensile strain in the reinforcement
‰632.13 c Compressive strain in the concrete at the end of the linear part 22413mmAsl Area of tensile reinforcement
Solving the formula gives:
‰84.00 csc FF
The concrete compressive zone is:
mmtx tftot
c 1.50*
The ultimate resistance moment of the deck is:
kNmxdAEM slssu 55.133)3
1(***
Unity check for the ultimate resistance moment of the deck is:
OkMM ud 0.194.0/
The ultimate resistance moment of the deck is thus just enough to resist the bending moments. If this
verification is not satisfied the lever arm between the two forces cF and sF should be increased. This
means that the deck becomes thicker. Another option is to add more reinforcement bars. This however has a strong influence on the rotation capacity, see hereunder. Furthermore: The cracking moment is:
2,
1* * * 162
6r ctm fl deck tfM f b t kNm
Because ur MM brittle failure can occur. Due to the fibres the flexural tensile strength of this
material is much larger than for conventional concrete. The ultimate resisting moment uM should
therefore be larger than the bending moment dM at all times as brittle failure caused by failure of the
reinforcement should be excluded. The height of the compression zone should satisfy: See 5.6.3 [11]
Okdx 35.03478.0/
This verification considers the rotation capacity of the deck at the supports (the webs) is sufficient. It shows that the verification is satisfied but is very close to the limit so attention is needed. If this verification is not satisfied the thickness of the deck should be increased. Another option is to diminish the number of reinforcement bars which will result in a smaller compressive zone x . This will however also reduce the ultimate resistance moment.

Appendix C: Calculations UHPC box girder C180
Design study 233
C.10 Fatigue + vibration
C.10.1 Fatigue prestressing steel For prestressing steel adequate fatigue resistance should be assumed if the following expression is satisfied:
, ,,
( *)* ( *) Rsk
F fat S equs fat
NN
Where:
, 1.0F fat Is the partial factor for fatigue loads
, 1.15s fat s Is the partial factor for prestressing steel for the fatigue verification
2( *) 150 /Rsk N N mm Is the stress range at N* cycles, see table 6.4N [11]: straight tendons
or curved tendons in plastic ducts
1 5k See Figure 174
2 10k See Figure 174
* 1000000N loading cycles See Figure 174
Figure 174: Shape of the characteristic fatigue strength curve (S-N-curves for prestressing steel) The damage equivalent stress range for prestressing steel is calculated according to Equation NN.106 [12]:
, ( *) * *S equ s sN
Where:
s Is the steel stress range due to the variable load
Is the dynamic factor
,1 ,2 ,3 ,4* * *s s s s s Is a correction factor to calculate the damage equivalent stress range
from the stress range caused by * s
,1s Is a factor accounting for element type (eg. continuous beam) and takes into account
the damaging effect of traffic depending on the length of the influence line or area.
,2s Is a factor taking into account the traffic volume
,3s Is a factor that takes into account the design life of the bridge
,4s Is a factor to be applied when the structural element is loaded by more than one track

Appendices
234 The elevated metro structure in concrete, UHPC and composite
,1 0.65s See Table NN.2 [12]: (1) post tensioning straight tendons, s* standard traffic mix and
simply supported beam
2,2 6
0.9625*10
ks
Vol
Where:
2 10k See Figure 174
/ *6*24*365 15848367 / /metroVol Q g tonnes year track Assumption of 6 metros per hour
*116 2958metro mobQ q m kN 116 metres is the length of a metro
2,3 1
100yearsk
s
N
Where:
100yearsN years Is the design life of the viaduct
2 22,4 1 2(1 )* (1 )* 0.81k kk
s n n s n s
Where: 0.12n Is the proportion of traffic that crosses the bridge simultaneously, 0.12
is the suggested value
0js Only compressive stresses occur under traffic loads on a track
,1 ,2 ,3 ,4* * * 0.50s s s s s
The dynamic factor is determined according [8] and not according [10] as this dynamic factor is normative (larger):
1 4 /(10 ) 1.07L
The deflection at mid-span at t=∞ due to the dead load, the permanent load and prestressing is:
1 35w mm Upwards, see Table 23
The deflection at mid-span at t=∞ due to the dead load, the permanent load, the variable load and
prestressing is: 2 8w mm Upwards, see Table 23
It is assumed that the deflection at the deviation blocks is the same as at mid-span (conservative assumption).
Figure 175: Schematisation for determining the elongation of the tendons With:
1143f mm See Figure 175

Appendix C: Calculations UHPC box girder C180
Design study 235
17a m The length of one diagonal part of the tendon without variable load at t=∞:
2 2, 1 1( ) 17.036diag tendL f w a m
The length of one diagonal part of the tendon with variable load at t=∞: 2 2
, 2 2( ) 17.038diag tendL f w a m
The elongation due to the variable load for one diagonal part of the tendon is:
, 1
, 2
1.7diag tend
diag tend
LL mm
L
The strain in the tendon due to the variable load for two diagonal parts of the tendon is:
, 1
2* 0.0002sdiag tend
L
L
The steel stress range due to the variable load is:
2* 40.39 /s s sE N mm
The damage equivalent stress range for prestressing steel is:
2, ( *) * * 21.77 /S equ s sN N mm
The fatigue verification for prestressing steel is:
, , ,, ,
,
* ( *)*( *)* ( *) 0.167 1.0
( *)F fat S equ s fatRsk
F fat S equs fat Rsk
NNN Ok
N
The fatigue verification for prestressing steel is easily satisfied and as the standard [12] (6.8.4) says: “Fatigue verification for external and unbonded tendons, lying within the depth of the concrete section, is not necessary” this could also be expected. This calculation with a rough estimation of the elongation of the tendons is however done to confirm the assumption. Fatigue of the prestressing tendons is not an issue for the design.
C.10.2 Fatigue concrete The fatigue verification of concrete C50/60 is calculated according Equation NN.112 [12]: For concrete C50/60 subjected to compression adequate fatigue resistance may be assumed if the following expression is satisfied:
,max,114* 6
1cd equ
equ
E
R
For UHPC there is no fatigue verification and the verification for concrete C50/60 given above cannot be used as the design fatigue strength of the UHPC then becomes:
2,01, /42.19
2501)( mmN
fftkf ck
ulscdccfatcd
Where: 1/ 2
28( ) exp 1 ( 28) 1.0cc cct s t
t
Coefficient for concrete strength at first load
application
1 0.85k Recommended value for 610N cycles

Appendices
236 The elevated metro structure in concrete, UHPC and composite
Some stresses in the concrete at t=∞ are larger than this design fatigue strength, see Eq. (35) and (37). According this verification the stresses are thus too large and should be smaller. But as UHPC contains steel fibres which makes the concrete more ductile it is expected that the design fatigue strength is much larger than the value calculated above. The maximum stress in the box girder is: At deviation block, bottom side
, , , 224.77 /m p a s vcb
c b b
M M MPN mm
A W W
See Eq. (35)
The design value of UHPC compressive strength is:
2, /6.81 mmNf ulscd
The maximum compressive stress is thus much smaller than the design compressive strength of UHPC. As the strong UHPC contains steel fibres the design fatigue strength is assumed to be at least 30.0 N/mm2. It is expected that the design fatigue strength is even more than this value. My assumption is that even half of the design value of the UHPC compressive strength is still a safe assumption:
2,, /8.40*
2
1mmNff ulscdfatcd
Considering the material UHPC with its fibres it is thus expected that the fatigue verification for UHPC is satisfied and will never become an issue for this design. This is however a very critical assumption for the design and should be validated in order to present this design as a good design.
C.10.3 Vibration For the box girder only the static analysis is considered. The dynamic metro load is multiplied by the dynamic factor to take into account the dynamic loading. This method of calculation holds when the
first natural frequency of the box girder stays within the prescribed limits [10]. When the limits are exceeded a dynamic analysis is required. A dynamic analysis can prove that the box girder is still determined against the dynamic effects. Such an analysis is however extensive and more difficult and is therefore left out of the design of the box girder. For this design the first natural frequency of the box girder should stay within the limits such that a static analysis is sufficient and a dynamic analysis is not necessary. The check for determining whether a dynamic analysis is required is done according two verifications which are elaborated below. Verification according Annex F [10] The first natural bending frequency of the box girder is [20]:
0 43.21
2end cm c
c c
C E In Hz
A L
Where:
9.94endC Boundary condition coefficient [20] 42.381cI m Moment of inertia
The velocity of the metros is:
100 / 27.78 /v km h m s

Appendix C: Calculations UHPC box girder C180
Design study 237
Table 24: Maximum value of lim0 )/( nv for a simply supported beam or slab and a maximum permitted acceleration of
2max /5.3 sm , Table F.1 [10]
Table 24 gives no maximum value of the velocity divided by the first natural frequency for:
3* 7.074*10 /c cm A kg m
45L m Therefore there is made an extrapolation of the table to determine the maximum value of the velocity divided by the first natural frequency. This is a rough extrapolation as the difference of the values is
large between masses above and below mkgm /10*10 3 , see Table 24.
The extrapolated maximum value of the velocity divided by the first natural frequency is:
mnv 0.10)/( lim0
The verification of the ratio of the velocity over the first natural frequency is:
Okmmnv 0.1067.8/ 0

Appendices
238 The elevated metro structure in concrete, UHPC and composite
Verification according to Figure 6.10 [10]
Limits of natural frequency 0n (Hz) as a function of L (m)
Figure 176: Limits of bridge natural frequency 0n (Hz) as a function of L (m)
According this verification the first natural frequency of the box girder should be in the grey area, see Figure 176. Where: The upper limit of natural frequency is governed by dynamic enhancements due to track irregularities and is given by:
0.7480max 94.76* 5.5n L Hz
The lower limit of natural frequency is governed by dynamic impact criteria and is given by: 0.592
0min 23.58* 2.48n L Hz
The first natural frequency of the box girder is:
0 43.21
2end cm c
c c
C E In Hz Ok
A L
Conclusion Both verifications show that the box girder does not require a dynamic analysis and a static analysis is sufficient. As the first natural frequency of the girder easily stays within the limits, the box girder is well determined against the dynamic effects. The increasing and decreasing of static stresses and deformations under the effects of moving traffic should, considering the calculations, not give any problems for this box girder. The roughly extrapolated maximum value of the velocity divided by the first natural frequency in the first verification is considered as a safe value as Table 24 is valid for trains and in this design, metros cause the dynamic loading which in general is less than the dynamic loading by trains. Besides the first natural frequency of the box girder is still large enough to satisfy with respect to the roughly extrapolated maximum value of the velocity divided by the first natural frequency from Table 24. It is thus concluded that the box girder has a good resistance against vibration.

Appendix C: Calculations UHPC box girder C180
Design study 239
C.11 Buckling webs Verification of buckling is needed for the webs of the box girder. The buckling strength of the webs should meet the requirement:
*k cr dF F
Where:
2
20
k
EIF
l
Euler buckling force
10cr Force amplifier to reach the elastic
critical buckling
, 0 ,{ / 2; / 2 }/ cos 1866d Ed dl Ed s Ed w wF Max V V V kN Buckling force in one web, see C.7
, 0 3567Ed dlV kN See Eq. (39)
, 2691Ed sV kN See Eq. (40)
475Ed wV kN See Eq. (42)
12.64w Angle of webs with vertical axis,
see Figure 178 250000 /cmE N mm Secant modulus of elasticity of UHPC
Figure 177: Examples of different buckling modes and corresponding effective lengths for isolated members
Figure 178: Cross-section of the box girder The webs are fixed to the flanges. This would mean that buckling mode d, see Figure 177, can be considered to determine the effective buckling length. But as the webs and flanges are relatively

Appendices
240 The elevated metro structure in concrete, UHPC and composite
slender full rotation stiffness is not likely to occur. In reality buckling mode f should be taken to calculate the effective buckling length of the webs. The rotation stiffness is dependent on the stiffness of the flanges. To determine this rotation stiffness a more extensive calculation is necessary. To be able to make a simple verification of buckling it is therefore chosen to schematise the webs as buckling mode a, see Figure 177. This is the most conservative buckling mode for the webs, where the effective buckling length equals the length of the webs:
2 20 (( ) / 2) 2.159box boxts bfl H b b m
Now the required moment of inertia of the webs can be calculated:
2240
2 20
* ** 176203498
*cr d
cr d
l FEIF I mm
l E
The formula for the moment of inertia of the web is:
3 41* * 176203498
12 webs wI L t mm
In this formula websL is the effective length of the webs in longitudinal direction of the box girder which
can be taken for the buckling resistance. It is hard to determine this effective length, especially for a segmental box girder with its joints between the segments creating discontinuities in the webs. For this calculation it is chosen to take effective length of the webs as 1 metre. This is chosen as in the local schematisation of the deck, see C.9.2, the local metro point load is distributed over 1 metre in the longitudinal direction of the box girder. In the deck schematisation it is therefore chosen to take a deck width of 1 metre. This local deck load should be taken by the webs. For this reason an effective length of the webs of 1 metre is chosen in respect of buckling of the webs. Besides, this assumption is considered as quite conservative as buckling of the webs will probably concern more than 1 metre. Most likely the effective length of the webs equals the length of a segmental box girder, which means a length of 3 metres. However, in this buckling verification a safe assumption of the effective length is taken:
1websL m
The minimum required thickness of the webs hereby becomes:
3,
176203498*12128w req
webs
t mmL
The minimum required width of the webs hereby becomes:
, / cos 132w req w wb t mm
Verification of buckling of the webs:
,140 132w w reqb mm b mm Ok
The webs thus satisfy with respect to buckling. The thickness of the webs is however just enough to resist buckling. When this verification is not satisfied the thickness of the webs should be increased.

Appendix D: Results optimisation process
Design study 241
Appendix D: Results optimisation process
D.1 Results optimisation process concrete box girder C50/60
D.1.1 Box girder with 6 tendons Depth webs 2.1 2.25 2.4 2.55 2.7 2.85 3 3.15 3.3 mNumber of shear keys 14 15 16 17 18 19 20 21 22Thickness top flange 0.25 0.25 0.25 0.25 0.25 0.25 0.25 0.25 0.25 mNumber of tendons 6 6 6 6 6 6 6 6 6Depth box girder 2.65 2.8 2.95 3.1 3.25 3.41 3.6 3.79 3.99 mThickness bottom flange 0.3 0.3 0.3 0.3 0.3 0.31 0.35 0.39 0.44 mWidth web 0.16 0.16 0.17 0.18 0.18 0.19 0.2 0.21 0.21 mDistance of deviation blocks to supports 14 15 16 17 18 19 19 19 19 m
Dead load box girder 100.85 102.02 104.38 106.88 108.20 111.91 118.70 125.64 132.09 kN/mUltimate resistance moment at t=0 bottom side 0.870853 0.898022 0.925355 0.952394 0.978226 0.996586 0.996742 0.998938 0.994933 Unity checkUltimate resistance moment at t=∞ top side 1.067195 0.897363 0.769691 0.658194 0.538472 0.464228 0.436005 0.414428 0.390166 Unity checkStresses at t=0 deviation block top side -4.715889 -4.418485 -4.103952 -3.800871 -3.536554 -3.298061 -3.145133 -2.992994 -2.89869 N/mm^2
deviation block bottom side -21.23773 -21.3488 -21.12039 -20.85923 -20.90323 -20.11878 -18.23029 -16.66678 -15.29903 N/mm^2mid-span top side -5.491809 -4.988227 -4.513265 -4.082364 -3.716359 -3.40354 -3.248545 -3.09462 -2.998141 N/mm^2mid-span bottom side -19.97805 -20.42722 -20.46422 -20.41219 -20.61892 -19.95653 -18.08257 -16.53075 -15.17465 N/mm^2
Stresses at t=∞ without variable load deviation block top side -6.295698 -5.984093 -5.664535 -5.353059 -5.065025 -4.797469 -4.559416 -4.336756 -4.166093 N/mm^2deviation block bottom side -12.89422 -13.11722 -13.07876 -13.0151 -13.1874 -12.77399 -11.6655 -10.73349 -9.929176 N/mm^2mid-span top side -7.336447 -6.74605 -6.208824 -5.725205 -5.302027 -4.93539 -4.692815 -4.466222 -4.291458 N/mm^2mid-span bottom side -11.2046 -11.88473 -12.20622 -12.42409 -12.81265 -12.56184 -11.47495 -10.5602 -9.772393 N/mm^2
Stresses at t=∞fuly loaded deviation block top side -8.989862 -8.588345 -8.174995 -7.768909 -7.389832 -7.013183 -6.607394 -6.238173 -5.935957 N/mm^2deviation block bottom side -8.52035 -8.904766 -9.054282 -9.178469 -9.511447 -9.365744 -8.740106 -8.188363 -7.715772 N/mm^2mid-span top side -10.47912 -9.675834 -8.947877 -8.294583 -7.723701 -7.206049 -6.791578 -6.41479 -6.105211 N/mm^2mid-span bottom side -6.102598 -7.145723 -7.815288 -8.343641 -8.983539 -9.069075 -8.477012 -7.951953 -7.504103 N/mm^2
Prestressing losses at the first support 11.15423 11.11402 11.0274 10.93832 10.89514 10.76665 10.58308 10.41728 10.28006 %Prestressing losses at mid-span after the first deviation block 11.12307 11.07223 10.98597 10.89991 10.85274 10.75272 10.69101 10.62863 10.58635 %Prestressing losses at mid-span after the second deviation block 11.93218 11.88726 11.80371 11.71951 11.67572 11.57198 11.53671 11.50115 11.48361 %Prestressing losses at the second support 13.58159 13.55908 13.48063 13.39709 13.36408 13.22442 13.12019 13.03483 12.97185 %Deflection at t=0 0.378062 0.381341 0.373953 0.364311 0.359685 0.335718 0.284977 0.245182 0.211059 Unity checkDeflection without variable load -0.201902 -0.25385 -0.281205 -0.298899 -0.319651 -0.30935 -0.260584 -0.222405 -0.190005 Unity checkAdditional deflection under mobile load 0.586826 0.516595 0.455878 0.404604 0.362771 0.318792 0.267035 0.226779 0.192968 Unity checkFinal deflection fully loaded (t=∞) -0.006293 -0.081651 -0.129246 -0.164031 -0.198727 -0.203086 -0.171572 -0.146812 -0.125682 Unity checkVertical shear in webs at t=0 0.920781 0.883005 0.795721 0.722152 0.699394 0.636519 0.59001 0.549604 0.537309 Unity checkVertical shear in webs at t=∞ 0.736511 0.687258 0.61579 0.557271 0.529241 0.491774 0.456815 0.426601 0.418137 Unity checkVertical shear + torsion in webs at t=∞ 0.966541 0.901702 0.805451 0.726368 0.689049 0.636085 0.588759 0.547896 0.53545 Unity checkHorizontal shear in top flange 0.190617 0.192914 0.195211 0.197508 0.199806 0.202256 0.205166 0.208076 0.211139 Unity checkHorizontal shear + torsion in top flange 0.912548 0.874403 0.841097 0.811618 0.785043 0.762128 0.743346 0.72678 0.712492 Unity checkHorizontal shear in bottom flange 0.042276 0.044669 0.047062 0.049455 0.051848 0.052646 0.049227 0.04651 0.0434 Unity checkHorizontal shear + torsion in bottom flange 0.794288 0.754554 0.71986 0.689152 0.66147 0.617032 0.529745 0.462138 0.399475 Unity checkFatigue prestressing steel 0.166741 0.137437 0.11388 0.095261 0.080934 0.067138 0.058201 0.051091 0.044774 Unity checkFatigue concrete deviation block top side 0.703712 0.681884 0.659761 0.638493 0.618683 0.59845 0.574681 0.553056 0.534609 Unity checkFatigue concrete deviation block bottom side 0.990855 0.998424 0.991537 0.983196 0.987956 0.958542 0.885371 0.823682 0.769402 Unity checkFatigue concrete mid-span top side 0.787934 0.743081 0.702748 0.666959 0.636664 0.608771 0.584513 0.562448 0.543598 Unity checkFatigue concrete mid-span bottom side 0.92299 0.948056 0.955623 0.958755 0.972329 0.949759 0.87773 0.816947 0.763511 Unity checkFirst natural bending frequency n0 3.239833 3.433065 3.613091 3.790051 3.978044 4.172774 4.426872 4.669173 4.936596 HzRatio v/no 8.57383 8.091248 7.688093 7.329131 6.982772 6.656909 6.274809 5.949185 5.626909 mMass box girder m 10.28 10.4 10.64 10.895 11.03 11.4075 12.1 12.8075 13.465 10^3 kg/mBuckling webs 150.4414 156.8861 163.9233 171.0415 178.4204 185.4541 193.2599 201.1085 208.808 mm

Appendices
242 The elevated metro structure in concrete, UHPC and composite
D.1.2 Box girder with 8 tendons Depth webs 1.65 1.8 1.95 2.1 2.25 2.4 2.55 2.7 2.85 mNumber of shear keys 11 12 13 14 15 16 17 18 19Thickness top flange 0.25 0.25 0.25 0.25 0.25 0.25 0.25 0.25 0.25 mNumber of tendons 8 8 8 8 8 8 8 8 8Depth box girder 2.35 2.51 2.67 2.83 2.99 3.14 3.29 3.43 3.6 mThickness bottom flange 0.45 0.46 0.47 0.48 0.49 0.49 0.49 0.48 0.5 mWidth web 0.21 0.2 0.18 0.17 0.17 0.17 0.18 0.19 0.2 mDistance of deviation blocks to supports 12 13 15 16 17 19 20 22 22.5 m
Dead load box girder 116.08 117.72 118.26 119.53 121.77 123.02 125.52 127.19 131.94 kN/mUltimate resistance moment at t=0 bottom side 0.798788 0.826345 0.835166 0.860645 0.88578 0.907148 0.938517 0.972639 0.99691 Unity checkUltimate resistance moment at t=∞ top side 1.046222 0.863562 0.695275 0.563076 0.46048 0.363565 0.288101 0.211599 0.168796 Unity checkStresses at t=0 deviation block top side -6.225412 -5.85016 -5.749615 -5.417912 -5.072714 -4.816712 -4.424327 -4.041282 -3.694648 N/mm^2
deviation block bottom side -21.20692 -21.13925 -21.00045 -20.97449 -20.75221 -20.75268 -20.65905 -20.84766 -20.09877 N/mm^2mid-span top side -7.789031 -7.040237 -6.438602 -5.903579 -5.4025 -4.943383 -4.486274 -4.043657 -3.694648 N/mm^2mid-span bottom side -19.18466 -19.62567 -20.13804 -20.37635 -20.35259 -20.59983 -20.58461 -20.84479 -20.09877 N/mm^2
Stresses at t=∞ without variable load deviation block top side -7.768961 -7.381157 -7.306337 -6.936911 -6.562929 -6.304282 -5.889581 -5.49515 -5.10831 N/mm^2deviation block bottom side -13.35894 -13.47614 -13.41242 -13.57429 -13.56666 -13.64458 -13.70332 -13.93943 -13.54165 N/mm^2mid-span top side -9.796237 -8.919199 -8.195858 -7.562425 -6.985937 -6.466396 -5.968514 -5.498167 -5.10831 N/mm^2mid-span bottom side -10.73702 -11.52 -12.29899 -12.80392 -13.05408 -13.44896 -13.60847 -13.93578 -13.54165 N/mm^2
Stresses at t=∞fuly loaded deviation block top side -10.58942 -10.09752 -10.02329 -9.537981 -9.047221 -8.724866 -8.191109 -7.698158 -7.171843 N/mm^2deviation block bottom side -9.711187 -10.02137 -10.01156 -10.37086 -10.55635 -10.72362 -10.93779 -11.2723 -11.10926 N/mm^2mid-span top side -13.40193 -12.22487 -11.25243 -10.40034 -9.628106 -8.947004 -8.298812 -7.702264 -7.171843 N/mm^2mid-span bottom side -6.0737 -7.315728 -8.473032 -9.30879 -9.852466 -10.45556 -10.80837 -11.26733 -11.10926 N/mm^2
Prestressing losses at the first support 11.65407 11.59946 11.53942 11.49938 11.42429 11.35154 11.27285 11.19629 11.06166 %Prestressing losses at mid-span after the first deviation block 11.63009 11.57209 11.46096 11.42379 11.35658 11.24401 11.16787 11.05187 10.96421 %Prestressing losses at mid-span after the second deviation block 12.31439 12.26484 12.11404 12.08428 12.02283 11.88166 11.81269 11.67566 11.60468 %Prestressing losses at the second support 13.70699 13.6777 13.49865 13.48085 13.42306 13.26449 13.20733 13.06766 12.98306 %Deflection at t=0 0.335369 0.346775 0.35485 0.353686 0.345801 0.344839 0.338406 0.338764 0.31514 Unity checkDeflection without variable load -0.055374 -0.143323 -0.212563 -0.256184 -0.280716 -0.307587 -0.321202 -0.340258 -0.324026 Unity checkAdditional deflection under mobile load 0.663693 0.564345 0.486204 0.422092 0.368642 0.328819 0.294128 0.267943 0.235558 Unity checkFinal deflection fully loaded (t=∞) 0.165857 0.044792 -0.050495 -0.115486 -0.157836 -0.197981 -0.223159 -0.250944 -0.245507 Unity checkVertical shear in webs at t=0 0.961124 0.955118 0.955469 0.971807 0.934503 0.875838 0.805681 0.731982 0.68367 Unity checkVertical shear in webs at t=∞ 0.74366 0.712496 0.773337 0.757208 0.71196 0.69904 0.626597 0.582439 0.531573 Unity checkVertical shear + torsion in webs at t=∞ 0.974449 0.933925 0.999524 0.979478 0.919985 0.894481 0.801177 0.739222 0.67392 Unity checkHorizontal shear in top flange 0.186022 0.188472 0.190923 0.193373 0.195824 0.198121 0.200418 0.202562 0.205166 Unity checkHorizontal shear + torsion in top flange 1.051782 0.997202 0.950358 0.909857 0.87457 0.843585 0.816041 0.791212 0.769573 Unity checkHorizontal shear in bottom flange 0.024993 0.026115 0.027188 0.028217 0.029204 0.030669 0.032134 0.0342 0.034459 Unity checkHorizontal shear + torsion in bottom flange 0.626216 0.575524 0.532132 0.494678 0.462078 0.442318 0.424751 0.417435 0.387214 Unity checkFatigue prestressing steel 0.188834 0.148425 0.103749 0.085076 0.070428 0.053725 0.046157 0.036966 0.032676 Unity checkFatigue concrete deviation block top side 0.787301 0.759789 0.75601 0.728737 0.701276 0.683655 0.654289 0.628255 0.599675 Unity checkFatigue concrete deviation block bottom side 0.996299 0.997226 0.992307 0.995352 0.989273 0.990801 0.98923 0.999006 0.969763 Unity checkFatigue concrete mid-span top side 0.949277 0.881823 0.826333 0.777906 0.734253 0.69621 0.660336 0.628478 0.599675 Unity checkFatigue concrete mid-span bottom side 0.888571 0.915542 0.945345 0.962608 0.967428 0.982423 0.985157 0.998848 0.969763 Unity checkFirst natural bending frequency n0 2.839565 3.057814 3.286859 3.50879 3.719991 3.91874 4.101903 4.269392 4.470579 HzRatio v/no 9.782406 9.084196 8.451163 7.916626 7.467163 7.088446 6.771925 6.506261 6.213464 mMass box girder m 11.8325 12 12.055 12.185 12.4125 12.54 12.795 12.965 13.45 10^3 kg/mBuckling webs 131.7484 139.4915 147.3084 153.9059 161.7387 169.5143 176.8395 184.8665 193.0263 mm

Appendix D: Results optimisation process
Design study 243
D.1.3 Box girder with 4 tendons Depth webs 3.75 3.9 4.05 4.2 4.35 4.5 4.65 4.8 4.95 mNumber of shear keys 25 26 27 28 29 30 31 32 33Thickness top flange 0.25 0.25 0.25 0.25 0.25 0.25 0.25 0.25 0.25 mNumber of tendons 4 4 4 4 4 4 4 4 4Depth box girder 4.34 4.52 4.7 4.88 5.06 5.24 5.42 5.6 5.78 mThickness bottom flange 0.34 0.37 0.4 0.43 0.46 0.49 0.52 0.55 0.58 mWidth web 0.23 0.23 0.24 0.25 0.26 0.26 0.27 0.28 0.29 mDistance of deviation blocks to supports 14 14 14 14 14 14 14 14 14 m
Dead load box girder 130.60 135.23 141.85 148.62 155.54 160.39 167.53 174.81 182.25 kN/mUltimate resistance moment at t=0 bottom side 0.999156 0.997921 0.996951 0.996519 0.996479 0.997403 0.997946 0.998605 0.999315 Unity checkUltimate resistance moment at t=∞ top side 1.034306 0.975543 0.954693 0.938688 0.926662 0.89013 0.884705 0.881608 0.880525 Unity checkStresses at t=0 deviation block top side -2.043345 -1.986903 -1.923265 -1.861886 -1.803103 -1.753293 -1.699323 -1.648209 -1.599897 N/mm^2
deviation block bottom side -10.75834 -10.15668 -9.452613 -8.831987 -8.280407 -7.916622 -7.462069 -7.050599 -6.676235 N/mm^2mid-span top side -2.57085 -2.502386 -2.432876 -2.366002 -2.302015 -2.242915 -2.184367 -2.128796 -2.07612 N/mm^2mid-span bottom side -10.01818 -9.464987 -8.798305 -8.21001 -7.686652 -7.352291 -6.91967 -6.52777 -6.170977 N/mm^2
Stresses at t=∞ without variable load deviation block top side -3.103554 -2.99695 -2.893636 -2.796459 -2.705078 -2.622014 -2.540802 -2.464343 -2.392322 N/mm^2deviation block bottom side -6.54564 -6.236801 -5.822325 -5.453077 -5.121712 -4.927858 -4.648622 -4.393995 -4.160761 N/mm^2mid-span top side -3.770089 -3.643637 -3.526901 -3.417327 -3.314398 -3.216707 -3.125502 -3.039556 -2.958487 N/mm^2mid-span bottom side -5.610403 -5.36905 -5.009251 -4.687053 -4.396562 -4.242422 -3.994785 -3.768224 -3.560077 N/mm^2
Stresses at t=∞fuly loaded deviation block top side -4.517936 -4.331722 -4.151604 -3.98419 -3.82828 -3.690929 -3.554614 -3.426985 -3.307326 N/mm^2deviation block bottom side -4.561075 -4.445749 -4.207171 -3.987658 -3.784992 -3.695842 -3.514932 -3.346741 -3.18997 N/mm^2mid-span top side -5.41993 -5.200615 -4.994289 -4.802785 -4.624585 -4.463569 -4.308087 -4.162453 -4.025816 N/mm^2mid-span bottom side -3.295459 -3.279833 -3.125216 -2.977678 -2.837311 -2.805307 -2.672364 -2.546629 -2.427673 N/mm^2
Prestressing losses at the first support 9.763572 9.725813 9.661139 9.603766 9.55312 9.534246 9.493843 9.458854 9.428889 %Prestressing losses at mid-span after the first deviation block 10.7446 10.77768 10.78148 10.78856 10.79925 10.83718 10.85363 10.87394 10.89805 %Prestressing losses at mid-span after the second deviation block 12.17702 12.24859 12.28834 12.33199 12.37986 12.45622 12.51065 12.56958 12.63294 %Prestressing losses at the second support 14.06083 14.13856 14.18173 14.23404 14.29496 14.39136 14.4649 14.54578 14.63358 %Deflection at t=0 0.118676 0.106533 0.093666 0.082822 0.073597 0.067436 0.060423 0.054327 0.048996 Unity checkDeflection without variable load -0.058652 -0.0528 -0.043625 -0.035989 -0.029582 -0.027076 -0.022184 -0.017998 -0.014396 Unity checkAdditional deflection under mobile load 0.17231 0.152154 0.134497 0.119619 0.106962 0.096612 0.087175 0.078966 0.071783 Unity checkFinal deflection fully loaded (t=∞) -0.001216 -0.002082 0.001207 0.003884 0.006072 0.005128 0.006874 0.008324 0.009531 Unity checkVertical shear in webs at t=0 0.403441 0.397049 0.372743 0.351027 0.331536 0.327425 0.310321 0.294821 0.280723 Unity checkVertical shear in webs at t=∞ 0.312114 0.303801 0.28904 0.275838 0.263975 0.258534 0.248351 0.239106 0.230683 Unity checkVertical shear + torsion in webs at t=∞ 0.405701 0.394738 0.374111 0.355674 0.339114 0.331985 0.317748 0.304827 0.29306 Unity checkHorizontal shear in top flange 0.216499 0.219256 0.222013 0.224769 0.227526 0.230283 0.233039 0.235796 0.238553 Unity checkHorizontal shear + torsion in top flange 0.664252 0.654529 0.646077 0.638467 0.631606 0.625356 0.619807 0.614793 0.610263 Unity checkHorizontal shear in bottom flange 0.061092 0.058467 0.056235 0.054315 0.052646 0.051181 0.049885 0.04873 0.047695 Unity checkHorizontal shear + torsion in bottom flange 0.472629 0.426096 0.387535 0.354968 0.327156 0.303141 0.282317 0.264069 0.24797 Unity checkFatigue prestressing steel 0.086719 0.078598 0.071156 0.064797 0.059311 0.05484 0.050617 0.046892 0.043585 Unity checkFatigue concrete deviation block top side 0.461284 0.449602 0.438147 0.427423 0.417353 0.408571 0.399623 0.391153 0.383121 Unity checkFatigue concrete deviation block bottom side 0.593323 0.569151 0.54062 0.515495 0.492959 0.477407 0.458478 0.441212 0.425397 Unity checkFatigue concrete mid-span top side 0.508097 0.494595 0.481593 0.469425 0.458001 0.447863 0.43772 0.42812 0.419014 Unity checkFatigue concrete mid-span bottom side 0.57032 0.549113 0.523782 0.501115 0.480705 0.466554 0.449331 0.433613 0.419217 Unity checkFirst natural bending frequency n0 5.253979 5.494511 5.706019 5.911096 6.110502 6.33141 6.521781 6.70809 6.890781 HzRatio v/no 5.286998 5.055551 4.868154 4.69926 4.545908 4.387297 4.259232 4.140937 4.031151 mMass box girder m 13.3125 13.785 14.46 15.15 15.855 16.35 17.0775 17.82 18.5775 10^3 kg/mBuckling webs 222.131 229.1686 236.4649 244.2666 252.1273 258.8415 266.7976 274.8114 282.8829 mm

Appendices
244 The elevated metro structure in concrete, UHPC and composite
D.2 Results optimisation process UHPC box girder C180
D.2.1 Box girder with 6 tendons Depth webs 1.95 2.1 2.25 2.4 2.55 2.7 2.85 3 3.15 mNumber of shear keys 13 14 15 16 17 18 19 20 21Thickness top flange 0.18 0.18 0.18 0.18 0.18 0.18 0.18 0.18 0.18 mNumber of tendons 6 6 6 6 6 6 6 6 6Depth box girder 2.27 2.41 2.57 2.75 2.93 3.1 3.28 3.47 3.66 mThickness bottom flange 0.14 0.13 0.14 0.17 0.2 0.22 0.25 0.29 0.33 mWidth web 0.13 0.14 0.14 0.15 0.16 0.16 0.17 0.18 0.18 mDistance of deviation blocks to supports 15 17 18 18 18 19 19 19 19 m
Dead load box girder 68.35 69.40 71.49 76.84 82.35 85.62 91.36 98.27 103.73 kN/mUltimate resistance moment at t=0 bottom side 0.927842 0.979699 0.998876 0.991904 0.990612 0.996762 0.999957 0.995606 0.991634 Unity checkUltimate resistance moment at t=∞ top side 1.055392 0.844592 0.655365 0.570374 0.510473 0.426843 0.396686 0.3872 0.362394 Unity checkStresses at t=0 deviation block top side -6.059373 -5.329337 -4.927687 -4.711015 -4.458579 -4.243855 -3.996471 -3.819098 -3.687037 N/mm^2
deviation block bottom side -39.6572 -40.86877 -39.09953 -33.68821 -29.62629 -27.7247 -24.92017 -22.0586 -20.11599 N/mm^2mid-span top side -6.720959 -5.667572 -5.14163 -4.918385 -4.660884 -4.361718 -4.112333 -3.933729 -3.799385 N/mm^2mid-span bottom side -38.26833 -40.14471 -38.66249 -33.31336 -29.29644 -27.5433 -24.75569 -21.90975 -19.98055 N/mm^2
Stresses at t=∞ without variable load deviation block top side -8.571311 -7.967731 -7.441283 -6.993425 -6.567226 -6.256469 -5.891984 -5.598958 -5.359139 N/mm^2deviation block bottom side -23.9083 -24.7653 -24.13164 -21.12164 -18.80897 -17.77569 -16.11049 -14.34397 -13.18806 N/mm^2mid-span top side -9.566056 -8.473726 -7.758235 -7.29368 -6.854085 -6.421715 -6.051498 -5.75374 -5.508767 N/mm^2mid-span bottom side -21.82001 -23.68212 -23.48417 -20.57889 -18.34125 -17.52136 -15.88404 -14.14299 -13.00768 N/mm^2
Stresses at t=∞fuly loaded deviation block top side -13.08517 -12.43845 -11.62817 -10.76882 -10.00401 -9.492538 -8.873276 -8.341111 -7.905251 N/mm^2deviation block bottom side -14.43226 -15.19483 -15.57872 -14.2971 -13.20532 -12.79494 -11.87813 -10.78334 -10.11865 N/mm^2mid-span top side -14.64415 -13.22856 -12.11958 -11.22638 -10.43407 -9.738031 -9.106719 -8.563892 -8.118017 N/mm^2mid-span bottom side -11.15947 -13.50344 -14.57488 -13.46999 -12.50412 -12.41709 -11.54673 -10.49407 -9.86216 N/mm^2
Prestressing losses at the first support 5.607631 5.571406 5.547571 5.497114 5.454462 5.412999 5.378921 5.336719 5.315067 %Prestressing losses at mid-span after the first deviation block 5.936955 5.854651 5.856059 5.890747 5.917116 5.889904 5.90828 5.914 5.933902 %Prestressing losses at mid-span after the second deviation block 6.625196 6.523545 6.533471 6.59295 6.644349 6.611864 6.653785 6.678139 6.718922 %Prestressing losses at the second support 7.672354 7.578086 7.579809 7.603724 7.63616 7.578878 7.615436 7.629137 7.670129 %Deflection at t=0 0.42344 0.435882 0.397408 0.314603 0.256182 0.227843 0.191761 0.157841 0.134705 Unity checkDeflection without variable load -0.328954 -0.384548 -0.372879 -0.294388 -0.238907 -0.218189 -0.182674 -0.147326 -0.124854 Unity checkAdditional deflection under mobile load 0.974998 0.87138 0.726141 0.564627 0.451973 0.381982 0.316943 0.26176 0.221111 Unity checkFinal deflection fully loaded (t=∞) -0.003955 -0.094088 -0.130832 -0.106179 -0.08825 -0.090861 -0.077026 -0.060072 -0.05115 Unity checkVertical shear in webs at t=0 0.388812 0.334594 0.319957 0.287651 0.260832 0.247937 0.226988 0.20736 0.201948 Unity checkVertical shear in webs at t=∞ 0.283538 0.252455 0.236996 0.211682 0.190986 0.187129 0.171244 0.160278 0.156524 Unity checkVertical shear + torsion in webs at t=∞ 0.38733 0.341614 0.320151 0.285129 0.256475 0.249339 0.227391 0.21142 0.205854 Unity checkHorizontal shear in top flange 0.222797 0.225382 0.228336 0.23166 0.234984 0.238123 0.241446 0.244954 0.248463 Unity checkHorizontal shear + torsion in top flange 1.177299 1.119003 1.069103 1.028657 0.993652 0.961718 0.935089 0.912488 0.892335 Unity checkHorizontal shear in bottom flange 0.035926 0.041076 0.040674 0.035843 0.03246 0.031222 0.02907 0.026512 0.024574 Unity checkHorizontal shear + torsion in bottom flange 0.854071 0.865957 0.761332 0.598429 0.487661 0.42591 0.362019 0.302733 0.25871 Unity checkFatigue prestressing steel 0.218703 0.166882 0.133056 0.107702 0.089546 0.071256 0.061159 0.051862 0.04505 Unity checkFirst natural bending frequency n0 3.053051 3.205052 3.459239 3.783739 4.085171 4.358157 4.631756 4.914137 5.204224 HzRatio v/no 9.098365 8.666872 8.030026 7.341357 6.79966 6.373744 5.997246 5.652625 5.337545 mMass box girder m 6.96748 7.07408 7.28728 7.83328 8.39488 8.72768 9.31268 10.01728 10.57368 10^3 kg/mBuckling webs 125.0441 131.5375 137.3142 144.0739 150.914 157.0092 163.6383 171.0248 177.6947 mm

Appendix D: Results optimisation process
Design study 245
D.2.2 Box girder with 8 tendons Depth webs 1.5 1.65 1.8 1.95 2.1 2.25 2.4 2.55 2.7 mNumber of shear keys 10 11 12 13 14 15 16 17 18Thickness top flange 0.18 0.18 0.18 0.18 0.18 0.18 0.18 0.18 0.18 mNumber of tendons 8 8 8 8 8 8 8 8 8Depth box girder 1.97 2.06 2.16 2.27 2.44 2.62 2.81 3 3.2 mThickness bottom flange 0.29 0.23 0.18 0.14 0.16 0.19 0.23 0.27 0.32 mWidth web 0.11 0.12 0.13 0.13 0.14 0.15 0.15 0.16 0.17 mDistance of deviation blocks to supports 11 14 18 22 22.5 22.5 22.5 22.5 22.5 m
Dead load box girder 79.14 74.70 71.44 68.35 72.46 77.74 82.97 89.50 97.20 kN/mUltimate resistance moment at t=0 bottom side 0.716334 0.789971 0.875696 0.978491 0.994855 0.999365 0.993497 0.996567 0.995821 Unity checkUltimate resistance moment at t=∞ top side 1.042509 0.810971 0.570799 0.287966 0.19058 0.14499 0.116281 0.109413 0.11827 Unity checkStresses at t=0 deviation block top side -10.07816 -9.48488 -8.467671 -6.946122 -6.303426 -5.852191 -5.603146 -5.221655 -4.900405 N/mm^2
deviation block bottom side -32.40296 -38.28005 -45.46096 -55.25489 -49.87362 -43.70412 -38.34478 -33.72793 -29.4314 N/mm^2mid-span top side -12.13241 -10.492 -8.726026 -6.949062 -6.303426 -5.852191 -5.603146 -5.221655 -4.900405 N/mm^2mid-span bottom side -29.56955 -36.68215 -44.98929 -55.24872 -49.87362 -43.70412 -38.34478 -33.72793 -29.4314 N/mm^2
Stresses at t=∞ without variable load deviation block top side -11.75105 -11.58532 -11.00179 -9.744118 -8.886603 -8.220356 -7.750053 -7.229484 -6.784516 N/mm^2deviation block bottom side -20.83483 -24.28174 -28.65048 -35.41361 -32.54215 -28.90722 -25.68874 -22.77655 -19.98986 N/mm^2mid-span top side -14.69875 -13.05648 -11.38463 -9.748539 -8.886603 -8.220356 -7.750053 -7.229484 -6.784516 N/mm^2mid-span bottom side -16.7691 -21.94759 -27.95155 -35.40432 -32.54215 -28.90722 -25.68874 -22.77655 -19.98986 N/mm^2
Stresses at t=∞fuly loaded deviation block top side -16.03014 -16.30614 -16.06145 -14.81971 -13.46775 -12.34857 -11.48389 -10.63015 -9.884472 N/mm^2deviation block bottom side -14.93274 -16.79168 -19.41324 -24.75833 -23.77431 -21.84208 -19.98996 -18.09054 -16.14195 N/mm^2mid-span top side -20.49096 -18.5632 -16.65511 -14.82663 -13.46775 -12.34857 -11.48389 -10.63015 -9.884472 N/mm^2mid-span bottom side -8.779971 -13.21062 -18.32942 -24.74379 -23.77431 -21.84208 -19.98996 -18.09054 -16.14195 N/mm^2
Prestressing losses at the first support 5.668804 5.705834 5.718967 5.755473 5.692045 5.621334 5.559326 5.488208 5.412577 %Prestressing losses at mid-span after the first deviation block 6.053562 5.975639 5.843614 5.732338 5.741547 5.757505 5.772572 5.765492 5.746728 %Prestressing losses at mid-span after the second deviation block 6.63486 6.519037 6.339514 6.202508 6.230017 6.268511 6.302961 6.313837 6.309976 %Prestressing losses at the second support 7.412699 7.336028 7.206666 7.165982 7.157457 7.154351 7.150493 7.133243 7.102321 %Deflection at t=0 0.269689 0.387369 0.511526 0.648295 0.544069 0.440191 0.355017 0.289517 0.233572 Unity checkDeflection without variable load -0.064042 -0.26301 -0.467383 -0.688722 -0.590783 -0.481147 -0.389017 -0.3158 -0.251469 Unity checkAdditional deflection under mobile load 0.983757 0.972339 0.969571 0.974998 0.769344 0.600788 0.47205 0.379063 0.305326 Unity checkFinal deflection fully loaded (t=∞) 0.263877 0.061103 -0.144193 -0.363723 -0.334335 -0.280885 -0.231667 -0.189445 -0.149694 Unity checkVertical shear in webs at t=0 0.6286 0.516942 0.42731 0.401278 0.36 0.325917 0.315377 0.286404 0.260492 Unity checkVertical shear in webs at t=∞ 0.475012 0.376485 0.332151 0.308113 0.26696 0.235153 0.224118 0.204239 0.190341 Unity checkVertical shear + torsion in webs at t=∞ 0.640053 0.512597 0.446094 0.411905 0.356763 0.313982 0.298652 0.27083 0.250447 Unity checkHorizontal shear in top flange 0.217258 0.21892 0.220766 0.222797 0.225936 0.22926 0.232768 0.236276 0.239969 Unity checkHorizontal shear + torsion in top flange 1.400894 1.319487 1.245192 1.177299 1.121202 1.073938 1.033572 0.999177 0.969856 Unity checkHorizontal shear in bottom flange 0.015052 0.019845 0.026589 0.035926 0.03379 0.030554 0.02707 0.024619 0.022157 Unity checkHorizontal shear + torsion in bottom flange 0.504832 0.594054 0.70954 0.854071 0.705239 0.564035 0.444881 0.363686 0.295865 Unity checkFatigue prestressing steel 0.26153 0.185054 0.1285 0.098705 0.079768 0.065705 0.053934 0.045001 0.037388 Unity checkFirst natural bending frequency n0 2.824662 2.924377 2.994721 3.053051 3.338155 3.646978 3.982579 4.279095 4.575062 HzRatio v/no 9.83402 9.498698 9.275583 9.098365 8.321297 7.616656 6.974821 6.491508 6.071563 mMass box girder m 8.06728 7.61488 7.28208 6.96748 7.38608 7.92428 8.45728 9.12288 9.90808 10^3 kg/mBuckling webs 109.6349 114.6823 121.5154 127.4723 133.7999 141.267 148.4801 155.6115 162.4677 mm

Appendices
246 The elevated metro structure in concrete, UHPC and composite
D.2.3 Box girder with 4 tendons Depth webs 3.3 3.45 3.6 3.75 3.9 4.05 4.2 4.35 4.5 mNumber of shear keys 22 23 24 25 26 27 28 29 30Thickness top flange 0.18 0.18 0.18 0.18 0.18 0.18 0.18 0.18 0.18 mNumber of tendons 4 4 4 4 4 4 4 4 4Depth box girder 3.72 3.89 4.07 4.24 4.42 4.62 4.8 4.98 5.17 mThickness bottom flange 0.24 0.26 0.29 0.31 0.34 0.39 0.42 0.45 0.49 mWidth web 0.18 0.19 0.2 0.2 0.21 0.22 0.22 0.23 0.24 mDistance of deviation blocks to supports 14 14 14 14 14 13 13 13 13 m
Dead load box girder 95.92 101.10 107.45 111.02 117.60 126.38 131.12 138.08 146.22 kN/mUltimate resistance moment at t=0 bottom side 0.990987 0.997026 0.992394 0.998749 0.996191 0.99837 0.998272 0.999748 0.994324 Unity checkUltimate resistance moment at t=∞ top side 1.033175 0.989082 0.962052 0.901965 0.888308 0.896784 0.86188 0.858377 0.864406 Unity checkStresses at t=0 deviation block top side -2.760893 -2.616303 -2.529327 -2.421406 -2.338263 -2.187906 -2.123962 -2.043253 -1.990156 N/mm^2
deviation block bottom side -15.52044 -14.38275 -13.0618 -12.46896 -11.45178 -10.33217 -9.788639 -9.144101 -8.443772 N/mm^2mid-span top side -3.375952 -3.223081 -3.130631 -3.008664 -2.92113 -2.915618 -2.839234 -2.753226 -2.696935 N/mm^2mid-span bottom side -14.64555 -13.56179 -12.29742 -11.7493 -10.77285 -9.542388 -9.041588 -8.42737 -7.758381 N/mm^2
Stresses at t=∞ without variable load deviation block top side -4.27337 -4.062922 -3.902888 -3.736303 -3.595597 -3.334775 -3.224043 -3.104859 -3.010579 N/mm^2deviation block bottom side -9.479464 -8.840968 -8.060312 -7.770347 -7.152136 -6.546147 -6.238288 -5.831029 -5.379487 N/mm^2mid-span top side -5.109129 -4.87628 -4.696809 -4.505626 -4.349058 -4.260687 -4.127077 -3.991805 -3.883731 N/mm^2mid-span bottom side -8.29063 -7.740501 -7.051079 -6.82757 -6.274497 -5.541265 -5.295133 -4.93564 -4.532757 N/mm^2
Stresses at t=∞fuly loaded deviation block top side -6.518609 -6.164498 -5.862412 -5.588498 -5.331079 -4.882004 -4.689797 -4.486389 -4.309364 N/mm^2deviation block bottom side -6.2857 -5.99755 -5.569364 -5.500552 -5.130628 -4.866956 -4.707411 -4.436349 -4.120004 N/mm^2mid-span top side -7.728144 -7.327714 -6.982543 -6.666165 -6.373453 -6.143583 -5.910822 -5.673054 -5.464283 N/mm^2mid-span bottom side -4.565184 -4.423726 -4.145451 -4.179912 -3.916458 -3.497779 -3.432136 -3.238388 -3.000032 N/mm^2
Prestressing losses at the first support 5.50373 5.511169 5.507932 5.530967 5.533493 5.620395 5.639998 5.655553 5.665447 %Prestressing losses at mid-span after the first deviation block 6.547762 6.603071 6.642069 6.711117 6.753656 6.972592 7.033282 7.091086 7.139281 %Prestressing losses at mid-span after the second deviation block 7.73799 7.829742 7.897359 8.005792 8.078448 8.4167 8.512751 8.607316 8.687675 %Prestressing losses at the second support 9.074412 9.19118 9.273801 9.414991 9.507868 9.952718 10.0784 10.20424 10.31063 %Deflection at t=0 0.092304 0.080979 0.068624 0.06281 0.054125 0.043703 0.03937 0.034716 0.029829 Unity checkDeflection without variable load -0.052116 -0.044868 -0.035249 -0.033371 -0.026546 -0.016891 -0.014829 -0.011549 -0.00765 Unity checkAdditional deflection under mobile load 0.239836 0.208523 0.17937 0.15947 0.13943 0.119512 0.106838 0.095402 0.084682 Unity checkFinal deflection fully loaded (t=∞) 0.027829 0.024639 0.024541 0.019786 0.019931 0.022947 0.020784 0.020251 0.020577 Unity checkVertical shear in webs at t=0 0.174642 0.162047 0.149475 0.147746 0.137172 0.133973 0.131775 0.123683 0.115699 Unity checkVertical shear in webs at t=∞ 0.137141 0.126864 0.11989 0.1154 0.109669 0.100002 0.098017 0.093692 0.090881 Unity checkVertical shear + torsion in webs at t=∞ 0.183255 0.169141 0.158948 0.153242 0.144842 0.132982 0.130214 0.123864 0.119304 Unity checkHorizontal shear in top flange 0.249571 0.252709 0.256033 0.259172 0.262496 0.266189 0.269512 0.272836 0.276344 Unity checkHorizontal shear + torsion in top flange 0.861671 0.844641 0.830449 0.816433 0.805073 0.79673 0.787447 0.779022 0.772231 Unity checkHorizontal shear in bottom flange 0.034344 0.033151 0.031097 0.030305 0.028804 0.026248 0.025323 0.024521 0.023378 Unity checkHorizontal shear + torsion in bottom flange 0.340394 0.30635 0.268786 0.246019 0.220302 0.189491 0.173304 0.159504 0.14482 Unity checkFatigue prestressing steel 0.100672 0.090181 0.079375 0.072743 0.065067 0.065383 0.059848 0.054741 0.049599 Unity checkFirst natural bending frequency n0 5.196248 5.428181 5.677106 5.923294 6.154903 6.413093 6.658994 6.866847 7.082864 HzRatio v/no 5.345737 5.117327 4.892947 4.689583 4.513114 4.331417 4.171468 4.045201 3.921829 mMass box girder m 9.77808 10.30588 10.95328 11.31728 11.98808 12.88248 13.36608 14.07588 14.90528 10^3 kg/mBuckling webs 178.9074 185.1942 192.3364 197.7381 204.9531 210.4468 216.8954 223.2039 231.1623 mm

Appendix E: Calculations FRP
Design study 247
Appendix E: Calculations FRP
E.1 Introduction This Appendix presents the calculations of the Fibre Reinforced Polymer sandwich girder. First the material characteristics of the FRP are described. Paragraph 3 deals with the geometry and the structural schematisation of the sandwich girder and its characteristics. The loads to which the sandwich girder is subjected and partial factors are treated in paragraph 4. Furthermore this Appendix describes the calculations on deflection, vibration, stresses and shear of the sandwich girder in respectively the paragraphs 5, 6, 7 and 8. Finally this Appendix deals with the calculations on buckling of the core. The formulas and values used in the calculations are taken from [17] and other references, which are then stated in the text.
E.2 Material characteristics
E.2.1 Carbon fibres, polyacrylonitrile, fibre type: graphite, table 3.3 [7]
Density carbon fibres c 1870 kg/m3
Modulus of elasticity cE 345000 N/mm2
Shear modulus, Appendix A [2] cG 5000 N/mm2
Characteristic tensile strength ctkf 2600 N/mm2
Maximum strain maxc 0.74 %
Volume fraction cV 0.55
E.2.2 Epoxy, Appendix 8 [17]
Density epoxy e 1200 kg/m3
Modulus of elasticity eE 3500 N/mm2
Shear modulus eG 1400 N/mm2
Characteristic tensile strength etkf 45 N/mm2
Maximum strain maxe 4 %
Volume fraction eV 0.45
E.3 Geometry sandwich girder
Figure 179: Cross-section of the sandwich girder

Appendices
248 The elevated metro structure in concrete, UHPC and composite
E.3.1 General Length span L 45 m Width sandwich girder B 9 m Spacing outer skins d 3 m
Thickness outer skins outskint , 0.04 m
Thickness middle skins midskint , 0.01 m
Core depth outskincore tdt ,*2
1*2 2.96 m
Number of core parts nr 6
Buckling length core parts nr
tnrtL midskincore
core,*)1(
0.485 m
Sandwich depth outskintdH ,*2
1*2 3.04 m
E.3.2 Skin For the moment of inertia of the sandwich girder in z-direction (vertical) only the skins are taken into account. As the moment of inertia of the skins self, is small the calculation of the moment of inertia of the girder is only based on the Huygens-Steiner theorem. Moment of inertia of the sandwich girder in z-direction:
42,,
2,,
2
,
841.1)*2*2(***2
)(***22
***2
mtLtB
tLtBd
tBI
midskincoremidskin
midskincorenidskinoutskinz
Fibre layout in the skins:
Percentage of fibres in x-direction (0°) %550 sv
Percentage of fibres in y-direction (90°) %1590 sv
Percentage of fibres in xy-direction (45°) %1545 sv
Percentage of fibres in xy-direction (-45°) %1545 sv
Effective modulus of elasticity in x-direction:
200 /75.106803*)100
*1(*100
* mmNEv
VEv
VE es
ccs
cx
Bending stiffness of the sandwich girder in x-direction:
21710*966.1 NmmIE zx
E.3.3 Core Fibre layout in the core:
Percentage of fibres in x-direction (0°) %150 cv
Percentage of fibres in z-direction (90°) %1590 cv
Percentage of fibres in xz-direction (45°) %3545 cv
Percentage of fibres in xz-direction (-45°) %3545 cv

Appendix E: Calculations FRP
Design study 249
Effective modulus of elasticity in x-direction:
200, /75.31673*)
100*1(*
100* mmNE
vVE
vVE e
ccc
cccorex
Effective modulus of elasticity in z-direction:
29090, /75.31673*)
100*1(*
100* mmNE
vVE
vVE e
ccc
cccorez
Effective shear modulus in xz-direction:
2
4545
/26.1625100*1
100*
1mmNG
G
vV
G
vV
G xze
cc
c
cc
xz
Core triangles
Figure 180: Cross-section of a core triangle
Length core triangle mmLtria 200
Width core triangle mmBtria 100
Thickness core triangle mmttria 4
Number of triangles in the width of the sandwich girder 90tria
tw B
Bn
Number of triangles per metre length 4501000
* tria
twtpm Lnn
Total number of triangles in the sandwich girder 20250* tria
twtr L
Lnn
The cross-sectional area of one triangle in vertical direction:
222,,1 768)(*
2
1*
2
1mmtBBA triatriatriavtria
The cross-sectional area of one triangle in horizontal direction:
21,,1 72.8234**
2/tancos* mmLnr
L
BttA core
tria
triatriatriahtria
Moment of inertia of one triangle:
433 1402553)*2(*)*2(*36
1**
36
1mmtBtLBLI triatriatriatriatriatriatria
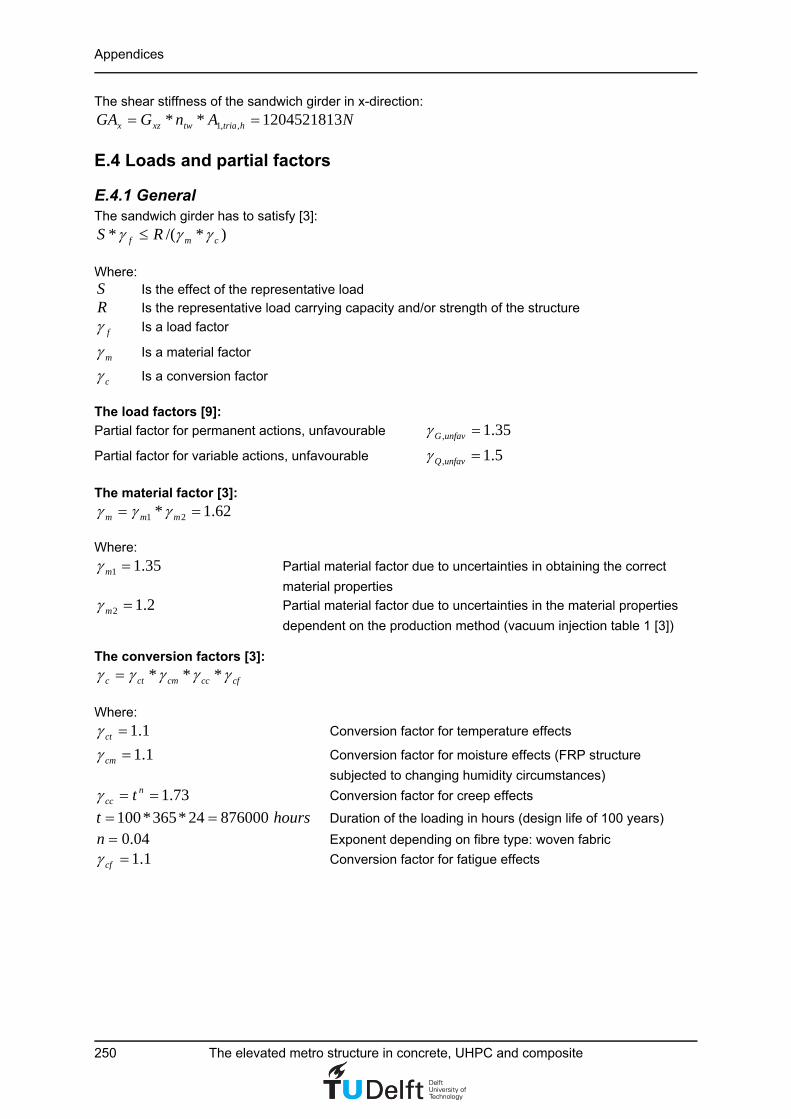
Appendices
250 The elevated metro structure in concrete, UHPC and composite
The shear stiffness of the sandwich girder in x-direction:
NAnGGA htriatwxzx 1204521813** ,,1
E.4 Loads and partial factors
E.4.1 General The sandwich girder has to satisfy [3]:
)*/(* cmf RS
Where: S Is the effect of the representative load R Is the representative load carrying capacity and/or strength of the structure
f Is a load factor
m Is a material factor
c Is a conversion factor
The load factors [9]:
Partial factor for permanent actions, unfavourable 35.1, unfavG
Partial factor for variable actions, unfavourable 5.1, unfavQ
The material factor [3]:
62.1* 21 mmm
Where:
35.11 m Partial material factor due to uncertainties in obtaining the correct
material properties
2.12 m Partial material factor due to uncertainties in the material properties
dependent on the production method (vacuum injection table 1 [3]) The conversion factors [3]:
cfcccmctc ***
Where:
1.1ct Conversion factor for temperature effects
1.1cm Conversion factor for moisture effects (FRP structure
subjected to changing humidity circumstances)
73.1 ncc t Conversion factor for creep effects
hourst 87600024*365*100 Duration of the loading in hours (design life of 100 years)
04.0n Exponent depending on fibre type: woven fabric
1.1cf Conversion factor for fatigue effects

Appendix E: Calculations FRP
Design study 251
In Table 25 the conversion factors per situation are given.
Ultimate limit state Serviceability limit state Strength
strc,
Stability
stac,
Fatigue
fatc,
Deflection
defc,
Vibration
vibc,
First cracking
fcc,
Conversion factor temperature
1.1 1.1 1.1 1.1 1.114 1.1
Conversion factor moisture
1.1 1.1 1.1 1.1 1.114 1.1
Conversion factor creep 15
1.73 1.73 - 1.73 - 1.73
Conversion factor fatigue 16
- 1.1 - 1.1 1.114 1.1
Short term loading
1.21 1.33 1.21 1.33 1.33 1.33
Long term loading
2.09 2.3 1.21 2.3 1.33 2.3
Table 25: Conversion factors
E.4.2 Vertical loads Dead load skins:
mkNgVBtgVBtnr
gVBtgVBtg
eemidskinccmidskin
eeoutskinccoutskinskindead
/0.18)********(*)1(
)********(*2
,,
,,,
Dead load core triangles:
mkNgVgVLnrnAg eecccoretpmvtriatriadead /48.15)****(****,,1,
Dead load foam in core:
mkNg foamdead /0.1, Assumption
Total dead load sandwich structure:
mkNgggg foamdeadtriadeadskindeaddead /48.34,,,
Total permanent load:
mkNg perm /42.34 See B.4.4
Total variable load:
mkNq /29.58var See B.4.4
14 The serviceability limit state vibration should be checked with and without conversion factors. 15 The conversion factor for creep should only be taken into account for long term loading. 16 The conversion factor for fatigue should only be taken into account for stiffness related limit states.

Appendices
252 The elevated metro structure in concrete, UHPC and composite
E.4.3 Loads in the serviceability limit state Uniform distributed load:
mkNqggq permdeadsls /19.127var
Maximum shear force:
kNqLV slsslsEd 2862**5.0.
Maximum bending moment:
kNmLqM slsslsEd 32195**8
1 2,
E.4.4 Loads in the ultimate limit state Uniform distributed load:
mkNqggq unfavQpermunfavGdeadunfavGuls /45.180*** var,,,
Maximum shear force:
kNqLV ulsulsEd 4060**5.0.
Maximum bending moment:
kNmLqM ulsulsEd 45677**8
1 2,
E.5 Deflection The deflection is determined with the formula [3]:
)*/(*8
**
)*/(384
5 4
cmxcmzx GA
Lq
IE
qLw
Where:
mL 45 Length span 21710*966.1 NmmIE zx Bending stiffness of the sandwich structure in x-direction
NGAx 1204521813 Shear stiffness of the sandwich structure in x-direction:
62.1m Material factor
1.1 cmc Conversion factor for time independent deflection
9.1 cccmc Conversion factor for time dependent deflection
2.1 Correction factor for the form of the cross-section of the girder:
rectangular cross-section [3]

Appendix E: Calculations FRP
Design study 253
The deflections at mid-span and unity checks for different phases are: Time Load q Deflection w value
Maximum allowed deflection maxw
Unity check
max/ ww
At t=∞ without variable load permdead gg 58.8 mm mmL 90500/ annotation 17
0.65
Additional deflection under mobile load varq 28.8 mm mmL 301500/
annotation 18 0.96
At t=∞ fully loaded varq
gg permdead
58.8+28.8=
87.6 mm mmL 90500/
annotation 17 0.97
Table 26: The deflections at mid-span and unity checks for different phases As the unity checks show the construction satisfies with respect to deflection for all phases. The normative deflections are the additional deflection under mobile load and the deflection at t=∞ fully loaded. The deflection is mostly determined by the deflection due to bending and not by shearing. To decrease the deflection the bending stiffness should thus be increased (enlarge the moment of inertia). Notice that deflection is indeed a very important verification for FRP bridges.
E.6 Vibration For the sandwich girder only the static analysis is considered. The dynamic metro load is multiplied by the dynamic factor to take into account the dynamic loading. This method of calculation holds when
the first natural frequency of the box girder stays within the prescribed limits [10]. When the limits are exceeded a dynamic analysis is required. A dynamic analysis can prove that the box girder is still determined against the dynamic effects. Such an analysis is however extensive and more difficult and is therefore left out of the design of the box girder. For this design the first natural frequency of the box girder should stay within the limits such that a static analysis is sufficient and a dynamic analysis is not necessary. The check for determining whether a dynamic analysis is required is done according two verifications which are elaborated below. Verification according Annex F [10] The first natural bending frequency of the sandwich girder is [20]:
HzgLg
IECn
dead
zxend 84.5/*2 40
Without partial factors
HzgLg
IECn
dead
cmzxend 98.3/*
)*/(
2 40
With partial factors
Where:
9.94endC Boundary condition coefficient [20] 21710*966.1 NmmIE zx Bending stiffness of the sandwich girder in x-direction
62.1m Material factor
33.1, vibcc Conversion factor for vibration, see Table 25
The velocity of the metros is:
100 / 27.78 /v km h m s
17 The final deflection may not exceed 500/L see 7.4 [11]. 18 The maximum deflection under mobile load is 1500/L [8].

Appendices
254 The elevated metro structure in concrete, UHPC and composite
Table 27: Maximum value of lim0 )/( nv for a simply supported beam or slab and a maximum permitted acceleration of
2max /5.3 sm , Table F.1 [10]
Table 27 gives no maximum value of the velocity divided by the first natural frequency for:
mkgggm dead /10*515.3/ 3
45L m Therefore there is made an extrapolation of the table to determine the maximum value of the velocity divided by the first natural frequency. This is a rough extrapolation as the difference of the values is
large between masses above and below mkgm /10*10 3 , see Table 27.
The extrapolated maximum value of the velocity divided by the first natural frequency is:
mnv 0.10)/( lim0
The verification of the ratio of the velocity over the first natural frequency is:
Okmmnv 0.1075.4/ 0 0n without partial factors
Okmmnv 0.1098.6/ 0 0n with partial factors
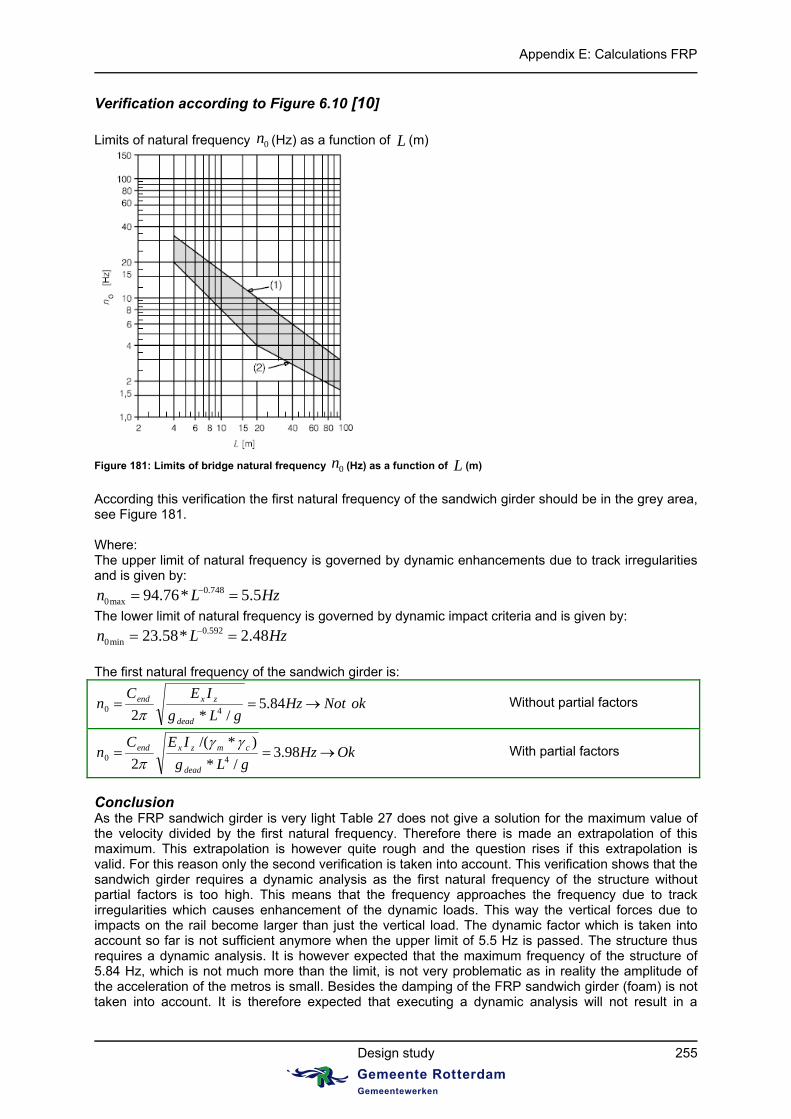
Appendix E: Calculations FRP
Design study 255
Verification according to Figure 6.10 [10]
Limits of natural frequency 0n (Hz) as a function of L (m)
Figure 181: Limits of bridge natural frequency 0n (Hz) as a function of L (m)
According this verification the first natural frequency of the sandwich girder should be in the grey area, see Figure 181. Where: The upper limit of natural frequency is governed by dynamic enhancements due to track irregularities and is given by:
0.7480max 94.76* 5.5n L Hz
The lower limit of natural frequency is governed by dynamic impact criteria and is given by: 0.592
0min 23.58* 2.48n L Hz
The first natural frequency of the sandwich girder is:
okNotHzgLg
IECn
dead
zxend 84.5/*2 40
Without partial factors
OkHzgLg
IECn
dead
cmzxend 98.3/*
)*/(
2 40
With partial factors
Conclusion As the FRP sandwich girder is very light Table 27 does not give a solution for the maximum value of the velocity divided by the first natural frequency. Therefore there is made an extrapolation of this maximum. This extrapolation is however quite rough and the question rises if this extrapolation is valid. For this reason only the second verification is taken into account. This verification shows that the sandwich girder requires a dynamic analysis as the first natural frequency of the structure without partial factors is too high. This means that the frequency approaches the frequency due to track irregularities which causes enhancement of the dynamic loads. This way the vertical forces due to impacts on the rail become larger than just the vertical load. The dynamic factor which is taken into account so far is not sufficient anymore when the upper limit of 5.5 Hz is passed. The structure thus requires a dynamic analysis. It is however expected that the maximum frequency of the structure of 5.84 Hz, which is not much more than the limit, is not very problematic as in reality the amplitude of the acceleration of the metros is small. Besides the damping of the FRP sandwich girder (foam) is not taken into account. It is therefore expected that executing a dynamic analysis will not result in a

Appendices
256 The elevated metro structure in concrete, UHPC and composite
different design. It is however recommended to make a dynamic analysis to be certain of this assumption. A dynamic analysis is not treated in this design as this is too specific and goes far beyond the purpose to design a global FRP railway girder. For a further elaboration of a FRP metro viaduct it is thus recommended to make a dynamic analysis to check whether the structure is determined against the dynamic effects.
E.7 Stresses The maximum compressive and tensile stress in the sandwich girder is:
2,
, /72.372
1*
mmNI
HM
z
ulsEd
skinx
E.7.1 Skin Tension The ultimate tensile strength of the skin is:
2max
,, /25.233*
*mmN
Ef c
cm
skinxskint
Where:
09.2,, longstrcc Conversion factor for strength, see Table 25
Unity check tensile stress in the skin:
Okf skint
skinx 0.116.0,
,
Compression There are two failure modes in compression which apply to the skin, see Figure 182.
Figure 182: Sandwich material failure modes in compression: (a) skin wrinkling; (b) skin dimpling Skin wrinkling [7]:
2
3/1
,,, /63.2367
**
**
*2
1mmN
GEEf
cm
xz
cm
corex
cm
skinxwrinklingc
Skin dimpling [7]:
22/3,
,dim, /2.1922)/(*
**75.0 mmNLt
Ef triaoutskin
cm
skinxplingc
Where:
3.2,, longstacc Conversion factor for stability, see Table 25

Appendix E: Calculations FRP
Design study 257
The compressive strength of the skin equals the smallest strength. Dimpling of the skin is thus the normative compressive failure mode. Unity check compressive stress in the skin:
Okf plingc
skinx 0.102.0dim,
,
E.7.2 Core The ultimate tensile strength of the core is:
2max
,, /17.69*
*mmN
Ef c
cm
corexcoret
Where:
09.2,, longstrcc Conversion factor for strength, see Table 25
Unity check tensile stress in the core:
Okf coret
skinx 0.155.0,
,
E.7.3 Flexural strength The flexural strength of the sandwich girder is [7]:
kNmE
fE
ttBMcm
corexcoret
cm
xcoreoutskinRd 92.248548
*/*
**** ,
,,
Where:
09.2,, longstrcc Conversion factor for strength, see Table 25
Unity check flexural strength:
OkM
M
Rd
ulsEd 0.118.0,
E.8 Shear It is expected that all the shear stresses are carried in the core. The shear strength of this material with its volume fraction of fibres and fibre orientation is not known and should be determined by experiments. For this design it is however assumed that a quite conservative shear strength of:
2/50 mmN will do, considering the shear strengths given in [i7]. The design shear strength then becomes:
2/76.14*
50mmN
cmRd
Where:
09.2,, longstrcc Conversion factor for strength, see Table 25

Appendices
258 The elevated metro structure in concrete, UHPC and composite
E.8.1 Transverse shear The transverse shear force is:
2
,,1
, /48.5*
mmNnA
V
twhtria
ulsEdEd
Unity check transverse shear:
OkRd
Ed 0.137.0
E.8.2 Parallel shear The parallel shear force is:
2
,,1
, /77.10
**
*mmN
nt
AI
SV
twcore
htriaz
ulsEdEd
Where:
3,,1
,,,,,
222.14
**
)(**)22(**2
**
mt
nA
tLBttLBtd
BtS
coretwhtria
midskincoremidskinmidskincoremidskinoutskin
Unity check parallel shear:
OkRd
Ed 0.173.0
E.9 Buckling of the core The critical buckling force of the core is:
kNL
nIE
Fcorebuc
twtriacm
corez
cr 44.45007
***
*
2,
,2
Where:
mLL corecorebuc 485.0,
3.2,, longstacc Conversion factor for stability, see Table 25
The maximum buckling force is:
kNqLV ulsulsEd 15.4060**5.0.
Unity check buckling of the core:
OkF
V
cr
crulsEd 0.190.0*,
Where:
10cr Factor by which the design loading would have to be
increased to cause elastic instability in a global mode

Appendix F: Infracore principle
Design study 259
Appendix F: Infracore principle

Appendices
260 The elevated metro structure in concrete, UHPC and composite

Appendix G: Calculations column + foundation
Design study 261
Appendix G: Calculations column + foundation
G.1 Column + foundation in combination with a concrete box girder
G.1.1 General This Appendix presents the calculations of the column + foundation of the elevated metro structure with a concrete box girder. First the cross-sectional properties of the column are described. Paragraph 3 deals with the loads to which the column is subjected. The geometry and characteristics of the foundation are treated in paragraph 4. Furthermore this Appendix describes the calculations on stability and stiffness of the structure in respectively the paragraphs 5 and 6. The forces in the piles and stresses in the column are treated in paragraph 7 and 8. Finally this Appendix gives an overview of the weight contribution of the different elements of the structure. The formulas and values used in the calculations are taken from [11] and other references, which are then stated in the text.
G.1.2 Column C50/60
Figure 183: Schematisation of the elevated metro structure with a concrete box girder
Figure 184: Cross-section column
Length span box girder mL 45
Height column mH 15
Width of the column mwcolumn 06.2
Inner radius in drainage tube mrin 15.0
Moment of inertia of the column 444 5.1**4
1*
12
1mrwI incolumncolumn
Cross-sectional area of the column 222 173.4* mrwA incolumncolumn
Section modulus column 3457.12/
mw
IW
column
ccolumn
Dead load column:
kNgHAF cccolumnv 11.1535***,
Where:
3/2500 mkgc Density of concrete 2/81.9 smg Acceleration due to gravity

Appendices
262 The elevated metro structure in concrete, UHPC and composite
G.1.3 Loads at the top of the column Vertical force at the top of the column
kNQQQLqF wideningvanchoragevtendonsvtotviaductv 9320* ,,,,
Where:
mkNqggq permdeadtot /73.194var
mkNgdead /02.102 Dead load box girder
mkNg perm /42.34 Permanent load at the box girder
mkNq /29.58var Variable load of the metros and snow loading
kNgAnLQ pptendonstendontendonsv 66.115****, Dead load tendons
maLafLtendon 101.45*2*2 22 Length tendon
mf 23.1 Tendon eccentricity at mid-span
ma 15 Distance of deviation blocks to supports
6tendonsn Number of tendons 25550mmAp Cross-sectional area of one tendon
3/7850 mkgp Density prestressing steel
kNgVQ canchorageanchoragev 2.196**, Dead load extra concrete for anchorage and
deviation blocks of the box girder 38mVanchorage Assumed volume of extra concrete for
anchorage and deviation blocks of the box girder
kNgVQ cwideningwideningv 25.245**, Dead load extra concrete for widening of the
column at the top 310mVwidening Assumed volume of extra concrete for
widening of the column at the top Horizontal force at the top of the column in longitudinal direction of the viaduct
kNLag
qLa
g
qF d
moba
moblongh 25.326******,
Where:
trackpermkNqmob /5.25 Mobile load (metros)
07.1)10/(41 L Dynamic factor 2/2.1 smaa Maximum acceleration of the metros [8] 2/4.1 smad Maximum deceleration of the metros [8]
Horizontal force at the top of the column in transversal direction of the viaduct
kNQLHqF sidewfviaductwindtransh 63.485**,
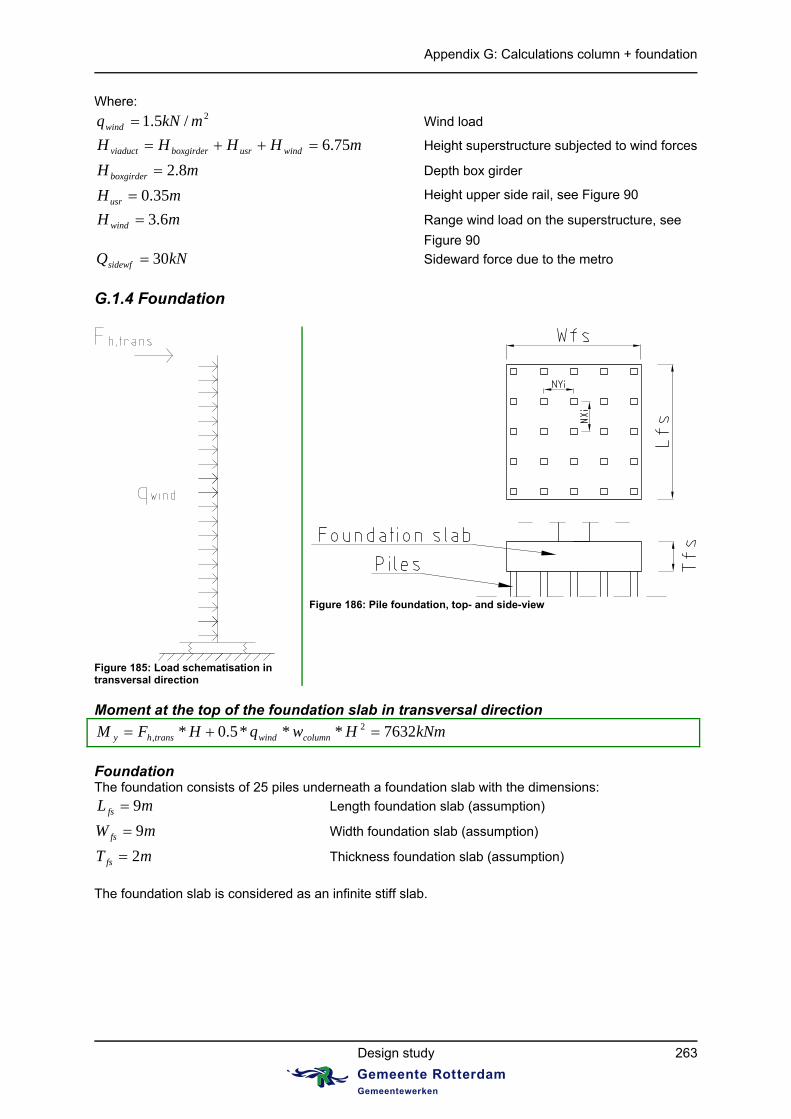
Appendix G: Calculations column + foundation
Design study 263
Where: 2/5.1 mkNqwind Wind load
mHHHH windusrboxgirderviaduct 75.6 Height superstructure subjected to wind forces
mHboxgirder 8.2 Depth box girder
mHusr 35.0 Height upper side rail, see Figure 90
mH wind 6.3 Range wind load on the superstructure, see
Figure 90
kNQsidewf 30 Sideward force due to the metro
G.1.4 Foundation
Figure 185: Load schematisation in transversal direction
Figure 186: Pile foundation, top- and side-view
Moment at the top of the foundation slab in transversal direction
kNmHwqHFM columnwindtranshy 7632***5.0* 2,
Foundation The foundation consists of 25 piles underneath a foundation slab with the dimensions:
mLfs 9 Length foundation slab (assumption)
mW fs 9 Width foundation slab (assumption)
mTfs 2 Thickness foundation slab (assumption)
The foundation slab is considered as an infinite stiff slab.

Appendices
264 The elevated metro structure in concrete, UHPC and composite
Figure 187: Rotation of the stiff foundation slab Dead load of the foundation slab:
kNgTWLF cfsfsfsfsv 05.3973****,
The spring stiffness of a pile is (assumption):
mkNk /100000 The force in a pile due to a moment is:
** ipile nkF
The moment at the foundation is:
22 *** ii nknkM
The rotation stiffness of the foundation is:
22
***
ii nk
nkMC
The rotation stiffness of the foundation in transversal direction is:
radkNmnykC iy /20000000*2
The rotation stiffness of the foundation in longitudinal direction is:
radkNmnxkC ix /20000000*2

Appendix G: Calculations column + foundation
Design study 265
G.1.5 Stability
Figure 188: Structural model
kNl
IEF
c
columneffccr 87.278777
**2
,2
1,
Critical buckling force mode 1
Where:
2
0, /49.16944
),(1mmN
t
EE cm
effc
Effective modulus of elasticity of concrete
2/87.37277 mmNEcm Secant modulus of elasticity of concrete
2.1),( 0 t Creep coefficient, see B.5.5: creep
mHlc 30*2 Effective length column
kNH
CF y
cr 33.13333332, Critical buckling force mode 2
Total critical buckling force:
kNFFFF totcr
crcrtotcr
59.230569111
,2,1,,
Vertical force at the top of the column, ULS:
kNQQQLqF unfavGwideningvunfavGanchoragevunfavGtendonsvulstotulsviaductv 4.12975**** ,,,,,,,,, Where:
mkNqggq unfavQpermunfavGdeadunfavGulstot /63.271*** var,,,,
35.1, unfavG
5.1, unfavQ
Factor n:
stableisstructureOkF
Fn
ulsviaductv
totcr ,1077.17,,
,
2nd degree magnification factor:
06.11
n
n

Appendices
266 The elevated metro structure in concrete, UHPC and composite
G.1.6 Stiffness
mIE
HF
columneffc
transhh 0215.0
**3
*
,
3, Deflection at the top due to the horizontal force at the
top of the column
mIE
Hwq
columneffc
columnwindq 0008.0
**8
**
,
4
Deflection at the top due to wind load at the column
mHC
M
y
yc 0057.0* Deflection at the top due to rotation of the foundation
slab Total 2nd order deflection at the top:
mn
ncqhtot 0297.0
1*
The maximum allowed deflection at the top:
mH
03.0500max
Deflection check:
enoughstiffisstructureOkmmtot ,03.00297.0 max
The 2nd order rotation of the foundation slab:
radn
n
C
M
y
y 0004.01
*
The maximum allowed rotation of the foundation slab [23]:
rad0033.0300
1max
Rotation check:
Okradrad 0033.00004.0 max
G.1.7 Foundation piles Pile force Total vertical force at the piles, ULS:
kNFFFF unfavGfsvunfavGcolumnvulsviaductvpilesv 41.20411** ,,,,,,,
Total horizontal force at the piles, ULS:
kNHwqFF columnunfavQwindunfavQtranshh 96.797**** ,,,
Total moment at the foundation slab in transversal direction, ULS:
kNmFHwqHFM ulsviaductvtotcolumnunfavQwindunfavQtranshy 76.11832*****5.0** ,,2
,,,

Appendix G: Calculations column + foundation
Design study 267
Total moment at the foundation slab in longitudinal direction, ULS:
kNmHFM unfavQlonghx 56.7340** ,,
The number of piles:
25pn
The maximum allowed pile force (assumption):
pileperkNP allow 1200max,
kNn
FP
p
pilesvv 46.816,
Load on piles due to vertical load
kNknyC
MP
y
ymy 66.236** max
Load on the outside piles in transversal direction due
to the moment in the transversal direction
kNknxC
MP
x
xmx 81.146** max
Load on the outside piles in longitudinal direction due
to the moment in the longitudinal direction Where:
mny 4max
mnx 4max
The maximum pile force in the corner piles of the foundation slab is:
OkkNPkNPPPP allowmxmyv 120092.1199 max,max
The minimum pile force in the corner piles of the foundation slab is:
kNPPPP mxmyv 99.432min
Most likely in all load phases the piles will not be in tension considering the large vertical force. Pile head moment due to horizontal force The pile is schematised as a beam of infinite length on one side and is fixed in the foundation slab on the other side. The pile which is supported by linear elastic springs (soil) is subjected to a concentrated horizontal force at the foundation slab. The structural model for a pile subjected to the horizontal force is shown in Figure 189.

Appendices
268 The elevated metro structure in concrete, UHPC and composite
Figure 189: Structural model piles Characteristics of the piles:
mwpile 42.0 Width of the pile
mhpile 42.0 Depth of the pile
21764.0* mhwA pilepilepile Cross-sectional area of the pile
43 0026.0**12
1mhwI pilepilepile Moment of inertia of the pile
2/87.37277 mmNEE cmpile Modulus of elasticity of the pile, assumption of
uncracked pile as the vertical pile force is large
5.1idtheffectivewc Factor for determining the effective width of the pile
3/3000 mkNk Modulus of subgrade reaction 2/1890** mkNcwkk idtheffectivewpilepile Modulus of subgrade reaction of pile
The pile head moment in one pile is [19]:
kNmn
F
M p
h
pile 18.30*2
*2
1
Where:
14 26.0
4 m
IE
k
pilepile
pile
The required reinforcement at one side of the pile is:
285.202* mmAfAz
Msyds
pile

Appendix G: Calculations column + foundation
Design study 269
Where: mdz 342.0*9.0 Lever arm of internal forces
mchd pile 38.0 Effective depth
mmc 40 Concrete cover, see B.3.3 2/435/ mmNff sykyd Design yield strength of reinforcement
2/500 mmNf yk Characteristic yield strength of reinforcement
15.1s Partial factor for reinforcing steel
The total required reinforcement in a pile is:
2, 42.811*4 mmAA stots
The reinforcement percentage in a pile then becomes:
%46.0%100*,0
pile
tots
A
A
The maximum reinforcement percentage in a column/pile is:
%4max
Reinforcement percentage check
Ok %4%46.0 max0
G.1.8 Stresses in column Total vertical force at the bottom of the column, ULS:
kNFFF unfavGcolumnvulsviaductvcolumnbottotv 8.15047* ,,,,,,,
Total moment at the bottom of the column in transversal direction, ULS:
kNmFHwqHFM ulsviaductvtotcolumnunfavQwindunfavQtranshy 76.11832*****5.0** ,,2
,,,
The compressive stress in the column due to the vertical force is:
2,,, /61.3 mmNA
F
column
columnbottotvn
The stress in the column due to the moment in transversal direction is:
2/12.8 mmNW
M
column
ym
The maximum compressive stress in the column is:
2max /73.11 mmNmnc
The minimum compressive stress in the column is:
2min /52.4 mmNmnc
There arises tension in the column which means that the section is cracked. The assumption that the effective modulus of elasticity of concrete should be taken into account is thus correct.
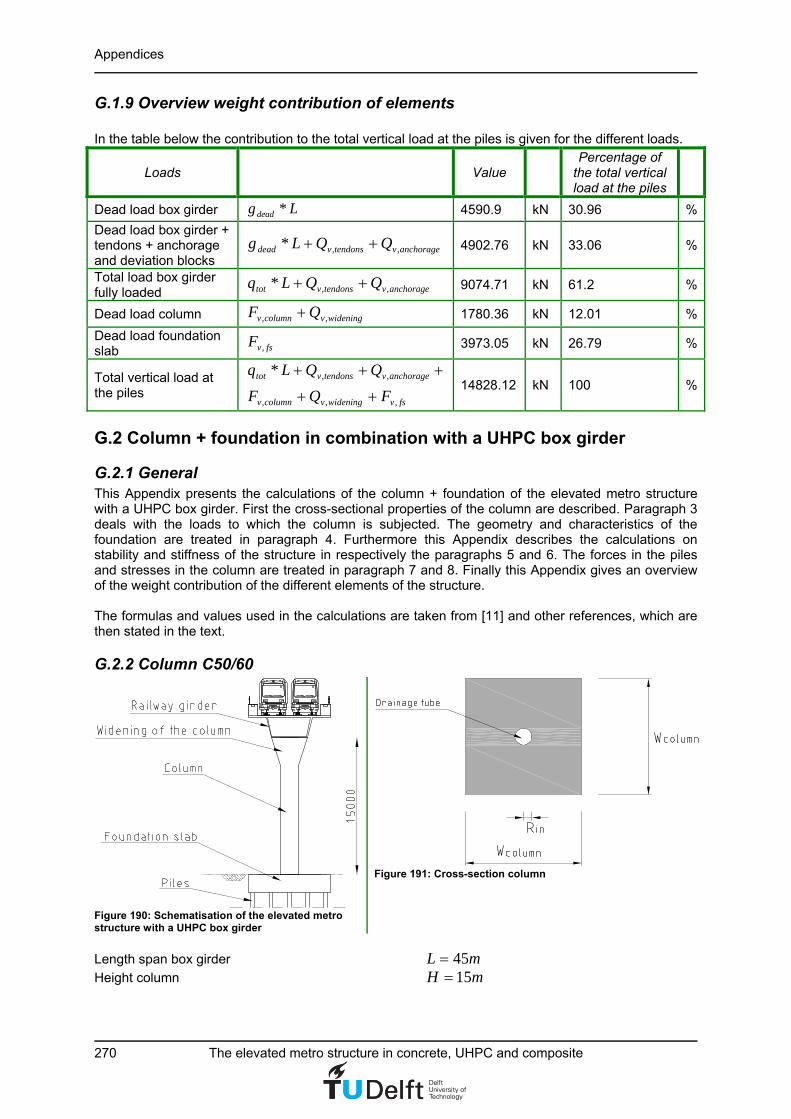
Appendices
270 The elevated metro structure in concrete, UHPC and composite
G.1.9 Overview weight contribution of elements In the table below the contribution to the total vertical load at the piles is given for the different loads.
Loads Value Percentage of
the total vertical load at the piles
Dead load box girder Lgdead * 4590.9 kN 30.96 %
Dead load box girder + tendons + anchorage and deviation blocks
anchoragevtendonsvdead QQLg ,,* 4902.76 kN 33.06 %
Total load box girder fully loaded anchoragevtendonsvtot QQLq ,,* 9074.71 kN 61.2 %
Dead load column wideningvcolumnv QF ,, 1780.36 kN 12.01 %
Dead load foundation slab fsvF , 3973.05 kN 26.79 %
Total vertical load at the piles
fsvwideningvcolumnv
anchoragevtendonsvtot
FQF
QQLq
,,,
,,*
14828.12 kN 100 %
G.2 Column + foundation in combination with a UHPC box girder
G.2.1 General This Appendix presents the calculations of the column + foundation of the elevated metro structure with a UHPC box girder. First the cross-sectional properties of the column are described. Paragraph 3 deals with the loads to which the column is subjected. The geometry and characteristics of the foundation are treated in paragraph 4. Furthermore this Appendix describes the calculations on stability and stiffness of the structure in respectively the paragraphs 5 and 6. The forces in the piles and stresses in the column are treated in paragraph 7 and 8. Finally this Appendix gives an overview of the weight contribution of the different elements of the structure. The formulas and values used in the calculations are taken from [11] and other references, which are then stated in the text.
G.2.2 Column C50/60
Figure 190: Schematisation of the elevated metro structure with a UHPC box girder
Figure 191: Cross-section column
Length span box girder mL 45
Height column mH 15

Appendix G: Calculations column + foundation
Design study 271
Width of the column mwcolumn 02.2
Inner radius drainage tube mrin 15.0
Moment of inertia of the column 444 387.1**4
1*
12
1mrwI incolumncolumn
Cross-sectional area of the column 222 010.4* mrwA incolumncolumn
Section modulus column 3373.12/
mw
IW
column
ccolumn
Dead load column:
kNgHAF cccolumnv 07.1475***,
Where:
3/2500 mkgc Density of concrete 2/81.9 smg Acceleration due to gravity
G.2.3 Loads at the top of the column Vertical force at the top of the column
kNQQQLqF wideningvanchoragevtendonsvtotviaductv 34.7834* ,,,,
Where:
mkNqggq permdeadtot /11.162var
mkNgdead /4.69 Dead load box girder
mkNg perm /42.34 Permanent load at the box girder
mkNq /29.58var Variable load of the metros and snow loading
kNgAnLQ pptendonstendontendonsv 59.115****, Dead load tendons
maLafLtendon 077.45*2*2 22 Length tendon
mf 143.1 Tendon eccentricity at mid-span
ma 17 Distance of deviation blocks to supports
6tendonsn Number of tendons 25550mmAp Cross-sectional area of one tendon
3/7850 mkgp Density prestressing steel
kNgVQ UHPCanchorageanchoragev 54.178**, Dead load extra UHPC for anchorage and
deviation blocks of the box girder 37mVanchorage Assumed volume of extra UHPC for
anchorage and deviation blocks of the box girder
3/2600 mkgUHPC Density of UHPC

Appendices
272 The elevated metro structure in concrete, UHPC and composite
kNgVQ cwideningwideningv 25.245**, Dead load extra concrete for widening of the
column at the top 310mVwidening Assumed volume of extra concrete for
widening of the column at the top Horizontal force at the top of the column in longitudinal direction of the viaduct
kNLag
qLa
g
qF d
moba
moblongh 25.326******,
Where:
trackpermkNqmob /5.25 Mobile load (metros)
07.1)10/(41 L Dynamic factor 2/2.1 smaa Maximum acceleration of the metros [8] 2/4.1 smad Maximum deceleration of the metros [8]
Horizontal force at the top of the column in transversal direction of the viaduct
kNQLHqF sidewfviaductwindtransh 3.459**,
Where:
2/5.1 mkNqwind Wind load
mHHHH windusrboxgirderviaduct 36.6 Height superstructure subjected to wind forces
mHboxgirder 41.2 Depth box girder
mHusr 35.0 Height upper side rail, see Figure 145
mH wind 6.3 Range wind load on the superstructure, see
Figure 145
kNQsidewf 30 Sideward force due to the metro
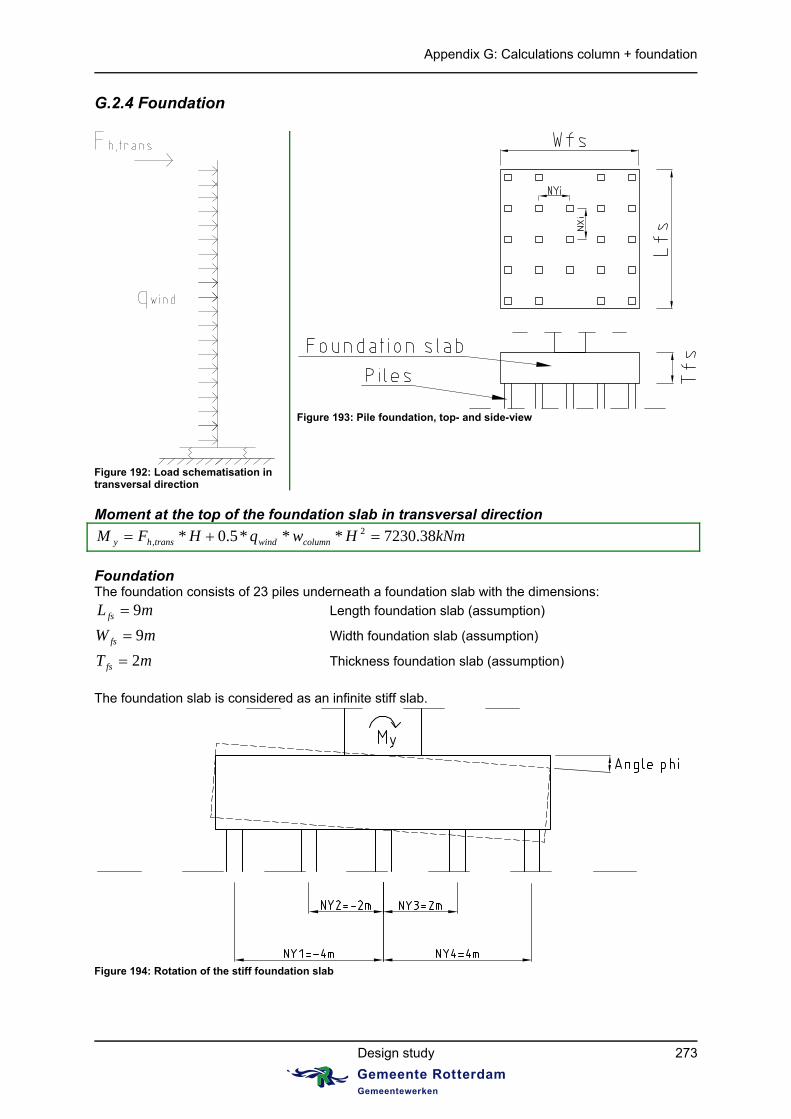
Appendix G: Calculations column + foundation
Design study 273
G.2.4 Foundation
Figure 192: Load schematisation in transversal direction
Figure 193: Pile foundation, top- and side-view
Moment at the top of the foundation slab in transversal direction
kNmHwqHFM columnwindtranshy 38.7230***5.0* 2,
Foundation The foundation consists of 23 piles underneath a foundation slab with the dimensions:
mLfs 9 Length foundation slab (assumption)
mW fs 9 Width foundation slab (assumption)
mTfs 2 Thickness foundation slab (assumption)
The foundation slab is considered as an infinite stiff slab.
Figure 194: Rotation of the stiff foundation slab

Appendices
274 The elevated metro structure in concrete, UHPC and composite
Dead load of the foundation slab:
kNgTWLF cfsfsfsfsv 05.3973****,
The spring stiffness of a pile is (assumption):
mkNk /100000 The force in a pile due to a moment is:
** ipile nkF
The moment at the foundation is:
22 *** ii nknkM
The rotation stiffness of the foundation is:
22
***
ii nk
nkMC
The rotation stiffness of the foundation in transversal direction is:
radkNmnykC iy /20000000*2
The rotation stiffness of the foundation in longitudinal direction is:
radkNmnxkC ix /16800000*2
G.2.5 Stability
Figure 195: Structural model
kNl
IEF
c
columneffccr 18.257742
**2
,2
1,
Critical buckling force mode 1
Where:
2
0, /49.16944
),(1mmN
t
EE cm
effc
Effective modulus of elasticity of concrete
2/87.37277 mmNEcm Secant modulus of elasticity of concrete
2.1),( 0 t Creep coefficient, see B.5.5: creep
mHlc 30*2 Effective length column

Appendix G: Calculations column + foundation
Design study 275
kNH
CF y
cr 33.13333332, Critical buckling force mode 2
Total critical buckling force:
kNFFFF totcr
crcrtotcr
90.215989111
,2,1,,
Vertical force at the top of the column, ULS:
kNQQQLqF unfavGwideningvunfavGanchoragevunfavGtendonsvulstotulsviaductv 81.10969**** ,,,,,,,,, Where:
mkNqggq unfavQpermunfavGdeadunfavGulstot /59.227*** var,,,,
35.1, unfavG
5.1, unfavQ
Factor n:
stableisstructureOkF
Fn
ulsviaductv
totcr ,1069.19,,
,
2nd degree magnification factor:
05.11
n
n
G.2.6 Stiffness
mIE
HF
columneffc
transhh 0220.0
**3
*
,
3, Deflection at the top due to the horizontal force at the
top of the column
mIE
Hwq
columneffc
columnwindq 0008.0
**8
**
,
4
Deflection at the top due to wind load at the column
mHC
M
y
yc 0054.0* Deflection at the top due to rotation of the foundation
slab Total 2nd order deflection at the top:
mn
ncqhtot 0297.0
1*
The maximum allowed deflection at the top:
mH
03.0500max
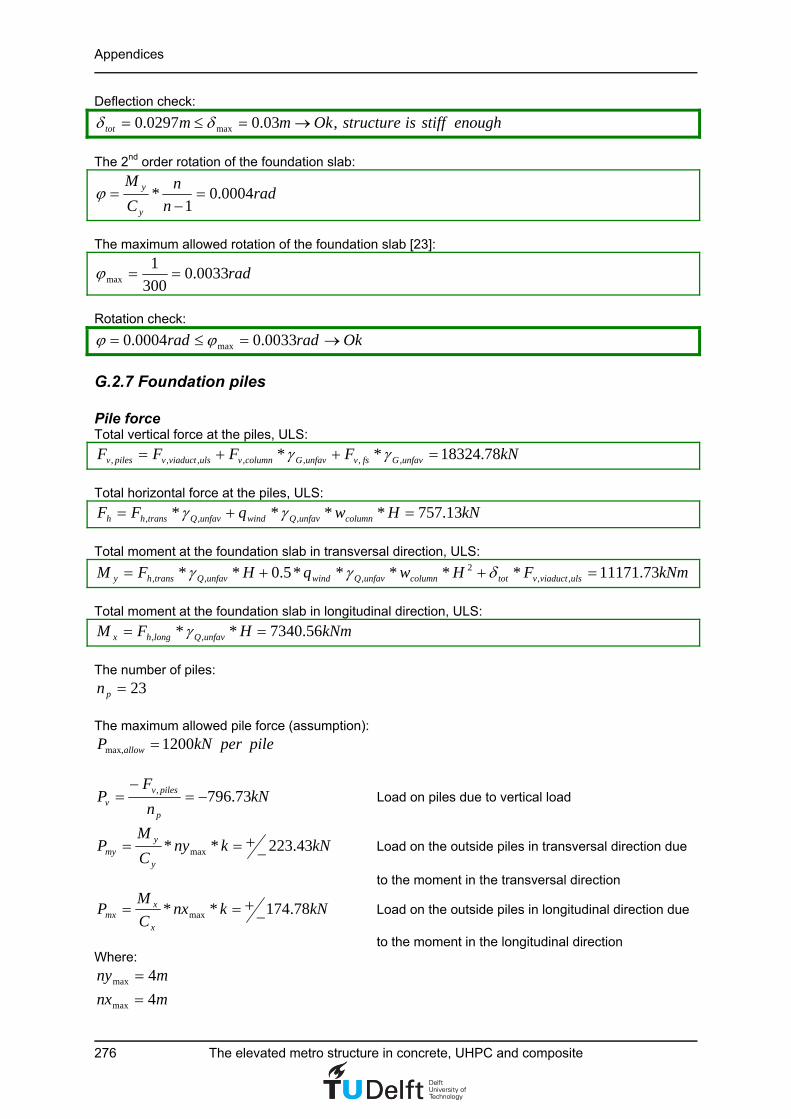
Appendices
276 The elevated metro structure in concrete, UHPC and composite
Deflection check:
enoughstiffisstructureOkmmtot ,03.00297.0 max
The 2nd order rotation of the foundation slab:
radn
n
C
M
y
y 0004.01
*
The maximum allowed rotation of the foundation slab [23]:
rad0033.0300
1max
Rotation check:
Okradrad 0033.00004.0 max
G.2.7 Foundation piles Pile force Total vertical force at the piles, ULS:
kNFFFF unfavGfsvunfavGcolumnvulsviaductvpilesv 78.18324** ,,,,,,,
Total horizontal force at the piles, ULS:
kNHwqFF columnunfavQwindunfavQtranshh 13.757**** ,,,
Total moment at the foundation slab in transversal direction, ULS:
kNmFHwqHFM ulsviaductvtotcolumnunfavQwindunfavQtranshy 73.11171*****5.0** ,,2
,,,
Total moment at the foundation slab in longitudinal direction, ULS:
kNmHFM unfavQlonghx 56.7340** ,,
The number of piles:
23pn
The maximum allowed pile force (assumption):
pileperkNP allow 1200max,
kNn
FP
p
pilesvv 73.796,
Load on piles due to vertical load
kNknyC
MP
y
ymy 43.223** max
Load on the outside piles in transversal direction due
to the moment in the transversal direction
kNknxC
MP
x
xmx 78.174** max
Load on the outside piles in longitudinal direction due
to the moment in the longitudinal direction Where:
mny 4max
mnx 4max

Appendix G: Calculations column + foundation
Design study 277
The maximum pile force in the corner piles of the foundation slab is:
OkkNPkNPPPP allowmxmyv 120094.1194 max,max
The minimum pile force in the corner piles of the foundation slab is:
kNPPPP mxmyv 52.398min
Most likely in all load phases the piles will not be in tension considering the large vertical force. Pile head moment due to horizontal force The pile is schematised as a beam of infinite length on one side and is fixed in the foundation slab on the other side. The pile which is supported by linear elastic springs (soil) is subjected to a concentrated horizontal force at the foundation slab. The structural model for a pile subjected to the horizontal force is shown in Figure 196.
Figure 196: Structural model piles Characteristics of the piles:
mwpile 42.0 Width of the pile
mhpile 42.0 Depth of the pile
21764.0* mhwA pilepilepile Cross-sectional area of the pile
43 0026.0**12
1mhwI pilepilepile Moment of inertia of the pile
2/87.37277 mmNEE cmpile Modulus of elasticity of the pile, assumption of
uncracked pile as the vertical pile force is large
5.1idtheffectivewc Factor for determining the effective width of the pile
3/3000 mkNk Modulus of subgrade reaction 2/1890** mkNcwkk idtheffectivewpilepile Modulus of subgrade reaction of pile

Appendices
278 The elevated metro structure in concrete, UHPC and composite
The pile head moment in one pile is [19]:
kNmn
F
M p
h
pile 12.31*2
*2
1
Where:
14 26.0
4 m
IE
k
pilepile
pile
The required reinforcement at one side of the pile is:
221.209* mmAfAz
Msyds
pile
Where:
mdz 342.0*9.0 Lever arm of internal forces
mchd pile 38.0 Effective depth
mmc 40 Concrete cover, see B.3.3 2/435/ mmNff sykyd Design yield strength of reinforcement
2/500 mmNf yk Characteristic yield strength of reinforcement
15.1s Partial factor for reinforcing steel
The total required reinforcement in a pile is:
2, 84.836*4 mmAA stots
The reinforcement percentage in a pile then becomes:
%47.0%100*,0
pile
tots
A
A
The maximum reinforcement percentage in a column/pile is:
%4max
Reinforcement percentage check
Ok %4%47.0 max0
G.2.8 Stresses in column Total vertical force at the bottom of the column, ULS:
kNFFF unfavGcolumnvulsviaductvcolumnbottotv 16.12961* ,,,,,,,
Total moment at the bottom of the column in transversal direction, ULS:
kNmFHwqHFM ulsviaductvtotcolumnunfavQwindunfavQtranshy 73.11171*****5.0** ,,2
,,,
The compressive stress in the column due to the vertical force is:
2,,, /23.3 mmNA
F
column
columnbottotvn

Appendix G: Calculations column + foundation
Design study 279
The stress in the column due to the moment in transversal direction is:
2/13.8 mmNW
M
column
ym
The maximum compressive stress in the column is:
2max /37.11 mmNmnc
The minimum compressive stress in the column is:
2min /90.4 mmNmnc
There arises tension in the column which means that the section is cracked. The assumption that the effective modulus of elasticity of concrete should be taken into account is thus correct.
G.2.9 Overview weight contribution of elements In the table below the contribution to the total vertical load at the piles is given for the different loads.
Loads Value Percentage of
the total vertical load at the piles
Dead load box girder Lgdead * 3123 kN 23.51 %
Dead load box girder + tendons + anchorage and deviation blocks
anchoragevtendonsvdead QQLg ,,* 3417.14 kN 25.73 %
Total load box girder fully loaded anchoragevtendonsvtot QQLq ,,* 7589.09 kN 57.14 %
Dead load column wideningvcolumnv QF ,, 1720.32 kN 12.95 %
Dead load foundation slab fsvF , 3973.05 kN 29.91 %
Total vartical load at the piles
fsvwideningvcolumnv
anchoragevtendonsvtot
FQF
QQLq
,,,
,,*
13282.46 kN 100 %
G.3 Column + foundation in combination with a FRP sandwich girder
G.3.1 General This Appendix presents the calculations of the column + foundation of the elevated metro structure with a FRP sandwich girder. First the cross-sectional properties of the column are described. Paragraph 3 deals with the loads to which the column is subjected. The geometry and characteristics of the foundation are treated in paragraph 4. Furthermore this Appendix describes the calculations on stability and stiffness of the structure in respectively the paragraphs 5 and 6. The forces in the piles and stresses in the column are treated in paragraph 7 and 8. Finally this Appendix gives an overview of the weight contribution of the different elements of the structure. The formulas and values used in the calculations are taken from [11] and other references, which are then stated in the text.

Appendices
280 The elevated metro structure in concrete, UHPC and composite
G.3.2 Column C50/60
Figure 197: Schematisation of the elevated metro structure with a FRP sandwich girder
Figure 198: Cross-section column
Length span sandwich girder mL 45 Height column mH 15
Width of the column mwcolumn 08.2
Inner radius drainage tube mrin 15.0
Moment of inertia of the column 444 559.1**4
1*
12
1mrwI incolumncolumn
Cross-sectional area of the column 222 256.4* mrwA incolumncolumn
Section modulus column 3499.12/
mw
IW
column
ccolumn
Dead load column:
kNgHAF cccolumnv 57.1565***,
Where:
3/2500 mkgc Density of concrete 2/81.9 smg Acceleration due to gravity
G.3.3 Loads at the top of the column Vertical force at the top of the column
kNQLqF wideningvtotviaductv 6165* ,,
Where:
mkNqggq permdeadtot /19.127var
mkNgdead /48.34 Dead load sandwich girder
mkNg perm /42.34 Permanent load at the sandwich girder
mkNq /29.58var Variable load of the metros and snow loading

Appendix G: Calculations column + foundation
Design study 281
kNgVQ cwideningwideningv 45.441**, Dead load extra concrete for widening of the
column at the top 318mVwidening Assumed volume of extra concrete for
widening of the column at the top Horizontal force at the top of the column in longitudinal direction of the viaduct
kNLag
qLa
g
qF d
moba
moblongh 25.326******,
Where:
trackpermkNqmob /5.25 Mobile load (metros)
07.1)10/(41 L Dynamic factor 2/2.1 smaa Maximum acceleration of the metros [8] 2/4.1 smad Maximum deceleration of the metros [8]
Horizontal force at the top of the column in transversal direction of the viaduct
kNQLHqF sidewfviaductwindtransh 88.505**,
Where:
2/5.1 mkNqwind Wind load
mHHHH windusrsandwichviaduct 05.7 Height superstructure subjected to wind forces
mH sandwich 04.3 Depth sandwich girder
mHusr 35.0 Height upper side rail, see Figure 90
mH wind 6.3 Range wind load on the superstructure, see
Figure 90
kNQsidewf 30 Sideward force due to the metro

Appendices
282 The elevated metro structure in concrete, UHPC and composite
G.3.4 Foundation
Figure 199: Load schematisation in transversal direction
Figure 200: Pile foundation, top- and side-view
Moment at the top of the foundation slab in transversal direction
kNmHwqHFM columnwindtranshy 13.7939***5.0* 2,
Foundation The foundation consists of 22 piles underneath a foundation slab with the dimensions:
mLfs 9 Length foundation slab (assumption)
mW fs 9 Width foundation slab (assumption)
mTfs 2 Thickness foundation slab (assumption)
The foundation slab is considered as an infinite stiff slab.
Figure 201: Rotation of the stiff foundation slab
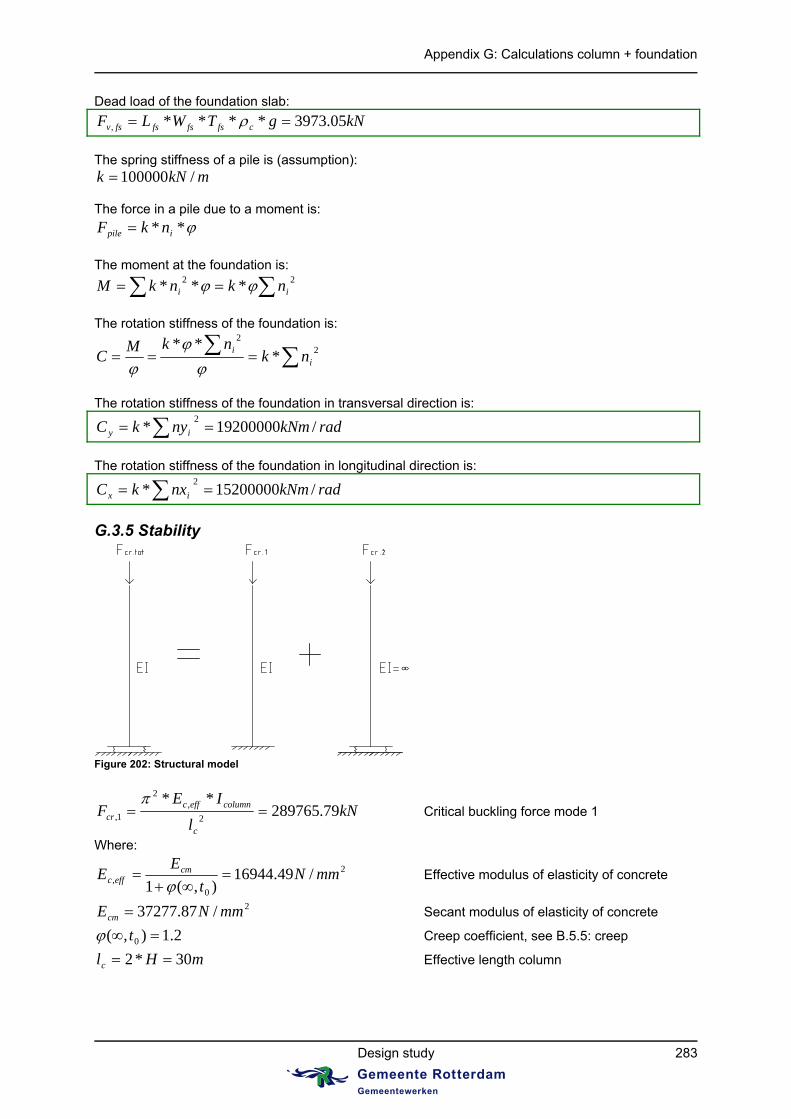
Appendix G: Calculations column + foundation
Design study 283
Dead load of the foundation slab:
kNgTWLF cfsfsfsfsv 05.3973****,
The spring stiffness of a pile is (assumption):
mkNk /100000 The force in a pile due to a moment is:
** ipile nkF
The moment at the foundation is:
22 *** ii nknkM
The rotation stiffness of the foundation is:
22
***
ii nk
nkMC
The rotation stiffness of the foundation in transversal direction is:
radkNmnykC iy /19200000*2
The rotation stiffness of the foundation in longitudinal direction is:
radkNmnxkC ix /15200000*2
G.3.5 Stability
Figure 202: Structural model
kNl
IEF
c
columneffccr 79.289765
**2
,2
1,
Critical buckling force mode 1
Where:
2
0, /49.16944
),(1mmN
t
EE cm
effc
Effective modulus of elasticity of concrete
2/87.37277 mmNEcm Secant modulus of elasticity of concrete
2.1),( 0 t Creep coefficient, see B.5.5: creep
mHlc 30*2 Effective length column

Appendices
284 The elevated metro structure in concrete, UHPC and composite
kNH
CF y
cr 12800002, Critical buckling force mode 2
Total critical buckling force:
kNFFFF totcr
crcrtotcr
42.236277111
,2,1,,
Vertical force at the top of the column, ULS:
kNQLqF unfavGwideningvulstotulsviaductv 21.8716** ,,,,,
Where:
mkNqggq unfavQpermunfavGdeadunfavGulstot /45.180*** var,,,,
35.1, unfavG
5.1, unfavQ
Factor n:
stableisstructureOkF
Fn
ulsviaductv
totcr ,1011.27,,
,
2nd degree magnification factor:
04.11
n
n
G.3.6 Stiffness
mIE
HF
columneffc
transhh 0215.0
**3
*
,
3, Deflection at the top due to the horizontal force at the
top of the column
mIE
Hwq
columneffc
columnwindq 0007.0
**8
**
,
4
Deflection at the top due to wind load at the column
mHC
M
y
yc 0062.0* Deflection at the top due to rotation of the foundation
slab Total 2nd order deflection at the top:
mn
ncqhtot 0296.0
1*
The maximum allowed deflection at the top:
mH
03.0500max

Appendix G: Calculations column + foundation
Design study 285
Deflection check:
enoughstiffisstructureOkmmtot ,03.00296.0 max
The 2nd order rotation of the foundation slab:
radn
n
C
M
y
y 0004.01
*
The maximum allowed rotation of the foundation slab [23]:
rad0033.0300
1max
Rotation check:
Okradrad 0033.00004.0 max
G.3.7 Foundation piles Pile force Total vertical force at the piles, ULS:
kNFFFF unfavGfsvunfavGcolumnvulsviaductvpilesv 35.16193** ,,,,,,,
Total horizontal force at the piles, ULS:
kNHwqFF columnunfavQwindunfavQtranshh 01.829**** ,,,
Total moment at the foundation slab in transversal direction, ULS:
kNmFHwqHFM ulsviaductvtotcolumnunfavQwindunfavQtranshy 5.12166*****5.0** ,,2
,,,
Total moment at the foundation slab in longitudinal direction, ULS:
kNmHFM unfavQlonghx 56.7340** ,,
The number of piles:
22pn
The maximum allowed pile force (assumption):
pileperkNP allow 1200max,
kNn
FP
p
pilesvv 06.736,
Load on piles due to vertical load
kNknyC
MP
y
ymy 47.253** max
Load on the outside piles in transversal direction due
to the moment in the transversal direction
kNknxC
MP
x
xmx 17.193** max
Load on the outside piles in longitudinal direction due
to the moment in the longitudinal direction Where:
mny 4max
mnx 4max

Appendices
286 The elevated metro structure in concrete, UHPC and composite
The maximum pile force in the corner piles of the foundation slab is:
OkkNPkNPPPP allowmxmyv 12007.1182 max,max
The minimum pile force in the corner piles of the foundation slab is:
kNPPPP mxmyv 42.289min
Most likely in all load phases the piles will not be in tension considering the large vertical force. Pile head moment due to horizontal force The pile is schematised as a beam of infinite length on one side and is fixed in the foundation slab on the other side. The pile which is supported by linear elastic springs (soil) is subjected to a concentrated horizontal force at the foundation slab. The structural model for a pile subjected to the horizontal force is shown in Figure 203.
Figure 203: Structural model piles Characteristics of the piles:
mwpile 42.0 Width of the pile
mhpile 42.0 Depth of the pile
21764.0* mhwA pilepilepile Cross-sectional area of the pile
43 0026.0**12
1mhwI pilepilepile Moment of inertia of the pile
2/87.37277 mmNEE cmpile Modulus of elasticity of the pile, assumption of
uncracked pile as the vertical pile force is large
5.1idtheffectivewc Factor for determining the effective width of the pile
3/3000 mkNk Modulus of subgrade reaction 2/1890** mkNcwkk idtheffectivewpilepile Modulus of subgrade reaction of pile

Appendix G: Calculations column + foundation
Design study 287
The pile head moment in one pile is [19]:
kNmn
F
M p
h
pile 63.35*2
*2
1
Where:
14 26.0
4 m
IE
k
pilepile
pile
The required reinforcement at one side of the pile is:
249.239* mmAfAz
Msyds
pile
Where:
mdz 342.0*9.0 Lever arm of internal forces
mchd pile 38.0 Effective depth
mmc 40 Concrete cover, see B.3.3 2/435/ mmNff sykyd Design yield strength of reinforcement
2/500 mmNf yk Characteristic yield strength of reinforcement
15.1s Partial factor for reinforcing steel
The total required reinforcement in a pile is:
2, 94.957*4 mmAA stots
The reinforcement percentage in a pile then becomes:
%54.0%100*,0
pile
tots
A
A
The maximum reinforcement percentage in a column/pile is:
%4max
Reinforcement percentage check
Ok %4%54.0 max0
G.3.8 Stresses in column Total vertical force at the bottom of the column, ULS:
kNFFF unfavGcolumnvulsviaductvcolumnbottotv 73.10829* ,,,,,,,
Total moment at the bottom of the column in transversal direction, ULS:
kNmFHwqHFM ulsviaductvtotcolumnunfavQwindunfavQtranshy 5.12166*****5.0** ,,2
,,,
The compressive stress in the column due to the vertical force is:
2,,, /54.2 mmNA
F
column
columnbottotvn

Appendices
288 The elevated metro structure in concrete, UHPC and composite
The stress in the column due to the moment in transversal direction is:
2/11.8 mmNW
M
column
ym
The maximum compressive stress in the column is:
2max /66.10 mmNmnc
The minimum compressive stress in the column is:
2min /57.5 mmNmnc
There arises tension in the column which means that the section is cracked. The assumption that the effective modulus of elasticity of concrete should be taken into account is thus correct.
G.3.9 Overview weight contribution of elements In the table below the contribution to the total vertical load at the piles is given for the different loads.
Loads Value Percentage of
the total vertical load at the piles
Dead load FRP girder Lgdead * 1551.6 kN 13.26 %
Total load sandwich girder fully loaded
Lqtot * 5723.55 kN 48.9 %
Dead load column wideningvcolumnv QF ,, 2007.02 kN 17.15 %
Dead load foundation slab fsvF , 3973.05 kN 33.95 %
Total vertical load at the piles
fsvwideningv
columnvtot
FQ
FLq
,,
,*
11703.62 kN 100 %

Appendix H: 3D-impressions three designs
Design study 289
Appendix H: 3D-impressions three designs

Appendices
290 The elevated metro structure in concrete, UHPC and composite

Appendix I: Alternative solutions and assumptions for the substructure
Design study 291
Appendix I: Alternative solutions and assumptions for the substructure
I.1 The application of columns made of UHPC instead of concrete Columns made of concrete C50/60 Columns made of UHPC C180
Cross-section of the elevated metro structure in transversal direction
Pile foundation, top- and side-view
Columns made of
concrete C50/60 Columns made of
UHPC C180 Unity
Width of the column columnw 2.06 1.67 m
Number of piles pn 25 25
Length foundation slab fsL 9 9 m
Width foundation slab fsW 9 9 m
Thickness foundation slab fsT 2 2 m

Appendices
292 The elevated metro structure in concrete, UHPC and composite
I.2 Changing the spring stiffness of the piles k = 50000 kN/m k = 100000 kN/m k = 150000 kN/m
Cross-section of the elevated metro structure in transversal direction
Pile foundation, top- and side-view
k = 50000
kN/m k = 100000
kN/m k = 150000
kN/m Unity
Width of the column columnw 2.09 2.06 2.02 m
Number of piles pn 26 25 25
Length foundation slab fsL 11 9 9 m
Width foundation slab fsW 9 9 9 m
Thickness foundation slab fsT 2 2 2 m

Appendix I: Alternative solutions and assumptions for the substructure
Design study 293
I.3 Changing the height of the columns H = 5 m H = 10 m H = 15 m H = 20 m H = 40 m
Cross-section of the elevated metro structure in transversal direction
Pile foundation, top- and side-view
H = 5
m H = 10
m H = 15
m H = 20
m H = 40
m Unity
Width of the column columnw 1.14 1.64 2.06 2.35 3.35 m
Number of piles pn 18 22 25 30 51
Length foundation slab fsL 9 9 9 11 15 m
Width foundation slab fsW 7 9 9 9 13 m
Thickness foundation slab fsT 2 2 2 2 2 m

Appendices
294 The elevated metro structure in concrete, UHPC and composite

Appendix J: Costs
Design study 295
Appendix J: Costs
J.1 Costs elevated metro structure C50/60 Viaduct C50 45.00 m
Omschrijving aantal hoogte lengte dikte breedte diverse totaal ehd prijs per prijs per Prijs perin m in m in m in m eenheid stuk per onderdeel
Poeren 148,438€
grondwerk 162.00 1.500 243.0 st 25.00€ 6,075€ palen 25.00 25.0 st 1,250.00€ 31,250€ poer 162.00 162.0 m3 350.00€ 56,700€ kolom 72.55 72.6 m3 750.00€ 54,413€
Viaduct 195.2 kg 1,511.86€ 295,115€
bekisting 1.00 45.00 8.96 403.20 1,087.2 m2 100.00€ 108,720€ 1.00 45.00 4.00 180.000 4.00 45.00 2.80 504.000
beton (€ 150/m3 koop) 195.20 195.2 m3 175.00€ 34,160€ wapening 195.20 75.000 14,640.0 kg 1.20€ 17,568€ voorspanwapening 222.00 45.00 1.520 15,181.8 kg 5.00€ 75,909€ ontkisten 1.0 1.0 pst 3,488.00€ 3,488€ transport 15.0 15.0 pst 350.00€ 5,250€ oplegblokken 2.0 2.0 st 250.00€ 500€ montage (reservering) 1.0 1.0 pst 30,000.00€ 30,000€ voegen 4.34 0.30 1500 1,952.0 dm 10.00€ 19,520€
443,553€
controle 443,553€
Kosten veld 443,553€
kosten op investeringsniveau
direct 443,553€
nader te detailleren 15.0% 66,533€
indirect 27.5% 121,977€
nader te detailleren 15.0% 18,297€
direct + indirect 650,359€
object onvoorzien 15.0% 97,554€
bouwkosten 747,913€
engineering 16.0% 119,666€
overige bijkomende kosten 6.0% 44,875€
basisraming 912,454€
project onvoorzien 15.0% 136,868€
investeringskosten 1,049,322€

Appendices
296 The elevated metro structure in concrete, UHPC and composite
J.2 Costs elevated metro structure C180 Viaduct C180 45.00 m
Omschrijving aantal hoogte lengte dikte breedte diverse totaal ehd prijs per prijs per Prijs perin m in m in m in m eenheid stuk per onderdeel
Poeren 144,138€
grondwerk 162.00 1.500 243.0 st 25.00€ 6,075€ palen 23.00 23.0 st 1,250.00€ 28,750€ poer 162.00 162.0 m3 350.00€ 56,700€ kolom 70.15 70.2 m3 750.00€ 52,613€
Viaduct 129.4 kg 2,313.88€ 299,416€
bekisting 1.00 45.00 8.96 403.20 1,017.0 m2 100.00€ 101,700€ 1.00 45.00 4.00 180.000 4.00 45.00 2.41 433.800
beton (€ 500/m3 koop) 129.40 129.4 m3 448.09€ 57,982€ wapening 129.40 75.000 9,705.0 kg 1.20€ 11,646€ voorspanwapening 222.00 45.00 1.520 15,181.8 kg 5.00€ 75,909€ ontkisten 1.0 1.0 pst 3,488.00€ 3,488€ transport 15.0 15.0 pst 350.00€ 5,250€ oplegblokken 2.0 2.0 st 250.00€ 500€ montage (reservering) 1.0 1.0 pst 30,000.00€ 30,000€ voegen 2.88 0.30 1500 1,294.0 dm 10.00€ 12,940€
443,553€
controle 443,553€
Kosten veld 443,553€
kosten op investeringsniveau
direct 443,553€
nader te detailleren 15.0% 66,533€
indirect 27.5% 121,977€
nader te detailleren 15.0% 18,297€
direct + indirect 650,360€
object onvoorzien 15.0% 97,554€
bouwkosten 747,914€
engineering 16.0% 119,666€
overige bijkomende kosten 6.0% 44,875€
basisraming 912,454€
project onvoorzien 15.0% 136,868€
investeringskosten 1,049,323€
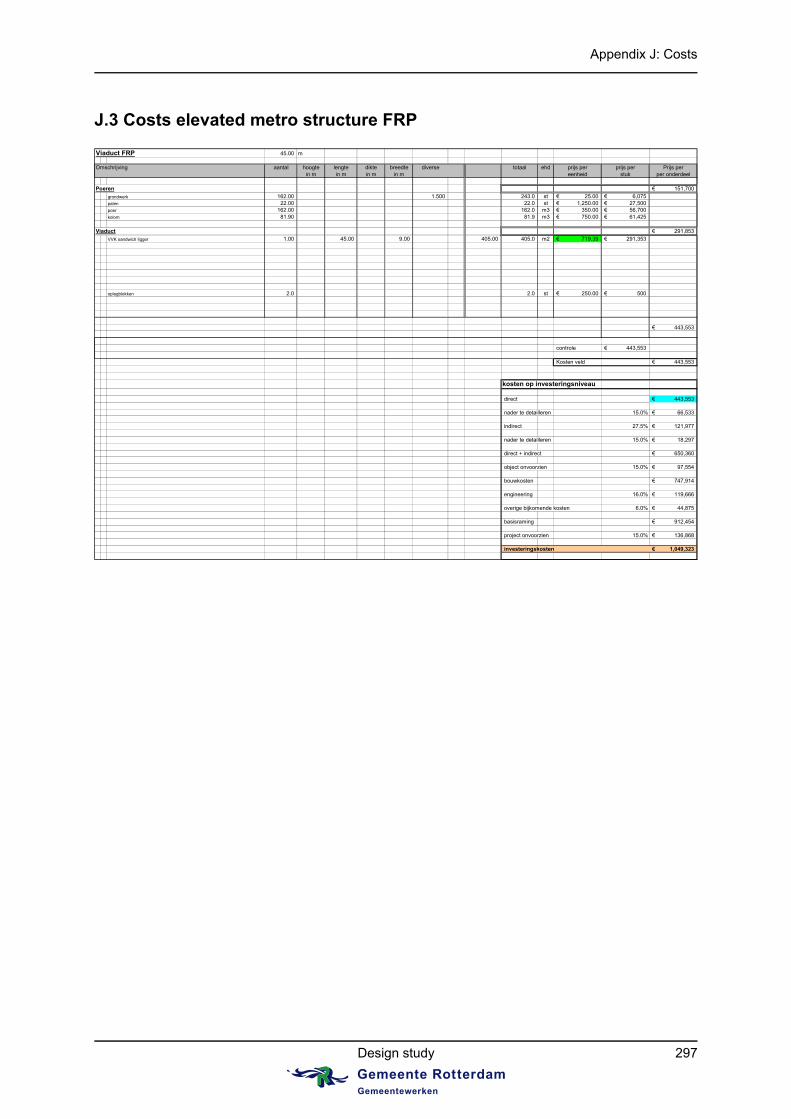
Appendix J: Costs
Design study 297
J.3 Costs elevated metro structure FRP Viaduct FRP 45.00 m
Omschrijving aantal hoogte lengte dikte breedte diverse totaal ehd prijs per prijs per Prijs perin m in m in m in m eenheid stuk per onderdeel
Poeren 151,700€
grondwerk 162.00 1.500 243.0 st 25.00€ 6,075€ palen 22.00 22.0 st 1,250.00€ 27,500€ poer 162.00 162.0 m3 350.00€ 56,700€ kolom 81.90 81.9 m3 750.00€ 61,425€
Viaduct 291,853€
VVK sandwich ligger 1.00 45.00 9.00 405.00 405.0 m2 719.39€ 291,353€
oplegblokken 2.0 2.0 st 250.00€ 500€
443,553€
controle 443,553€
Kosten veld 443,553€
kosten op investeringsniveau
direct 443,553€
nader te detailleren 15.0% 66,533€
indirect 27.5% 121,977€
nader te detailleren 15.0% 18,297€
direct + indirect 650,360€
object onvoorzien 15.0% 97,554€
bouwkosten 747,914€
engineering 16.0% 119,666€
overige bijkomende kosten 6.0% 44,875€
basisraming 912,454€
project onvoorzien 15.0% 136,868€
investeringskosten 1,049,323€

Appendices
298 The elevated metro structure in concrete, UHPC and composite
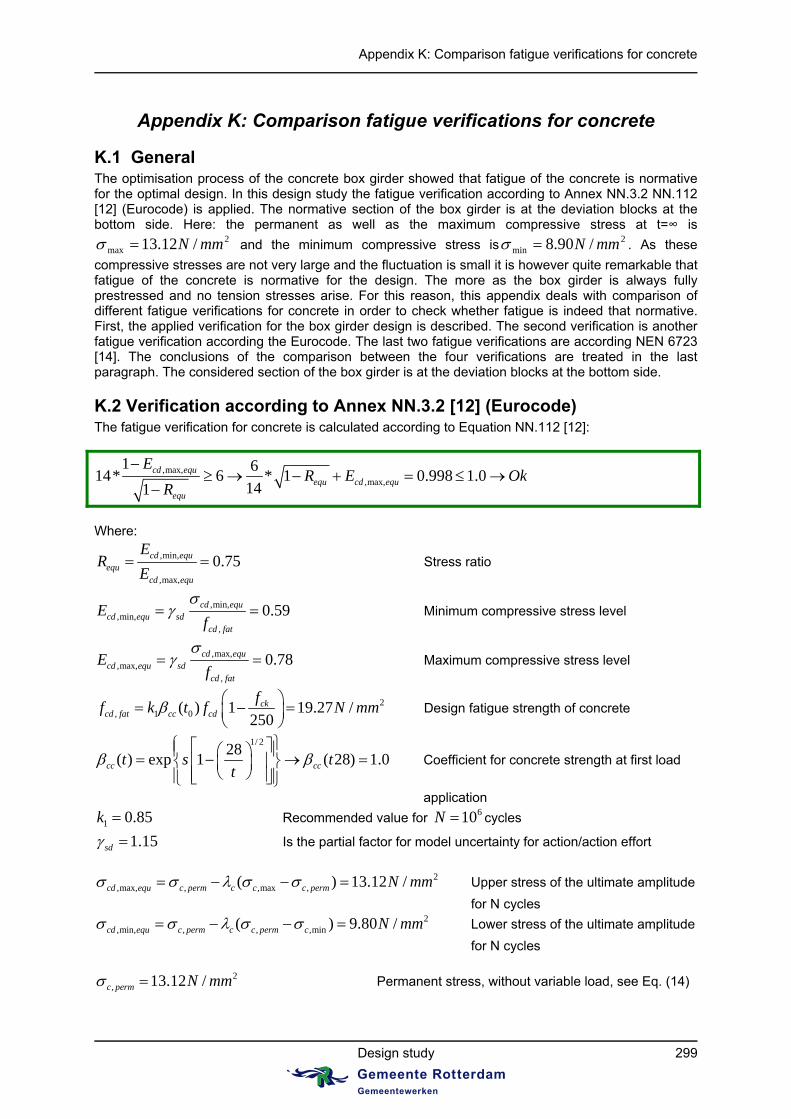
Appendix K: Comparison fatigue verifications for concrete
Design study 299
Appendix K: Comparison fatigue verifications for concrete
K.1 General The optimisation process of the concrete box girder showed that fatigue of the concrete is normative for the optimal design. In this design study the fatigue verification according to Annex NN.3.2 NN.112 [12] (Eurocode) is applied. The normative section of the box girder is at the deviation blocks at the bottom side. Here: the permanent as well as the maximum compressive stress at t=∞ is
2max /12.13 mmN and the minimum compressive stress is 2
min /90.8 mmN . As these
compressive stresses are not very large and the fluctuation is small it is however quite remarkable that fatigue of the concrete is normative for the design. The more as the box girder is always fully prestressed and no tension stresses arise. For this reason, this appendix deals with comparison of different fatigue verifications for concrete in order to check whether fatigue is indeed that normative. First, the applied verification for the box girder design is described. The second verification is another fatigue verification according the Eurocode. The last two fatigue verifications are according NEN 6723 [14]. The conclusions of the comparison between the four verifications are treated in the last paragraph. The considered section of the box girder is at the deviation blocks at the bottom side.
K.2 Verification according to Annex NN.3.2 [12] (Eurocode) The fatigue verification for concrete is calculated according to Equation NN.112 [12]:
,max,,max,
1 614* 6 * 1 0.998 1.0
141cd equ
equ cd equ
equ
ER E Ok
R
Where:
,min,
,max,
0.75cd equequ
cd equ
ER
E Stress ratio
,min,,min,
,
0.59cd equcd equ sd
cd fat
Ef
Minimum compressive stress level
,max,,max,
,
0.78cd equcd equ sd
cd fat
Ef
Maximum compressive stress level
2, 1 0( ) 1 19.27 /
250ck
cd fat cc cd
ff k t f N mm
Design fatigue strength of concrete
1/ 228
( ) exp 1 ( 28) 1.0cc cct s tt
Coefficient for concrete strength at first load
application
1 0.85k Recommended value for 610N cycles
1.15sd Is the partial factor for model uncertainty for action/action effort
2
,max, , ,max ,( ) 13.12 /cd equ c perm c c c perm N mm Upper stress of the ultimate amplitude
for N cycles 2
,min, , , ,min( ) 9.80 /cd equ c perm c c perm c N mm Lower stress of the ultimate amplitude
for N cycles
2, 13.12 /c perm N mm Permanent stress, without variable load, see Eq. (14)

Appendices
300 The elevated metro structure in concrete, UHPC and composite
2,max 13.12 /c N mm Maximum compressive stress, without variable load,
see Eq. (14) 2
,min 8.90 /c N mm Minimum compressive stress, with variable load, see
Eq. (10)
,0 ,1 ,2,3 ,4* * * 0.79c c c c c Correction factor to calculate the upper and lower
stresses of the damage equivalent stress
,,0
,
0.94 0.2 1 1.08c permc
cd fatf
Is a factor to take account of the permanent stress
,1 0.75c Is a factor accounting for element type, see Table
NN.3 [12]: (1) compression zone, s* standard traffic mix and simply supported beam
,2,3 6
1 11 log log 0.98
8 25*10 8 100years
c
NVol
Is a factor to take account of the traffic volume
and the design life of the bridge
/ *6*24*365 15848367 / /metroVol Q g tonnes year track Assumption of 6 metros per hour
*116 2958metro mobQ q m kN 116 metres is the length of a metro
100yearsN years Is the design life of the viaduct
,4 1.0c Is a factor to be applied when the structure is loaded
by more than one track, is the most conservative value
K.3 Verification according to the National Annex [13] (Eurocode) The fatigue verification for concrete is calculated according to Miner’s rule taking into account Equation 6.106.b [13]:
OkN
nm
i i
i
113.01
Where:
1m Number of intervals with constant amplitude
000,512,10100*365*24*6*2 n Actual number of constant amplitude cycles in interval
“i”: Assumption of 6 metros per hour per track
029,099,831
114^10 max,
R
EN cd
Ultimate number of constant amplitude cycles in
interval “i” that can be carried before failure
68.0max,
min, cd
cd
E
ER Stress ratio
46.0,
min,min,
fatcd
cdcd f
E
Minimum compressive stress level
68.0,
max,max,
fatcd
cdcd f
E
Maximum compressive stress level

Appendix K: Comparison fatigue verifications for concrete
Design study 301
2, 1 0( ) 1 19.27 /
250ck
cd fat cc cd
ff k t f N mm
Design fatigue strength of concrete
2max, /12.13 mmNcd Upper stress in a cycle, see Eq. (14)
2min, /90.8 mmNcd Lower stress in a cycle, see Eq. (10)
K.4 Verification according to 9.6.2.2.a.1 [14] (NEN 6723) The fatigue verification for concrete is calculated according to 9.6.2.2.a.1 [14]. This verification holds for road traffic:
OkmmNnSmmNS udb 22max;; /22.19)(/12.13
Where:
2'max;;max;; /12.13 mmNS dbdb
2'max;; /12.13 mmNdb Upper stress in a cycle, see Eq. (14)
2';; /14.18)()( mmNnfnS vubu
2';
';; /22.19*)log*1*1.01()( mmNfnRnf vbvub Design value of concrete compressive
strength at n cycles
68.0'
max;;
'min;;
db
dbR
Stress ratio
2'min;; /90.8 mmNdb Lower stress in a cycle, see Eq. (10)
000,512,10100*365*24*6*2 n Actual number of constant amplitude cycles in interval
“i”: Assumption of 6 metros per hour per track 2'
;;'; /88.31/ mmNff mvrepbvb Design fatigue strength of concrete
2';;
';; /25.3830*85.030*85.0*5.0 mmNff krepbvrepb Representative fatigue
compressive strength of concrete 2'
;'
;; /0.51*85.0 mmNff kckrepb Representative short term concrete compressive
strength
2.1m Partial factor for concrete
K.5 Verification according to 9.6.2.2.a.2 [14] (NEN 6723) The fatigue verification for concrete is calculated according to Miner’s rule in 9.6.2.2.a.2 [14]. This verification holds for road as well as railway traffic:
OkN
nm
i i
i
100039.01
Where:
1m Number of intervals with constant amplitude
000,512,10100*365*24*6*2 n Actual number of constant amplitude cycles in interval
“i”: Assumption of 6 metros per hour per track
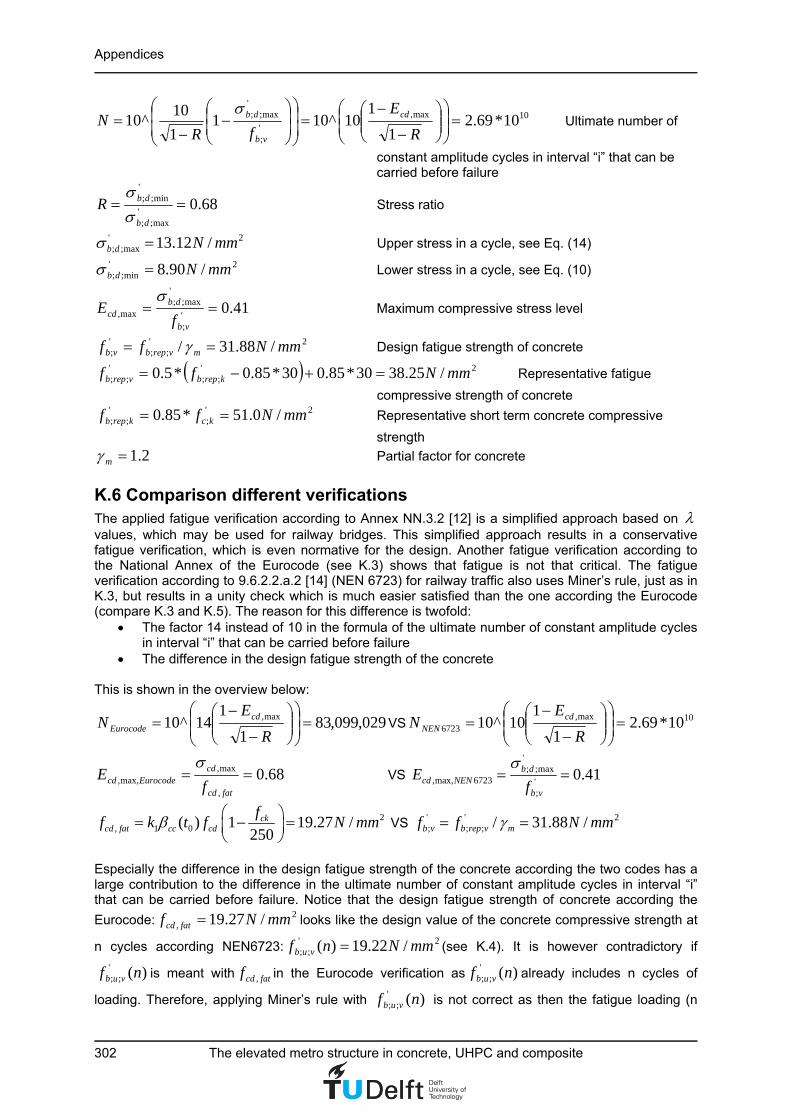
Appendices
302 The elevated metro structure in concrete, UHPC and composite
10max,
';
'max;; 10*69.2
1
110^101
1
10^10
R
E
fRN cd
vb
db Ultimate number of
constant amplitude cycles in interval “i” that can be carried before failure
68.0'
max;;
'min;;
db
dbR
Stress ratio
2'max;; /12.13 mmNdb Upper stress in a cycle, see Eq. (14)
2'min;; /90.8 mmNdb Lower stress in a cycle, see Eq. (10)
41.0';
'max;;
max, vb
dbcd f
E
Maximum compressive stress level
2';;
'; /88.31/ mmNff mvrepbvb Design fatigue strength of concrete
2';;
';; /25.3830*85.030*85.0*5.0 mmNff krepbvrepb Representative fatigue
compressive strength of concrete 2'
;'
;; /0.51*85.0 mmNff kckrepb Representative short term concrete compressive
strength
2.1m Partial factor for concrete
K.6 Comparison different verifications The applied fatigue verification according to Annex NN.3.2 [12] is a simplified approach based on values, which may be used for railway bridges. This simplified approach results in a conservative fatigue verification, which is even normative for the design. Another fatigue verification according to the National Annex of the Eurocode (see K.3) shows that fatigue is not that critical. The fatigue verification according to 9.6.2.2.a.2 [14] (NEN 6723) for railway traffic also uses Miner’s rule, just as in K.3, but results in a unity check which is much easier satisfied than the one according the Eurocode (compare K.3 and K.5). The reason for this difference is twofold:
The factor 14 instead of 10 in the formula of the ultimate number of constant amplitude cycles in interval “i” that can be carried before failure
The difference in the design fatigue strength of the concrete This is shown in the overview below:
029,099,831
114^10 max,
R
EN cd
Eurocode VS 10max,6723 10*69.2
1
110^10
R
EN cd
NEN
68.0,
max,max,,
fatcd
cdEurocodecd f
E
VS 41.0';
'max;;
6723max,, vb
dbNENcd f
E
2, 1 0( ) 1 19.27 /
250ck
cd fat cc cd
ff k t f N mm
VS 2'
;;'; /88.31/ mmNff mvrepbvb
Especially the difference in the design fatigue strength of the concrete according the two codes has a large contribution to the difference in the ultimate number of constant amplitude cycles in interval “i” that can be carried before failure. Notice that the design fatigue strength of concrete according the
Eurocode: 2, /27.19 mmNf fatcd looks like the design value of the concrete compressive strength at
n cycles according NEN6723: 2';; /22.19)( mmNnf vub (see K.4). It is however contradictory if
)(';; nf vub is meant with fatcdf , in the Eurocode verification as )('
;; nf vub already includes n cycles of
loading. Therefore, applying Miner’s rule with )(';; nf vub is not correct as then the fatigue loading (n

Appendix K: Comparison fatigue verifications for concrete
Design study 303
cycles) is taken into account two times. Because the difference in the design fatigue strength of the concrete according the two codes is large, which has a large impact on the fatigue verification, it is recommended to verify the formula for the design fatigue strength of the concrete:
2501)( 01,
ckcdccfatcd
fftkf according the Eurocode.
Nonetheless, the other fatigue verifications for concrete show that fatigue is not normative for the box girder design. In the optimisation process of the concrete box girder the conservative fatigue verification according to Annex NN.3.2 [12] is taken into account. In reality the fatigue verification for concrete is thus not normative. When the fatigue verification is not normative for the box girder the verification of the ultimate resistance moment of the box girder at t=0 becomes normative. The result of the optimal concrete box girder taking into account the new normative verification is shown below. Notice that the difference with the optimal design presented in Chapter 4 is small and the difference in substructure between the two designs is even marginal (see Chapter 9). The optimal design of the concrete box girder shown below is however not taken along in this design study. This is because this box girder design does not results in a radically different design of the elevated metro structure except that the normative verification for the box girder is not fatigue but the ultimate resistance moment of the box girder at t=0. The cross-section of the box girder is shown in Figure 204, where: Length span L 45 m Depth box girder H 2.75 m
Width top flange tfb 8.96 m
Thickness top flange tft 0.25 m
Width web wb 0.16 m
Width bottom flange bfb 4 m
Thickness bottom flange bft 0.25 m
Width box top side boxtsb 5 m
Cantilever length top flange cantL 1.98 m
Depth webs boxH 2.25 m
Angle of webs with vertical axis
31.11
2/)(tan 1
bfbox
bfboxtsw tH
bb
Furthermore:
Dead load of the concrete box girder: mkNgdead /12.97
Distance of deviation blocks to supports ma 16
Width of the column mwcolumn 05.2
Number of piles 25pn

Appendices
304 The elevated metro structure in concrete, UHPC and composite
Figure 204: Cross-section of the box girder
Figure 205: Cross-section of the elevated metro structure in transversal direction
Figure 206: Pile foundation, top- and side-view
Figure 207: Layout external prestressing tendons