master thesis - monami.hs-mittweida.demasterarbeit+.pdf · cellular carcinoma (deaths of 745...
TRANSCRIPT

MASTER THESIS
Mr.
Yantao Gao
。
<
Analysis and Classification of Transcription Data for the
Detection of Potential Biomarkers in Cancer
Mittweida, 2016


Fakultät: Angewandte Computer - und
Biowissenschaften
MASTERARBEIT
Analyse und Klassifizierung von Transkriptionsdaten für die Detektion von möglichen Biomarkern
bei Karzinomen
Autor:
Herr
Yantao Gao
Studiengang:
Molekularbiologie/Bioinformatik
Seminargruppe:
MO13w1-M
Erstprüfer:
Prof. Dr. rer. nat. Dirk Labudde
Zweitprüfer:
M. Sc. Stefan Schildbach
Einreichung:
Mittweida, 30.09.2016

Faculty: Applied Computer sciences &
Biosciences
MASTER THESIS
Analysis and Classification of Transcription Data for the Detection of Potential
Biomarkers in Cancer
author:
Mr.
Yantao Gao
course of studies:
Molecular Biology/Bioinformatics
seminar group:
MO13w1-M
first examiner:
Prof. Dr. rer. nat. Dirk Labudde
second examiner:
M.Sc. Stefan Schildbach
submission:
Mittweida, 30.09.2016

Acknowledgments
Gratitude is owed to M.Sc. Stefan Schildbach who sacrificially supervised this work, of-
fered help while knowing his way around seemingly all aspects of bioinformatics and mo-
tivated me during each meeting anew. Prof. Dr. rer. nat. Dirk Labudde gave me the op-
portunity to study this field, he provided valuable feedback and the opportunity to ex-
change ideas and opinions with other students writing their master thesis. I would like to
express my special gratitude and thanks to the bigM group and digital forensic group for
the support of this work.

VI Contents
Bibliographic description:
Gao,Yantao: Analysis and Classification of Transcription Data for the Detection of
Potential Biomarkers in Cancer, 77 pages, 30,09,2016, Content 59 pages, Ap-
pendix 4 pages, Mittweida, Hochschule Mittweida, Faculty: Applied Computer sci-
ences & Biosciences
Referat:
Cancer is one of the main causes of death in developed countries, and cancer
treatment heavily depends on successful early detection and diagnosis. Tumor
biomarkers are helpful for early diagnose. The goal of this discovery method is to
identify genetic variations as well as changes in gene expression or activity that
can be linked to a typical cancer state.
First, several cancer gene signaling pathways were introduced and then com-
bined. 27 candidate genes were selected, through the analysis of several data
sets in the GEO database, a few expression difference matrices were established.
Those candidate genes were tested in the matrices and found five genes PLA1A,
MMP14, CCND1, BIRC5 and MYC that have the potential to be tumor biomarkers.
Two of these genes have been further discussed, PLA1A is a potential biomarker
for prostate cancer, and MMP14 can be considered as a biomarker for NSC lung
cancer.
Finally, the significance of this study and the potential value of the two genes are
discussed, and the future research in this direction is a prospect.

Contents VII
Contents
Bibliographic description:................................................................................................ VI
Referat: .......................................................................................................................... VI
Contents ………………………………………………………………………………………..VII
List of Figures .............................................................................................................. IX
List of Tables ................................................................................................................. X
Nomenclature ............................................................................................................... XI
1 Motivation ...................................................................................................... 1
2 Introduction ................................................................................................... 3
2.1 The worldwide situation of cancer ................................................................... 3
2.2 Biomarkers and Tumor biomarkers.................................................................. 4
2.3 DNA microarray and the related database ....................................................... 7
2.4 Bioconductor ................................................................................................. 10
3 Materials and Methods ................................................................................ 12
3.1 Choosing Candidate Genes .......................................................................... 12
3.1.1 Candidates selected from cancer pathway .................................................... 13
3.1.2 Candidates selected from RAS pathway ....................................................... 16
3.1.3 Candidates selected from related Pathway .................................................... 19
3.2 Selected Candidate Genes ............................................................................ 21
3.3 Collection of Datasets ................................................................................... 21
3.4 Data Processing ............................................................................................ 22
3.4.1 Data Pretreatment ......................................................................................... 22
3.4.2 Data Integration ............................................................................................. 27
3.4.3 Build Expression Difference Matrices ............................................................ 32
4 Result……………… ...................................................................................... 35
4.1 Candidate Biomarkers ................................................................................... 36
4.2 Further Study of MMPs and PLA1A ............................................................... 37
5 Discussion ................................................................................................... 41

VIII Contents
6 Perspective ................................................................................................... 45
7 Summary ....................................................................................................... 47
8 Bibliography ................................................................................................. 49
Appendix ..................................................................................................................... LXI
Selbstständigkeitserklärung ...................................................................................... 65

List of Figures IX
List of Figures
Figure 2.1 Probe sets in Affymetrix DNA microarray………………………………….………9
Figure 3.1 Pancreatic cancer pathway downloads from KEGG…………………………….14
Figure 3.2 Breast cancer pathway download from KEGG…………………………………..15
Figure 3.3 Thyroid cancer pathway download from KEGG…………………………………16
Figure 3.4 Schematic overview of the Ras/MAPK signaling path
way………..…………………………………………………………………………18
Figure 3.5 GnRH signaling pathway downloads from KEGG………………………….…...20
Figure 3.6 Two boxplot of GSE26910 and GSE3678 ………………………………...........23
Figure 3.7 Boxplot of GSE18842 …………………………………………………….…….23
Figure 3.8 grayscale map of the first chip of GSM466947……………………………….….24
Figure 3.9 A quality control chart of GSE18842………………………………………………25
Figure 3.10 RNA degradation plot of data GSE18842……………………………..….....….27
Figur 3.11 Histogram of Signal intensity……………………………………………….………28
Figure 3.12 MA plot with original data ………………………………………………….…….31
Figure 3.13 MA plot with gcRMA data ………………………………………………….…….31

X List of Tables
List of Tables
Table 3.1 the candidate genes from different pathways……………………………………..21
Table 3.2 the microarray datasets from GEO…………………………………………………22
Table 3.3 An example of expression difference Matrix of dataset
GSE26910……………………………………...……………………………………..32
Table 4.1 Differentially expressed genes marked by different datasets……………………35
Table 4.2 The potential of MMPs as tumor biomarkers used the expression different matri-
ces……………………………………………………………………………………......37
Table 4.3 A comparison of candidate MMP biomarker between the former and this
study……………………………………………………………………………….....38
Table 5.1 compares RNA-seq technology and DNA microar
ray ……………………………….…………………………………………………….42

Nomenclature XI
Nomenclature
BIRC5 ………………… baculoviral IAP repeat containing 5
CACNA1C ……………. calcium voltage-gated channel subunit alpha1 C
CACNA1D ………….... calcium voltage-gated channel subunit alpha1 D
CASP9……………..…. caspase 9
CCND1 ……………..… cyclin D1
CPI …………………..... Critical Path Initiative
CREB3……….............. cAMP responsive element binding protein 3
CRO…………………… contract research organization
DNA………………….... deoxyribonucleic acid
EBI…………………….. European Bioinformatics Institute
ErbB……….................. erb-b2 receptor tyrosine kinase
ERG…………………… ERG, ETS transcription factor
ETS1..………………… ETS proto-oncogene 1, transcription factor
FDA…………………… U. S. Food and Drug Administration
FLT4…………………... fms related tyrosine kinase 4
FOS …………………... proto-oncogene, AP-1 transcription factor subunit
FOXO1 ……................ forkhead box O1
FSH …….…………….. follicle stimulating hormone
GEO ………………….. Gene Expression Omnibus
GDP……….................. guanosine 5'-diphosphate
GNRHR………………. gonadotropin releasing hormone receptor
GRB2 ….…………….. growth factor receptor-bound protein 2
GTP…………………… Guanosintriphosphat
HES………….……….. hes family bHLH transcription factor
HEY1 ………………... Hairy/enhancer-of-split related with YRPW motif protein 1

XII Nomenclature
HSP90AA…..……... heat shock protein 90 alpha family class A member 1
IARC………………… international cancer research agency
KCNS3 …………….. potassium voltage-gated channel modifier subfamily S member 3
kRAS….................... KRAS proto-oncogene, GTPase
KSR 1 ……………… kinase suppressor of ras 1
LAMC2 …………….. laminin subunit gamma 2
LEF1………………... lymphoid enhancer binding factor
MAPK………..…….. mitogen-activated protein kinase
MMP……………….. matrix metallopeptidase
MTOR …………….. mechanistic target of rapamycin
MYC………………... v-myc avian myelocytomatosis viral oncogene
NCI………………… National Cancer Institute
NFKB1……………. nuclear factor kappa B subunit 1
PBMC ……………. peripheral blood mononuclear cell
PDA ……………… pancreatic ductal adenocarcinoma
PLA1A……………. phospholipase A1 member A
PPAR…………….. peroxisome proliferator activated receptor alpha
PPARG…………... peroxisome proliferator activated receptor gamma
PTK2B………….… protein tyrosine kinase 2 beta
Raf………………… receptor associated facto
RNA………………. ribonucleic acid
RXRA …………….. retinoid X receptor alpha
SHOC2………....... leucine rich repeat scaffold protein
TGFB1 …………... transforming growth factor beta 1 induced transcript 1

Motivation 1
1 Motivation
Cancer is generally known as a group of diseases that can affect any part of the
body. Other terms of cancer are malignant tumor and neoplasm. One defining fea-
ture of cancer is the rapid growth of abnormal cells that go beyond their usual bor-
ders to grow, invade adjacent parts of the body, and spread to other organs that are
known as metastases. Metastasis is the leading cause of death from cancer. In 2012,
there are about 14 million new cases of cancer and 8 million 200 thousand cases of
cancer-related death [Ferlay J et al.,2013]. It is supposed that the number of new
cancer cases will increase by 70% in the next twenty years. In 2012, the five most
commonly diagnosed cancers of the men were lung cancer, prostate cancer, colo-
rectal cancer, stomach cancer and liver cancer. The five most diagnosed common
cancer of the women were mammary, colorectal cancer, lung cancer, cervical can-
cer, and gastric cancer [Bernad w et al.,2014].
If the patients were fund cancer and received treatment as soon as possible, they
can reduce the mortality rate of cancer. There are two components in the early de-
tection. One is the early diagnosis. Pay attention to early signs and symptoms (such
as skin cancer, cervical cancer, breast cancer, colorectal cancer, and oral cancer),
so that the disease can be diagnosed and treated in the earlier stage. Early diagno-
sis planning is particularly useful in the absence of effective screening methods (e.g.,
in the environment of the absence of a lot of resources) or therapeutic measure.
Under the circumstance of the absence of any early detection or screening and
treatment measures, the patient will be diagnosed at a late stage, at that time patient
is often untreatable. The other is screening. The purpose of screening is to identify
individuals who have an abnormal phenomenon before infecting cancer or the sug-
gestion of some specific cancer, allow them to be treated in a timely manner, or be
diagnosed and treated in a feasible manner. For common types of cancer, it can be
used the screening test method that is cost-effective, affordable, and can be ac-
cepted and obtained for most high-risk groups. In this case, the screening program
is especially effective. Screening methods include: using acetic acid for visual in-
spection of the cervical cancer in the environment of the lack of resources; conduct

2 Motivation
human papillomavirus examination for cervical cancer; make PAP smear examina-
tion for cervical cancer for the use of medium and high income people; conduct
breast screening for breast cancer in the environment of high income. Treatment of
cancer: accurate diagnosis of cancer is essential to take appropriate and effective
treatment measures, because each type of cancer require specific treatment options,
including the use of one or more methods, such as surgery, and/or radiotherapy,
and/or chemotherapy. The primary goal of the treatment is to cure cancer or prolong
life. Improving the quality of life for patients is also an important goal.
The effectiveness of treatment and cure of medical science for cancer depends on
whether cancer can be detected timely in the early stages.
As one of the most direct and rapid diagnostic methods, the screening and obtaining
of biomarkers play a critical role in many aspects of diagnosis, development, treat-
ment, and therapeutic effect monitoring of tumor.
Cancer biomarkers are wildly used in clinic trials, and many types of research of
finding the novel biomarkers have been taking for many years. But how the search-
ing processes would undertake by using the open-resource?
In this work, two databases, KEGG and GEO, were used to find the potential cancer
biomarker candidates. And the processes of this work can roughly be partitioned
into two aspects. First, using the pathway map of KEGG, to find the suitable candi-
date genes, according to the understanding of different pathways. On the other hand,
many data sets were collected from GEO database and using the statistical analysis
to find the candidate genes, which overexpressed in a cancer sample.

Introduction 3
2 Introduction
2.1 The worldwide situation of cancer
Over 60% of the world's new cancer cases occur in Africa, Asia, Central America
and South America, which accounts for about 70% of the world's total cancer deaths.
In the next 20 years, it estimated that annual cancer cases will rise from 14 million
in 2012 to 22 million.
There are many problems due to cancer. Cancer is one of the leading causes of
death in the world, resulting in 8 million 200 thousand deaths in 2012. The main
types of cancer are: lung cancer (deaths of 1 million 590 thousand cases), hepato-
cellular carcinoma (deaths of 745 thousand cases), gastric cancer (deaths of 723
thousand cases), colorectal cancer (deaths of 694 thousand cases), breast cancer
(deaths of 521 thousand cases), esophageal cancer (deaths of 400 thousand cases).
What is the cause of cancer? Cancer arises from a single cell. There is a multi-stage
process to go through from a normal cell into a tumor cell, it usually changed into
malignant tumor from precancerous lesions. These changes are the result of an
interaction between a person's genetic factors and three external factors that include:
physical carcinogens, such as ultraviolet and ionizing radiation; chemical carcino-
gens, such as asbestos, tobacco smoke constituents, aflatoxin (a food contaminant)
and arsenic (a drinking contaminant); and biological carcinogens, such as infections
caused by certain viruses, bacteria, or parasites [Bernad w et al.,2014].
WHO carry out the classification of causing factors of cancer, through its interna-
tional cancer research agency (IARC). Aging is another fundamental factor in the
formation of cancer. Cancer incidence remarkably increases with the growth of age,
and it is likely due to the accumulation of specific cancer risk factors in someone's
life history. In addition, as a man grows older, the cell repair mechanism has a ten-
dency to go downhill. There are a lot of risk factors for cancer, for instance, smoking,
using alcohol, unhealthy diet and lack of physical activity are the main risk factors
for cancer in the world. Some chronic infections are also a risk factor for cancer,
these factors have a major impact on the people who are in low and middle-income

4 Introduction
countries. Hepatitis B virus, hepatitis C virus and some types of HPV individually
increase the risk of developing liver cancer and cervical cancer. The infection of HIV
greatly increases the risk of cancer, such as cervical cancer [Engels EA et al., 2008;
McGinnis KA et al., 2006]. Approximately 1/3 of cancer deaths are derived from five
major behavioral and dietary risk factors: high body mass index, low intake of fruits
and vegetables, lack of exercise, using tobacco and alcohol. The use of tobacco is
the most significant risk factor for cancer, which causes about 20% deaths of the
world from cancer, and about 70% deaths of the world from lung cancer. For exam-
ple, the death rate due to the infection of hepatitis B virus, hepatitis C virus, and
human papilloma virus are 20% in the low-income and middle-income countries [De
Martel C et al.,2012].
2.2 Biomarkers and Tumor biomarkers
Biomarkers is a kind of indicator that can objectively measure and evaluate normal
biological processes, pathological process or drug intervention reaction, which is
also important warning indicators when organism damage, involving changes in the
molecular structure and function of cells, changes in biochemical metabolism, ab-
normalities of the physiological activity, and abnormal change of individual, group,
or the entire ecosystem [Atkinson AJ et al.,2001].
As for biomarker, it can establish drug development, the treatment method, and
bring new opportunities, in order to provide more safe and effective products and
services for patients at the same time, which is a strong impetus to the progress of
medical and biological fields other basic research. Now biomarkers have made
many breakthroughs, products are also applied to the actual clinical treatment, and
the development of biomarkers has also promoted the transformation of the re-
search model. In the field of diagnosis, a simple study of one or two biomarkers has
been transformed into a combination of a variety of markers, and IVDMIA (In Vitro
Diagnostic Multivariate Index Assays) has been rapid development [HHS et al.,
2012]. In the personalized medicine, the development of biomarkers has played a
powerful role in promoting the development of personalized medicine. In addition,
biomarkers can also be used to guide the use of drugs to reduce the cost of adverse
reactions caused by. However, in the field of medicine, biomarker is an emerging

Introduction 5
discipline, there are still many problems needing to be solved, mainly in the following
aspects: how to apply genomics and related research data to clinical research; how
to enhance cooperation among different databases; how to improve the current reg-
ulation and compensation system of biological markers. To address these issues,
how to persuade more medical workers to use biological markers related products
and inspection measuring means will become the key problem, all of these chal-
lenges require the government, research institutions, enterprises and medical work-
ers to work together and corporate with each other.
The research on biomarkers is not only the important content of the biochemical
basis, but also has important value in the development of new drugs, medical diag-
nosis, clinical research, and contribute to help researchers to propose more effective
means of diagnosis and treatment, especially has important value in the prevention
and control of chronic diseases and complicated diseases, such as tumor, cardio-
vascular diseases, sugar diabetes, neurological disorders [Rundle A et al., 2012].
At the end of the 20th century, the development of the omics technology greatly
promoted the progress and development of the research on biomarkers[Ratain MJ
et al., 2007], countries (regions) have introduced corresponding support policy, for
instance, the U. S. Food and Drug Administration (FDA) introducing the Critical
Path Initiative (CPI) in 2004[Critical Path, 2011], the European Medicines Agency
Road Map to 2015, the application and development policy of biological mark of
OECD in the health field[The European Medicines Agency Road Map to 2015, 2010],
are all clear on the key role of biomarkers in the development of new drugs and
clinical treatment. Overall, the roles of biological markers in countries (regions) are
summarized in the following three aspects: the new biomarkers have become the
basis of preventive medicine, put forward measures to reduce the prevalence and
risk before the occurrence of the disease[Nalejska et al.,2014]; using biomarkers in
evidence-based medicine improve the quality of diagnosis or treatment and reduce
the impact of disease on society and the economy [Holliday EG et al.,2010]; bi-
omarker changes the existing medical model, and promote the development of per-
sonalized medicine, and take a more active and effective treatment for specific pa-
tients[Personalized Medicine Coalition,2014].
Comprehensively and systematically sort out and analyze the current status and
trends of domestic and international biomarkers, so as to provide Bibliography for

6 Introduction
the basic research of Biochemistry and new drug development, medical diagnosis,
clinical research. Since the beginning of this century, the development of basic re-
search on biomarkers is rapid, many countries have introduced corresponding re-
search program and policy support, promoting knowledge sharing and creation and
ensuring the sustainable development in the field of medicine. Under the impetus of
the parties, the basic research results of biological markers have been rapid growth.
In the development of research and application of biomarkers, the construction of
infrastructure is necessary [Policy Issues for the Development and Use of Bi-
omarkers in Health,2010]. Because biomarker research is the most basic work for
specific disease states or biological process, but screening of suitable biomarkers
will often encounter the following two questions: on the one hand, the genome pro-
ject provides a large number of potential biomarkers, but it is very difficult to find
clinically relevant and useful information from huge data; on the other hand, the
verification of biological biomarkers requires large-scale association studies and pa-
tient samples, which requires countries and institutions building infrastructure, in or-
der to promote research cooperation and increase information sharing and
knowledge creation opportunity. So, all levels of research institutions of the United
States and the European Union are in the active construction of many different bi-
omarker databases, to effectively promote the sharing of knowledge in the field of
biomarkers [Fan YL et al.,2013].
In the United States, the National Cancer Institute (NCI) has established a BMDB
database to record all of its biomarkers. In the European Union, the European Med-
icines Agency's establish a public open electronic registry database (E-register),
providing information on the availability, safety and effectiveness of drugs in clinical
practice. In addition, South Korea, India, and other countries are also actively in-
volved in the construction of biological marker, for instance, the Indian contract re-
search organization (CRO) GVKBIO establish GOBIOM online biological markers
database, containing more than 20 000 clinical biomarker information. From the per-
spective of the construction objectives and the role of this infrastructure, encourag-
ing cooperation between different projects and enhancing the link and sharing of the
database will be the main trend of the future development of biomarkers [Fan YL et
al.,2013].

Introduction 7
And in this study, is a process to find some special biomarkers: tumor biomarkers.
Tumor biomarkers are the substance that tumor cells produced and released, often
with antigen, enzyme, hormone metabolism exists in the form of tumor tissue or host
body fluids, according to the biochemical and immunological characteristics can
identify and diagnose the tumor. Although an elevated content of tumor marker may
suggest the presence of cancer, only the level of tumor marker is not enough to
diagnose cancer. Some tests, such as biopsies, also combined with a measure of
tumor markers [Mishra et al.,2010].
Recently, the scientists, who are in Swedish Karolinska Institute and Estonia center
for medical technology, developed a new method for analysis of gene expression in
collaboration, that is, discover and analyze the biomarker of the whole blood RNA-
SEQ [Kaarel Krjutskov et al.,2016]. Their findings are published in the "Reports Sci-
entific" magazine on August 12th, 2016. The cells carried by blood that can provide
a variety of useful biomarkers. As a liquid biopsy, blood has been widely used in
clinical research because of its simplicity of sampling and fast dynamics. Most of the
cells are red blood cells that carry oxygen. Because of the high universality of globin,
the study of blood-related gene expression biomarkers has become more compli-
cated, thus causing the technical deviation, and leaving behind the biological mole-
cules that cannot be detected. The first author, Dr. Kaarel Krjutškov (2016) said: "
the decreased rate of globulin of Glob unlock is enough for any application. It has
reduced the prevalence rate of the globulin from 63% to 5%, making it become an
effective tool for biotech companies to add it to the kit." This new approach consists
of a pair of short synthetic DNA chains, which can reticent the majority of the globulin
RNA molecules, through highly specific combination.
Compare the blood cells, is an efficient way to find an easily testable biomarker
candidate. Blood testing is much easier than tissue detection. If the candidate gene
overexpressed in blood cells, it may benefit the diagnosis of cancer.
2.3 DNA microarray and the related database
At the end of twentieth Century, with the development of biochemical technology, a
new technology that can measure thousands mRNA expression of at the same time
was born, under the impact of high-density chip production technology in the field of
computer [Schena M et al., 1995]. Through these techniques, tens of thousands of
8 Introduction
corresponding DNA probes can be placed on a chip of a few square centimeters, so
as to simultaneously determine the expression of these genes in the sample [Müller
HJ et al., 2004]. This technology is often called DNA microarray; GeneChip is only
used to refer to a specific type of chip. The microarray is a member of the Biochips,
but the most important one, other types of biochip includes protein chip, tissue chip,
and so on. Compared with the traditional molecular biology and biochemistry exper-
iments that can only get a very limited data, Microarray can collectively get a lot of
molecular biological data that are referred to as high-throughput technology. Using
microarrays to represent high-throughput molecular biology technology allow scien-
tists to greatly enhance the ability of the access to experimental data, on which con-
tains thousands of gene expression values [Howe D et al., 2008]. On the one hand,
this massive data provides the possibility to find more and more complex biological
rules, on the other hand, it put forward unprecedented challenge of the data pro-
cessing and analysis technology. The traditional data analysis methods are inade-
quate, so a series of new adaptation of high-throughput biological data analysis and
processing methods emerge as the times require, among them, image processing,
pattern recognition, and machine learning play an important role.
Basic principles of microarray are based on pairing principle of DNA, namely in the
four nucleotides of adenine (A), thymine (T), guanine (G) and cytosine (C), A and T,
G and C can respectively form a close pairing, which is basic mechanism of replica-
tion and transcription of DNA. The formation process of this pair is called hybridiza-
tion [E.M.Southern,1975]. Using this principle, we can use a specific DNA sequence
as a probe to detect the presence and abundance of the paired DNA molecules.
The microarray is fixed a large number of DNA probes in a very small area of the
chip, hybridize nucleotide fragment with the corresponding probe, and then the cor-
responding gene expression could be obtained through the later treatment. Due to
the small size of the chip, the conditions of the hybridization reaction between the
probe and the sample can be ensured, and the detection of the expression of the
gene can be quickly obtained by using a few samples. According to the different
preparation and immobilization technology, the microarray is mainly divided into
printed cDNA microarray and oligonucleotide microarray [Stefan Lorkowski et al.,
2003].
Introduction 9
Figur 2.1 Probe sets in Affymetrix DNA microarray [ Stefan Lorkowski et al., 2003].
A gene chip can contain millions of probes, which are printed in a neat and orderly
manner. A group of probes is derived from a gene, usually consisting of 20 pairs or
11 pairs of probe sets, each of them is made up of mismatch (MM) and perfect
match (MM), called the probe pair. The sequence of MM and PM is different from
that of the central base, and the rest are consistent, as shown in figure 2.1.
Microarray database is an important source for biomarkers discovery; researchers
have established a number of specialized databases for the storage of microarray
data related disease. As the main database resources of memory microarray, GEO
(Gene Expression Omnibus) contains a wealthy microarray data related cancer.
When querying "sapiens Homo" and "Cancer", it returns 278 data sets. In October
2003, Daniel establishes the ONCOMINE database, especially collect cancer-
related microarray data sets, provide expression analysis of data mining and
genome-scale on the web. In the version of ONCOMINE 3, the database contains
264 gene expression datasets, more than 20 thousand samples of cancer tissue
and normal tissue data [Rhodes D R et al., 2007]. Other microarray database in-
cludes Stanford gene microarray database (http://genome-www5.stanford.edu/Mi-
croArray/SMD), the EBI chip expression database (http://www.ebi.ac.uk/arrayex-
press), and MIT cancer genome project (http://www.broad.mit.edu/cancer/) and so
on, all are an important resource for biomarker discovery. The microarray is capable

10 Introduction
of recording the changes of thousands of genes of disease state under one-time.
By comparing disease group and normal group of microarray data, find significant
differences in the gene, which can be used to predict the related biomarkers. Due
to the existence of a single chip data noise and system errors, the prediction results
are often error [Autio R et al., 2009; Stafford P et al.,2007; Rhodes D R et al.,2004;
Xu L et al., 2007]. Therefore, the latest research through the integration of different
experimental sources of multiple microarray data, reduce the impact of the error in
a single chip experiment, looking for more generic biomarkers and drug targets. The
purpose of data integration is to process the data from different sources so that the
data of the same gene can be compared with each other.
The technology of gene expression by DNA microarray has been gradually replaced
by RNA-seq technology. But after all, it has been more than 10 years of develop-
ment, and the global researcher data stored in the GEO or ArrayExpress database
has been more than 50PB. Those enormous datasets are really very impressive,
there are still a lot of waiting for the mining area.
2.4 R and Bioconductor
R language is an open source statistical computing and mapping language and is
very similar to S language. The syntax of R is similar to other languages, and the
function is very powerful. Bioconductor is an open source, open development soft-
ware based on R for the analysis of high-throughput genomic data, and the applica-
tion functionality of Bioconductor is presented in front of the user with the form of
the integrated package [Hahne, F.et al., 2008]. It provides a variety of software pack-
ages, including a variety of genomic data analysis and annotation tools, most of
which are targeted at DNA microarray or microarray data processing, analysis,
annotation, and visualization. A large number of meta-data packages provide path-
way, organism, microarray and other annotations. The Bioconductor release version
is updated twice a year [Gentleman, R. et al., 2005].
The Bioconductor project started in 2001, the home page is http://www.bioconduc-
tor.org/. Bioconductor includes a number of package components that can be fully
installed or be installed separately [Gentleman, R. et al., 2005]. In this study, the

Introduction 11
data processing from download the dataset, analysis and calculate the expressions
value are all used the Bioconductor package.

12 Materials and Methods
3 Materials and Methods
The ultimate goal of this study is to utilize the existing knowledge of signaling path-
way in the KEGG databases, and the analysis of the microarray datasets of GEO,
to provide approaches and strategies to detect the potential tumor biomarkers.
Four steps were undertaken in the following chapter: choosing the candidate genes
from different pathway maps, choosing the suitable datasets, analyzing those data
sets, comparing the candidate genes with the expression difference matrices.
3.1 Choosing Candidate Genes
The candidate genes were selected in cancer pathways or oncogene pathways from
KEGG, by using the knowledge of biological signaling pathways and the function of
oncogenes.
A signaling pathway, is a series of chemical reactions which are initiated by a stim-
ulus (first messenger) acting on a receptor that is transduced to the cell interior
through second messengers (which amplify the initial signal) and ultimately to effec-
tor molecules, resulting in a cell response to the initial stimulus [Bastien D et al.,
2009]. Those pathways in the cell are composed of a series of different proteins,
which perform different physiological and biochemical functions.
In molecular biology, the terms upstream and downstream can refer to the temporal
and mechanistic order of cellular and molecular events. For example, in signal trans-
duction, the second messenger acts downstream to activation of cell membrane
receptors. The other way around, activation of cell membrane receptors occurs up-
stream of the production of second messengers [Bastien D et al., 2009].
The regulation of the activity of the downstream protein (including activation or inhi-
bition) by the upstream protein in each signal pathway is mainly by adding or remov-
ing the phosphate group, in order to change the conformation of the downstream
protein. Therefore, the main members of the signaling pathway are protein kinase
and phosphatase, which can rapidly change and restore the conformation of the
protein. It is not only a signal transduction process but also a process of cascade

Materials and Methods 13
amplification, from the cell receptor, received external signals to finally make a com-
prehensive response. Receptor protein translates extracellular signals into intracel-
lular signals via signaling cascade, dispersion, and adjustment, resulting in a series
of cellular responses, including downstream regulation of gene expression, intracel-
lular enzyme activity changes, cytoskeleton configuration and synthesis of DNA
change. These changes are not caused by one signal, but also can be produced by
different combinations of different signals [Bradshaw et al., 2010].
Oncogenes refer to a class of genes that are inherent in human or other animal cells
(and oncogenic viruses). Also, known as the transforming genes, most of onco-
genes need an extra step, such as mutations in another gene, or environmental
factors, such as viral infection, to cause cancer [Croce CM, 2008].
KEGG is a database resource for understanding high-level functions and utilities of
the biological system, such as the cell, the organism, and the ecosystem, from mo-
lecular-level information, especially large-scale molecular datasets generated by
genome sequencing and other high-throughput experimental technologies
[Kanehisa M et al, 2000].
At present,13 types of cancer pathways were integrated into KEGG pathway data-
base, every cancer pathway has its own complexity and heterogeneity. To analysis
of every gene in every cancer, pathways seemed to be a tremendous work. It very
useful to screen the pathway first, and selected the suitable candidate genes in sev-
eral types of cancer.
In the following sections, some genes were collected from different types of cancer
pathway and one oncogene pathway, also a noncancer-related pathway. The strat-
egy of how these genes were chosen and those pathways would be discussed in
the following.
3.1.1 Candidates selected from cancer pathway
In cancer patients, some of the changes in gene expression, if they can be distin-
guished from ordinary healthy people, then these genes can be used as a potential
tumor biomarker. So, these genes which would be selected are basically pathway
downstream genes or a downstream gene which are directly activated by alterations
14 Materials and Methods
of an oncogene. By the cascade amplification through pathways, the enormous al-
teration of downstream genes would be expected.
Figure 3.1 Pancreatic cancer pathway downloads from KEGG
Infiltrating ductal adenocarcinoma is the most common malignancy of the pancreas.
When most investigators use the term 'pancreatic cancer' they are referring to pan-
creatic ductal adenocarcinoma (PDAC).
From the view of Figure 3.1, the activated K-ras engages multiple effector pathways.
Through a series of effects, until the gene NFKB1(also named “NFkB” in KEGG
pathway map) affected DNA, and then blocked the apoptosis. So NFKB1 can also
be regarded as an inhibitor gene of apoptosis.
Oncogene pathways are always closely related to the occurrence of cancer, as in
Pancreatic cancer pathway, also include Raf-MEK-MAPK signaling pathway. MAPK
signaling pathway is a chain of proteins in the cell that communicates a signal from
a receptor on the surface of the cell to the DNA in the nucleus of the cell. MAPK8
would be chosen as a candidate gene, to the evaluation of this pathway, cause
MAPK8 self-involved in the MAPK pathway, Further MAPK8 is a downstream gene

Materials and Methods 15
of the MAPK pathway. MAPK8 was also be funded in apoptotic pathway and other
two cancer pathways. So is MAPK8 an Oncogene or a tumor suppressor gene, from
the view of this pathway, that is unclear. In KEGG Database, MAPK8 also involved
many different pathways, such as Non-alcoholic fatty liver disease, ErbB signaling
pathway, Ras signaling pathway, Chagas disease (American trypanosomiasis), Shi-
gellosis, Salmonella infection and so on. MAPK8 has a very complex function.
The change of oncogene and the downstream of an oncogene pathway were con-
sidered as the factors to choose the candidate genes in different cancer pathways.
Clinical application of four different biomarkers, ER, PR, HER-2 and Ki-67, breast
cancer can be divided into 4 molecular subtypes: luminal A subtype (ER-/PR-,
Her2-), luminal B subtype (ER-/PR-, Her2-(+), Ki-67overexpression), HER2 positive
(ER-, PR-, Her2+) and basal-like or triple negative breast cancer (ER-, PR-, Her2-)
[Michael Gnant et al.,2011].
Figure 3.2 Breast cancer pathway download from KEGG
Notch1 and Notch4 overexpression will active the Notch signaling pathway, and this
pathway is also highly related to cancer. HES1 and HEY gene as downstream genes

16 Materials and Methods
of Notch pathway ,was selected as a candidate gene for breast cancer, as shown in
figure 3.2.
In Thyroid Cancer pathway, it contents a signaling pathway PPAR, which is also
very related to cancer, so its downstream gene, PPARG, was chosen as a candidate
gene, shown in figure 3.3.
Figure 3.3 Thyroid cancer pathway download from KEGG
The genetic alterations of two oncogenes (β-catenin, Ras) was shown in Colorectal
cancer pathway, the downstream genes of those two oncogenes are LEF1, BIRC5,
MYC, CCND1, and FOS. Some of those 5 genes led to Anti-apoptosis, and some
of them led to the proliferation. They are highly associated with the occurrence of
cancer. So, those 5 genes were chosen as candidate biomarkers for colorectal can-
cer.
3.1.2 Candidates selected from RAS pathway
In this study of several cancer pathways, many are involved in RAS gene, as well
as pathway MAPK. RAS signaling pathway is also highly related to cancer, thus
several genes have also been selected in this pathway.

Materials and Methods 17
In 1982, American scientist R.A. Weinberg et al cloned the first human oncogene
from bladder cancer cell, because murine sarcoma virus c-ras gene and it's previ-
ously found highly homologous, it is named as Ras gene (rat sarcoma) [Weinberg
RA et al.,1982]. Ras gene is highly conserved in evolution, and it is widely used in
all kinds of eukaryotic cells. The mammalian Ras protein family has three members,
namely H-ras, K-ras and N-ras. Because the relative molecular weight of Ras pro-
tein is 21 kDa, it is also known as p21. Ras protein is localized on the inner side of
the cell membrane, which is a GTP/GDP binding protein, which regulates the trans-
mission of signaling pathways through the transformation of GTP and GDP; After
that, they found that the direct effect factor of Ras was Raf-1[Rapp UR et al.,1983],
This links the Ras and ERK/MAPK signaling pathways. In higher organisms, the Raf
serine / threonine kinase family consists of three members, A-raf, B-raf, and C-raf
(also known as Ra-1).
As the study progressed, the Ras signaling pathway constitutes a complex network.
In brief, the tyrosine kinase receptor RTKs activated by growth factors is combined
with GRB2 (growth factor receptor-bound protein 2) in a direct or indirect manner.
GRB2 and receptor RTK after the recruitment of guanine nucleotide exchange factor
SOS protein localized in the cell membrane adjacent to the Ras. In this way, SOS
and Ras formed a complex, GTP instead of GDP and Ras combination, Ras was
activated; And when GTP is hydrolyzed to Ras, GDP inactivation. Ras protein is
activated to produce a series of cascade amplification reactions. First, it recruits the
Raf1 protein to the cell membrane. After Raf kinase phosphorylation of MAPK ki-
nase (MAPKK, also known as MEK), then ERK1/2 (extracellular signal-regulated
kinase, also known as MAPK) activated by MEK. When ERK is activated, it goes to
the nucleus and activates the transcription factor to produce the corresponding bio-
logical effect [Lewis C et al.,2014].

18 Materials and Methods
Figure 3.4 Schematic overview of the Ras/MAPK signaling pathway. This pathway started
from external stimuli, through the ligand-activation of receptor tyrosine kinases, Ras, a small
GTPase, was activated, by membrane-associated signaling complexes. Ras assist the het-
erodimerization and activation of Raf intracellular kinases, then Raf started a kinase cas-
cade through MEK and ERK. So the Ras/MAPK signaling pathway also called the Ras-Raf-
MEK-ERK pathway. By ERK drive the activation of transcription factors, that dysregulated
cell cycle progression, proliferation, invasion, and survival. [Jennifer M Giltnane,2014].
In particular, the activation of Raf is not entirely dependent on Ras, and ERK can
also be activated by other proteins other than Ras. This shows that every signal
protein signaling cascade could be multiple upstream protein control, and they can
also have a number of downstream target proteins, thus forming a complicated reg-
ulation network structure. With the development of the research of signal pathway,
people began to study the mechanism of Ras signaling. In more than 60% of human
malignant melanoma, B-raf mutations were found, and this mutation was found in
some cancers of the rectum as well as in the thyroid and lung tumors [Curtin JA et

Materials and Methods 19
al.,2005]. After B-raf mutant, in some cases with C-raf to form a heterologous dimer,
followed by a continuous activation of downstream of the ERK signal, and eventually
the activation of protein kinase mTOR. The presence of Ras in tumor cells does not
involve mutations in the Ras itself and the condition of persistent activation of the
tumor itself. NF1 gene is the first discovery of tumor suppressor genes, it is a GAP
protein (GTPase-activating protein). NF1 gene deletion mutations, due to the reduc-
tion of GTP hydrolysis and lead to the accumulation of GTP binding form of Ras
protein, thereby enhancing the activity of Ras. In addition, reducing the expression
of let-7 miRNA makes the target gene mRNA Ras increase, but also can improve
the activity of Ras [McCubrey JA et al.,2007].
In RAS pathway, ETS1, KSR1 and PLA1A were selected as the downstream of the
Ras-Raf-MEK-ERK pathway, the Ras-Raf-MEK-ERK pathway is part of the whole
RAS pathway, as shown in Appendix 10. The Ras-Raf-MEK-ERK pathway is a
highly related to cancer, and become the target of the cancer treatment [Hilger RA
et al.,2002]. Also, one upstream gene of Raf1 were picked up as a reference.
3.1.3 Candidates selected from related Pathway
ELK1 is shared both by RAS pathway and GnRH pathway, it is also a downstream
gene form MAPK signaling pathway. And in this position, there are two genes: Elk1
and ETS. Those genes are the part of many different pathways, ELK1 is also in-
volved in some cancer pathways, and there are some non-cancer pathways con-
tents this gene. Figure 3.5 shown that in GnRH signaling pathway also contains
MAPK signaling pathway and RAS-Raf-1 pathway.
GnRH (Gonadotropin-Releasing Hormone), which is synthesized in the hypothala-
mus, is a polypeptide hormone whose main function is to release the pituitary follicle
stimulating hormone (FSH) and progesterone (LH). In mammals, GnRH-1 plays a
role in the regulation of reproduction. The role of GnRH-2 in advanced mammals is
mainly related to reproductive and sexual behavior [Ruf F et al., 2003]. This pathway
was analyzed, that assumed some potential biomarkers for prostate cancer or
breast cancer would be funded.
In other pathways, that ELK1 also associated with, either The Ras pathway and
MAPK pathway are not show up together, or they are more complex than GnRH

20 Materials and Methods
pathway, the study of those pathways are time-consuming and may be less related
to cancer than GnRH pathway.
ETS was selected as a candidate gene from RAS pathway, and for the gene ELK1,
some genes were picked up from GnRH pathway instead. In this work, only one
ELK1 related pathway was chosen, to evaluation those genes in this pathway, to
see if there are some genes suitable for cancer biomarkers. Maybe for the further
work, the complexes pathway can be chosen for a larger work. In the GnRH pathway,
the approach to choosing the candidate genes is different with the other pathways.
Cause in this pathway there is no changing oncogenes and the downstream gene
from MAPK signaling pathway and Ras pathway are already collected of the former
selection. Therefore in this map, five genes were selected, three genes (GNRHR,
MMP14, CACN) are located on the cell surface. The downstream genes of BMK and
Pyk2 are not indicated in GnRH signaling pathway, shown in figure 3.5. If those two
genes play any roles in cancer occurrence, will be detected in the next process.
Figure 3.5 GnRH signaling pathway downloads from KEGG
Materials and Methods 21
3.2 Selected Candidate Genes
Altogether 27 genes were considered to be candidate biomarkers, the summary of
those genes shown in Table 3.1. Many of those candidates were chosen as down-
stream genes from cancer-related pathways (like RAS or MAPK etc.) and the onco-
genes alterations, those are the main way to selected genes from cancer pathways:
like LEF1, FOS, MYC, HEY1, ETS1 etc. Cause of the signaling cascades amplifica-
tion, tremendous changes of gene expression date will be expected in those candi-
dates between cancer patients and healthy individuals. Some of them were chosen
because of their ability of inhibition of apoptotic: like FOX01, CREB3, NFKB1. Some
genes selected from GnRH signaling pathway, the cause of their location on the cell
surface, it will be easily detectable and as a very effective for the drug target. The
genes on the cell surface in other cancer pathways, like Her-2, KIT, and EFGR etc.
were already used as cancer biomarkers [Table of Pharmacogenomic Biomarkers
in Drug Labeling,2016]. and some others like GFR, TRK etc. either contain many
other cancer pathways in KEGG or their function and the biological role was already
studied [Eggert A et al., 2000].
Table 3.1 the candidate genes from different pathways
3.3 Collection of Datasets
This section summarizes the datasets that were chosen and used to detect the po-
tential of candidate genes as cancer biomarkers. These potentials were measured
as the following: whether those genes have expression difference between cancer
patients and healthy individuals. Those DNA microarray datasets were chosen ac-
cording to this purpose. There are expression differences compared between nor-
mal Tissue from healthy individuals and tumor tissue from cancer patients, some
blood cells on the analysis of different tumors were also chosen. Nine different can-
cer types were chosen to analyses. Because 18 candidate genes were selected
from 5 cancer types pathways, so those 5 types datasets were chosen at first, and
the sample were all from a different tissue. Some other cancer types were chosen
Prostate cancer Thyroid cancer Pancreatic cancer Colorectal cancer Breast cancer RAS pathway GnRH signaling Pathway
FOX01(2308) PPARG(5468) NFKB1(4790) BIRC5(332) FLT4(2324) SHOC2(8036) GNRHR(2798)
MTOR(2475) RXRA(6256) MAPK8(5599) LEF1(51176) HEY1(23462) KSR1(8844) CACNA1C(775)
CREB3(10488) TGFB1(7040) CCND1(595) HES1(3280) PLA1A(51365) MMP14(4323)
HSP90AA1(3320) FOS(2353) HES5(388585) ETS1(2113) PTK2B(2185)
MYC(4609) MAPK7(5598)

22 Materials and Methods
as additional, 3 of those data sets were collected, whose sample were gathered
from blood cells: PBMC and Primary human monocytes.
Table 3.2 the microarray datasets from GEO
As shown in Table 3.2, those datasets are from the same platform U133 Plus 2.0,
to reduce the sample bias caused of crossed platforms.
3.4 Data Processing
This section demonstrates the use of Bioconductor in the analysis of Microarray
datasets: from download to the gene expression profiling.
3.4.1 Data Pretreatment
The microarray analysis is performing by R language of using different packages
from Bioconductor. In order to perform the analysis, the first step is downloading
each dataset by GEOquery package. Then the dataset would be compared with
them.
There are two different way to use the package GEOquery: man can either down-
load the data that has been pre-processed by providers, or the raw data from GEO.
The pre-processed datasets were downloaded at first, by using very simple codes
and few minutes, the first brief review can be made as follow. With drowning a box-
plot like a figure 3.6. The difference between the two datasets was shown directly:
the center lines of each chip of dataset GSE 26910 are basically in a line, and in
dataset GSE3678, the central line of the first two chips (GMS85222, GMS85223)
are not in a line. And the expression value of GSE 26910 were dueled with log 2,
but GSE3678 were not. So, the expression value of GSE 26910 is between 2 and
8. The GSE3678 is up to near 200.
ID platform Information Normal Tumor Tissue
GSE26910 U133 Plus 2.0 Prostate tumor 6 6 Prostate
GSE26910 U133 Plus 2.0 Breast tumor 6 6 Breast
GSE49515 U133 Plus 2.0 Gastric cancer 3 10 PBMC
GSE32323 U133 Plus 2.0 Colorectal cancer 17 17 Colorectal
GSE3678 U133 Plus 2.0 thyroid tumor 7 7 Thyroid
GSE18842 U133 Plus 2.0 NSC lung tumor 45 46 Lung
GSE49515 U133 Plus 2.0 HCC cancer 10 10 PBMC
GSE65517 U133 Plus 2.0 Metastatic Breast tumor 4 3 Primary human monocytes
GSE16515 U133 Plus 2.0 Pancreatic cancer 36 14 Pancreatic

Materials and Methods 23
Figure 3.6 Two Boxplot of GSE26910 breast sample (lift) and GSE3678(right). The X axis
represents the Chips name; The Y axis represents the expression value. 6 breast cancer
samples and 6 healthy samples were included in the GSE26910 datasets. In GSE3678
dataset content 7 cancer samples and 7 normal samples.
Figure 3.7 Boxplot of GSE18842

24 Materials and Methods
As shown in Figure 3.7, the central line of the chips GSM467031 and GSM467033
are not in a line, as well as GSM466973 and GSM466975. The expression value of
dataset GSE18842 is also transformed with log 2.
As a brief review from this section, the data sets cannot directly be used, they
weren’t used the appropriate normalizations method, and GSE3678 was not used
log2 deformation. The proposal of build the expression difference matrices must
begin with the row data.
In the following sections, the dataset GSE18842 would be used as an example to
evaluate and integrate. To analyze the dataset, a quality control should be done.
For this Microarray, I used the R code “image (data [,1])” to see the chip grayscale
map of the first chip, shown in figure 3.8. In the upper left corner, would be the Chips
name on it, and depends on we see the name or not can help us to understand if
the chip data is reliable.
Figure 3.8 grayscale map of the first chip of GSE18842.
A simple evaluation method is better than the direct image method, which is based
on several average evaluations. A common feature of these methods Is to assume
that a set of experiments in each of the chip data for an average value of the indi-
cators are not quite different. Affymetrix company described in detail these stand-
ards in the guide manual [User Guide, 2012], and They are:
Materials and Methods 25
1. Scaling factor: The average value of all probes on each chip is used to determine
the scale factor. Assuming the chip expression values ranged from 0 to 200, the
average value is 100. If there are two chips to the comparison, the first chip
average value is 50, second chip value is 200 so their scaling factor is 2 (50/100)
and 0.5 (100/50). In accordance with the standards of Affymetrix, the scale factor
for comparison between the chips must be less than 3 [User Guide, 2012], Under
this assumption, 2/0.5 is equal to 4, is greater than 3, so these two chips cannot
be used for comparison.
2. Detection call and Percent present: A set of probes can be detected: Present,
Absent, and Marginal present.
3. Average background: For each chip, according to all the MM values (chapter
2.3), the average value of background noise can be obtained, so does the Mini-
mum and maximum values.
4. Internal control genes: mRNA is degraded from the 5 ′ end to 3'end, chip probe
group is also designed according to this order, So the measurement results of
the probe group can be reflected in this trend. Because most cells contain ß-
actin and GAPDH genes, they are chosen as Internal control genes set in Affy-
metrix chips, to observe the degradation degree of RNA. The probe groups for
these two genes are well covered from their 3’ end to the 5’ end. Using the divi-
sion of the signal intensity between 3’ end and 5’ end can be a good indicator of
the quality of the experiment. Affymetrix suggested the threshold of actin3/actin5
is less than 3, gapdh3/gapdh5 is less than 1.25.
26 Materials and Methods
Figure 3.9 A quality control chart of the part of GSE18842.
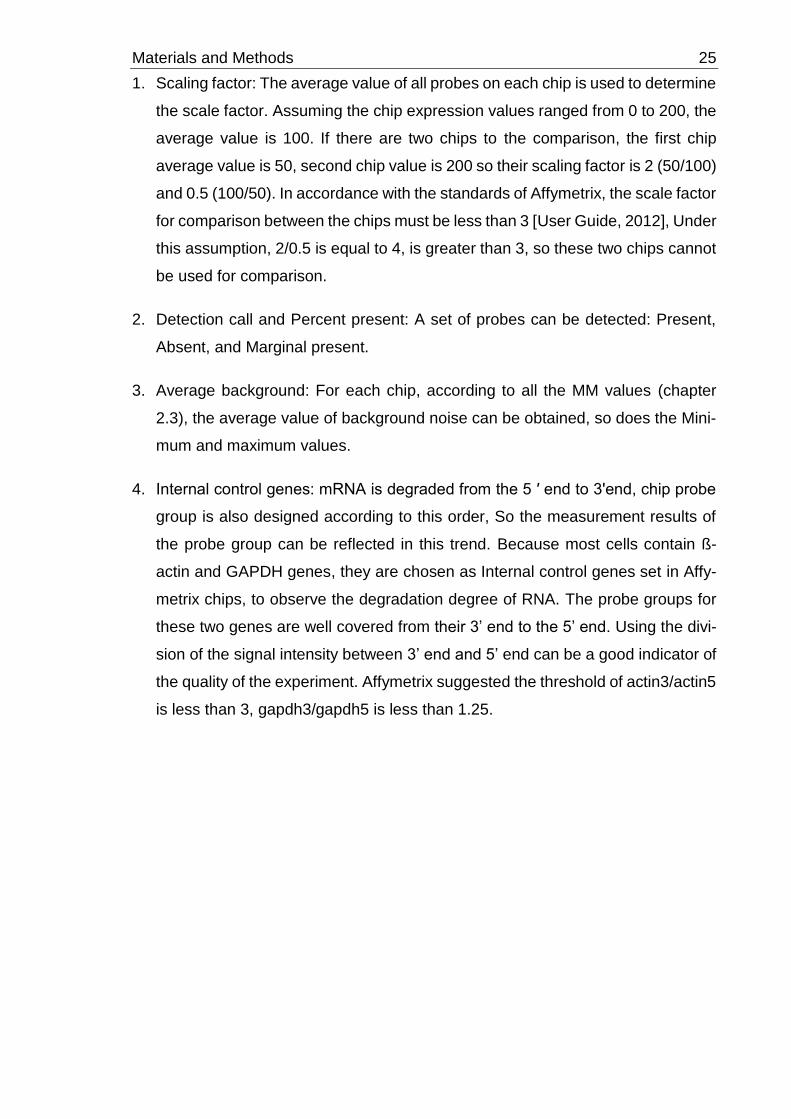
As shown in the figure 3.9, from lift to right: the first column is the name of the chips,
there are two numbers for each chip on the second column, the number above is
percent present, and the number under is average background, the third column is
coordinate of the scaling factor and graph 3’/5’ and actin 3’/5’. The blue solid circle
is a scaling factor; the triangle presented actin 3’/5’. For a full view of datasets,
GSE18842 is presented in Appendix 9. In order to facilitate the explanation of those
indexes, I chose 4 chips of GSE18842 data sets to drown this quality control chart.
When all the three indexes are blue, then this data sets is up to standard. One red
index is not assumed that the experiment is failed, but if all indexes of the same chip
are abnormal, that means this chip is useless. From the view of this QC chart, there
are some red indexes of some chips, but those chips have also blue indexes. The
absolute value of scaling factors of all the chips are under 3, and either chip has all
abnormal indexes. It is hard to decide, whether those chips are all good to use or
not. So, the further study will take in the following.
RNA degradation is an important factor that affects the quality of the micorarray data.
Because the RNA is from 5' end to degrading, So the fluorescence intensity of the
probe 5'end, in theory, should be lower than that of the 3' end. The slope of the RNA
degradation curve shows the trend, the smaller the slope, the less of the degradation;
On the contrary, the more degradation. However, if the slope is too small, or even
close to 0, we should pay special attention to, This does not represent no

Materials and Methods 27
degradation of RNA sample, and may all the RNA were degraded. Because, in the
actual experiment, no degradation of RNA is not possible, It may be because the
degradation of RNA is too serious, it leads to the calculated value of close to 0.
Figur 3.10 RNA degradation plot of each chip in datasets GSE18842. This plot shows that
The slope of the RNA degradation curve is slightly rose from 5’ to 3’.
All chips of datasets GSE18842 have indicated trends, that can be seeing in the
figure 3.10, the RNA sample during the chip experiment degraded from 5’ end.
Section 3.4.1 illustrates the quality control with GSE18842 as an example. The other
datasets that selected, would all through this processes to assess, whether they are
suitable for next statistical analysis.
3.4.2 Data Integration
After evaluation and selection, those datasets need to be preprocessed, before the
expression matrices were established. Use the integration algorithm, those data
sets will achieve both background control and normalization. In the Bioconductor
package, there are about three kinds of integration algorithms: dChip, MAS5 and
RMA. However, in practical work, the MAS5 and RMA algorithm are more frequently
used than dChip. Because the dChip is a not-open source, and not integrated by
Bioconductor. The differences between MAS5 and RMA algorithm, are discussed in
the following:

28 Materials and Methods
Each chip can separately use MAS5 to accomplish the normalization, RMA
is used multi-chip model, all the chips need to be normalized at once.
MAS5 using MM (chapter 2.3) probe information to remove background noise,
the basic idea is PM-MM, RMA does not apply MM information, but PM based on
the signal distribution using a random model to estimate the expression.
RMA processing data is into log2 conversion, and MAS5 is not, this is very
important because a lot of chip analysis software or function needs of the input data
must be converted to a log2.
By drawing the signal strength distribution graph and the box line graph, we can
compare the different algorithms.
From the point of view of the signal intensity distribution, the MAS5 algorithm has a
lot of negative numbers, and the curves are not coincident with each other. The
original does not coincide with the multiple distribution curves after used the RMA
algorithm are a coincidence in the together. If the gcRMA algorithm is used, not only
all the curves are well coincident, but also their distribution is more similar to Gauss
distribution. Therefore, the gcRMA algorithm to improve the RMA performance in
this group of the dataset is very obvious. However, this does not mean that the
gcRMA algorithm is always better than the RMA algorithm, for different data, need
to compare the algorithm, in order to further determine which algorithm is the most
suitable.
Materials and Methods 29
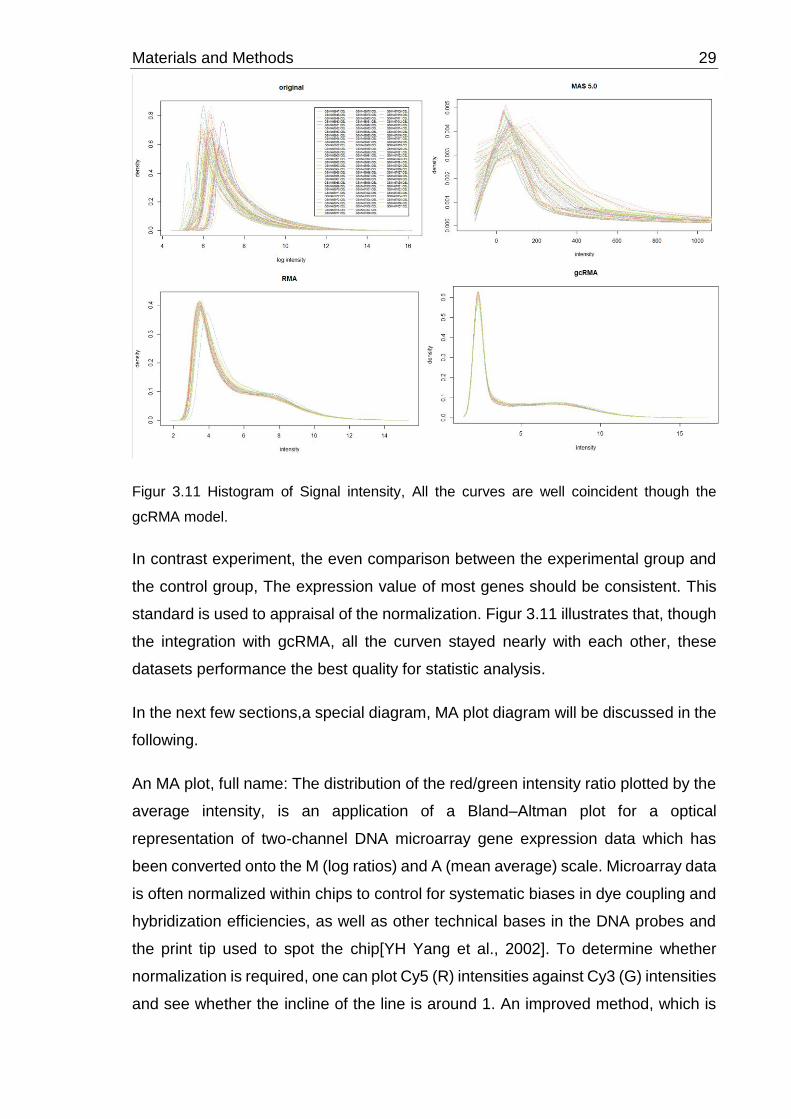
Figur 3.11 Histogram of Signal intensity, All the curves are well coincident though the
gcRMA model.
In contrast experiment, the even comparison between the experimental group and
the control group, The expression value of most genes should be consistent. This
standard is used to appraisal of the normalization. Figur 3.11 illustrates that, though
the integration with gcRMA, all the curven stayed nearly with each other, these
datasets performance the best quality for statistic analysis.
In the next few sections,a special diagram, MA plot diagram will be discussed in the
following.
An MA plot, full name: The distribution of the red/green intensity ratio plotted by the
average intensity, is an application of a Bland–Altman plot for a optical
representation of two-channel DNA microarray gene expression data which has
been converted onto the M (log ratios) and A (mean average) scale. Microarray data
is often normalized within chips to control for systematic biases in dye coupling and
hybridization efficiencies, as well as other technical bases in the DNA probes and
the print tip used to spot the chip[YH Yang et al., 2002]. To determine whether
normalization is required, one can plot Cy5 (R) intensities against Cy3 (G) intensities
and see whether the incline of the line is around 1. An improved method, which is

30 Materials and Methods
basically a scaled, 45-degree rotation of the R vs. G plot is an MA-plot.[Dudoit S et
al.,2002]. The MA-plot is a plot of the distribution of the red/green intensity ratio ('M')
plotted by the average intensity ('A'). M and A are defined by the following equations.
𝑀 = log2(𝑅/𝐺) (3.1)
A = 1
2∗ log2(𝑅 ∗ 𝐺) (3.2)
Where the R is plot Cy5 (Red) intensities,and G is plot Cy3 (G) intensities. For the
signal channel microarrays, The gene expression value is related to the intensity of
a single signal, then the R and G can be replaced with the expression value from
one and another chip.
In many microarray gene expression experiments, a fundamental assumption is that
most of the genes would not see any change in their expression, therefore, the
majority of the points on the y-axis (M) would be located at 0 since Log(1) is 0. If this
is not the state, then a normalization method should be applied to the data before
statistical analysis.
And in this study, all data sets were chosen from the platform U133 plus 2.0, this is
a one channel DNA microarray platform. In this platform, R and G are not the
red/green intensity ratio, their R and G represented the value from the two compared
chips. Like figure 3.12 and figure 3.13, the GSM466947, GSM466948, GSM466949,
GSM466950 from GSE18842 were compared between every two chips, before and
after normalization.

Materials and Methods 31
Figure 3.12 MA plot with original data of GSE18842.The red line is not overlapped with the
0 line, the Median of each MA plot are not 0.
Figure 3.13 MA plot used gcRMA data. After used gcRMA model, the red line overlapped
the 0 line, and all the median are 0.
32 Materials and Methods
For the dataset GSE18842, gcRMA method was used to carry out the background
correction and normalization. The same analysis was also used for the other data
sets,and also gcRMA method was chosen for the background correction and
normalization of all the data set. That doesn’t mean that gcRMA is always better
than other two methods.
The reason ,why gcRMA were chosen as the integration method is that this method
is better than MAS5.0 in most of the datasets, it is only a little change between RMA
and gcRMA, shown in figure 3.11: a blue curve in RMA model is not good coincident
with other curves. RMA and gcRMA are both with log2 conversion, are ready for the
limma package, gcRMA is a derivative of RMA, and shown a little better than RMA
in many data sets. After all data sets were analyzed with the same process, that
ruled before, all the data sets were integrated with gcRMA model.
3.4.3 Build Expression Difference Matrices
After the integrated of all those data sets, all the samples in those datasets were
divided. Some data sets have a variety of cancer and negative control, the data set
has also been split into a number of groups. According to different objects of different
data sets, those data were divided into cancer group and normal group. Then those
datasets were according to different types of cancer respectively analyzed. Limma
packet was used to do the analysis and calculation of those datasets. Limma packet
is a comprehensive software package, that based on R and Bioconductor ,used for
the analysis of microarray data. This package features a complete, high rate of use,
has become a synonym for the process of microarray data processing[Smyth,G,
2004]. The main design of Limma application is as following : the experimental
matrix, linear simulation, Bayes test and generate the results of the report.
The differential expression matrix was produced as a result for each type of cancer
datasets. This is the final result of transpose into EXCEL form.

Materials and Methods 33
Table 3.3 An example of expression difference Matrix of dataset GSE26910, and they are
sorted with the value of adj.P.Val.
As shown in the Table 3.3, The first and second columns in the table of "ID" is a
probe group of Affymetrix ID, the third column is the "adj.P.Value" is to adjust the P
value, the fourth column is the "P.Value" is the Bayes test to obtain the value of P,
the fifth column "t" is “t value “used Bayes test after the adjustment of the two groups
of expression values of T test. Sixth column "B" is the empirical Bayes test to get
the standard deviation of the logarithm value. The seventh column of” logFC” is the
two group of expression values to 2 for the background of the change of multiple,
because, before the use of limma packet, all the data are carried out with log2, so
here is actually just the difference between the value of the two groups of gene
expression. And the rest of the columns are “Gene ID”,” Gene symbol”.
Fold change (FC) was first applied to the analysis of microarray data. This method
is based on the ratio value of the gene chip from large to small sort, Ratio is the ratio
of cy3/cy5, also known as R/G value. There was no significant difference in the ex-
pression of genes in the 0.5-2.0 range, but the expression of the gene was signifi-
cantly changed. Due to the different experimental conditions, this threshold range
will be adjusted according to the confidence interval [Gerhold D et al.,2001; Mutch
DM et al.,2002]. The advantage of this method is that the need of the chip is less,
and the research cost is saved; the disadvantage is that the conclusion is too simple.
ID adj.P.Val P.Value t B logFC Gene.ID Gene.symbol
219059_s_at 219059_s_at 0,04422383 8,21E-07 17,7423179 3,82239309 4,39090333 10894 LYVE1
209774_x_at 209774_x_at 0,04422383 1,62E-06 15,9747411 3,60341869 3,58809 2920 CXCL2
203980_at 203980_at 0,04436285 2,43E-06 14,9923376 3,45546291 4,83247 2167 FABP4
236383_at 236383_at 0,04804228 4,49E-06 13,6277876 3,20999258 4,29079667
209189_at 209189_at 0,04804228 5,06E-06 13,3738356 3,1582775 3,29689333 2353 FOS
232541_at 232541_at 0,04804228 5,27E-06 13,2887115 3,14047121 3,75169
1552509_a_at1552509_a_at 0,08688237 1,11E-05 11,8164793 2,7902233 4,18646 146894 CD300LG
221841_s_at 221841_s_at 0,09242166 1,46E-05 11,3206657 2,65161462 5,20933667 9314 KLF4
213900_at 213900_at 0,09242166 1,64E-05 11,1090749 2,5888033 2,98721333 9413 FAM189A2
209555_s_at 209555_s_at 0,09242166 1,71E-05 11,0397841 2,56773255 4,47852 948 CD36
203910_at 203910_at 0,09242166 1,86E-05 10,8923901 2,52206361 2,29612667 9411 ARHGAP29
235489_at 235489_at 0,09573757 2,22E-05 10,5857548 2,42322349 2,29777667 57381 RHOJ
231181_at 231181_at 0,09573757 2,28E-05 10,5469527 2,41033446 4,14069667
233261_at 233261_at 0,1276125 3,57E-05 9,81371094 2,14938818 2,79773 1879 EBF1
219064_at 219064_at 0,1276125 3,74E-05 9,74027917 2,12132564 2,29117 80760 ITIH5
232165_at 232165_at 0,1276125 3,89E-05 -9,6785012 2,09742775 -3,0035733 83481 EPPK1
206030_at 206030_at 0,1276125 4,03E-05 9,62256778 2,07555986 4,49244 443 ASPA
242541_at 242541_at 0,1276125 4,37E-05 9,49816677 2,02612365 2,25247 10350 ABCA9
242197_x_at 242197_x_at 0,1276125 4,43E-05 9,47669267 2,01747665 3,55083 948 CD36
204482_at 204482_at 0,12878851 4,87E-05 9,33472676 1,9594546 3,13267 7122 CLDN5
1569607_s_at1569607_s_at 0,12878851 4,95E-05 9,3108457 1,94954617 3,87567333 102725051///102723891///728747///441430///441425///440482///391267///284232///84210LOC102725051///LOC102723891///ANKRD20A4///ANKRD20A2///ANKRD20A3///ANKRD20A5P///ANKRD20A11P///ANKRD20A9P///ANKRD20A1
228770_at 228770_at 0,12913562 5,20E-05 9,23697953 1,91862387 2,92304 115330 GPR146
206742_at 206742_at 0,13096558 5,51E-05 9,1498037 1,88158872 5,65017 100532742///2277PIR-FIGF///FIGF

34 Materials and Methods
By using limma package, the Fold change(FC) is presented as logFC in the expres-
sion difference matrices.
In this study, adj.P.Value was used though Benjamini & Hochberg’ model. this so
called False discovery rate. The false discovery rate (FDR) is one way of conceptu-
alizing the rate of type I errors in null hypothesis testing when conducting multiple
comparisons [Benjamini et al.,1995].
In this work, the potential cancer biomarkers should be easily detectable, therefore,
a highly diverse between cancer patients to healthy individually is required. That
means those candidates must have the obvious difference in gene expression. Thus
the threshold of the absolute value of log FC was set to 1.5, P value and adj.P.Value
is 0.05.
For all the differences in expression matrix, 27 candidate genes were checked in
the output expression matrix and used the threshold value that Mentioned above.
To find out whether they have differences in expression between cancer group and
healthy group. If a gene candidate has an absolute value of logFC bigger than 1.5,
and P.value and adj. P.Value is smaller than 0.05, this candidate gene was differ-
entially expressed gene between cancer and normal sample.
Materials and Methods 35
4 Result
Altogether, 27 genes were analyzed in different expression matrices. First, the dif-
ferentially expressed genes were found in the following table 4.1.
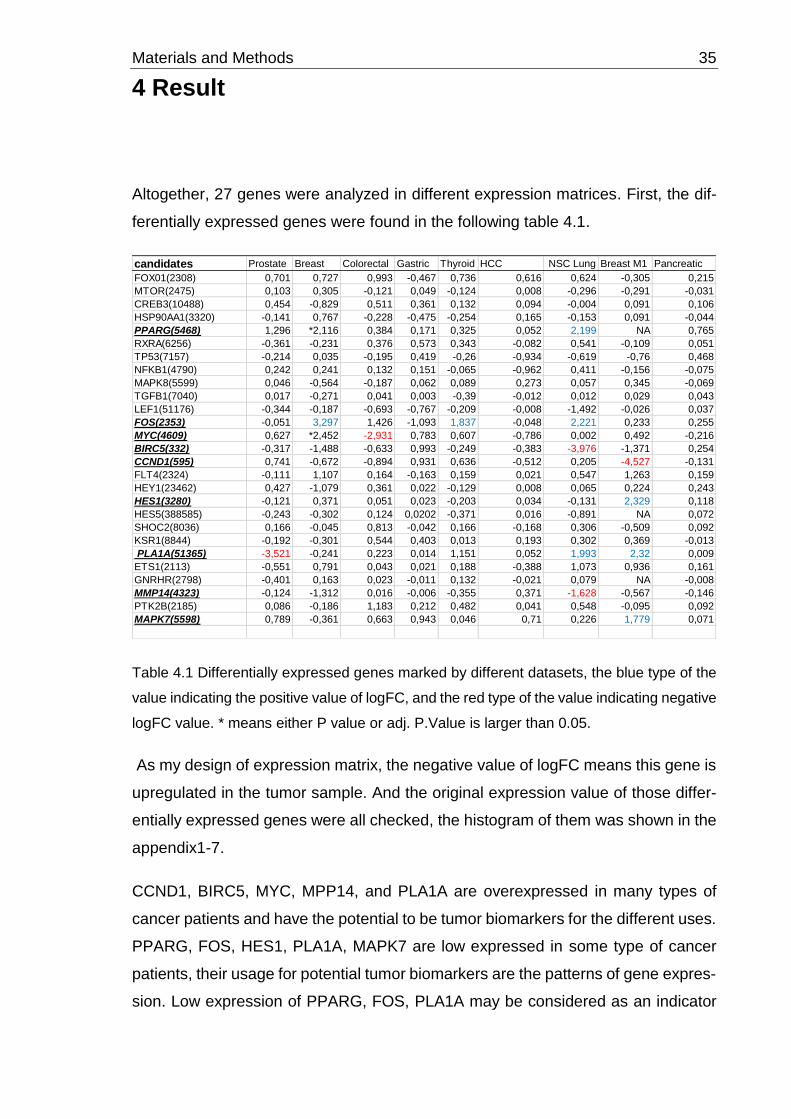
Table 4.1 Differentially expressed genes marked by different datasets, the blue type of the
value indicating the positive value of logFC, and the red type of the value indicating negative
logFC value. * means either P value or adj. P.Value is larger than 0.05.
As my design of expression matrix, the negative value of logFC means this gene is
upregulated in the tumor sample. And the original expression value of those differ-
entially expressed genes were all checked, the histogram of them was shown in the
appendix1-7.
CCND1, BIRC5, MYC, MPP14, and PLA1A are overexpressed in many types of
cancer patients and have the potential to be tumor biomarkers for the different uses.
PPARG, FOS, HES1, PLA1A, MAPK7 are low expressed in some type of cancer
patients, their usage for potential tumor biomarkers are the patterns of gene expres-
sion. Low expression of PPARG, FOS, PLA1A may be considered as an indicator
candidates Prostate Breast Colorectal Gastric Thyroid HCC NSC Lung Breast M1 Pancreatic
FOX01(2308) 0,701 0,727 0,993 -0,467 0,736 0,616 0,624 -0,305 0,215
MTOR(2475) 0,103 0,305 -0,121 0,049 -0,124 0,008 -0,296 -0,291 -0,031
CREB3(10488) 0,454 -0,829 0,511 0,361 0,132 0,094 -0,004 0,091 0,106
HSP90AA1(3320) -0,141 0,767 -0,228 -0,475 -0,254 0,165 -0,153 0,091 -0,044
PPARG(5468) 1,296 *2,116 0,384 0,171 0,325 0,052 2,199 NA 0,765
RXRA(6256) -0,361 -0,231 0,376 0,573 0,343 -0,082 0,541 -0,109 0,051
TP53(7157) -0,214 0,035 -0,195 0,419 -0,26 -0,934 -0,619 -0,76 0,468
NFKB1(4790) 0,242 0,241 0,132 0,151 -0,065 -0,962 0,411 -0,156 -0,075
MAPK8(5599) 0,046 -0,564 -0,187 0,062 0,089 0,273 0,057 0,345 -0,069
TGFB1(7040) 0,017 -0,271 0,041 0,003 -0,39 -0,012 0,012 0,029 0,043
LEF1(51176) -0,344 -0,187 -0,693 -0,767 -0,209 -0,008 -1,492 -0,026 0,037
FOS(2353) -0,051 3,297 1,426 -1,093 1,837 -0,048 2,221 0,233 0,255
MYC(4609) 0,627 *2,452 -2,931 0,783 0,607 -0,786 0,002 0,492 -0,216
BIRC5(332) -0,317 -1,488 -0,633 0,993 -0,249 -0,383 -3,976 -1,371 0,254
CCND1(595) 0,741 -0,672 -0,894 0,931 0,636 -0,512 0,205 -4,527 -0,131
FLT4(2324) -0,111 1,107 0,164 -0,163 0,159 0,021 0,547 1,263 0,159
HEY1(23462) 0,427 -1,079 0,361 0,022 -0,129 0,008 0,065 0,224 0,243
HES1(3280) -0,121 0,371 0,051 0,023 -0,203 0,034 -0,131 2,329 0,118
HES5(388585) -0,243 -0,302 0,124 0,0202 -0,371 0,016 -0,891 NA 0,072
SHOC2(8036) 0,166 -0,045 0,813 -0,042 0,166 -0,168 0,306 -0,509 0,092
KSR1(8844) -0,192 -0,301 0,544 0,403 0,013 0,193 0,302 0,369 -0,013
PLA1A(51365) -3,521 -0,241 0,223 0,014 1,151 0,052 1,993 2,32 0,009
ETS1(2113) -0,551 0,791 0,043 0,021 0,188 -0,388 1,073 0,936 0,161
GNRHR(2798) -0,401 0,163 0,023 -0,011 0,132 -0,021 0,079 NA -0,008
MMP14(4323) -0,124 -1,312 0,016 -0,006 -0,355 0,371 -1,628 -0,567 -0,146
PTK2B(2185) 0,086 -0,186 1,183 0,212 0,482 0,041 0,548 -0,095 0,092
MAPK7(5598) 0,789 -0,361 0,663 0,943 0,046 0,71 0,226 1,779 0,071
36 Materials and Methods
for NSC lung cancer, low expressed HES1, PLA1A and MAPK7 may be used to
detect the metastasis of breast cancer, FOS also has the potential as a biomarker
for breast and Thyroid cancer.
Because most tumor markers are produced at much higher levels in cancerous con-
ditions. Therefore, the potential of the five overexpressed genes will be discussed
emphasis.
4.1 Candidate Biomarkers
Cyclin-D1 protein plays an important part in the progress of the cells in the cell cycle
G1 phase. Cyclin-D1 protein gene, CCND1 amplification in about 20% of breast
cancer, this protein is over-expression in about 50% of cases. This led to determine
the further research of cycle D1 protein as a biomarker in breast cancer; However,
according to the clinical work, it hasn’t approved as a biomarker in use [Barnes DM
1998].
Survivin also called BIRC5 is found by Altieri, et al. in 1997, is the IAP (inhibitor of
apoptosis of protein) members of the family, is composed of 142 amino acids of
relative molecular mass of 16. 5 x 10³ protein. Survivin is known to be expressed
during fetal development and across most tumor cell types but is rarely extend in
normal, non-malignant adult cells [Altieri DC et al.,1997]. Tamm et al. showed that
overexpression of survivin has been reported in various human malignancies, al-
most all cancers have choice survivin expression profile compared to normal tissues
[Tamm I et al., 1998]. The strategies of targeting survivin network have entered in
the clinical trials in humans [Altieri DC et al., 2006].
Myc (c-Myc/ v-myc avian myelocytomatosis viral oncogene homolog) is a regulator
gene that codes for a transcription factor. The protein encoded by this gene is a
multifunctional, nuclear phosphoprotein that plays a role in cell cycle progression,
apoptosis and cellular transformation [Myc. NCBI]. At present, the Myc gene mark-
ers are already used in the judgment of tumor and recurrence and metastasis [Gon-
zalez RM et al., 2011; Hassanein M et al.,2012; Zhu D et al.,2014].
MMP14 (also known as MT1 MMP) is a membrane type of matrix metalloprotein-
ases (MMPs), it was reported excesses expression in a wide variety of tumor cell
surface, it can degrade extracellular matrix of ingredients and can activate MMP2

Materials and Methods 37
and MMP13, is considered to be the key enzyme of tumor invasion and metastasis.
MMP14 inhibitors have become the research focus, to develop a specific inhibitor
of MMP14 for cancer treatment is very significantly [Bowen Tan, 2001].
Lucia Sepiashvili et al. has studied the potential of MMP14 as a tumor biomarker for
head and neck squamous cell carcinoma [Lusia Sepiashvili et al., 2012]. For the
following research, their discovery strategy can be also used to detect the potential
of MMP14 as a biomarker for NSC lung cancer.
There is no clear evidence that PLA1A is directly related to the occurrence of pros-
tate cancer. According to the research of Scott A. Tomlins et al., PLA1A was identi-
fied as direct targets of TMPRSS2/ERG gene fusions [Scott A et al., 2008]. The
previous studies on TMPRSS2/ERG gene fusions showed that, TMPRSS2-ERG fu-
sion gene is the most frequent, present in 40% - 80% of prostate cancers in humans,
depending on the clinical stage [Wang J et al.,2006; Cerveira N et al., 2006; Clark J
et al., 2007; Perner S et al.,2006; Yoshimoto M et al.,2006; Rajput AB et al., 2007;
Mehra R et al., 2007; Nam RK et al.,2007; Lapointe J et al.,2007; Demichelis F et
al.,2007; Soller MJ et al.,2006; Attard G et al.,2008]. PLA1A overexpression in pros-
tate cancer sample has the potential for representation on TMPRSS2/ERG gene
fusions of prostate cancer.
4.2 Further Study of MMPs and PLA1A
Matrix metalloproteases (MMPs), also known as matrixins, are a multigene family
of zinc-dependent endopeptidases that share a similar structure and they all have
the capacity to degrade virtually every component of the extracellular matrix (ECM)
[Verma RP et al.,2007].The matrix metalloproteinase (MMP) family of extracellular
proteinases have long been associated with cancer invasion and metastasis by vir-
tue of their ability to collectively degrade all components of the extracellular matrix
(ECM) [Michelle D et al.,2007].
Using the expression difference matrix, that established in this study, a preliminary
study of MMPs as a tumor biomarker can be presented in Table 5.1

38 Materials and Methods
Table 4.2 The potential of MMPs as tumor biomarkers used the expression different matrix
In this table 4.2 is shown that MMPs has a variety potential as tumor biomarkers.
For example, MMP1, MMP3, and MMP7 can choose to be the biomarkers for colo-
rectal cancer. For thyroid cancer, MMP7 and MMP16 both have the potential to be
tumor biomarkers. For NSC lung cancer, MMP1, MMP13, MMP3, MMP10, MMP11,
MMP12, MMP14 can be used as potential tumor biomarkers for the future study.
MMP8, MMP9, MMP25, MMP20, MMP23 can be considered as potential bi-
omarkers for metastasis breast cancer. The MMPs family is one of the most im-
portant regulatory molecules in the process of tumor invasion and metastasis. so
the understanding of the role of each MMPs of cancer metastasis may show the
potential biomarkers for the cancer metastasis.
For the applications of MMPs in human cancers are as potential tumor biomarkers
for diagnostic and prognostic. I have collected some of the studies, that analyzed
the potential of MMPs as tumor biomarkers and compared with this study, shown in
table 4.3 in the following.
Candidates Prostate Breast Colorectal Gastric Thyroid HCC NSC Lung Breast M1 Pancreatic
Collagenases MMP1 √ √
MMP8 √
MMP13 √
MMp18
Gelatinases MMP2
MMP9 √ √
Stromelysins MMP3 √ √
MMP10 √
Stromelysin like MMPsMMP11 √
MMP12 √
Matrilysins MMP7 √ √
MMP26
Membrane type MMPsMMP14 √
MMP15
MMP16 √
MMP17
MMP24
MMP25 √
Other MMPs MMP19
MMP20 √
MMP21
MMP22
MMP23 √
MMP27
MMP28 √

Materials and Methods 39
Cancer type and MMPs (former
studies)
Detected in Tissue/Body
Fluid
Method of Analysis Cancer type and MMPs
(this study)
Breast
MMP13 [Zhang B et al.,2008]
MMP9 [Wu ZS et al., 2008;
Fernandez CA et al.,2005;
Ranuncolo SM et al.,2003]
MMP1 [Poola I et al., 2005]
Tissue
Urine, serum, plasma, tis-
sue
Tissue, nipple aspirates
IHC
ELISA, IHC, Gelatin zymo-
graphy
Gene analysis
Breast (metastasis)
MMP8
MMP9
MMP25
MMP20
MMP23
Lung
MMP9 [Jumper C et al.,2004]
MMP7 [Liu D et al.,2007]
MMP1 [Su L et al., 2005;
Sauter W et al.,2008]
Serum, bronchial lavage
Tissue
Tissue
ELISA
IHC
Gene analysis
Lung (NSC)
MMP1,
MMP13,
MMP3,
MMP10,
MMP11,
MMP12,
MMP14
Colorectal
MMP2 [Hilska M et al.,2007;
Langenskiold M et al.,2005;
Tutton MG et al., 2003]
MMP9 [Cho YB et al., 2007]
MMP7 [Maurel J et al.,2007]
MMP13 [Leeman MF et al.,2002]
MMP1 [Baker EA et al.,2003]
Tissue, plasma
Tissue
Serum
Tissue
Tissue
IHC, ELISA
IHC
ELISA
Gelatin zymography
ELISA
Colorectal
MMP1,
MMP3
MMP7
Table 4.3 A comparison of candidate MMP biomarker of cancer between the former stud-
ies and this study.
Compared to this study and predecessors, numbers of overexpression of MMPs
according to in cancer with this study have not been successful as tumor biomarkers
analyzed in the former research, for instance, MMP8, MMP25, MMP20, MMP23 as
potential biomarkers for metastasis breast cancer; And maybe MMP3, MPP10,
MPP11, MPP12, MPP13, MPP14 as candidate biomarkers for NSC lung cancer;
MPP3 for colorectal cancer as potential biomarkers. Those candidates are the novel
potential tumor biomarkers that should be analyzed with various detection strategies.
There are some in common can be found by comparing between previous work with
this work, like MPP1 as tumor biomarker for Colorectal cancer is confirmed both in
this study and the former studies [Baker EA et al.,2003]. MMP7 for Colorectal cancer
biomarker, MMP1 for lung cancer.
Scott A. Tomlins et al. have reported on, those four genes, CACNA1D, KCNS3,
LAMC2, and PLA1A have a greater correlation with TMPRSS2/ERG fusion across
multiple prostate cancer profiling studies, also LAMC2, KCNS3, and PLA1A as di-
rect targets of ERG were identified [Scott A et al., 2008].

40 Materials and Methods
The gene expression matrices in this study were also used to evaluate the expres-
sion difference between cancer and healthy for these four genes: CACNA1D,
KCNS3, LAMC2, and PLA1A. Only PLA1A and KCNS3 has funded the difference
expression between cancer and healthy. KCNS3 were overexpressed in prostate
cancer, so maybe KCNS3 can also be used as a potential biomarker for prostate
cancer.
PLA1A and KCNS3 were not related to any particular cancer pathway in KEGG
pathways, KCNS3 was even not involved in any pathways in KEGG pathway data-
bases.
In conclusion, two genes, and one protein family were considered as novel bi-
omarkers in this study: PLA1A for prostate cancer, MMP14 for NSC lung cancer,
KCNS3 may have the potential to be a prostate cancer biomarker, the MMPs family
for many kinds of cancer and may be also indicators for cancer metastasis.

5 Discussion 41
5 Discussion
Those 3 genes, that mentioned in the last chapter, should be tested in a clinical trial:
the potential of PLA1A and KCNS3 as prostate cancer biomarkers, MMP14 as NSC
lung cancer biomarker. To understanding the role of these two genes: PLA1A and
KCNS3 in the occurrence of prostate cancer, a further study should be taken more
detailed. As the review of Ras pathway in KEGG, PLA1A is a downstream gene of
the Ras-Raf-MEK pathway, and according to the research of Scott A. Tomlins et al.,
PLA1A is a target gene of TMPRSS2–ERG gene fusion in prostate cancer[Scott A
et al., 2008]. Up to now, PLA1A is neither in prostate cancer pathway nor in the
transcriptional misregulation in prostate cancer pathway, from KEGG databases.
The pathway of transcriptional misregulation in cancer was shown in appendix 8.
For more specific studies of those two genes PLA1A and KCNS3, requires the most
concrete samples to evaluation: healthy individual, prostate cancer with and without
TMPRSS2–ERG gene fusion.
The potential of MMPs as various tumor biomarkers has already proved in many
former studies. For diagnosis, prognosis and predicting therapeutic efficacy of can-
cers, a large-scale screen of expression profiling of MMPs in various cancer is very
useful for classification and discrimination. The cancer sample should ideally con-
clude the different stages of different cancer subtypes.
Even those potential tumor biomarkers were found, there are obviously some limi-
tations in this study. The processing of choosing the candidate genes contents some
subjectivity. Some of the genes that were chosen, there is no significant expression
difference. And 5 genes were selected on the colorectal cancer pathway, one gene
MYC was overexpressed in colorectal cancer expression profiling, only MYC has
the potential as a biomarker of colorectal cancer. More than 20 genes were selected
in this study, and in those cancer pathways, it contents generous candidate genes.
If there are some process on the integration of these genes in pathways, and then
using the transcription data to analyze, the maybe more potential tumor will be found.
Furthermore, the mechanisms of cancer and signaling pathway are complex and
42 5 Discussion
challenging to identify, and lack of appropriate study designs and analytic methods
aggravates the challenge.
The selection genes from KEGG is a process that cannot be quantified. There is an
idea from another direction: at first, analyze the massive transcription data from dif-
ferent type of cancers, then mapping the datasets into KEGG pathway, using the
machine learning algorithms to label candidate genes with the type of cancers.
Set the threshold to find differential expression of the candidate genes is also rela-
tively subjective, there is no conclusive, where the settings are. This study was de-
signed to find a good distinction between cancer patients and healthy individuals.
So a relatively high threshold has been chosen. If you cut down the threshold of
logFC to 1, There will be a further oncogene be funded.
These DNA microarray datasets are from the same platform U133 Plus 2.0, so the
selection of suitable datasets are limited. And in this work, a few types of cancer
datasets were used for analyzation, the lack of the date sets lead this work to a few
findings. For expansion of the data sets, the cross-platform microarray data analysis
is required. But there are also some difficulties, need to consume a lot of time to do
the normalization of data sets. Because the DNA microarray is expensive, and it is
very time-consuming to repeat the experiment, so that is very common for a small
sample of DNA microarray experiment. So some DNA microarray datasets that used
in this study are also small samples.
DNA microarray data is easy to have its background noise, and the experimental is
poorly repeatability, is now being replaced by RNA-seq technology. For a large
screen of tumor biomarkers, RNA-seq should be also an option. In the following
table, the Technical advantages of RNA-seq were discussed.

5 Discussion 43
Table 5.1 compares RNA-seq technology and DNA microarray[Gao Shan et al.,2014]
For the follow-up study of MMPs, using RNA-seq method to carry out large-scale
screening, is also a good choice.
DNA microarray RNA-seq technology
Bibliographye sequence need No need
Dynamic range Small Big
Background noise Big Small
Affected by degradation Big Small
Sequence variation Big Small
Transcriptional group direction Unable to detect Detectable
Repeatability. Normal High


6 Perspective 45
6 Perspective
As for the methodology, selection of candidate genes is limited to those genes,
which already studied in the KEGG cancer pathways. Even though, some novel
candidates were found with this method. However, that would result in very few out-
comes, either candidate genes were already studied as biomarkers, or there is no
further information to support these results. It is questionable how many candidate
genes from KEGG is available to be considered as “novel”. For the study of PLA1A,
may provide some new findings of the prostate cancer pathway. A further research
can be taken like this: using the model that provided in this work, find few candidates,
then mapping them to the PPI network, using a different strategy to detect more
candidate biomarkers.
The identification of the function of MMPs in cancer growth and metastasis can pro-
vide a large number of candidate tumor biomarkers and many effective anti-cancer
drug targets. For enhancing this method, using the huge amount of data in the GEO
database can be a big support: choosing different platform data expression data of
different cancer gene to analysis, to achieve the large screen processing for tumor
biomarkers and a global perceive of the whole cancer pathway. To achieve that, the
integration of the existing GEO DNA microarray datasets will be necessary, and
suitable algorithm of normalization for cross-platform datasets is required. Then
mapping the expression profiling to the KEGG pathways, using the different algo-
rithms to classify these genes.
Before those candidate biomarkers: MMP14, PLA1A, MMPs and KCNS3 can be put
into clinic use, it must undergo several stages of confirmation, validation, and qual-
ification for usage [Wagner,2002]. Analytical validation is the procedure of evaluat-
ing the assay or measurement performance characteristics, while qualification is the
evidentiary step of connecting a biomarker with the biology and clinical endpoints
(that is, clinical validity and utility).
A future study with RNA-seq technology might provide more sensitive expression
profiling and more comprehensive set of transcripts. Cause some genes in cancer

46 6 Perspective
pathway has no probe on the DNA Microarray platform: such as gene CSNK1A1L
of breast cancer pathway.

7 Summary 47
7 Summary
Tumor biomarkers have important significance in the diagnosis of cancer and per-
sonalized therapy for cancer. And this study is centered around the cell signaling
pathway to select a number of genes that may be related to the occurrence of cancer.
Then some cancer microarray data have downloaded from the GEO database.
Those datasets were integrated and analyzed. Several expression matrices were
generated. These candidate genes were tested in the matrices, to evaluate the po-
tential to be a tumor biomarker of those gene candidates. This evaluation model is
simply considered that gene expression profiling as the measurement for the poten-
tial.
As result, nine genes were considered as candidate genes, including MYC, BIRC5,
CCND1, PLA1A, MMP14, PPARG, FOS, HES1, and MAPK7, five of them are over-
expressed in cancer tissue, and they were deeply discussed.
Because the MYC BIRC5 are oncogenes, is associated with many types of cancer,
and already being considered as tumor biomarkers. Previous studies have found
that CCND1 gene has the potential as a biomarker for breast cancer, but the former
research didn't bring CCND1 to the clinic use. Gene MMP14 is also highly Associ-
ated with cancer, although this gene is selected from non-cancer and non-oncogene
pathways in KEGG pathway database. Because this gene located on the cell sur-
face, it will be easier to detected in clinic test as a biomarker. Recently, it was tested
as a tumor biomarker for Head and Neck Squamous Cell Carcinoma [Lusia Sepi-
ashvili et al., 2012]. In this study, it also has the potential to be a biomarker for NSC
lung cancer. PLA1A is very close associated with TMPRSS2 /ERG gene fusions,
and TMPRSS2/ERG gene fusions are also connected with the occurs of prostate
cancer. The potential of MMP14 and PLA1A as biomarkers would be studied with
further methods.
Two of these five genes has the great potential to become the tumor biomarkers,
and gene MPP14 lead me to one protein family, which have great potential as bi-
omarkers for many kinds of cancer type.

48 7 Summary
Considering the limited datasets and the not comprehensive analyzation of cancer
pathways, this method can only be considered as a pre-experiment.
8 Bibliography 49
8 Bibliography
[Altieri DC et al., 2006] Altieri DC. Mol Cancer Ther(2006).5(3):478-82.targeted ther-
apy by disabling cross road signaling networks: the survivin paradigm.
[Altieri DC et al.,1997] Altieri DC, Ambrosini G, Adida C (1997). A novel anti-apop-
tosis gene, survivin, expressed in cancer and lymphoma. Nat Med,1997,3(8):917-
921.
[Atkinson AJ et al.,2001] Atkinson AJ,Colbum WA, DeGruttola VG, et al.( 2001)
Biomarkers Definitions Working Group. Biomarkers and surrogate endpoints: pre-
ferred definitions and conceptual framework. Clin Pharmacol Ther, 69: 89-95
[Attard G et al.,2008] Attard G, Clark J, Ambroisine L, et al (2008). Duplication of the
fusion of TMPRSS2 to ERG sequences identifies fatal human prostate cancer.
Oncogene 27:253-63.
[Autio R et al., 2009] Autio R, Kilpinen S, Saarela M, et al(2009). Comparison of
Affymetrix data normalization methods using 6 926 experiments across five array
generations. BMC Bioinformatics, 10: S24
[Baker EA et al.,2003] Baker EA, Leaper DJ (2003): The plasminogen activator and
matrix metalloproteinase systems in colorectal cancer: Relationship to tumor pa-
thology. Eur J Cancer 39:981-988.
[Barnes DM et al.,1998] Barnes DM, Gillett CE (1998). "Cyclin D1 in breast can cer".
Breast Cancer Research and Treatment. 52 (1-3): 1–15.
doi:10.1023/a:1006103831990. PMID 10066068
[Bastien D et al., 2009] Bastien D. Gomperts, IJsbrand M. Kramer and Peter
E.R(2009). Tatham. Signal Transduction (Second Edition) Elsevier Inc. ISBN:
978-0-12-369441-6
[Benjamini et al.,1995] Benjamini, Yoav; Hochberg, Yosef (1995)."Controlling the
false discovery rate: a practical and powerful approach to multiple testing" (PDF).
Journal of the Royal Statistical Society, Series B. 57 (1): 289–300. MR 1325392.
50 8 Bibliography
[Bernad w et al.,2014] Bernad w et al(2014). World Cancer Report. International
Agency for Research on Cancer. ISBN 978-92-832-0443-5
[Bowen Tan, 2001] Bowen Tan (2001) 肿瘤相关成熟 MMP14 蛋白的结构模建及靶
向 MMP14 差异区多肽先导药物的筛选与研究
[Bradshaw et al., 2010] Bradshaw, Ralph A.; Dennis, Edward A., eds. (2010). Hand-
book of Cell Signaling (2nd ed.). Amsterdam, Netherlands: Academic Press. ISBN
9780123741455.
[Cerveira N et al., 2006] Cerveira N, Ribeiro FR, Peixoto A, et al(2006). TMPRSS2-
ERG gene fusion causing ERG overexpression precedes chromosome copy
number changes in prostate carcinomas and paired HGPIN lesions. Neoplasia
2006; 8:826-32.
[Cho YB et al., 2007] Cho YB, Lee WY, Song SY, et al (2007): Matrix
metalloproteinase-9 activity is associated with poor prognosis in T3-T4 node-neg-
ative colorectal cancer. Hum Pathol 38:1603-1610.
[Clark J et al., 2007] Clark J, Merson S, Jhavar S, et al(2007). Diversity of
TMPRSS2-ERG fusion transcripts in the human prostate. Oncogene; 26:2667-73.
[Critical Path, 2011] Critical Path 2010 Update(2011-7-4 last vision). url:
http://www.fda.gov/ScienceResearch/SpecialTopics/CriticalPathInitia-
tive/ucm204289.htm
[Croce CM, 2008] Croce CM (Jan 2008). "Oncogenes and cancer". N Engl J Med.
358 (5): 502–11. doi:10.1056/NEJMra072367. PMID 18234754
[Curtin JA et al.,2005] Curtin JA, Fridlyand J, Kageshita T, Patel HN, Busam KJ,
Kutzner H, Cho KH, Aiba S, Bröcker EB, LeBoit PE, Pinkel D, Bastian BC(2005).
Distinct sets of genetic alterations in melanoma. N Engl J Med. 353(20):2135-47.
[De Martel C et al.,2012] De Martel C, Ferlay J, Franceschi S et al.(2012). Global
burden of cancers attributable to infections in 2008: a review and synthetic anal-
ysis. Lancet Oncol

8 Bibliography 51
[Demichelis F et al.,2007] Demichelis F, Fall K, Perner S, et al (2007).
TMPRSS2:ERG gene fusion associated with lethal prostate cancer in a watchful
waiting cohort. Oncogene 26:4596-9.
[Dudoit S et al.,2002] Dudoit S, Yang YH, Callow MJ, Speed TP. (2002). Statistical
methods for identifying differentially expressed genes in replicated cDNA
microarray experiments. Stat. Sin. 12:1 111-139.
[Eggert A et al., 2000].Eggert A, Ikegaki N, Liu XG, Brodeur GM (2000).Prognostic
and biological role of neurotrophin-receptor TrkA and TrkB in neuroblastoma.
PMID: 10994551 DOI: 10.1055/s-2000-9677.
[E.M.Southern,1975] E.M.Southern(1975). Detection of specific sequences among
DNA fragments separated by gel electrophoresis. Journal of Molecular Biology.
[Engels EA et al., 2008] Engels EA, Biggar RJ, Hall HI, Cross H, Crutchfield A, Finch
JL, Grigg R, Hylton T, Pawlish KS, McNeel TS, Goedert JJ(2008). Cancer risk in
people infected with human immunodeficiency virus in the United States. Interna-
tional Journal of Cancer ; 123(1):187–194.
[Fan YL et al.,2013]. Fan YL, CHEN Daming, YU Jianrong(2013). Trends in bi-
omarker research and application. 生命的化学 , 2013, 33(3): 344-351
[Ferlay J et al.,2013] Ferlay J, Soerjomataram I, Ervik M et al.(2013). Cancer Inci-
dence and Mortality Worldwide: IARC Cancer Base No. 11 [Internet]. GLO-
BOCAN 2012 v1.0 Lyon: IARC. url: http://globocan.iarc.fr.
[Fernandez CA et al.,2005] Fernandez CA, Yan L, Louis G, et al (2005): The ma trix
metalloproteinase-9/neutrophil gelatinase associated lipocalin complex plays a
role in breast tumor growth and is present in the urine of breast cancer patients.
Clin Cancer Res 11:5390-5395.
[Gao Shan et al.,2014] Gao Shan, Ou Jianhong,Xiao KaiR (2014).语言与 Biocon-
dductor 生物信息学应用/高山,欧剑虹,肖凯. ISBN 978-7-5433-3360-4
[Gentleman, R. et al., 2005] Gentleman, R.; Carey, V.; Huber, W.; Irizarry, R.; Dudoit,
S. (2005). Bioinformatics and Computational Biology Solutions Using R and Bio-
conductor. Springer. ISBN 978-0-387-25146-2.

52 8 Bibliography
[Gerhold D et al.,2001] Gerhold D, Lu M, Xu J, Austin C, Caskey CT, Rush-more
T(2001). Monitoring expression of genes involved in drug metabolism and toxicol-
ogy using DNA microarrays. Physiol Genomics; 5: 161-170.
[Gonzalez RM et al., 2011] Gonzalez RM, Daly DS, Tan R, Marks JR, Zangar
RC(2011). Plasma biomarker profiles differ depending on breast cancer subtype
but RANTES is consistently increased. Cancer Epidemiol Biomarkers Prev.1543-
51. doi: 10.1158/1055-9965.EPI-10-1248.
[Hahne, F.et al., 2008] Hahne, F.; Huber, W.; Gentleman, R.; Falcon, S. (2008).
Bioconductor Case Studies. Springer. ISBN 978-0-387-77239-4.
[Hassanein M et al.,2012] Hassanein M, Callison JC, Callaway-Lane C, Aldrich MC,
Grogan EL, Massion PP(2012). The state of molecular biomarkers for the early
detection of lung cancer. Cancer Prev Res (Phila). 992-1006. doi: 10.1158/1940-
6207.CAPR-11-0441.
[HHS et al., 2012]HHS (US Department of Health and Human Services), Food and
Drug Administration, Center for Devices and Radiological Health, Office of In Vitro
Diagnostic Device Evaluation and Safety, Center for Biologic Evaluation and Re-
search(2012). Draft Guidance for Industry, Clinical Laboratories, and Staff: In
Vitro Diagnostic Multivariate Index Assays. url:http://www.fda.gov/down-
loads/MedicalDevices/DeviceRegulationandGuidance/GuidanceDocu-
ments/ucm071455.pdf.
[Hilger RA et al.,2002] Hilger RA, Scheulen ME, Strumberg D (2002). "The Ras-Raf-
MEK-ERK pathway in the treatment of cancer". Onkologie. 25 (6): 511–8.
doi:10.1159/000068621. PMID 12566895.
[Hilska M et al.,2007] Hilska M, Roberts PJ,Collan YU,et al (2007): Prognostic sig
nificance of matrixmetalloprotein-ases-1,-2,-7 and-13 and tissue inhibitors of met-
alloproteinases-1,-2,-3and-4 in colorectal cancer. Int J Cancer 121:714-723.
[Holliday EG et al.,2010] Holliday EG, Scott RJ, Attia J (2010). Evidence-based
medicine in the era of biomarkers: teaching a new dog old tricks? Clin Pharmacol
Ther. doi: 10.1038/clpt.2010.214.
8 Bibliography 53
[Howe D et al., 2008] Howe D, Costanzo M, Fey P, Gojobori T, Hannick L, Hide W,
Hill DP, Kania R, Schaeffer M, Pierre SS, Twigger S, White O, Rhee SY (2008).
"Big data: The future of biocuration". Nature. 455 (7209): 47–50.
doi:10.1038/455047a. PMC 2819144Freely accessible. PMID 18769432.
[Jennifer M Giltnane,2014] Jennifer M Giltnane (2014). Rationale for Targeting the
Ras/MAPK Pathway in Triple-Negative Breast Cancer.
[Jumper C et al.,2004] Jumper C, Cobos E, Lox C (2004): Determination of the
serum matrix metalloproteinase-9 (MMP-9) and tissue inhibitor of matrix metallo-
proteinase-1 (TIMP-1) in patients with either advanced small-cell lung cancer or
non-small-cell lung cancer prior to treatment. Respir Med 98:173-177.
[Kaarel Krjutskov et al.,2016] Kaarel Krjutškov. Koel M,Roost AM,Katayama
S,Einarsdottir E,Jouhilahti EM,Söderhäll C,Jaakma Ü,Plaas M,Vesterlund L,Lohi
H,Salumets A,Kere J (2016). Globin mRNA reduction for whole-blood transcrip-
tome sequencing. URL: http://paper.medlive.cn/literature/2063649.
[Kanehisa M et al, 2000]. Kanehisa M, Goto S. KEGG: Kyoto Encyclopedia of Genes
and Genomes (2000). Nucleic Acids Res. 28 (1): 27–30. doi:10.1093/nar/28.1.27.
PMC 102409
[Langenskiold M et al.,2005]Langenskiold M, Holmdahl L, Falk P, et al (2005): In
creased plasma MMP-2 protein expression in lymph node-positive patients with
colorectal cancer. Int J Colorectal Dis 20:245-252.
[Lapointe J et al.,2007] Lapointe J, Kim YH, Miller MA, et al(2007). A variant
TMPRSS2 isoform and ERG fusion product in prostate cancer with implications
for molecular diagnosis. Mod Pathol 20:467-73.
[Leeman MF et al.,2002] Leeman MF, McKay JA, Murray GI (2002): Matrix metal
loproteinase 13 activity is associated with poor prognosis in colorectal cancer. J
Clin Pathol 55:758-762.
[Lewis C et al.,2014] Lewis C. Cantley, Tony Hunter, Richard Sever, Jeremy
Thorner(2014). Signal Transduction: Principles, Pathways, and Processes. Cold
Spring Harbor Laboratory Press. ISBN 978-0-87969-901-7

54 8 Bibliography
[Liu D et al.,2007] Liu D, Nakano J, Ishikawa S, et al (2007): Overexpression of
matrix metalloproteinase-7 (MMP-7) correlates with tumor proliferation and a poor
prognosis in non-small cell lung cancer. Lung Cancer 58:384-391.
[Lusia Sepiashvili et al., 2012] Lusia Sepiashvili, Angela Hui, Vladimir Ignatchenko,
Willa Shi, Susie Su , Wei Xu , Shao Hui Huang , Brian O’Sullivan , John Waldron ,
Jonathan C. Irish , Bayardo Perez-Ordonez , Fei-Fei Liu and Thomas Kislinger
(2012) Potentially Novel Candidate Biomarkers for Head and Neck Squamous
Cell Carcinoma Identified Using an Integrated Cell Line based Discovery Strategy.
[Maurel J et al.,2007] Maurel J, Nadal C, Garcia-Albeniz X, et al (2007): Serum ma-
trix metalloproteinase 7 levels identify poor prognosis advanced colorectal cancer
patients. Int J Cancer 121:1066-1071.
[McCubrey JA et al.,2007] McCubrey JA, Steelman LS, Chappell WH, et al (2007).
"Roles of the Raf/MEK/ERK pathway in cell growth, malignant transformation and
drug resistance". Biochim. Biophys. Acta. 1773 (8): 1263–84.
doi:10.1016/j.bbamcr. PMC 2696318Freely accessible. PMID 17126425.
[McGinnis KA et al., 2006] McGinnis KA, Fultz SL, Skanderson M, et al(2006). Hepa-
tocellular carcinoma and non-Hodgkin's lymphoma: the roles of HIV, hepatitis C
infection, and alcohol abuse. Journal of Clinical Oncology ; 24(31):5005–5009.
[Mehra R et al., 2007] Mehra R, Tomlins SA, Shen R, et al(2007). Comprehensive
assessment of TMPRSS2 and ETS family gene aberrations in clinically localized
prostate cancer. Mod Pathol 20:538-44.
[Michael Gnant et al.,2011] Michael Gnant, Nadia Harbeck, and Christoph
Thomssen St. Gallen (2011): Summary of the Consensus Discussion.
[Michelle D et al.,2007] Michelle D. Martin & Lynn M. Matrisian (2007). The other
side of MMPs: Protective roles in tumor progression. Cancer Metastasis Rev
(2007) 26:717–724 DOI 10.1007/s10555-007-9089-4
[Mishra et al.,2010] Mishra, Alok; Verma, Mukesh (2010). Cancer Biomarkers : Are
We Ready for the Prime Time? Cancers. 2 (1): 190–208. doi:10.3390/can-
cers2010190

8 Bibliography 55
[Mutch DM et al.,2002] Mutch DM, Berger A, Mansourian R, Rytz A, Roberts
MA(2002). The limit fold change model: a practical approach for selecting differ-
entially expressed genes from microarray data. BMC Bioinformatics 3: 17
[Müller HJ et al., 2004] Müller HJ, Röder T(2004). Der Experimentator Microarrays. ISBN:3-
8274-1438-5
[Myc. NCBI] Myc. NCBI (2016) URL: https://www.ncbi.nlm.nih.gov/gene/4609
[Nalejska et al.,2014] Nalejska, Ewelina (2014). Prognostic and Predictive Bi
omarkers. Molecular Oncology and Genetics. 18: 273–284.
[Nam RK et al.,2007] Nam RK, Sugar L, Wang Z, et al (2007). Expression of
TMPRSS2:ERG gene fusion in prostate cancer cells is an important prognostic
factor for cancer progression.Cancer Biol Ther 6:40-5.
[Perner S et al.,2006] Perner S, Demichelis F, Beroukhim R, et al(2006). TMPRSS2-
ERG fusion-associated deletions provide insight into the heterogeneity of prostate
cancer. Cancer Res ;66:8337-41.
[Personalized Medicine Coalition,2014] Personalized Medicine Coalition(2014).The
Case For Personalized Medicine 4th Editionhttp://www.personalizedmedi-
cinecoalition.org/Userfiles/PMC-Corporate/file/pmc_case_for_personal-
ized_medicine.pdf
[Policy Issues for the Development and Use of Biomarkers in Health,2010] Policy
Issues for the Development and Use of Biomarkers in
Health(2011).http://www.oecd.org/sti/biotechnologypolicies/49023036.pdf
[Poola I et al., 2005] Poola I, DeWitty RL, Marshalleck JJ, et al (2005): Identifica tion
of MMP-1 as a putative breast cancer predictive marker by global gene expres-
sion analysis. Nat Med 11:481-483.
[Rajput AB et al., 2007] Rajput AB, Miller MA, De Luca A, et al (2007). Frequency
of the TMPRSS2:ERG gene fusion is increased in moderate to poorly differenti-
ated prostate cancers. J Clin Pathol 60:1238-43.

56 8 Bibliography
[Ranuncolo SM et al.,2003] Ranuncolo SM, Armanasco E, Cresta C, et al (2003):
Plasma MMP-9 (92 kDa-MMP) activity is useful in the follow-up and in the assess-
ment of prognosis in breast cancer patients. Int J Cancer 106:745-751.
[Rapp UR et al.,1983] Rapp UR, Goldsborough MD, Mark GE, Bonner TI, Groffen
J, Reynolds FH Jr, Stephen son JR (1983). Structure and biological activity of v-
raf, a unique oncogene transduced by a retrovirus. Proc Natl Acad Sci U S A.
80(14):4218-22
[Ratain MJ et al., 2007] Ratain MJ, Glassman RH(2007). Biomarkers in phase I on-
cology trials: signal, noise, or expensive distraction? Clin Cancer Res, 6545-6548
[Rhodes D R et al.,2004] Rhodes D R, Yu J, Shanker K, et al (2004). Large-scale
meta-analysis of cancer microarray data identifies common transcriptional profiles
of neoplastic transformation and progression. Proc Natl Acad Sci USA,, 101(25):
9309-9314
[Rhodes D R et al., 2007] Rhodes D R, Kalyana-Sundaram S, Mahavisno V, et al
(2007). Oncomine 3.0: genes, pathways, and networks in a collection of 18 000
cancer gene expression profiles. Neoplasia, 166-180
[Ruf F et al., 2003] Ruf F,Fink M Y,Sealfon S C(2003). Structure of the GnRH re-
ceptor-stimulated signaling network: insights from genomics[J].Front Neuroendo-
crinol,181~199.
[Rundle A et al., 2012] Rundle A, Ahsan H, Vineis P(2012). Better cancer biomarker
discovery through better study design. Eur J Clin Invest, 42: 1350-1359
[Sauter W et al.,2008] Sauter W, Rosenberger A, Beckmann L, et al (2008): Matrix
metalloproteinase 1 (MMP1) is associated with early-onset lung cancer. Cancer
Epidemiol Biomarkers Prev 17:1127-1135.
[Scott A et al., 2008] Scott A. Tomlins, Bharathi Laxman, Sooryanarayana Varam
bally , Xuhong Cao, Jindan Yu, Beth E. Helgeson, Qi Cao, John R. Prensner,
Mark A. Rubin, Rajal B. Shah , Rohit Mehra , and Arul M. Chinnaiyan (2008). Role
of the TMPRSS2-ERG Gene Fusion in Prostate Cancer NEOPLASIA Volume
10 Number 2 pp. 177-188

8 Bibliography 57
[Schena M et al., 1995] Schena M, Shalon D, Davis RW, Brown PO (1995): Quan-
titative monitoring of gene expression patterns with a complementary DNA micro-
array. Science. 270(5235):467-70
[Smyth,G, 2004]Smyth,G.: Linear models and empirical Bayes methods for as
sessing differential expression in microarray experiments(2004). Statistical Appli-
cations in Genetics and Molecular Biology.3: Article 3.
[Soller MJ et al.,2006] Soller MJ, Isaksson M, Elfving P, Soller W, Lundgren R,
Panagopoulos I (2006). Confirmation of the high frequency of the TMPRSS2/ERG
fusion gene in prostate cancer. Genes Chromosomes Cancer 45:717-9.
[Stafford P et al.,2007] Stafford P, Brun M (2007). Three methods for optimization
of cross-laboratory and cross-platform microarray expression data. Nucleic Acids
Research,, 35(10): e72
[Stefan Lorkowski et al., 2003] Stefan Lorkowski, Paul Cullen (2003). Analysing
Gene Expression: A Handbook of Methods: Possibilities and Pitfalls. Wiley-VCH
Verlag GmbH & Co. KGaA. ISBN: 3-527-30488-6
[Su L et al., 2005] Su L, Zhou W, Park S, et al (2005): Matrix metalloproteinase-1
promoter polymorphism and lung cancer risk. Cancer Epidemiol Biomarkers Prev
14:567-570.
[Table of Pharmacogenomic Biomarkers in Drug Labeling,2016] Table of Phar-
macogenomic Biomarkers in Drug Labeling (2016). U.S Food and Drug Admin-
istration. URL: http://www.fda.gov/Drugs/ScienceResearch/Re-
searchAreas/Pharmacogenetics/ucm083378.htm
[Tamm I et al., 1998] Tamm I, Wang Y, Sausville E, Scudiero DA, Vigna N, Olters
dorf T, Reed JC (998). "IAP-family protein survivin inhibits caspase activity and
apoptosis induced by Fas (CD95), Bax, caspases, and anticancer drugs". Cancer
Res. 58 (23): 5315–20. PMID 9850056.
[The European Medicines Agency Road Map to 2015, 2010] The European Medi-
cines Agency Road Map to 2015(2010-1-26): the Agency’s Contribution to Sci-
ence, Medicines,health. . http://www.emea.eu-
ropa.eu/docs/en_GB/document_library/Report/2010/01/WC500067952.pdf
58 8 Bibliography
[Tutton MG et al., 2003] Tutton MG, George ML, Eccles SA, et al (2003): Use of
plasma MMP-2 and MMP-9 levels as a surrogate for tumor expression in colorec-
tal cancer patients. Int J Cancer 107:541-550.
[User Guide, 2012] User Guide Expression Console™ Software 1.4(2012). URL:
http://media.affymetrix.com/support/downloads/manuals/expression_con-
sole_userguide.pdf
[Verma RP et al.,2007] Verma RP,Hansch C (2007). "Matrix metalloproteinases
(MMPs): chemical-biological functions and (Q)SARs" Bioorg. Med. Chem. 15 (6):
2223–68. doi:10.1016/j.bmc.2007.01.011. PMID 17275314
[Wagner,2002] Wagner JA. (2002). Overview of biomarkers and surrogate end-
points in drug development. Disease Markers 18(2):41-46.
[Wang J et al.,2006] Wang J, Cai Y, Ren C, Ittmann M(2006). Expression of vari ant
TMPRSS2/ERG fusion messen ger RNAs is associated with aggressive prostate
cancer. Cancer Res 2006;66:8347-51.
[Weinberg RA et al.,1982] Weinberg RA, Parada LF, Tabin CJ, Shih C, (1982). Hu
man EJ bladder carcinoma oncogene is homologue of Harvey sarcoma virus ras
gene. Nature. 297(5866):474-8.
[Wu ZS et al., 2008] Wu ZS, Wu Q, Yang JH, et al (2008): Prognostic significance
of MMP-9 and TIMP-1 serum and tissue expression in breast cancer. Int J Cancer
122:2050-2056.
[Xu L et al., 2007] Xu L, Geman D, Winslow R L (2007). Large-scale integration of
cancer microarray data identifies a robust common cancer signature. BMC Bioin-
formatics, 8: 275
[YH Yang et al., 2002] YH Yang, S Dudoit, P Luu, DM Lin, V Peng, J Ngai, TP Speed.
(2002). Normalization for cDNA microarray data: a robust composite method
addressing single and multiple slide systematic variation. Nucleic Acids
Research vol. 30 (4) pp. e15
[Yoshimoto M et al.,2006] Yoshimoto M, Joshua AM, Chilton-Macneill S, et al(2006).
Three-color FISH analysis of TMPRSS2/ERG fusions in prostate cancer indicates

8 Bibliography 59
that genomic microdeletion of chromosome 21 is associated with rearrangement.
Neoplasia 8:465-9.
[Zhang B et al.,2008] Zhang B, Cao X, Liu Y, et al(2008): Tumor-derived matrix
metalloproteinase-13 (MMP-13) correlates with poor prognoses of invasive breast
cancer. BMC Cancer 83:1-10.
[Zhu D et al.,2014] Zhu D, Jiang XH, Jiang YH, Ding WC, Zhang CL, Shen H, Wang
XL, Ma D, Hu Z, Wang H(2014). Amplification and overexpression of TP63 and
MYC as biomarkers for transition of cervical intraepithelial neoplasia to cervical
cancer. Int J Gynecol Cancer. 24(4):643-8. doi: 10.1097/IGC.0000000000000122.


Appendix LXI
Appendix
Appendix 1 Original expression value of BIRC5 in lung cancer datasets
Appendix 2 Original expression value of FOS in lung cancer datasets
Appendix 3 Original expression value of FOS in breast cancer dataset

A-LXII Appendix
Appendix 4 Original expression value of MMP14 in lung cancer dataset
Appendix 5 Original expression value of PPARG in lung cancer dataset
Appendix 6 Original expression value of MYC in breast cancer dataset

Appendix LXIII
Appendix 7 Original expression value of PLA1A in prostate cancer dataset
Appendix 8 transcriptional misregulation in cancer download from KEGG

A-LXIV Appendix
Appendix 9 Quality control chart of GSE18842
Appendix 10 Ras Signaling Pathway download from KEGG

Selbstständigkeitserklärung
Hiermit erkläre ich, dass ich die vorliegende Arbeit selbstständig und nur unter Ver-
wendung der angegebenen Literatur und Hilfsmittel angefertigt habe. Stellen, die
wörtlich oder sinngemäß aus Quellen entnommen wurden, sind als solche kennt-
lich gemacht. Diese Arbeit wurde in gleicher oder ähnlicher Form noch keiner an-
deren Prüfungsbehörde vorgelegt.
Mittweida, 30,09,2016 Yantao Gao
Ort, Datum Vorname Nachname