master thesis final
TRANSCRIPT

Departament de Comercialització i Investigació de Mercats
Perceived Value dimensions, Customer Satisfaction and
Loyalty in the Fast Food Industry: a cross-cultural study in in
Guatemala, Spain and Germany.
AUTHOR:
Christopher Schlosser
SUPERVISOR:
Martina G. Gallarza, PhD.
Valencia, October 2014
International Master in Business Administration (iMBA)
MASTER THESIS
International Marketing Master Thesis 2013-2014 International Master in Business Administration (iMBA)
2 Christopher Schlosser
Table of Contents
List of Tables…….………………………………………………………... 3
Abstract………………………………………………….......................... 6
1. Introduction……………………………………………………………….. 7
1.1
1.2
1.3
2.
Justification of the selected topic………………………………………..
General objective and sub-objectives…………………………………..
Methodology……………………………………………………………….
Literature Review………………………………………………………….
7
8
9
10
2.1. Fast Food Industry……………………………………………………….. 10
2.1.1. Fast Food Industry in Spain……………………………………… 11
2.1.2. Fast Food Industry in Germany..………………………….......... 14
2.1.3. Fast Food Industry in Guatemala………….……………………. 16
2.2. Customer Relationship Management……………………………......... 18
2.2.1. Perceived Value ……………..…………………………………… 20
2.2.2. Customer Satisfaction and Loyalty….….................................. 25
3. Research Objectives……………………………………...……………… 29
3.1. Research Objectives………………………………….…………............ 29
3.2. Research Questions…………………………………….………............ 30
3.3.
Proposing research hypotheses ………………………..……………...
3.3.1. Efficiency................................................................................
3.3.2. Cleanness...............................................................................
3.3.3. Product Quality.......................................................................
3.3.4. Aesthetics...............................................................................
3.3.5. Perceived Price.......................................................................
3.3.6. Social Status...........................................................................
3.3.7. Facilities..................................................................................
3.3.8. Emotional Value......................................................................
3.3.9. Customer Satisfaction.............................................................
3.3.10. Loyalty...................................................................................
31
31
32
33
34
34
35
36
36
37
37
4. Research Methodology...………………………………………………… 39

International Marketing Master Thesis 2013-2014 International Master in Business Administration (iMBA)
3 Christopher Schlosser
4.1. Qualitative Research………………………………………………..........
4.1.1. Focus Group with Fast Food Consumers................................
4.1.2. In depth interview with Fast Food Industry expert...................
39
39
42
4.2. Quantitative Research………………………………….......................... 44
5. Analysis and Results......................................................................... 52
5.1. Guatemala vs. Spain……………………………………………….......... 52
5.2. Spain vs. Germany…..…................................................................... 60
5.3. Guatemala vs. Germany………………………………………………… 66
6. Conclusion………………………………………………...………….…… 77
6.1. Key Findings………………………………………………………………. 77
6.2. Managerial implications………………………………………………….. 79
6.3. Study Limitations and further research………………………………… 80
7. References………………………………………………………………… 83
8. Appendices…….………………………………………………………….. 93
8.1. Appendix A: Focus Group Guide and Summary………...................... 93
8.2. Appendix B: In-depth Interview Guide………………………………….. 97
List of Tables
Table 1. Consumer Foodservice by Independent vs. Chained: 2012…….….. 12
Table 2. Sales in Consumer Foodservice by ―Eat in‖ vs. ―Take-away‖ vs.
―Home Delivery‖: 2012…………………………………………………...
13
Table 3. GBO Company Shares in Chained Consumer Foodservice: 2008-
2012 ……………………………………………………………………….
14
Table 4. Consumer Foodservice by Independent vs. Chained: 2012…….…. 15
Table 5. Sales in Consumer Foodservice by ―Eat in‖ vs. ―Take-away‖ vs.
―Home Delivery‖: 2012…………………………………………………...
15
Table 6. GBO Company Shares in Chained Consumer Foodservice: 2008-
2012………………………………………………………………………..
16
Table 7. Value and perceived value definitions ………………………………... 21
International Marketing Master Thesis 2013-2014 International Master in Business Administration (iMBA)
4 Christopher Schlosser
Table 8.
Table 9.
Table 10.
Focus group of Guatemalans living in Spain: members' profile........
Online Questionnarie.........................................................................
Guatemalans´ Sample Profile …………………………………….……
40
44
48
Table 11. Spanish Sample Ages …………….……………….…………………… 49
Table 12. Germans´ Sample Ages ……………………………………..…………. 49
Table 13. Scaled Questionnaire Responses, question # 1…............................ 50
Table 14. Scaled Questionnaire Responses, questions # 2, 3, 4……………… 51
Table 15. Comparison of quality between Guatemala and Spain …………..... 53
Table 16. Comparison of efficiency between Guatemala and Spain………...... 53
Table 17. Comparison of pricing between Guatemala and Spain ………..…… 54
Table 18. Comparison of social status between Guatemala and Spain..……… 55
Table 19. Comparison of emotions between Guatemala and Spain………..…. 55
Table 20. Comparison of cleanness between Guatemala and Spain................ 56
Table 21. Comparison of aesthetics between Guatemala and Spain ……….... 57
Table 22. Comparison of facilities between Guatemala and Spain ………….... 57
Table 23. Comparison of satisfaction between Guatemala and Spain …..….... 58
Table 24. Comparison of loyalty between Guatemala and Spain …………….. 59
Table 25. Comparison of quality between Spain and Germany..………….…… 60
Table 26. Comparison of efficiency between Spain and Germany ………….... 61
Table 27. Comparison of pricing between Spain and Germany …………….…. 61
Table 28. Comparison of social status between Spain and Germany ………… 62
Table 29. Comparison of emotions between Spain and Germany …….……… 62
Table 30. Comparison of cleanness between Spain and Germany …………… 63
Table 31. Comparison of aesthetics between Spain and Germany….….…….. 63
Table 32. Comparison of facilities between Spain and Germany ……………… 64
Table 33. Comparison of satisfaction between Spain and Germany..…………. 64
Table 34. Comparison of loyalty between Spain and Germany ...……………... 65
Table 35. Comparison of quality between Guatemala and Germany .………… 66
Table 36. Comparison of efficiency between Guatemala and Germany .…….. 67
Table 37. Comparison of pricing between Guatemala and Germany ………… 67

International Marketing Master Thesis 2013-2014 International Master in Business Administration (iMBA)
5 Christopher Schlosser
Table 38. Comparison of social status between Guatemala and Germany ...... 68
Table 39. Comparison of emotions between Guatemala and Germany ……… 69
Table 40. Comparison of cleanness between Guatemala and Germany ...…... 69
Table 41. Comparison of aesthetics between Guatemala and Germany ...…... 70
Table 42. Comparison of facilities between Guatemala and Germany ..……… 70
Table 43. Comparison of satisfaction between Guatemala and Germany ….... 71
Table 44. Comparison of loyalty between Guatemala and Germany.…………. 72
Table 45. Summary of hypotheses of comparisons between Guatemala,
Spain and Germany …….……………………………………………….
73
International Marketing Master Thesis 2013-2014 International Master in Business Administration (iMBA)
6 Christopher Schlosser
Abstract
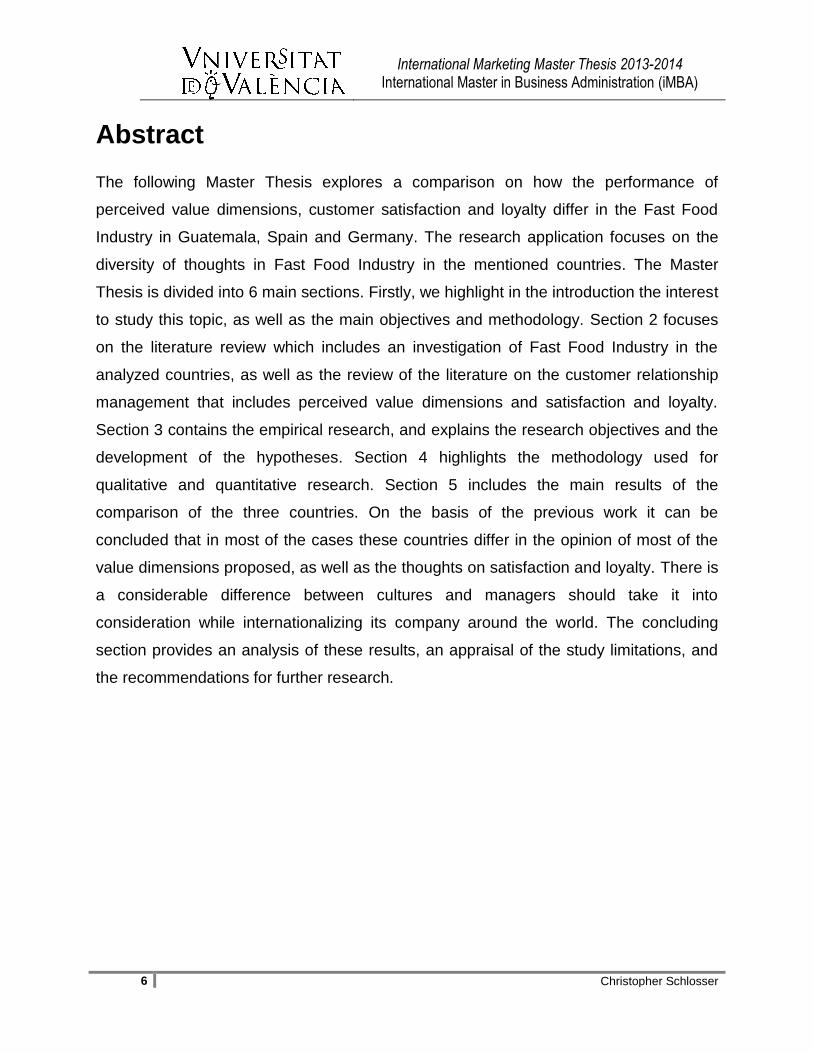
The following Master Thesis explores a comparison on how the performance of
perceived value dimensions, customer satisfaction and loyalty differ in the Fast Food
Industry in Guatemala, Spain and Germany. The research application focuses on the
diversity of thoughts in Fast Food Industry in the mentioned countries. The Master
Thesis is divided into 6 main sections. Firstly, we highlight in the introduction the interest
to study this topic, as well as the main objectives and methodology. Section 2 focuses
on the literature review which includes an investigation of Fast Food Industry in the
analyzed countries, as well as the review of the literature on the customer relationship
management that includes perceived value dimensions and satisfaction and loyalty.
Section 3 contains the empirical research, and explains the research objectives and the
development of the hypotheses. Section 4 highlights the methodology used for
qualitative and quantitative research. Section 5 includes the main results of the
comparison of the three countries. On the basis of the previous work it can be
concluded that in most of the cases these countries differ in the opinion of most of the
value dimensions proposed, as well as the thoughts on satisfaction and loyalty. There is
a considerable difference between cultures and managers should take it into
consideration while internationalizing its company around the world. The concluding
section provides an analysis of these results, an appraisal of the study limitations, and
the recommendations for further research.

International Marketing Master Thesis 2013-2014 International Master in Business Administration (iMBA)
7 Christopher Schlosser
1. Introduction
Globalization has been a major issue for companies in the last decades; businesses are
expanding throughout the world, especially Fast Food Restaurants. In order to become
successful and competitive in the international market, companies have to learn about
the different cultures and food habits in their targeted markets (Miele & Murdoch, 2002;
Lee & Ulgado, 1997). They have to satisfy the customer´s needs through diverse forms
in order to get loyal clients. The Fast Food industry offers services that are convenient,
fast and relatively inexpensive; this gives customers an easy access to switch Fast
Food providers and the interesting fact is if they can be loyal at all (Sahagun &
Vasquez-Parraga, 2014). So, companies have to deal with this combination and
perform well in order to be successful. They have to have different approaches
depending on the region they are aiming.
This Master Thesis deals with these issues, as it aims at researching and analyzing
differences on perceived value dimensions, customer satisfaction and loyalty in three
different countries, namely Guatemala, Germany and Spain. The Thesis is divided in six
sections; first the introduction to clarify the main ideas of the study, then the literature
review on both the Fast Food Industry and Consumer Behavior on Relationship
Marketing to analyze the theory and framework of the research, followed by the
research objectives and the methodology of the empirical study, then the results to
prove the proposed hypotheses and a conclusion to analyze the results and express the
final thoughts. This following introduction will provide the reader the justification of the
topic selected, from academic and managerial points of view. Then the general and
specific objectives are being introduced, as well as the methodology of the research.
1.1. Justification of the selected topic
The Fast Food Industry is considered low-switching for customers; it is often rapid,
convenient, and relatively inexpensive (Sahagun & Vasquez-Parraga, 2014). In general
in services marketing, it is assumed that there are different levels that can be analyzed
about the perceived value dimensions for the customers (Gallarza, Gil-Saura &
International Marketing Master Thesis 2013-2014 International Master in Business Administration (iMBA)
8 Christopher Schlosser
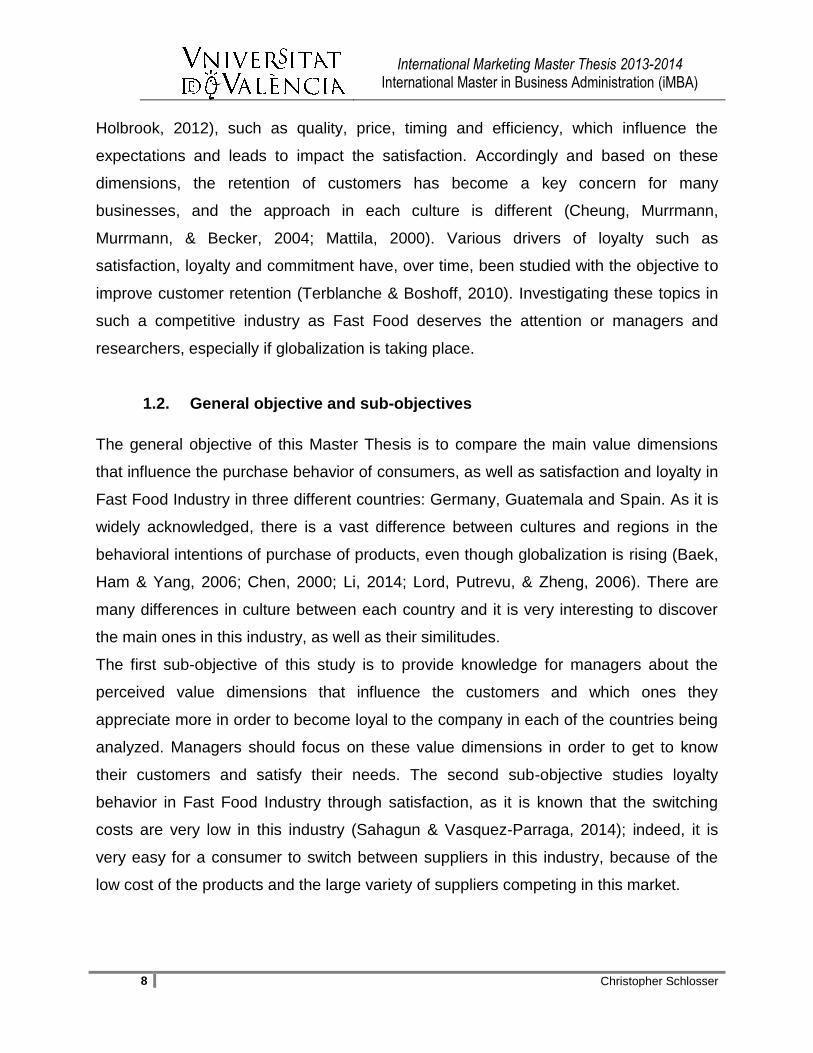
Holbrook, 2012), such as quality, price, timing and efficiency, which influence the
expectations and leads to impact the satisfaction. Accordingly and based on these
dimensions, the retention of customers has become a key concern for many
businesses, and the approach in each culture is different (Cheung, Murrmann,
Murrmann, & Becker, 2004; Mattila, 2000). Various drivers of loyalty such as
satisfaction, loyalty and commitment have, over time, been studied with the objective to
improve customer retention (Terblanche & Boshoff, 2010). Investigating these topics in
such a competitive industry as Fast Food deserves the attention or managers and
researchers, especially if globalization is taking place.
1.2. General objective and sub-objectives
The general objective of this Master Thesis is to compare the main value dimensions
that influence the purchase behavior of consumers, as well as satisfaction and loyalty in
Fast Food Industry in three different countries: Germany, Guatemala and Spain. As it is
widely acknowledged, there is a vast difference between cultures and regions in the
behavioral intentions of purchase of products, even though globalization is rising (Baek,
Ham & Yang, 2006; Chen, 2000; Li, 2014; Lord, Putrevu, & Zheng, 2006). There are
many differences in culture between each country and it is very interesting to discover
the main ones in this industry, as well as their similitudes.
The first sub-objective of this study is to provide knowledge for managers about the
perceived value dimensions that influence the customers and which ones they
appreciate more in order to become loyal to the company in each of the countries being
analyzed. Managers should focus on these value dimensions in order to get to know
their customers and satisfy their needs. The second sub-objective studies loyalty
behavior in Fast Food Industry through satisfaction, as it is known that the switching
costs are very low in this industry (Sahagun & Vasquez-Parraga, 2014); indeed, it is
very easy for a consumer to switch between suppliers in this industry, because of the
low cost of the products and the large variety of suppliers competing in this market.
International Marketing Master Thesis 2013-2014 International Master in Business Administration (iMBA)
9 Christopher Schlosser
1.3. Methodology
After using both professional and academic secondary sources for building the
conceptual framework, the empirical study is composed by a qualitative and a
quantitative research. The qualitative part was formed by one focus group that was held
in Valencia, Spain, which was formed by Spanish speaking people, and one in-depth
interview that was held via email with an expert in the Fast Food Industry in Latin
America, with emphasis in Guatemala. The quantitative research was held via online,
developing an electronic questionnaire that could be sent to people from the three
different countries being investigated. The data was analyzed with SPSS in order to
compare the information of the three countries, T-test method was used to obtain the
significant differences of the results between the countries.

International Marketing Master Thesis 2013-2014 International Master in Business Administration (iMBA)
10 Christopher Schlosser
2. Literature review
The following literature review is presented in two different sections; an analysis of the
Fast Food Industry in three different countries (Guatemala, Germany and Spain) and
the importance of Customer Relationship Management in the industry and its effect on
consumers, to verify the comparison of value dimensions, satisfaction and loyalty in the
mentioned countries. In the first section, the Fast Food Industry is defined and some of
the main issues nowadays are explained and then explains the different data and
information found about this industry in Spain, Germany and Guatemala. The second
section includes the definitions and applications of customer relationship management,
the perceived value dimensions, customer satisfaction and loyalty; the relationship
between these factors and how they impact on customers. These dimensions will differ
between the three countries being analyzed, their culture is different, and so the reader
will be able to recognize some of them. According to Hofstede, there are six groups of
dimensions of national culture: Power Distance, Individualism versus Collectivism,
Masculinity versus Femininity, Uncertainty Avoidance, Long Term Orientation versus
Short Term Normative Orientation and Indulgence versus Restraint. Comparing Spain
and Germany, it can be seen that Spain has a higher power distance and uncertainty
avoidance in their culture, while Germans have higher individualism and masculinity.
When analyzing Guatemala and Spain, it can be seen that Guatemalans have much
higher power distance and uncertainty avoidance in the culture and Spanish have
higher individualism and masculinity. Lastly comparing Guatemala and Germany, it is
clear that Guatemalans have a much higher power distance and uncertainty avoidance,
while Germans have a higher individualism and masculinity. This shows the reader that
there is a huge difference between Guatemala and both European countries, which will
be supported later on.
2.1. Fast Food Industry
―Eating away from home is becoming increasingly common and visits to Fast Food
Restaurants are growing even more rapidly‖ (Dave, An, Jeffery & Ahluwalia, 2009, p.1).
International Marketing Master Thesis 2013-2014 International Master in Business Administration (iMBA)
11 Christopher Schlosser
People have very easy access to Fast Food Restaurants and eating there has
increased over the years. There are many types of foodservice across the world, such
as restaurants, catering, coffee shops and many other setups; the main idea is to offer
any kind of food outside the customer´s home. In this study, the emphasis is on the Fast
Food Industry, especially with well-known restaurant chains in Spain, Guatemala and
Germany. This industry has been growing substantially in the last decades worldwide
and has a very important impact on the behavioral intentions of the consumers.
Fast Food has many definitions; one of them is as follows: ―Fast Food is no longer just
sloppy cheeseburgers and greasy French fries. It is instead being redefined by
consumers who are looking for quick, quality menu items of value in modern dining
rooms throughout the quick-service industry‖ (The New Definition of Fast Food, 2010,
para.1)1. Some of the different quick service restaurants offer burgers, pizzas,
sandwiches, wraps and other types of food. The culture plays a very big role in this
industry, because the big chains of restaurants have to adapt to it in each country. For
example, in Europe they offer alcoholic beverages in the menus and in Latin America
they don´t. It all comes back to the customer´s preferences and culture, the main idea is
to satisfy them and influence in their purchase intentions. Services in the Fast Food
Industry are generally inexpensive, rapid and convenient, making the switching costs of
customers reasonably low; this means that they can easily switch their Fast Food
provider (Sahagun & Vasquez-Parraga, 2014). Quick Service Restaurants are
perceived differently than the rest of restaurants (Mathew & Leitch, 2011), therefore it is
very important to examine these perceptions in the different countries.
2.1.1 Fast Food Industry in Spain
According to Euromonitor International in 2013, over 2012 private labels were gaining
popularity in Spain as a way to save money for the customers; this is very important for
reduced-price items and it is reflected on the consumer Fast Food Market with the
launch of such low-cost items. In the weak economic situation that Spain is living
1 According to APA citation style; this is the citation form for websites for defining the paragraph where the quote
was taken from. From now on, this will be the method for referencing definitions from websites.
International Marketing Master Thesis 2013-2014 International Master in Business Administration (iMBA)
12 Christopher Schlosser
nowadays, people are cutting down unnecessary expenditures and choose cheap
leisure activities. Some Quick Service Restaurants like McDonald´s, Burger King and
Telepizza have launched items for only €1 in order to strike this effect, such sales
promotions are vital to especially attract young audience.
In Spain there are a lot of independent outlets, generally family-owned businesses; with
the economic crisis and latest liberalization measures taken by the government, it has
been very difficult or even impossible to compete against the larger chains of
restaurants which benefit from economies of scale (Euromonitor International, 2013).
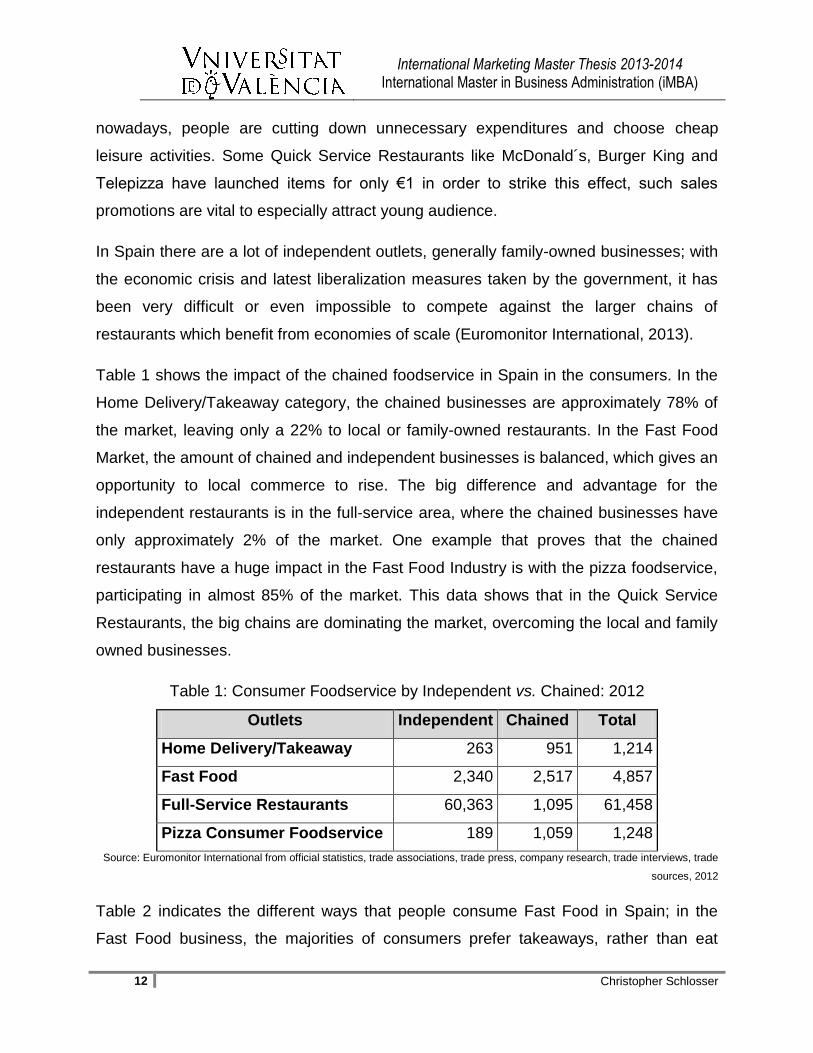
Table 1 shows the impact of the chained foodservice in Spain in the consumers. In the
Home Delivery/Takeaway category, the chained businesses are approximately 78% of
the market, leaving only a 22% to local or family-owned restaurants. In the Fast Food
Market, the amount of chained and independent businesses is balanced, which gives an
opportunity to local commerce to rise. The big difference and advantage for the
independent restaurants is in the full-service area, where the chained businesses have
only approximately 2% of the market. One example that proves that the chained
restaurants have a huge impact in the Fast Food Industry is with the pizza foodservice,
participating in almost 85% of the market. This data shows that in the Quick Service
Restaurants, the big chains are dominating the market, overcoming the local and family
owned businesses.
Table 1: Consumer Foodservice by Independent vs. Chained: 2012
Outlets Independent Chained Total
Home Delivery/Takeaway 263 951 1,214
Fast Food 2,340 2,517 4,857
Full-Service Restaurants 60,363 1,095 61,458
Pizza Consumer Foodservice 189 1,059 1,248
Source: Euromonitor International from official statistics, trade associations, trade press, company research, trade interviews, trade
sources, 2012
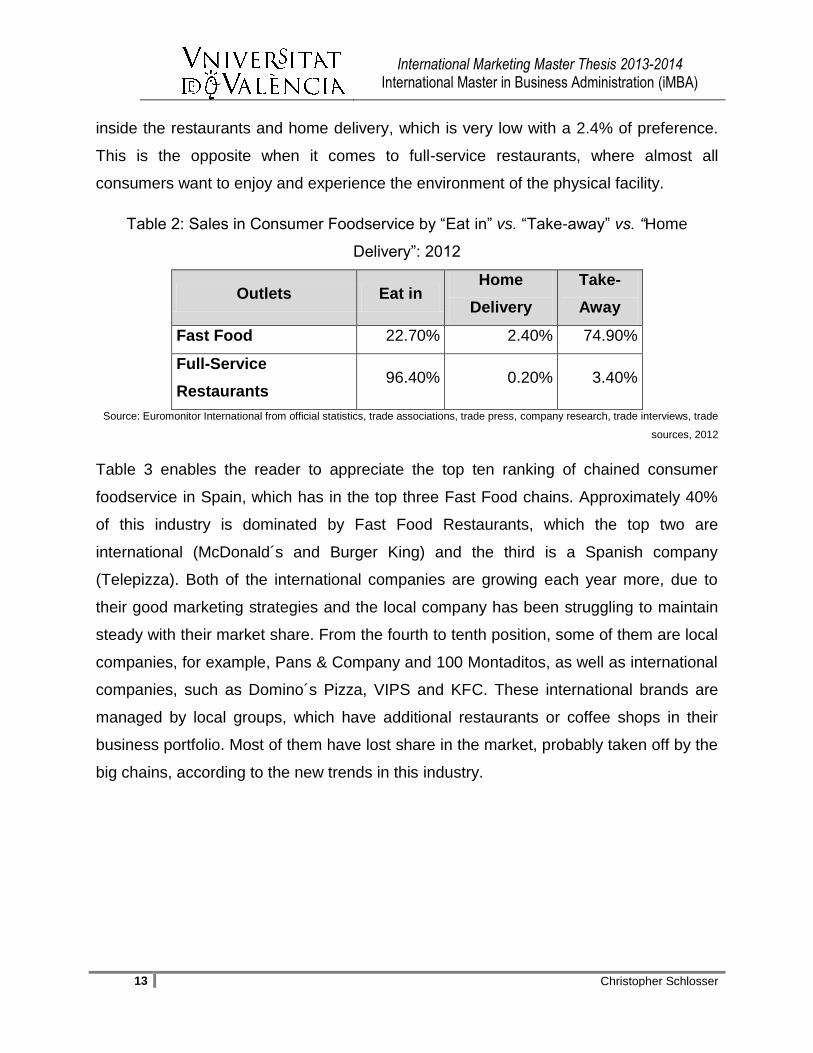
Table 2 indicates the different ways that people consume Fast Food in Spain; in the
Fast Food business, the majorities of consumers prefer takeaways, rather than eat
International Marketing Master Thesis 2013-2014 International Master in Business Administration (iMBA)
13 Christopher Schlosser
inside the restaurants and home delivery, which is very low with a 2.4% of preference.
This is the opposite when it comes to full-service restaurants, where almost all
consumers want to enjoy and experience the environment of the physical facility.
Table 2: Sales in Consumer Foodservice by ―Eat in‖ vs. ―Take-away‖ vs. “Home
Delivery‖: 2012
Outlets Eat in Home
Delivery
Take-
Away
Fast Food 22.70% 2.40% 74.90%
Full-Service
Restaurants 96.40% 0.20% 3.40%
Source: Euromonitor International from official statistics, trade associations, trade press, company research, trade interviews, trade
sources, 2012
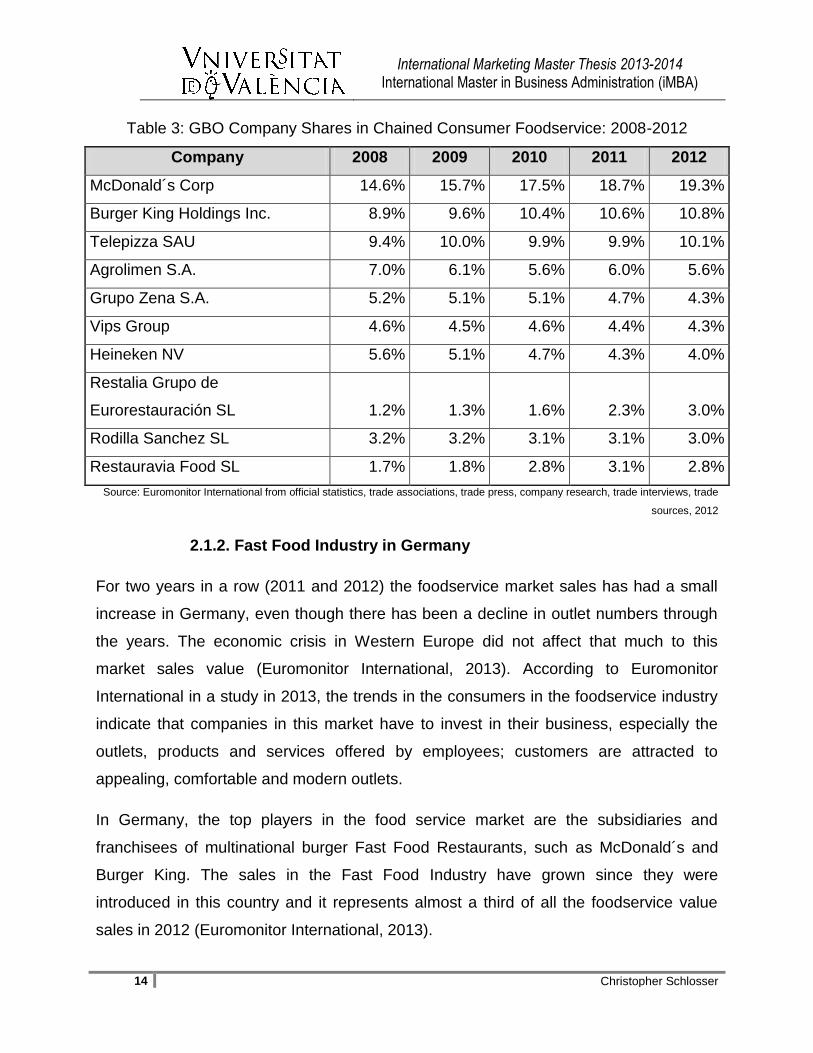
Table 3 enables the reader to appreciate the top ten ranking of chained consumer
foodservice in Spain, which has in the top three Fast Food chains. Approximately 40%
of this industry is dominated by Fast Food Restaurants, which the top two are
international (McDonald´s and Burger King) and the third is a Spanish company
(Telepizza). Both of the international companies are growing each year more, due to
their good marketing strategies and the local company has been struggling to maintain
steady with their market share. From the fourth to tenth position, some of them are local
companies, for example, Pans & Company and 100 Montaditos, as well as international
companies, such as Domino´s Pizza, VIPS and KFC. These international brands are
managed by local groups, which have additional restaurants or coffee shops in their
business portfolio. Most of them have lost share in the market, probably taken off by the
big chains, according to the new trends in this industry.
International Marketing Master Thesis 2013-2014 International Master in Business Administration (iMBA)
14 Christopher Schlosser
Table 3: GBO Company Shares in Chained Consumer Foodservice: 2008-2012
Company 2008 2009 2010 2011 2012
McDonald´s Corp 14.6% 15.7% 17.5% 18.7% 19.3%
Burger King Holdings Inc. 8.9% 9.6% 10.4% 10.6% 10.8%
Telepizza SAU 9.4% 10.0% 9.9% 9.9% 10.1%
Agrolimen S.A. 7.0% 6.1% 5.6% 6.0% 5.6%
Grupo Zena S.A. 5.2% 5.1% 5.1% 4.7% 4.3%
Vips Group 4.6% 4.5% 4.6% 4.4% 4.3%
Heineken NV 5.6% 5.1% 4.7% 4.3% 4.0%
Restalia Grupo de
Eurorestauración SL 1.2% 1.3% 1.6% 2.3% 3.0%
Rodilla Sanchez SL 3.2% 3.2% 3.1% 3.1% 3.0%
Restauravia Food SL 1.7% 1.8% 2.8% 3.1% 2.8%
Source: Euromonitor International from official statistics, trade associations, trade press, company research, trade interviews, trade
sources, 2012
2.1.2. Fast Food Industry in Germany
For two years in a row (2011 and 2012) the foodservice market sales has had a small
increase in Germany, even though there has been a decline in outlet numbers through
the years. The economic crisis in Western Europe did not affect that much to this
market sales value (Euromonitor International, 2013). According to Euromonitor
International in a study in 2013, the trends in the consumers in the foodservice industry
indicate that companies in this market have to invest in their business, especially the
outlets, products and services offered by employees; customers are attracted to
appealing, comfortable and modern outlets.
In Germany, the top players in the food service market are the subsidiaries and
franchisees of multinational burger Fast Food Restaurants, such as McDonald´s and
Burger King. The sales in the Fast Food Industry have grown since they were
introduced in this country and it represents almost a third of all the foodservice value
sales in 2012 (Euromonitor International, 2013).
International Marketing Master Thesis 2013-2014 International Master in Business Administration (iMBA)
15 Christopher Schlosser
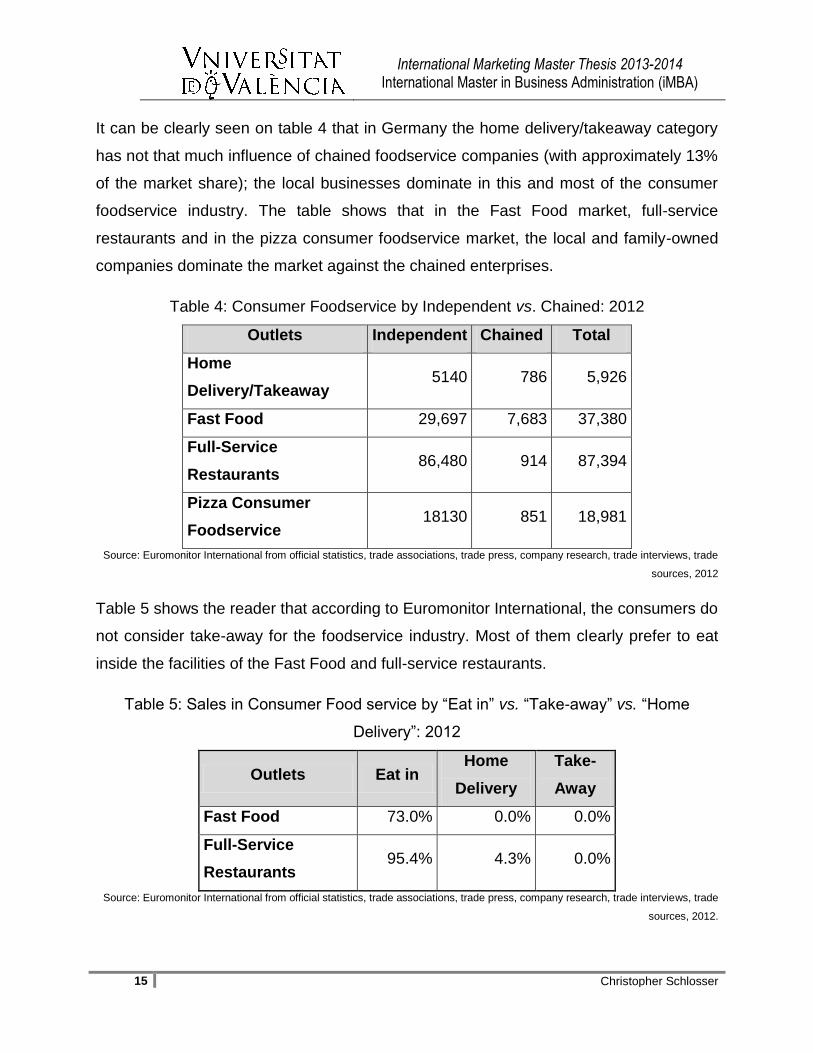
It can be clearly seen on table 4 that in Germany the home delivery/takeaway category
has not that much influence of chained foodservice companies (with approximately 13%
of the market share); the local businesses dominate in this and most of the consumer
foodservice industry. The table shows that in the Fast Food market, full-service
restaurants and in the pizza consumer foodservice market, the local and family-owned
companies dominate the market against the chained enterprises.
Table 4: Consumer Foodservice by Independent vs. Chained: 2012
Outlets Independent Chained Total
Home
Delivery/Takeaway 5140 786 5,926
Fast Food 29,697 7,683 37,380
Full-Service
Restaurants 86,480 914 87,394
Pizza Consumer
Foodservice 18130 851 18,981
Source: Euromonitor International from official statistics, trade associations, trade press, company research, trade interviews, trade
sources, 2012
Table 5 shows the reader that according to Euromonitor International, the consumers do
not consider take-away for the foodservice industry. Most of them clearly prefer to eat
inside the facilities of the Fast Food and full-service restaurants.
Table 5: Sales in Consumer Food service by ―Eat in‖ vs. ―Take-away‖ vs. ―Home
Delivery‖: 2012
Outlets Eat in Home
Delivery
Take-
Away
Fast Food 73.0% 0.0% 0.0%
Full-Service
Restaurants 95.4% 4.3% 0.0%
Source: Euromonitor International from official statistics, trade associations, trade press, company research, trade interviews, trade
sources, 2012.
International Marketing Master Thesis 2013-2014 International Master in Business Administration (iMBA)
16 Christopher Schlosser
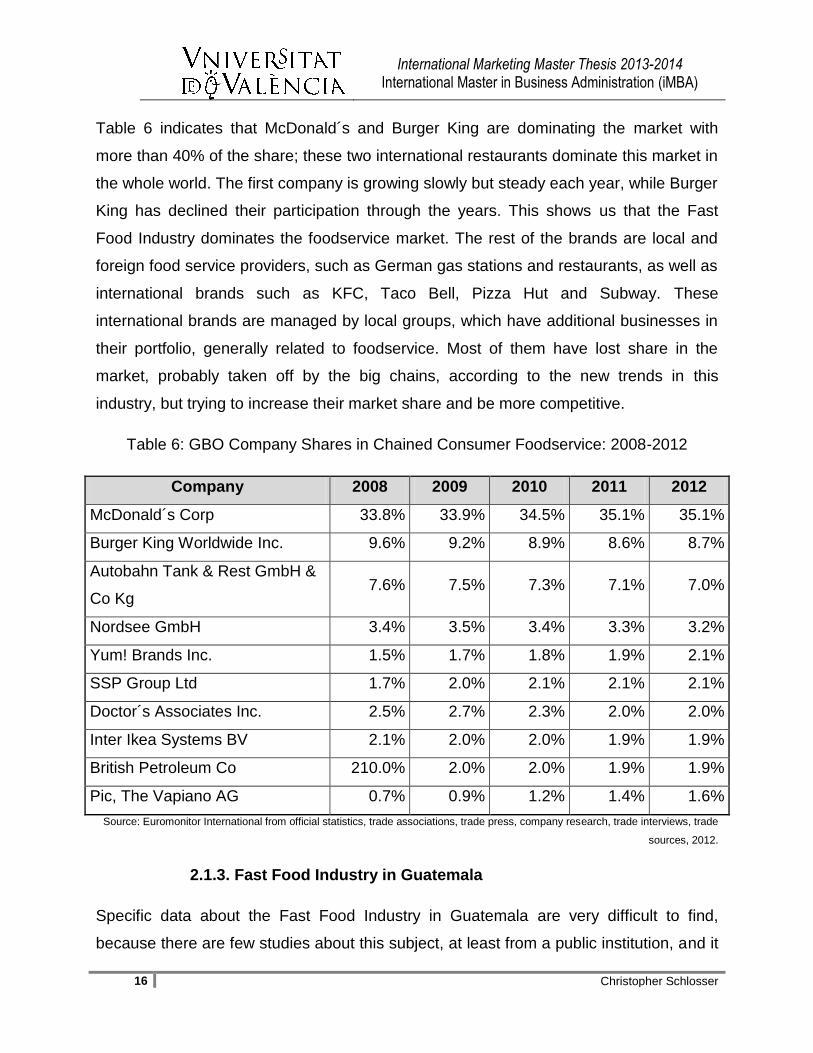
Table 6 indicates that McDonald´s and Burger King are dominating the market with
more than 40% of the share; these two international restaurants dominate this market in
the whole world. The first company is growing slowly but steady each year, while Burger
King has declined their participation through the years. This shows us that the Fast
Food Industry dominates the foodservice market. The rest of the brands are local and
foreign food service providers, such as German gas stations and restaurants, as well as
international brands such as KFC, Taco Bell, Pizza Hut and Subway. These
international brands are managed by local groups, which have additional businesses in
their portfolio, generally related to foodservice. Most of them have lost share in the
market, probably taken off by the big chains, according to the new trends in this
industry, but trying to increase their market share and be more competitive.
Table 6: GBO Company Shares in Chained Consumer Foodservice: 2008-2012
Company 2008 2009 2010 2011 2012
McDonald´s Corp 33.8% 33.9% 34.5% 35.1% 35.1%
Burger King Worldwide Inc. 9.6% 9.2% 8.9% 8.6% 8.7%
Autobahn Tank & Rest GmbH &
Co Kg 7.6% 7.5% 7.3% 7.1% 7.0%
Nordsee GmbH 3.4% 3.5% 3.4% 3.3% 3.2%
Yum! Brands Inc. 1.5% 1.7% 1.8% 1.9% 2.1%
SSP Group Ltd 1.7% 2.0% 2.1% 2.1% 2.1%
Doctor´s Associates Inc. 2.5% 2.7% 2.3% 2.0% 2.0%
Inter Ikea Systems BV 2.1% 2.0% 2.0% 1.9% 1.9%
British Petroleum Co 210.0% 2.0% 2.0% 1.9% 1.9%
Pic, The Vapiano AG 0.7% 0.9% 1.2% 1.4% 1.6%
Source: Euromonitor International from official statistics, trade associations, trade press, company research, trade interviews, trade
sources, 2012.
2.1.3. Fast Food Industry in Guatemala
Specific data about the Fast Food Industry in Guatemala are very difficult to find,
because there are few studies about this subject, at least from a public institution, and it

International Marketing Master Thesis 2013-2014 International Master in Business Administration (iMBA)
17 Christopher Schlosser
is very tough to access the private ones. In the last ten years, there has been a huge
rise of the Fast Food Industry, especially with the franchises from abroad, 85% of these
restaurants are located in the capital, Guatemala City and the rest in the countryside
(Masip, 2008). The most popular restaurants in Guatemala are Pollo Campero,
McDonald´s, Burger King and Los Cebollines; the first and last restaurants are local. As
the reader can see, the main franchises are the same as in Spain and Germany, which
confirms that the globalization is a vital aspect in this industry in most parts of the world.
In the restaurant business in Guatemala, there are 200 franchises operation nationwide
(CentralAmericaData.com, 2011) and are looking for expansion by selling franchises
abroad and locally in the countryside; the market in the capital is stagnant
(CentralAmericaData.com, 2012). This gives businesses an opportunity to expand to
the countryside and face the challenge of centralization of the economy in the city. The
downside is that in the countryside the education level is really low and most of the
population does not know other brands or companies, than the local ones. This is a very
big challenge that companies have to face. Guatemala is the leader in Central America
in generating local franchises; this market grows 15-20% a year in this region (Masip,
2008). A quantitative study published in 2011 by El Periódico (one of the main
newspapers in this country) in Guatemala, shows that most of Guatemalans prefer
chicken as their favorite dish; the second choice is pizza and the third Chinese food.
Other meals as Italian food, hamburgers and seafood are also one of the favorite of the
population; this means that the food preferences are similar to the big global restaurant
chains. The reason for the increase of Fast Food consumption in Guatemala is due to a
cultural issue; it has a lot of influence from the United States of America (El Periódico,
2011).
The second section of the literature review goes through the explanation of the
Customer Relationship Management and its components, which are the perceived
value, customer satisfaction and loyalty in the Fast Food Industry. The reader will be
able to appreciate the relationship, similitudes and differences between them. It is very
important to analyze the service-oriented businesses in this industry, in order to attend
International Marketing Master Thesis 2013-2014 International Master in Business Administration (iMBA)
18 Christopher Schlosser
to the satisfaction of the customers, and struggling against the cultural differences
among this industry (Gilbert, Veloutsou, Goode & Moutinho, 2004).
2.2. Customer Relationship Management
―The approach of the Fast Food Market orientation has changed; now businesses are
increasingly focusing on understanding customers‖ (Lanier & Saini, 2008, p.1). It all
started with offering food in a fast and cheap way, now the trend is to focus more on the
customer needs and create value together in order to keep them satisfied and loyal. In
fact, the Fast Food Industry is adopting a more customer-orientated approach. We shall
see in the following paragraphs how the main ideas from both services marketing
management and customer relationship management can be applied to this industry.
Fast Food is considered a hybrid in the continuum of goods and services (Zeithaml and
Bitner, 2003); they offer tangible and intangible products to consumers, in order for
them to enjoy the environment of the restaurant. Value drivers can then be offered,
within this industry, from both tangible and intangible elements (Brady, Robertson &
Cronin, 2001). This explains that customers are requiring every day more attention from
the companies, which have to learn about them and try to satisfy them at all costs. This
is accomplished by working closely with key stakeholders; it is vital to have similar
values and goals (Leidner, 1993). So, the companies have to direct their strategies to
customer satisfaction, analyzing and evaluating their behavior first. As the academia
has clearly stated for the last decade, the study and analysis of service value, quality
and satisfaction issues are the ones that have dominated the services literature in last
decades (Cronin, Brady & Hult, 2000). ―The development of service marketing concepts
over the years has evolved in accordance with the philosophy of customer orientation. A
marketing orientation puts the customer at the core of an organization´s purpose and
activity‖ (Gilmore, 2003, p.6). This definition explains that the point of view of companies
is changing to keep customers satisfied and happy and always trying to get more,
instead of focusing only in the company‘s activities and offers.
International Marketing Master Thesis 2013-2014 International Master in Business Administration (iMBA)
19 Christopher Schlosser
―Marketing scholars are studying the nature and scope of Customer Relationship
Management and are developing conceptualizations regarding the value and process of
cooperative and collaborative relationships between buyers and sellers‖ (Parvatiyar &
Sheth, 2001, p.2). This creates the understanding of these factors and how they relate
to each other. Customer Relationship Management is defined as ―a comprehensive
strategy and process of acquiring, retaining, and partnering with selective customers to
create superior value for the company and the customer. It involves the integration of
marketing, sales, customer service, and the supply-chain functions of the organization,
to achieve greater efficiencies and effectiveness in delivering customer value‖
(Parvatiyar & Sheth, 2001, p. 5).
Nowadays service-oriented companies need to make emphasis on this area in order to
fulfill the customer´s needs and satisfy them to influence them to repeat the purchase;
this means to persuade their behavioral intentions (Bagozzi, Wong, Abe & Bergami,
2000). This is a very important issue for companies, in order to adapt their customer-
centric strategies to satisfy their needs. The main goal is to develop a close cooperative
and partnering relationships with the customers (Parvatiyar & Sheth, 2001). Customer
Relationship Management seeks to make customers loyal, though satisfaction by
fulfilling the customers perceived value dimensions. Some of these measure the quality
of the offerings, the time spent in the facilities, the physical and psychological
environment of the restaurant, the impact of society and its status and the pricing.
Since the 80s, and mostly during the 90s, researchers have developed Relationship
Marketing, in order to improve the focus on customers, and study the process of the
relationship that businesses have with their customers and other stakeholders
(Palmatier, 2008; Berry, 1995). ―Relationship Marketing is the process of identifying,
developing, maintaining, and terminating relational exchanges with the purpose of
enhancing performance‖ (Palmatier, 2008, p.5). To build relationships with customers
and key stakeholders is necessary for companies in order to achieve long-lasting
relations through commitment and confidence, creating a higher value together and
achieving a competitive advantage to succeed among the market (Jalili, 2008).

International Marketing Master Thesis 2013-2014 International Master in Business Administration (iMBA)
20 Christopher Schlosser
Relationship Marketing is to invite, maintain and enhance stakeholder‘s relationships at
a profit, so that the goals and objectives of all parties involved are obtained (Brink &
Berndt, 2008). This is done in order to build better relations with all the parties involved
and to improve them in order to be successful in the future. Jorgensen (2011) explained
that the idea of relationship extended in the different areas, such as service and
consumers, are the result of high interest in relations between the parties. This study
demonstrates the relationship between these factors and how they influence in the
customers purchase decisions.
In order to go deeper into the peculiarities of Customer Relationship Management in the
Fast Food Industry, it is vital to analyze the value that customers perceive when
consuming in a quick service restaurant, in order to fulfill their needs to reach their
satisfaction and try to make them loyal. The following section will explain the three main
concepts underlying Customer Relationship Management (i.e. Perceived value,
customer satisfaction and loyalty) in order for the reader to understand them for the
subsequent research done in this study.
2.2.1. Perceived Value
People can be motivated to go out and eat, most of them are looking for fun, taste and
interactions with others; this gives them experiential value in order to make further
decisions (Park, 2004). Globalization is one of the reasons why cultures are meeting
and their markets are changing to a common culture worldwide; one clear example is
the Fast Food Restaurants (Park, 2004). To understand the marketing relationships
between customers and companies, it is vital to explore the concept of value, which
many authors have been trying to research in the last decades (e.g. Albrecht, 1992;
Sweeney and Soutar, 2001; Oliver, 1999; Holbrook, 1999; Gallarza & Gil-Saura, 2006;
Gallarza, Gil-Saura & Arteaga, 2013).
There are many different dimensions of value that customers around the world perceive
from Fast Food Restaurants, this perceived value can be seen from different points of
view in order to evaluate and analyze a product, which derive from food quality, the
International Marketing Master Thesis 2013-2014 International Master in Business Administration (iMBA)
21 Christopher Schlosser
service given and many other dimensions. ―The only thing that matters in the new world
of quality is delivering customer value‖ (Albrecht, 1992, p.7). This is focused on what
customers are looking for in order to try to satisfy them. According to Cronin, Brady &
Hult (2000) the quality, service and satisfaction could be related to the behavioral
intention of the customers when purchasing a product. Sweeney and Soutar (2001)
argue that when companies satisfy the needs of the consumers, they deliver value,
which builds a long term relationship with them. Managers of Fast Food Industry
companies should be aware of these value dimensions and to understand them, in
order to achieve market place advantage and gain strength in the industry.
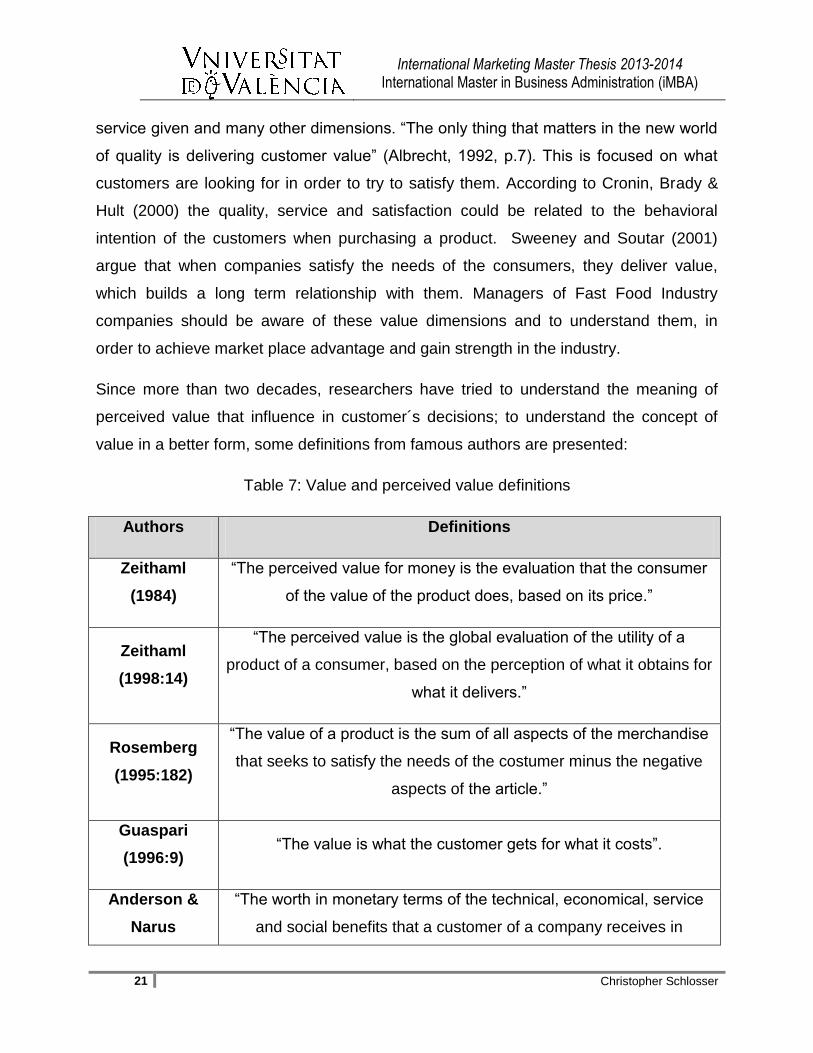
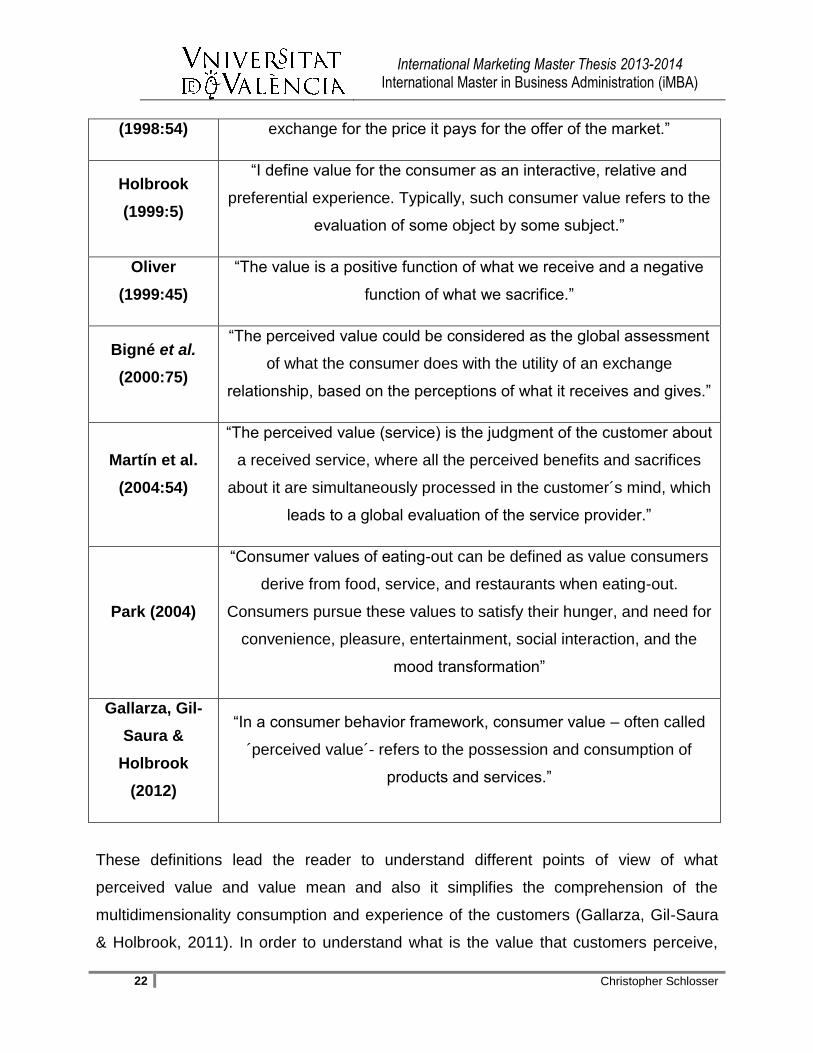
Since more than two decades, researchers have tried to understand the meaning of
perceived value that influence in customer´s decisions; to understand the concept of
value in a better form, some definitions from famous authors are presented:
Table 7: Value and perceived value definitions
Authors Definitions
Zeithaml
(1984)
―The perceived value for money is the evaluation that the consumer
of the value of the product does, based on its price.‖
Zeithaml
(1998:14)
―The perceived value is the global evaluation of the utility of a
product of a consumer, based on the perception of what it obtains for
what it delivers.‖
Rosemberg
(1995:182)
―The value of a product is the sum of all aspects of the merchandise
that seeks to satisfy the needs of the costumer minus the negative
aspects of the article.‖
Guaspari
(1996:9) ―The value is what the customer gets for what it costs‖.
Anderson &
Narus
―The worth in monetary terms of the technical, economical, service
and social benefits that a customer of a company receives in
International Marketing Master Thesis 2013-2014 International Master in Business Administration (iMBA)
22 Christopher Schlosser
(1998:54) exchange for the price it pays for the offer of the market.‖
Holbrook
(1999:5)
―I define value for the consumer as an interactive, relative and
preferential experience. Typically, such consumer value refers to the
evaluation of some object by some subject.‖
Oliver
(1999:45)
―The value is a positive function of what we receive and a negative
function of what we sacrifice.‖
Bigné et al.
(2000:75)
―The perceived value could be considered as the global assessment
of what the consumer does with the utility of an exchange
relationship, based on the perceptions of what it receives and gives.‖
Martín et al.
(2004:54)
―The perceived value (service) is the judgment of the customer about
a received service, where all the perceived benefits and sacrifices
about it are simultaneously processed in the customer´s mind, which
leads to a global evaluation of the service provider.‖
Park (2004)
―Consumer values of eating-out can be defined as value consumers
derive from food, service, and restaurants when eating-out.
Consumers pursue these values to satisfy their hunger, and need for
convenience, pleasure, entertainment, social interaction, and the
mood transformation‖
Gallarza, Gil-
Saura &
Holbrook
(2012)
―In a consumer behavior framework, consumer value – often called
´perceived value´- refers to the possession and consumption of
products and services.‖
These definitions lead the reader to understand different points of view of what
perceived value and value mean and also it simplifies the comprehension of the
multidimensionality consumption and experience of the customers (Gallarza, Gil-Saura
& Holbrook, 2011). In order to understand what is the value that customers perceive,
International Marketing Master Thesis 2013-2014 International Master in Business Administration (iMBA)
23 Christopher Schlosser
specifically in the Fast Food Industry and to become loyal or to be satisfied, it is
important to go deep in the meaning of the value dimensions. Each of the perceived
value dimensions can show us the different aspects and points of view that customers
have towards this industry and to analyze the impact on the satisfaction and loyalty of
consumers (Gil & Gallarza, 2008). These value dimensions influence in the decisions
that consumers make towards Fast Food Restaurants and are very important for these
companies to know, in order to focus their attention mostly in them, in order to satisfy
their target customers. This decision comes from the consumption experience that
costumers have, instead of the company or brand chosen or in the object purchased
(Holbrook, 1999).
As the literature recognized, there are many value dimensions that can be considered,
such as quality of the service or product, the physical attributes of the offering company
and the feelings that influence the customers towards a product. ―The way that service
quality and meal quality are perceived by local consumers will influence customers
‗satisfaction and consequently their loyalty in the future‖ (Etemad-Sajadi & Rizzuto,
2013, p.781). The quality of the food in the Fast Food Industry is a vital perceived value
that consumers analyze in order to choose among their options of this product. Knutson
(2000) explains that studies have shown that the most important factor that consumers
considered in Fast Food Restaurants was whether their meal was prepared the way
they wanted it. This means that costumers are seeking to satisfy their needs and will try
very hard to get what they want; this is an opportunity for the companies to investigate
and get to know their clients in order to meet these needs. Johns & Pine (2002) state
that costumers view the Fast Food service as a set of characteristics, ascribing different
stages of importance to each characteristic.
Customers are influenced through these dimensions of value, which can lead them to
be satisfied with a product and eventually becoming loyal to the brand or company. The
reader will be explained how the dimensions of value can influence the customers in
order to become satisfied in and the importance of their role to influence the behavior of
consumers. Sweeney and Soutar (2001) explain that the different value dimensions are

International Marketing Master Thesis 2013-2014 International Master in Business Administration (iMBA)
24 Christopher Schlosser
inter-related; it means that when a consumer purchases a product, it affects the hedonic
and utilitarian components of consumer behavior and it influences the buyer to choose.
In this sense, and concerning the industry studied, a research made by Park, in 2004,
the results showed that the perceived value dimensions in Korea for the Fast Food
Restaurants were divided in two factors: hedonic and utilitarian. The hedonic value in
this market had a positive correlation with cleanliness, efficiency, mood, quality of food
and the physical facilities. The utilitarian value was centered in pricing, quick service
and sale promotions. The results showed that the hedonic value was more influencing
than the utilitarian for Fast Food consumers in this country. Many authors have debated
on these two components; creating scales and relationships with consumer behavior
and purchase intentions. The underlying process for this dichotomy was proposed long
time ago: Holbrook & Hirschman (1982) already explained that the information
processing point of view of different products were judged with utilitarian criteria; the
performance of it compared to what they expected. Through hedonic criteria, the
products are viewed from the experience of customers of the purchase of it. Batra &
Ahtola (1990) argued that consumers valued hedonic and utilitarian dimensions when
consuming.
The following section will explain the relationship of customer satisfaction and loyalty,
which are the pillar of this research. As stated by Sweeney & Soutar (2001, p.206),
―Perceived value has been widely discussed at a generic level, particularly in the
practitioner literature and can easily be confused with satisfaction‖. This explains that
there have been confusions in the past, but these concepts are dissimilar; perceived
value happens in various stages of a buying process and satisfaction is an evaluation of
the usage of the product. ―The way that service quality and meal quality are perceived
by local consumers will influence customer´s satisfaction and consequently their loyalty
in the future‖ (Etemad-Sajadi & Rizzuto, 2013, p.781). As the reader can realize, these
factors are related and influence in customers decision of purchase. This section will
show the different definitions and characteristics of satisfaction and loyalty, as well as
their influence in the behavior of customers.

International Marketing Master Thesis 2013-2014 International Master in Business Administration (iMBA)
25 Christopher Schlosser
2.2.2. Customer Satisfaction and loyalty
―Competition in the Fast Food market is growing and success depends more and more
on customer retention‖ (Etemad-Sajadi & Rizzuto, 2013, p. 781). Companies need to
focus on keeping the most customers as possible and maintain them satisfied at all
costs, in order to keep being competitive in the Food Market. Nowadays the ever-
increasing globalization of products and services leads companies to have to focus their
main objective to satisfying the customers, by searching and investigating their needs,
in order for them to become loyal. In the Fast Food Industry, the customer perceptions
of the service are very important to measure the provider performance (Stank, Goldsby
& Vickery, 1999). When customers are satisfied, there is an emotional response
resulted from a cognitive process of evaluation of the product acquired against the cost
of obtaining it.
As the literature states, ―satisfaction is the consumer´s fulfillment response. It is a
judgment that a product/service feature, or the product or service itself, provided (or is
providing) a pleasurable level of consumption-related fulfillment, including levels of
under-or over fulfillment‖ (Oliver, 2010, p.8). This definition clearly states that
satisfaction is related to the customers ‗point of view, and how they evaluate and
compare the product performance to what they expected. For a customer to be satisfied
and happy, companies have to fulfill their expectations and try to go the extra mile for
them, so that they can return to purchase with them and spread the good word to the
most people as possible. If the customer has positive results from this outcome, only
then, he or she can become loyal to a product, brand or to a company. According to
Smith (2012) when customers have a good experience at a restaurant, they usually
repurchase there. In comparison to other services, in Fast Food Industry, re-purchase is
more likely to happen, after satisfaction, because of the nature of the experience. The
positive assessments influence in customer satisfaction, which leads to loyalty to the
brand or product. Smith argues that customer satisfaction can be measured with four
key dimensions: The first one is about the overall opinion of the customer´s experience
of the product; it is mostly centered on the quality and reliability.
International Marketing Master Thesis 2013-2014 International Master in Business Administration (iMBA)
26 Christopher Schlosser
The second key dimension measures loyalty of the customers, which are influenced by
the evaluation of performance of the provider. The third measurement deals with
specific value dimensions that influence in the satisfaction of customers, it tries to
evaluate all the attributes of the product and this way to measure the attitude of
customers towards it. The last dimension is the intention of repurchase, which
summarizes all of the measurements above and conclude if the customer would return
to buy the product. According to Etemad-Sajadi & Rizzuto (2013), consumers
repurchase and speak well of a Fast Food Restaurant with a good image, in the
confidence that will provide a guarantee of high quality products.
The relationship between customer satisfaction and loyalty is one of the topics that
many authors have studied and proven to be certain. ―Indeed, consumer loyalty is a pre-
requisite for a successful and profitable business‖ (Etemad-Sajadi & Rizzuto, 2013, p.
781). The main strategies of increasing loyalty in a business are to please customers
and satisfying them at all costs so that they want to continue purchasing, and
obstructing the switching development to other suppliers by increasing the switching
barriers (Picón, Castro & Roldán, 2014). According Grönroos (1982) the perceptions
after the purchasing experience are influenced by the image of the company, so if
consumers obtain a good service, they will robotically have a positive perception of the
brand or company. The willingness of returning and keep on doing business with a
company requires incentives and motivation for customers; this is what loyalty is all
about. “Customer loyalty is viewed as the strength of the relationship between an
individual's relative attitude and repeat patronage. The relationship is seen as mediated
by social norms and situational factors. Cognitive, affective, and conative antecedents
of relative attitude are identified as contributing to loyalty, along with motivational,
perceptual, and behavioral consequences‖ (Dick & Basu, 1994, p.101). To increase
loyalty is a very difficult task that companies nowadays are obliged to work for, by
training their employees and setting clear objectives towards the satisfaction of
customers.
International Marketing Master Thesis 2013-2014 International Master in Business Administration (iMBA)
27 Christopher Schlosser
There are three ways to approach the loyalty: behavioral, attitudinal and a combination
of both (Oliver, 1997); the first one means that it emphasizes loyalty as a repeat
purchasing behavior and the attitudinal approach analyzes loyalty as a psychological
state that the customer may reach (Picón, Castro & Roldán, 2014). A combination of
both suggests a repetition of the purchase behavior with the emotional state of the
customers. Etemad-Sajadi & Rizzuto (2013) argue that the majority of consumers who
are loyal, did switch brand recently even if they were satisfied; so in order to become
loyal, customers have to have a high level of satisfaction. To add to this theory, Jones
and Sasser (1995) said that a drop from a customer´s total satisfaction ends being a
major drop in loyalty towards the company.
When a company has loyal customers, it means that probably they have successfully
fulfilled their expectations and maybe more, and have provided them satisfaction related
to their offer, making them repurchase and helping the business attract more customers
by speaking well about them to their known relatives. According to Sahagun & Vasquez-
Parraga (2014) customer loyalty in the Fast Food Industry can be approached as the
consumer behavioral outcome, such as repetition of purchase, and the other approach
focuses on the attitude of the customers, that may have affection towards the company
or brand. But it is also important to mention that not always the loyal customers are
satisfied with the offer provided by the supplier; they might not be satisfied at all, but
they might just be loyal because of the good service that was provided to them. For
example, a customer might be unsatisfied with a product, but will return to purchase in
the near future and be loyal to the company even though he or she was not satisfied. In
this sense, satisfaction and service quality may differ in Fast Food Restaurants.
Picón, Castro & Roldán (2014) argue that satisfaction and the value of the product is the
key determinant of customer loyalty. When customers are loyal, they may give the
perception of wanting to be part of the company, in order to help improve it day by day,
until they can perform in an adequate manner.
As aforementioned, when a customer is satisfied with a product (good or service), he or
she wants to continue purchasing it, because it fulfills his or her needs. Being satisfied
International Marketing Master Thesis 2013-2014 International Master in Business Administration (iMBA)
28 Christopher Schlosser
implies that the supplier has convinced the customer through their offer to purchase
their product; they influence the client´s behavior of purchase intention towards their
product so that they can continue purchasing it and spreading the word. According to
Park & Jang (2014) satisfaction is a direct originator of behavioral intentions, for
example, repurchase and switching intentions. When the satisfaction of a customer is
increased, it leads to repurchase intentions as well as reducing the switching intentions
of customers. A real challenge for a company is to know their customers and to reach
their satisfaction towards their product. But having done this, they have to be smart
enough to influence the purchase intentions, in order for them to continue buying for
their business. The difference is that when a company satisfies a customer, it matches
or exceeds their expectations, but influencing in the client´s behavioral intentions is one
of the toughest tasks, because it needs for the companies to completely understand
their customers and predict and anticipate their needs. In the aforementioned work by
Cronin, Brady and Hult (2000) it can be noticed that service quality and perceived value
have influence on behavioral intentions of the customers in a direct and indirect form.
The service quality and service value also leads to customer satisfaction, which leads
us to say that the satisfaction influences customers to an emotional response.

International Marketing Master Thesis 2013-2014 International Master in Business Administration (iMBA)
29 Christopher Schlosser
3. Research Objectives
In order to show in a clear form to the reader what the study is all about, it is very
important to mention the general objective and the sub-objectives of the research. They
are focused on the comparison of the influence of loyalty, satisfaction and perceived
value dimensions of the Fast Food Industry in Germany, Guatemala and Spain, and the
impact on them in order to relate them and prove the hypotheses proposed.
3.1. Research objectives
As announced in our introduction, the general objective of this study is to compare the
main factors that influence in the loyalty of the consumers of the Fast Food Industry, in
three different countries: Germany, Guatemala and Spain. There are many differences
in culture between each of these countries and it is very interesting to discover the main
ones in this industry, as well as their similitudes. Even though globalization plays a huge
role in this market, it is fascinating to study the variances among different cultures in
different continents. According to Ghemawat in 2004, the distance between countries in
not only about the geographical dimension, it also influences the culture, politics and
economy. For example, there is a high chance of having similar preferences in two
countries, by having a colony-colonizer relationship, such as Spain and Guatemala.
Another example is if both countries speak the same language; that is the case between
Guatemala and Spain. As Germany, although being geographically closer to Spain,
does not offer such similarities, it will be very interesting to analyze the similitudes of
these three countries.
The first sub-objective of the present work is to provide knowledge for researchers and
managers about the perceived value dimensions that influence the customers and
which ones they appreciate more in order to become loyal to the company in each of
the countries being analyzed. Nowadays, it is vital to get to know the customers in order
to build relationships and influence their behavioral purchase intentions. After analyzing
this study, people interested in the Fast Food Market will be able to have a perspective
International Marketing Master Thesis 2013-2014 International Master in Business Administration (iMBA)
30 Christopher Schlosser
of different countries and the impact of customers‘ attitudes towards it, as well as the
values that they appreciate the most in order to become satisfied.
The second sub-objective related to loyalty behavior in Fast Food Industry through
satisfaction, as it is known that the switching costs are very low in this industry
(Sahagun & Vasquez-Parraga, 2014); indeed, it is very easy for a consumer to switch
between suppliers in this industry, because of the low cost of the products and the large
variety of suppliers competing in this market. The understanding of how customers
value consumption experiences derived from the various market offerings is a very
important issue that will be developed in this study, as well as to find out the perception
that the Fast Food Restaurants have about customers and the impact in each one of
them. This will lead to analyze the impact they have on the satisfaction of the
customers. Accordingly, this sub-objective of this study is grounded on the idea that
satisfied customers become loyal customers in the Fast Food Industry.
Having the sub-objectives set and clear, there are some research questions that
accompany them, and are vital to answer them in order to complete the research.
Before starting the study, the first aspect to have clear was the research questions,
which help to guide towards the objectives of an investigation.
3.2. Research questions
In every research different questions may be posted to be answered in order to fully
understand a subject. The main question of this research is which are the perceived
value dimensions that influence the purchase of consumers in the Fast Food
Industry? This question will be the pillar of the qualitative research of this study, which
gives the author a much clearer idea of the different values to investigate. The second
research question is how do these dimensions differ in the customers in the three
studied countries? This question can be answered after analyzing the chosen value
dimensions and hypothesis of each country, and will show how they impact behavior of
the consumers. The third question of this study is: could customers be loyal at all in
this industry? This answer will show the reader if the customers can really be loyal in
International Marketing Master Thesis 2013-2014 International Master in Business Administration (iMBA)
31 Christopher Schlosser
this industry, even though the switching costs are low and there a many suppliers
competing on it.
There have been different studies that tried to answer these questions, but to our best
knowledge, never comparing with the three countries we are interested in. In order to
prove the impact of the perceived value dimensions in the loyalty of customers, a set of
hypotheses was developed and will be explained in the following section.
3.3. Proposing research hypotheses
The study focuses on a comparison that includes the perceived value dimensions of
customers, which have effects on customer satisfaction and leads them to become loyal
to a restaurant in the Fast Food Industry in three different countries. The research has
as variables different value dimensions that customers find important in their decisions,
as well as experts in this industry recommend taking into consideration. The overall
outcome of the value dimensions will determine a total value that will be related to the
customer satisfaction and this will determine if the customers are loyal or not.
According to our literature review (Holbrook, 1999; Gallarza & Gil, 2006; Park, 2004;
Sweeney & Soutar, 2001; Oliver, 1999; Etemad-Sajadi & Rizzuto, 2013) the following
value dimensions are the most influencing in the Fast Food Industry: efficiency of the
process, cleanness of the physical facilities, quality of the product, aesthetics of the
facilities, price, impact of emotions, the general view of facilities and the influence of
social status. The essence of our study depicts how all of these value dimensions will
give the reader an idea of the strength they have in influencing the customers in order to
become satisfied with the company. As proved by the literature (e.g. Cronin, Brady &
Hult, 2000), being satisfied with the company can make a customer repurchase in the
near future and become loyal to the supplier. The following paragraphs will develop our
approach and justification to each of the value dimensions considered in our research,
and the subsequent hypotheses derived from them.
3.3.1. Efficiency
Time is considered a scarce resource; consumers have to take decisions regarding the
use of their time while purchasing goods and services (Leclerc, Schmitt & Dubé, 1995).
International Marketing Master Thesis 2013-2014 International Master in Business Administration (iMBA)
32 Christopher Schlosser
Fast Food Restaurants have operational systems planned to provide their clients with
efficient and responsive services, the perception of the time spent in every culture is
different (Lee & Ulgado, 1997). These issues (time convenience) derive value for the
consumer, and correspond to the dimension of ―efficiency‖ (Holbrook, 1999). As stated
by King & Lawley, (2013, p.100) ―Fast Food Restaurants have efficiency inscribed in
their DNA-not just in the production of food, but at just about every level and function of
the organization‖. These systems comprise three interdependent areas: input,
processing and output. The success of this system is directly associated to the degree
of cooperation and management among these three subsystems (Choudhary, 2011),
and ad what is more important, they do vary from one country to another (Gilbert,
Veloutsou, Goode & Moutinho, 2004). The time spent while waiting for the food is a very
important value that may differ across cultures and that customers evaluate in order to
feel satisfied with a restaurant in the Fast Food Industry, which has its name because of
this. Customers expect to receive a quick service, with quality food and good attention
from the employees and of course at a low price. According to this rationale, we can
post it our first hypothesis, which is:
H1. Perceptions of Efficiency will differ significantly between countries
3.3.2. Cleanness
When customers enter a restaurant, they expect it to be clean and in order; being dirty
and messy will influence in the customer´s perspective of the appearance of the facility.
"Fast Food establishments have a positive record of cleanliness when compared with
other restaurants" (Smith, 2006, p.105). Places where people eat have to demonstrate
hygiene; customers like to eat in a healthy and clean environment. Fast Food Chains
apply the concept of cleanliness in all their restaurants around the world; it is one of the
most important factors of success. (Kotler, Kartajaya, Huan & Liu, 2008; Kara, Kaynak,
Kucukemiroglu, 1995; Park, 2004). It is very important for the administration of these
restaurants to have cleanness policies globally, and processes so that the customers
can feel comfortable while eating their products. According to Cohen and Glover in
2013, the perception of cleanness varies among cultures and family values. "In this
International Marketing Master Thesis 2013-2014 International Master in Business Administration (iMBA)
33 Christopher Schlosser
manner, understanding customers‘ expectations or perceptions of restaurant
cleanliness can be essential for successful restaurant management" (Yoo, 2012). For
example, the restrooms have to be clean at all times, it is a fact that customers care
about this. ―The most personal — and most telling — moment that a customer
experiences in a restaurant isn't typically at the table. It's in the restroom‖ (Horovitz,
2013, para.1). This shows the reader that cleanness plays a big role in every type of
restaurant and it influences the behavior of customers. According to this rationale, we
can post it our second hypothesis, which is:
H2. Perceptions of Cleanness will differ significantly between countries
3.3.3. Product Quality
The quality of the food is one of the differentiations that restaurants worldwide have
among them; it is a vital value that customers consider while choosing to which Fast
Food Restaurant to go. In this market, restaurants try to differentiate from the
competitors through the quality of their products. In any service provision, it sounds
obvious that quality leads to service value (Gallarza and Gil, 2006; Cravens, Holland,
Lamb & Moncrieff, 1988; Zeithaml, 1988) but this is even more clear when planning
restoration service (Baraban, & Durocher, 2010) ―The way that service quality and meal
quality are perceived by local consumers will influence customers‘ satisfaction and
consequently their loyalty in the future‖ (Etemad-Sajadi & Rizzuto, 2013, p. 781). The
quality of the food can be measured with standardization; trying to get the same product
every time a customer asks for it in any part of the world (Baek, Ham, Yang, 2006):
same taste, looks and smell (Leidner, 1993). According to Park (2004), the quality of
food was the most important attribute for the Fast Food consumers in Korea. This
proves that customers nowadays are demanding better products and that is a struggle
among competitors in this market in almost all the regions of the world. But, these
customers‘ demands may change across countries, and presents different levels of
expectations (Cheung, Murrmann, Murrmann & Becker, 2004) According to this
rationale, we can post it our third hypothesis, which is:
H3. Perceptions of Food Quality will differ significantly between countries
International Marketing Master Thesis 2013-2014 International Master in Business Administration (iMBA)
34 Christopher Schlosser
3.3.4. Aesthetics
In the Fast Food Industry, the aesthetics of the restaurants in every region play a very
big role, not just on the outside, but also on the inside (Witkowski, Ma & Zheng, 2003);
customers want to eat in an appealing environment, not among crowded settings (Kim,
2008) or any uncomfortable atmosphere. The restaurant experience plays a huge role in
this market; the aesthetics have to match costumer‘s needs in order for them to feel
comfortable (Miele & Murdoch, 2002). Each culture has its own perception of aesthetics
in infrastructures, which involves the social influence in it (Fumerton, 1991). When a
restaurant looks attractive on the outside, people are intended to enter it and try it; it
gives a good perception of what the company can offer inside the restaurant. The inside
design is vital in order to make customers feel comfortable and can enjoy their meals.
―The front of the house needs enough space for customers to queue up and place their
orders. Behind the order counter, space needs vary‖ (Baraban & Durocher, 2010, p.18).
There are special designs for Fast Food restaurants that help ease the path for
customers, in order to make them feel comfortable and satisfied. But, obviously,
aesthetics do vary across cultures, as aesthetics is one of the main dimensions of
cultures (Keagan & Green. 2013; Miele & Murdoch, 2012; Pearce, Blakely, Witten &
Bartie, 2007), According to this rationale, we can post it our fourth hypothesis, which is:
H4. Perceptions of Aesthetics will differ significantly between countries
3.3.5. Perceived Price
Customers nowadays are aware of the prices of the most popular Fast Food
Restaurants; one of the main strategies used is sale promotion, which has a great
impact on consumers in every country (Lee & Ulgado, 1997; Brady, Robertson &
Cronin, 2001). For example, having ―2 for 1‖ for some days of the week, or price
reductions in several items, contests that customers can participate and win prices, and
price bundles (Yadav & Monroe, 1993) are strategy that almost all restaurants globally
in this industry use. Some customers tend to emphasis more on the value of what they
receive for what they are giving up (Brady, Robertson & Cronin, 2001). Restaurants in
International Marketing Master Thesis 2013-2014 International Master in Business Administration (iMBA)
35 Christopher Schlosser
this industry normally increase the product´s benefits while maintaining or decreasing
the price; they communicate this to the customers, in order to persuade them to
purchase their offer. ―Fast Food franchises have long had a love-hate relationship with
dollar menus and other cheapie promotions‖ (Tuttle, 2014, para. 2). This example
clearly states that restaurants compete to try to have the best deals and attract
consumers, even if their earnings will be shortened. The relationship between quality
and value for money play an important role in customer´s purchase intentions (Dodds,
Monroe & Grewal, 1991). As prices are perceptions, personal characteristics affect
them; they vary across cultures (Lee, Ulgado, 1997). According to this rationale, we can
post it our fifth hypothesis, which is:
H5. Perceptions of the value for money will differ significantly between countries
3.3.6. Social Status
Going to a Fast Food Restaurant can be considered a luxury for some cultures or a
place to get together with friends in other; it can be perceived as a social interaction
(Bagozzi, Wong, Abe & Bergami, 2000; Brady, Robertson & Cronin, 2001). The trends,
fashion and lifestyles change very quickly and people have traditions as well, which
some include celebration special occasions in these types of restaurants. ―Fast Food
pervades virtually in all segments of the society including local communities, public
schools, and hospitals. These trends seem to be accompanied by massive advertising
and marketing campaigns‖ (Dave, An, Jeffery & Ahluwalia, 2009, p.1164). This shows
that the marketing communications from these companies influence in the lifestyle of
consumers, persuading their behavioral intentions (Kara, Kaynak & Kucukemiroglu,
1995). The social status perception and the influence of Fast Food Restaurants of it, will
be different in each region and culture (Axelson, 1986; Brady, Robertson & Cronin,
2001). These explanations lead us to our sixth hypothesis, which is:
H6. Perceptions of Social Status will differ significantly between countries
International Marketing Master Thesis 2013-2014 International Master in Business Administration (iMBA)
36 Christopher Schlosser
3.3.7. Facilities
The physical facilities in Fast Food Restaurants play a very important role for attracting
customers to consume in their place (Lee & Ulgado, 1997). The structure, aesthetics,
shape, size of each restaurant (Kim, 2008) are related to the segment targeted by the
company; it varies depending on the different cultures and behaviors of people of the
different countries (Sheldon & Fox, 1988). For example, in most of the countries, if they
are targeting kids, the facilities have to be attractive to them, so they can convince their
parents to take them to these places. In the inside of the restaurants, these companies
have to have an adequate technology and design in the function of the facilities;
adapting to the different cultural interpretation in order to please the customers (Kim &
Moon, 2009). According to Lee & Kim in 2014, the design, layout and comfort of the
restaurants has an important attractiveness to customers. ―Once customers enter a
facility, they often observe the interior aesthetics, which is likely to affect their attitudes
toward the facility‖ (Baker, Berry & Parasuraman, 1988, p.35). According to this
rationale, we can post it our seventh hypothesis, which is:
H7. Perceptions of physical Facilities will differ significantly between countries
3.3.8. Emotional Value
Childhood memories and good times with family and friends are some of the emotions
that can play a role in Fast Food Restaurants. These companies try to influence in
customer´s behavioral intentions by creating these moments to their targeted
consumers to motivate them (Batra, 2008; Brady, Robertson & Cronin, 2001), so they
can remember them constantly and think about it; this will make them return to
purchase. ―Emotions and attitudes are the customer´s relatively long-lasting affection
towards an object or an experience, considered a crucial component in developing
customer loyalty‖ (Sahagun & Vasquez-Parraga, 2014). The emotions are perceived
differently among the different regions in the world (Baek, Ham & Yang, 2006); some of
them have a higher influence in the purchase decisions (Chen, 2000; Beldona, Moreo &
Mundhra, 2010) than the other. These explanations lead to the eighth hypothesis:
H8. Perceptions of Emotions will differ significantly between countries

International Marketing Master Thesis 2013-2014 International Master in Business Administration (iMBA)
37 Christopher Schlosser
3.3.9. Customer Satisfaction
―In today's ever‐increasing globalization of services and brands, service‐oriented
businesses need to attend to the satisfaction of their customers both domestically and
abroad while transcending unique cultural differences from country to country.‖ (Gilbert,
Veloutsou, Goode & Moutinho, 2004, p. 371) Customers are always looking to be
pleased when they enter a Fast Food Restaurant (Baek, Ham & Yang, 2006; Kim,
2008); these companies have to rely on an excellent service quality to achieve high
customer satisfaction. Managers have to be aware of the cultural differences between
countries that could affect the perception of customers and their satisfaction towards the
products (Cheung, Murrmann, Murrmann & Becker, 2004; Gilbert, Veloutsou, Goode &
Moutinho, 2004; Brady, Robertson & Cronin, 2001; Lee & Ulgado, 1997). ―Customers
may get more satisfaction from the quick and convenient service at Fast Food
Restaurants then from the actual food purchased‖ (Sahagun & Vasquez-Parraga, 2014,
p.169). The service provided by the restaurants has a great influence in the behavior of
customers, such as the attention provided by employees that make clients feel
comfortable. When customers perceive the value dimensions mentioned above, and
they are satisfied through them, they become satisfied. These explanations lead to the
ninth hypothesis:
H9. Satisfaction in Fast Food Restaurants will differ significantly between
countries
3.3.10. Loyalty
When a Fast Food Restaurant has loyal clients, it is because they have achieved
customer satisfaction by fulfilling their expectations (Sahagun & Vasquez-Parraga,
2014). Customers that are satisfied want to keep on purchasing with the same Fast
Food Restaurant; it is gratifying for them. "Measures such as satisfaction, loyalty and
commitment have, over time, been operationalised with the purpose of enhancing
customer retention." (Terblanche, 2006, p.31). Loyalty and the behavior of customers
towards it varies among regions and cultures, managers need to keep their customers
comfortable and happy at all costs, so they have to develop different programs for
accomplishing it, taking into consideration all the regions they control (De Wulf,
International Marketing Master Thesis 2013-2014 International Master in Business Administration (iMBA)
38 Christopher Schlosser
Odekerken-Schröder & Iacobucci, 2001). Gallarza, Gil-Saura and Holbrook (2012)
developed a model that states that satisfaction leads to loyalty, including the Restaurant
business service. Repeating patronage and attitude are key elements to measure
loyalty, according to Heiens and Pleshko (2008). ―Therefore, in order to become loyal
and profitable for the company, a customer must be highly satisfied‖ (Etemad-Sajadi &
Rizzuto, 2013, p.782). Knowing this quote, it can be assumed the last hypothesis:
H10. Loyalty in Fast Food Restaurants will differ significantly between countries
International Marketing Master Thesis 2013-2014 International Master in Business Administration (iMBA)
39 Christopher Schlosser
4. Research methodology
The purpose of this study was to test the differences, according to cultural differences,
in customers‘ opinions of eight value dimensions, satisfaction and loyalty in Fast Food
Restaurants. The empirical research is composed by a qualitative and a quantitative
research. After introducing the theoretical framework, it is time now to provide primary
data by means of empirical research, both qualitative (focus group and in-depth
interview) and quantitative (on-line survey). By doing this double approach, it was
possible to understand the different points of view of people about Fast Food
Restaurants that have experience living in different countries, especially in the ones
being investigated (wide approach, but not deep); besides, it was also very important to
learn from the expert in this industry some strategies that these type of restaurants use
and their focus towards the segmentation of customers (qualitative approach: deeper
but less wider). One of the strategies that were taken from the in-depth interview was
―Not all the Quick Service Restaurant focuses their marketing strategy on the same
value dimensions. Some focus on quality only, others are pricing only. This will
automatically segregate the segments they will attract.‖ Having the qualitative approach,
it was possible to explore which perceived value dimensions customers appreciate in
order to be satisfied in this industry. To have a clear idea of each of the researches, the
following sections will explain the methodology used for each of them in order to
achieve the results.
4.1. Qualitative Research
The qualitative part was formed by one focus group (see Appendix A) that was held in
Valencia, Spain, which was formed by Spanish speaking people, and an interview that
was held with an expert on this subject via email.
4.1.1. Focus group with Fast Food consumers
For understanding the needs of customer and the Fast Food Industry, a focus group
was conducted including nine persons from Guatemala between ages of 23 and 30
years old that lived in Spain; this way they had experiences of Food Industry in both
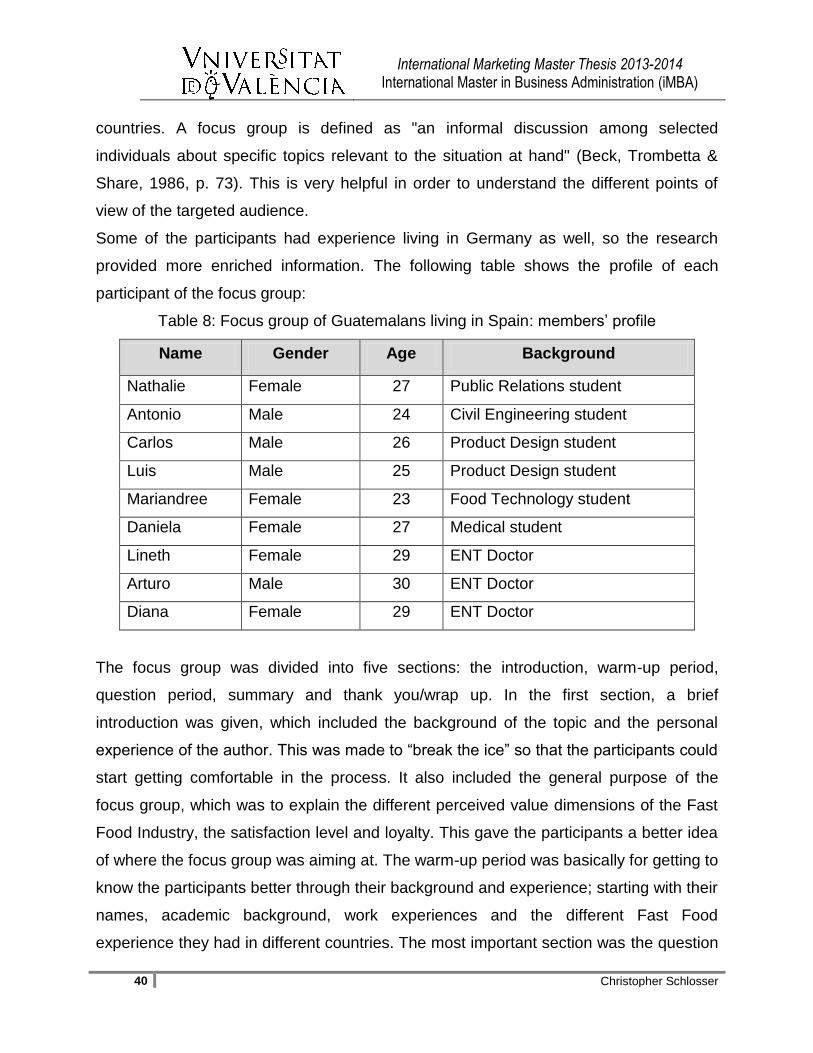
International Marketing Master Thesis 2013-2014 International Master in Business Administration (iMBA)
40 Christopher Schlosser
countries. A focus group is defined as "an informal discussion among selected
individuals about specific topics relevant to the situation at hand" (Beck, Trombetta &
Share, 1986, p. 73). This is very helpful in order to understand the different points of
view of the targeted audience.
Some of the participants had experience living in Germany as well, so the research
provided more enriched information. The following table shows the profile of each
participant of the focus group:
Table 8: Focus group of Guatemalans living in Spain: members‘ profile
Name Gender Age Background
Nathalie Female 27 Public Relations student
Antonio Male 24 Civil Engineering student
Carlos Male 26 Product Design student
Luis Male 25 Product Design student
Mariandree Female 23 Food Technology student
Daniela Female 27 Medical student
Lineth Female 29 ENT Doctor
Arturo Male 30 ENT Doctor
Diana Female 29 ENT Doctor
The focus group was divided into five sections: the introduction, warm-up period,
question period, summary and thank you/wrap up. In the first section, a brief
introduction was given, which included the background of the topic and the personal
experience of the author. This was made to ―break the ice‖ so that the participants could
start getting comfortable in the process. It also included the general purpose of the
focus group, which was to explain the different perceived value dimensions of the Fast
Food Industry, the satisfaction level and loyalty. This gave the participants a better idea
of where the focus group was aiming at. The warm-up period was basically for getting to
know the participants better through their background and experience; starting with their
names, academic background, work experiences and the different Fast Food
experience they had in different countries. The most important section was the question
International Marketing Master Thesis 2013-2014 International Master in Business Administration (iMBA)
41 Christopher Schlosser
period, which included the following seven open questions, which every participant had
to give its opinion:
Which perceived values do you think are important for customers in the Fast
Food Industry?
Do these values influence in the customer´s satisfaction?
Do you think that a satisfied customer is a loyal customer in this industry?
Does the culture affect the perceived value in customers?
Do you think customers can be loyal in the Fast Food Industry? Why, Why not?
Which is the main focus of the restaurants towards customer satisfaction?
Which value dimensions are the most important to satisfy them?
Each of the participants had to answer each question in an honest way and discuss it
with the rest of the group. Each question was provoking a discussion among the
members, in which several issues were covered. In this section the differences in Fast
Food of each country could be seen and compared within them. After this, the summary
section began with the clarification and summary of the topics discussed; the review of
the perceived value dimensions and other considerations and discussions. In this
section the participants could add comments that they forgot to mention and have a
quick feedback of the meeting. The last section was the wrap-up which included the
anonymity reminder to the participants and an appreciation speech for collaborating with
this study. The focus group was recorded with a camera and a recorder device in order
not to miss any part of the discussion. Later on, it could be listened several times to do
the transcription for analyzing the content.
The main discussion points of the focus group were led by the different perceived value
dimensions that influenced customers in the Fast Food Industry, which according to the
participants the most important were cleanness, time and efficiency, quality of the food,
customer service and service recovery and lastly price and sales promotions. For
example, it was mentioned that ―The cleanness is very important, but most of customers
do not see it in the restaurants, it is one of the values that do not matter to people,
especially in the kitchen. But normally I care most about the presentation and aesthetics

International Marketing Master Thesis 2013-2014 International Master in Business Administration (iMBA)
42 Christopher Schlosser
of the restaurants.‖ Another point of discussion was the relationship between
satisfaction and loyalty; most of the participants argued that customers can be loyal only
if they are satisfied, they also mentioned that customers can switch suppliers depending
on the price and the most important issue of loyalty in this industry is the service
recovery applied by these companies. A very important discussion between the
contributors was the relationship between culture and the perceived value dimensions in
customers, and it was argued that restaurants have to adapt their offerings to the
different cultures and countries; the globalization plays a big role in the food culture in
each country. For example, ―the culture is a major issue in the Fast Food Industry; in
India they do not eat red meat, so restaurants have to adapt to them with other offers.‖
The last point of argument was the main focus of the Fast Food Restaurants towards
customer satisfaction; in Spain it is the quality, price and advertising, while in
Guatemala it is the customer service and service recovery, price promotions and
advertising. All of these main points were useful for deciding the categories of the
questionnaire and hypotheses.
4.1.2. In depth interview with Fast Food Industry expert
Along with the focus group, an in-depth interview was held with an expert in Quick
Service Restaurants in Guatemala and Latin America (see Appendix B), to have a clear
idea of the issues that these restaurant focus to satisfy the customers. An in-depth
interview digs deeply in every question, establishing a conversation that analyzes every
subject being researched (Yanow & Schwartz-Shea, 2014). This was very important to
obtain, in order to understand a different and experiences point of view of the Fast Food
Industry.
The expert had direct contact with the environment of the Fast Food Industry in different
countries and this interview was necessary for having a clearer picture of the different
value dimensions and the strategy that companies in this market use to fulfill customer´s
needs. The expert has been working for more than 20 years in this industry and has a
lot of international experience in managing this type of restaurants. The interview
included five open questions that were the same as the ones from the focus group, in

International Marketing Master Thesis 2013-2014 International Master in Business Administration (iMBA)
43 Christopher Schlosser
order to have different points of view of the answers. The main points given by the
expert were the following (see more information on the in depth interview in Appendix
B):
For the adult market, quality is the most appreciated value that may influence
in the purchase decision and will be impressed by the service and cleanliness
of the restaurants.
Young customers will appreciate the cool places to hang out or the trends of
the youth, as well as sale promotions. Price will be high qualified by
youngsters, too.
Family groups will enjoy playgrounds, birthday party rooms, clowns, and any
kind of entertainment the industry will provide
Delivery is a key value in some markets
Local chains will focus on national / typical products
Once the customers arrive to the location, service will be a key value to watch
in order to keep the segment members coming back.
Cultural customs, including language, can be perceived as negative values in
some cases. But in other cases it affects a lot and the restaurants have to
adapt to them.
Some people who do not speak English will not like to go to a Fast Food
Restaurant with product names in English, because they do not feel
comfortable ordering these items.
Some customers are loyal, but not the main share of the market. The loyalty
will vary if the competition will offer a different or a new value, such as price
and new products.
This interview was made via email, because of the difficult schedule that the expert had.
In this case, we could collect answers from a consumer point of view (focus group) and
from the Restaurants point of view (Interview).
Having a very good idea of the different factors that influence in the Fast Food Industry,
it was time to move forward to the quantitative research, in order to prove the findings of
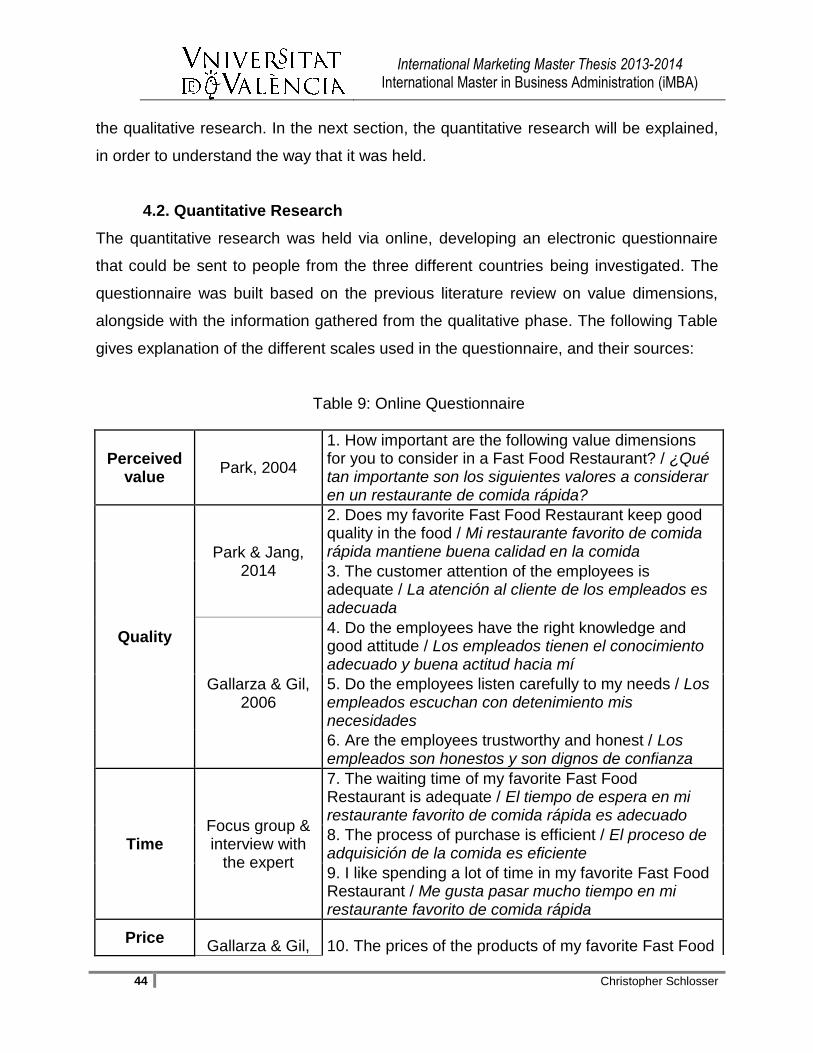
International Marketing Master Thesis 2013-2014 International Master in Business Administration (iMBA)
44 Christopher Schlosser
the qualitative research. In the next section, the quantitative research will be explained,
in order to understand the way that it was held.
4.2. Quantitative Research
The quantitative research was held via online, developing an electronic questionnaire
that could be sent to people from the three different countries being investigated. The
questionnaire was built based on the previous literature review on value dimensions,
alongside with the information gathered from the qualitative phase. The following Table
gives explanation of the different scales used in the questionnaire, and their sources:
Table 9: Online Questionnaire
Perceived value
Park, 2004
1. How important are the following value dimensions for you to consider in a Fast Food Restaurant? / ¿Qué tan importante son los siguientes valores a considerar en un restaurante de comida rápida?
Quality
Park & Jang, 2014
2. Does my favorite Fast Food Restaurant keep good quality in the food / Mi restaurante favorito de comida rápida mantiene buena calidad en la comida
3. The customer attention of the employees is adequate / La atención al cliente de los empleados es adecuada
Gallarza & Gil, 2006
4. Do the employees have the right knowledge and good attitude / Los empleados tienen el conocimiento adecuado y buena actitud hacia mí
5. Do the employees listen carefully to my needs / Los empleados escuchan con detenimiento mis necesidades
6. Are the employees trustworthy and honest / Los empleados son honestos y son dignos de confianza
Time Focus group & interview with
the expert
7. The waiting time of my favorite Fast Food Restaurant is adequate / El tiempo de espera en mi restaurante favorito de comida rápida es adecuado
8. The process of purchase is efficient / El proceso de adquisición de la comida es eficiente
9. I like spending a lot of time in my favorite Fast Food Restaurant / Me gusta pasar mucho tiempo en mi restaurante favorito de comida rápida
Price Gallarza & Gil, 10. The prices of the products of my favorite Fast Food
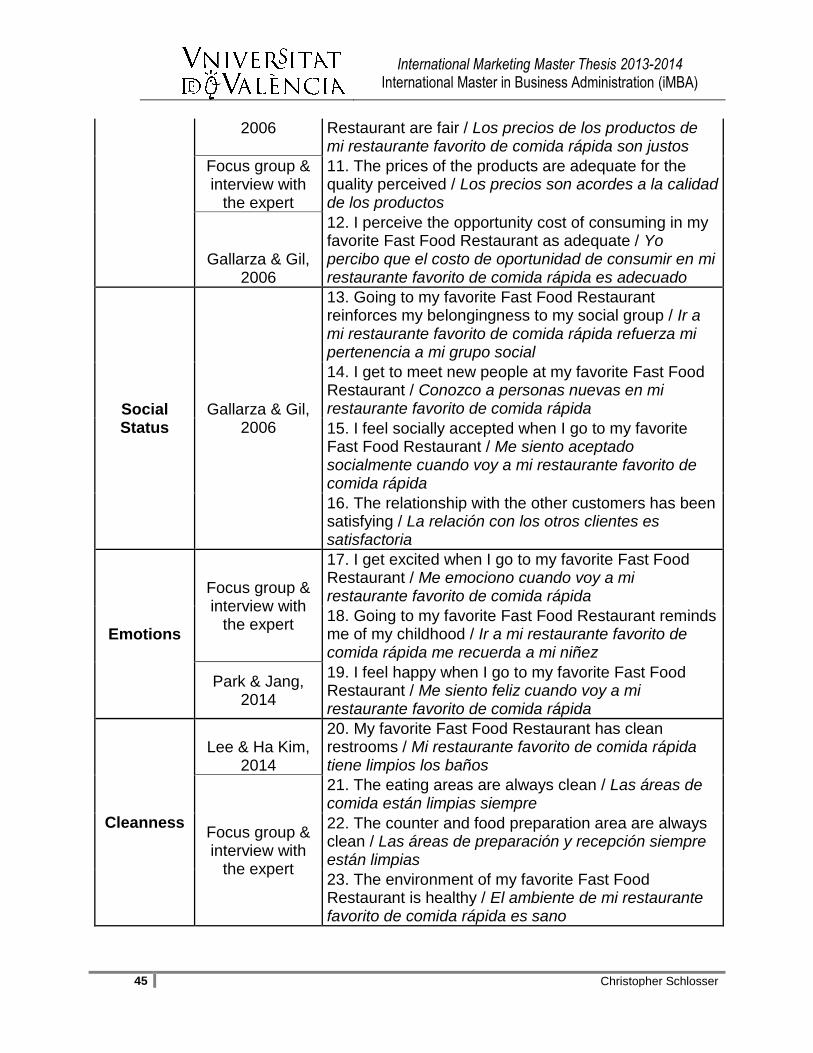
International Marketing Master Thesis 2013-2014 International Master in Business Administration (iMBA)
45 Christopher Schlosser
2006 Restaurant are fair / Los precios de los productos de mi restaurante favorito de comida rápida son justos
Focus group & interview with
the expert
11. The prices of the products are adequate for the quality perceived / Los precios son acordes a la calidad de los productos
Gallarza & Gil, 2006
12. I perceive the opportunity cost of consuming in my favorite Fast Food Restaurant as adequate / Yo percibo que el costo de oportunidad de consumir en mi restaurante favorito de comida rápida es adecuado
Social Status
Gallarza & Gil, 2006
13. Going to my favorite Fast Food Restaurant reinforces my belongingness to my social group / Ir a mi restaurante favorito de comida rápida refuerza mi pertenencia a mi grupo social
14. I get to meet new people at my favorite Fast Food Restaurant / Conozco a personas nuevas en mi restaurante favorito de comida rápida
15. I feel socially accepted when I go to my favorite Fast Food Restaurant / Me siento aceptado socialmente cuando voy a mi restaurante favorito de comida rápida
16. The relationship with the other customers has been satisfying / La relación con los otros clientes es satisfactoria
Emotions
Focus group & interview with
the expert
17. I get excited when I go to my favorite Fast Food Restaurant / Me emociono cuando voy a mi restaurante favorito de comida rápida
18. Going to my favorite Fast Food Restaurant reminds me of my childhood / Ir a mi restaurante favorito de comida rápida me recuerda a mi niñez
Park & Jang, 2014
19. I feel happy when I go to my favorite Fast Food Restaurant / Me siento feliz cuando voy a mi restaurante favorito de comida rápida
Cleanness
Lee & Ha Kim, 2014
20. My favorite Fast Food Restaurant has clean restrooms / Mi restaurante favorito de comida rápida tiene limpios los baños
Focus group & interview with
the expert
21. The eating areas are always clean / Las áreas de comida están limpias siempre
22. The counter and food preparation area are always clean / Las áreas de preparación y recepción siempre están limpias
23. The environment of my favorite Fast Food Restaurant is healthy / El ambiente de mi restaurante favorito de comida rápida es sano
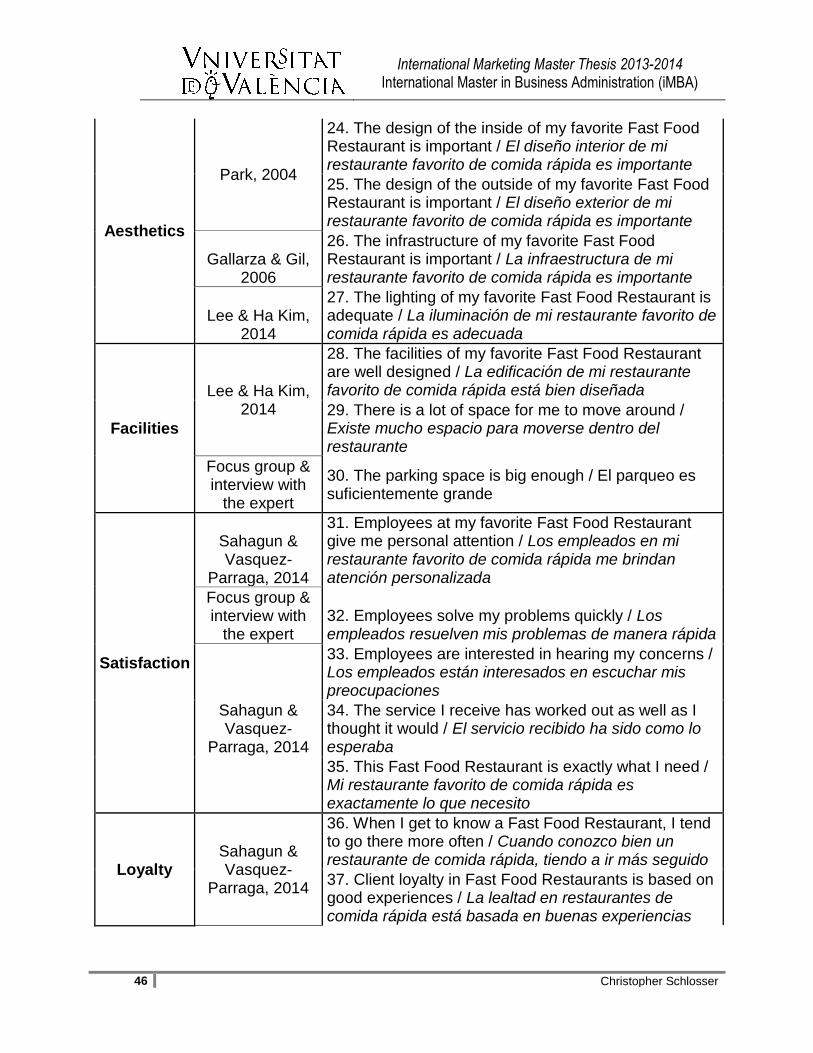
International Marketing Master Thesis 2013-2014 International Master in Business Administration (iMBA)
46 Christopher Schlosser
Aesthetics
Park, 2004
24. The design of the inside of my favorite Fast Food Restaurant is important / El diseño interior de mi restaurante favorito de comida rápida es importante
25. The design of the outside of my favorite Fast Food Restaurant is important / El diseño exterior de mi restaurante favorito de comida rápida es importante
Gallarza & Gil, 2006
26. The infrastructure of my favorite Fast Food Restaurant is important / La infraestructura de mi restaurante favorito de comida rápida es importante
Lee & Ha Kim, 2014
27. The lighting of my favorite Fast Food Restaurant is adequate / La iluminación de mi restaurante favorito de comida rápida es adecuada
Facilities
Lee & Ha Kim, 2014
28. The facilities of my favorite Fast Food Restaurant are well designed / La edificación de mi restaurante favorito de comida rápida está bien diseñada
29. There is a lot of space for me to move around / Existe mucho espacio para moverse dentro del restaurante
Focus group & interview with
the expert
30. The parking space is big enough / El parqueo es suficientemente grande
Satisfaction
Sahagun & Vasquez-
Parraga, 2014
31. Employees at my favorite Fast Food Restaurant give me personal attention / Los empleados en mi restaurante favorito de comida rápida me brindan atención personalizada
Focus group & interview with
the expert 32. Employees solve my problems quickly / Los empleados resuelven mis problemas de manera rápida
Sahagun & Vasquez-
Parraga, 2014
33. Employees are interested in hearing my concerns / Los empleados están interesados en escuchar mis preocupaciones
34. The service I receive has worked out as well as I thought it would / El servicio recibido ha sido como lo esperaba
35. This Fast Food Restaurant is exactly what I need / Mi restaurante favorito de comida rápida es exactamente lo que necesito
Loyalty Sahagun & Vasquez-
Parraga, 2014
36. When I get to know a Fast Food Restaurant, I tend to go there more often / Cuando conozco bien un restaurante de comida rápida, tiendo a ir más seguido
37. Client loyalty in Fast Food Restaurants is based on good experiences / La lealtad en restaurantes de comida rápida está basada en buenas experiencias
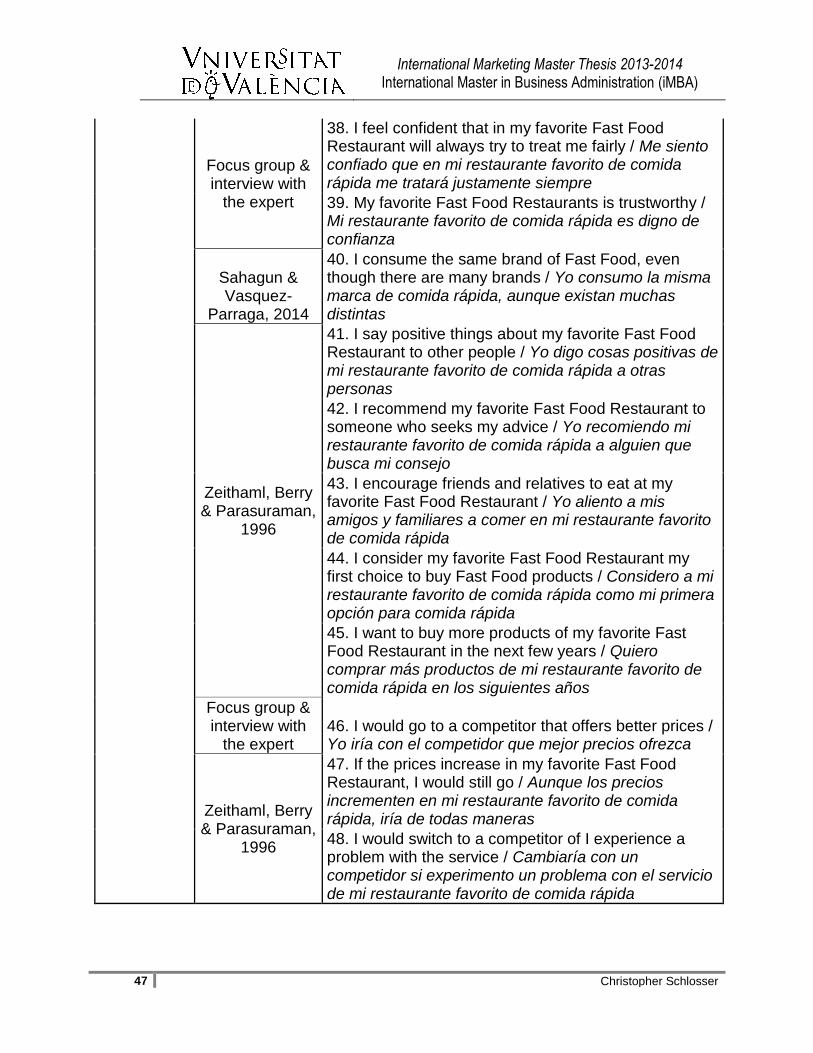
International Marketing Master Thesis 2013-2014 International Master in Business Administration (iMBA)
47 Christopher Schlosser
Focus group & interview with
the expert
38. I feel confident that in my favorite Fast Food Restaurant will always try to treat me fairly / Me siento confiado que en mi restaurante favorito de comida rápida me tratará justamente siempre
39. My favorite Fast Food Restaurants is trustworthy / Mi restaurante favorito de comida rápida es digno de confianza
Sahagun & Vasquez-
Parraga, 2014
40. I consume the same brand of Fast Food, even though there are many brands / Yo consumo la misma marca de comida rápida, aunque existan muchas distintas
Zeithaml, Berry & Parasuraman,
1996
41. I say positive things about my favorite Fast Food Restaurant to other people / Yo digo cosas positivas de mi restaurante favorito de comida rápida a otras personas
42. I recommend my favorite Fast Food Restaurant to someone who seeks my advice / Yo recomiendo mi restaurante favorito de comida rápida a alguien que busca mi consejo
43. I encourage friends and relatives to eat at my favorite Fast Food Restaurant / Yo aliento a mis amigos y familiares a comer en mi restaurante favorito de comida rápida
44. I consider my favorite Fast Food Restaurant my first choice to buy Fast Food products / Considero a mi restaurante favorito de comida rápida como mi primera opción para comida rápida
45. I want to buy more products of my favorite Fast Food Restaurant in the next few years / Quiero comprar más productos de mi restaurante favorito de comida rápida en los siguientes años
Focus group & interview with
the expert 46. I would go to a competitor that offers better prices / Yo iría con el competidor que mejor precios ofrezca
Zeithaml, Berry & Parasuraman,
1996
47. If the prices increase in my favorite Fast Food Restaurant, I would still go / Aunque los precios incrementen en mi restaurante favorito de comida rápida, iría de todas maneras
48. I would switch to a competitor of I experience a problem with the service / Cambiaría con un competidor si experimento un problema con el servicio de mi restaurante favorito de comida rápida

International Marketing Master Thesis 2013-2014 International Master in Business Administration (iMBA)
48 Christopher Schlosser
This online survey had the objective to research about the different opinion of the value
dimensions of consumers from Guatemala, Spain and Germany. It was developed
costless through ―Survey Monkey‖ and sent to a convenience sample of the different
audience from those three countries. For analyzing the data, Survey Monkey has a tool
that analyzes simple data and basic statistics that are helpful for having an idea of the
outcome of the results. For analyzing the results deeply, the computer software SPSS
was needed to crosstab and correlate data, in order to know specifically the impact of
each value dimension on the satisfaction and loyalty of Fast Food consumers in the
desired countries. The final sample size was 366, belonging respectively to Guatemala
(150 respondents and 41% of the final sample), Spain (103 respondents and 28% of the
final sample) and Germany (113 respondents and 31% of the final sample). Description
of the sample profile of the three countries is contained in the three following tables:
Table 10: Guatemalans´ Sample Profile
Age Absolute %
18-25 41 27.30%
26-30 83 55.30%
31-60 26 17.30%
Total 150 100.00%
Gender Absolute %
Male 79 52.70%
Female 71 47.30%
Total 150 100.00%
In Table 10 the reader can appreciate the different range of ages in the sample of the
questionnaire from Guatemala, which indicates that most of the participants were
between the ages of 26 and 30 years old. Then, the second range of people was
between 18 and 25 years old; this indicates that more than 80% of participants were
young (below 30 years old). It also shows that the quantity of men and women was
almost equal, having nearly half of each gender. Most of the participants of Guatemala
were contacted through social media, sending individual messages to them, so they
could participate.
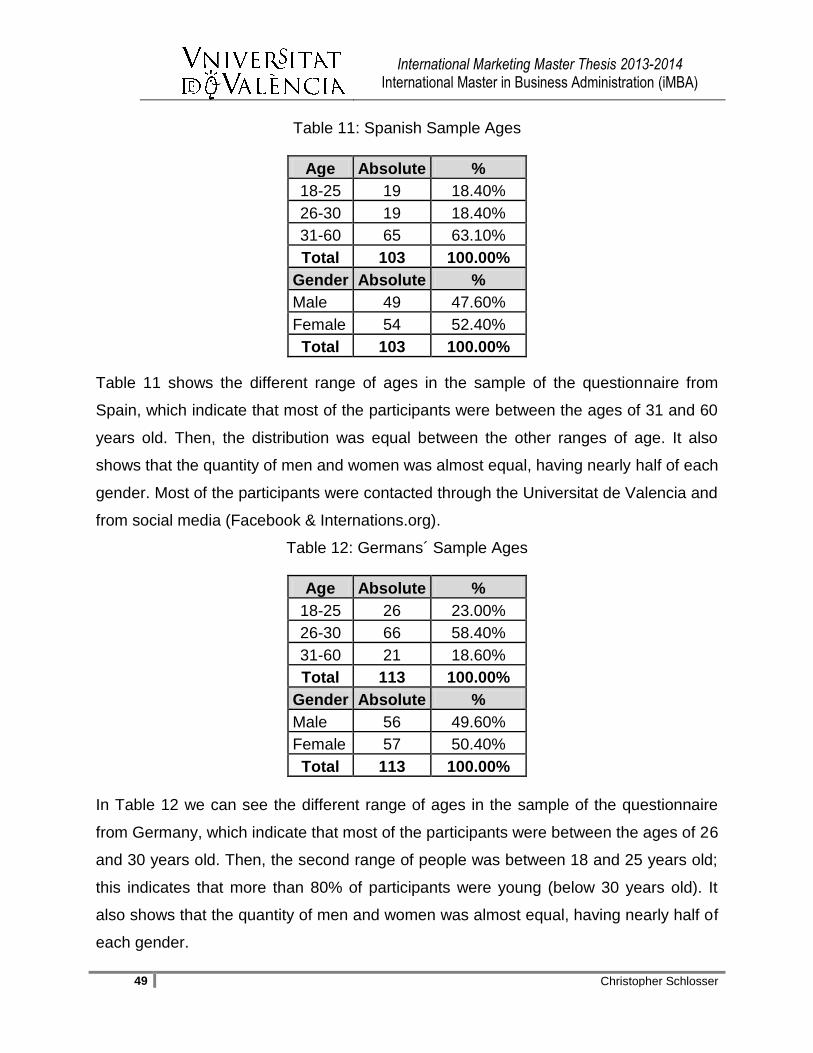
International Marketing Master Thesis 2013-2014 International Master in Business Administration (iMBA)
49 Christopher Schlosser
Table 11: Spanish Sample Ages
Age Absolute %
18-25 19 18.40%
26-30 19 18.40%
31-60 65 63.10%
Total 103 100.00%
Gender Absolute %
Male 49 47.60%
Female 54 52.40%
Total 103 100.00%
Table 11 shows the different range of ages in the sample of the questionnaire from
Spain, which indicate that most of the participants were between the ages of 31 and 60
years old. Then, the distribution was equal between the other ranges of age. It also
shows that the quantity of men and women was almost equal, having nearly half of each
gender. Most of the participants were contacted through the Universitat de Valencia and
from social media (Facebook & Internations.org).
Table 12: Germans´ Sample Ages
Age Absolute %
18-25 26 23.00%
26-30 66 58.40%
31-60 21 18.60%
Total 113 100.00%
Gender Absolute %
Male 56 49.60%
Female 57 50.40%
Total 113 100.00%
In Table 12 we can see the different range of ages in the sample of the questionnaire
from Germany, which indicate that most of the participants were between the ages of 26
and 30 years old. Then, the second range of people was between 18 and 25 years old;
this indicates that more than 80% of participants were young (below 30 years old). It
also shows that the quantity of men and women was almost equal, having nearly half of
each gender.
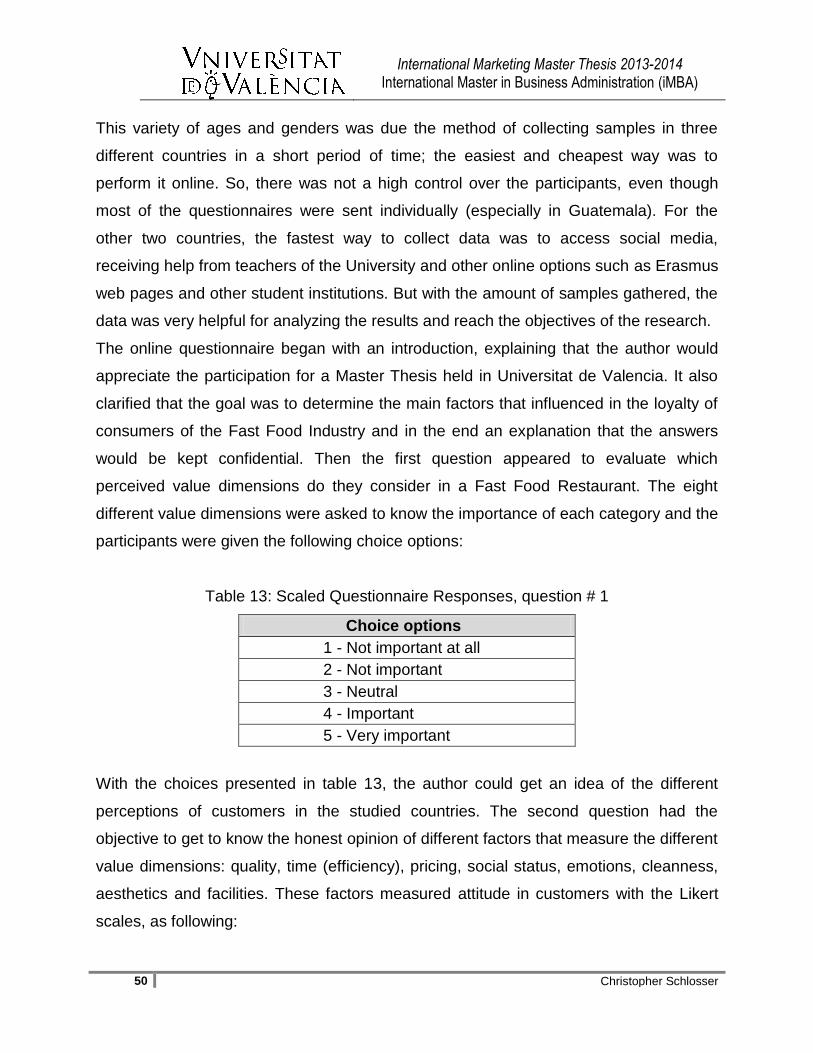
International Marketing Master Thesis 2013-2014 International Master in Business Administration (iMBA)
50 Christopher Schlosser
This variety of ages and genders was due the method of collecting samples in three
different countries in a short period of time; the easiest and cheapest way was to
perform it online. So, there was not a high control over the participants, even though
most of the questionnaires were sent individually (especially in Guatemala). For the
other two countries, the fastest way to collect data was to access social media,
receiving help from teachers of the University and other online options such as Erasmus
web pages and other student institutions. But with the amount of samples gathered, the
data was very helpful for analyzing the results and reach the objectives of the research.
The online questionnaire began with an introduction, explaining that the author would
appreciate the participation for a Master Thesis held in Universitat de Valencia. It also
clarified that the goal was to determine the main factors that influenced in the loyalty of
consumers of the Fast Food Industry and in the end an explanation that the answers
would be kept confidential. Then the first question appeared to evaluate which
perceived value dimensions do they consider in a Fast Food Restaurant. The eight
different value dimensions were asked to know the importance of each category and the
participants were given the following choice options:
Table 13: Scaled Questionnaire Responses, question # 1
Choice options
1 - Not important at all
2 - Not important
3 - Neutral
4 - Important
5 - Very important
With the choices presented in table 13, the author could get an idea of the different
perceptions of customers in the studied countries. The second question had the
objective to get to know the honest opinion of different factors that measure the different
value dimensions: quality, time (efficiency), pricing, social status, emotions, cleanness,
aesthetics and facilities. These factors measured attitude in customers with the Likert
scales, as following:
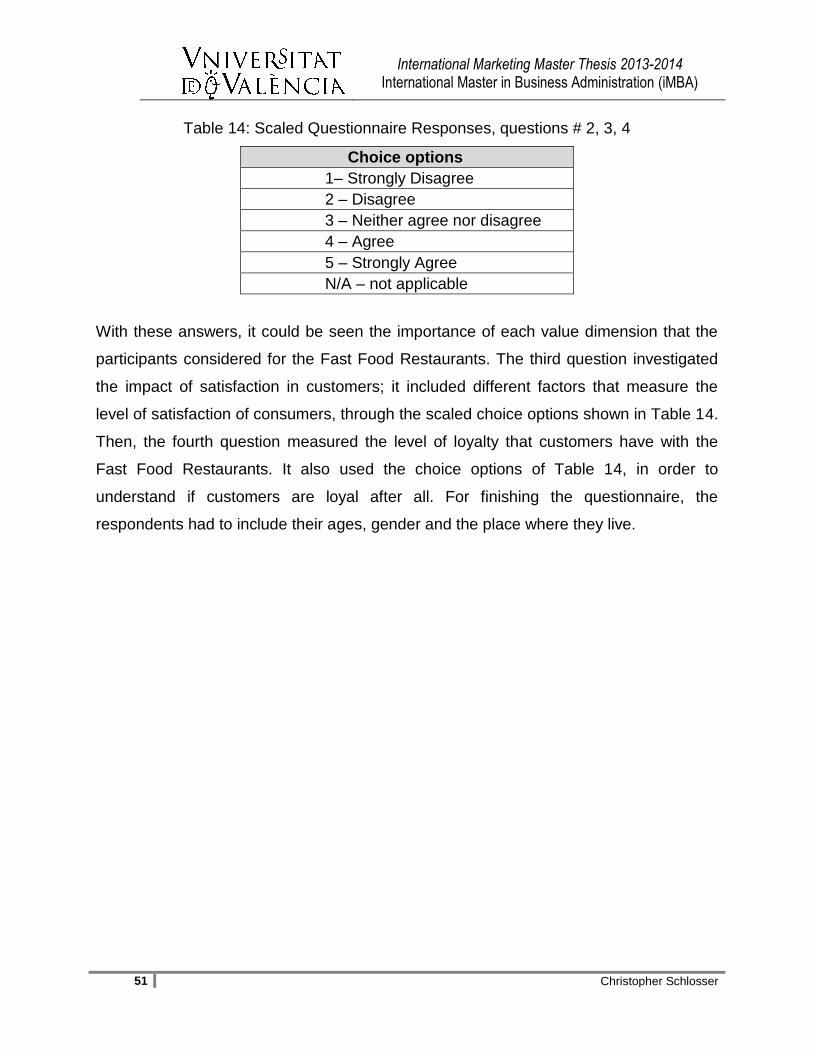
International Marketing Master Thesis 2013-2014 International Master in Business Administration (iMBA)
51 Christopher Schlosser
Table 14: Scaled Questionnaire Responses, questions # 2, 3, 4
Choice options
1– Strongly Disagree
2 – Disagree
3 – Neither agree nor disagree
4 – Agree
5 – Strongly Agree
N/A – not applicable
With these answers, it could be seen the importance of each value dimension that the
participants considered for the Fast Food Restaurants. The third question investigated
the impact of satisfaction in customers; it included different factors that measure the
level of satisfaction of consumers, through the scaled choice options shown in Table 14.
Then, the fourth question measured the level of loyalty that customers have with the
Fast Food Restaurants. It also used the choice options of Table 14, in order to
understand if customers are loyal after all. For finishing the questionnaire, the
respondents had to include their ages, gender and the place where they live.
International Marketing Master Thesis 2013-2014 International Master in Business Administration (iMBA)
52 Christopher Schlosser
5. Analysis and Results
The T-Test sample method was used for analyzing the comparisons between the three
countries, taking into account the Group Statistics and Independent Sample Test. This
method inspects the distribution of values on one variable between diverse groups or
categories, and then calculates the probability of the difference in the mean from the
sampling error. ―The T-test is a test to see if there was a statistically significant
difference between the mean scores of two groups.‖ (Fitz-Gibbon & Morris, 1987, p.41).
This method demonstrates the objectives and the validity of the hypotheses set in this
study. When the result of the significance of the equality of means is below 0.05, it
means that the value has statistically significant association (Harter & Balakrishnan,
1997). In this research, this means that if this happens, the hypothesis is accepted, but
if it is above 0.05, it is refused (at a 5% level, Similar reasoning can be applied for p
values of 0,01 (1% level) or 0,10 (10 % level)). The following tables will show the results
of each of the comparisons of the perceived value dimensions, satisfaction and loyalty
in Fast Food Restaurants between the three countries being investigated. If a table has
the majority or at least half of the categories accepted, the hypothesis is recognized as
valid. All the results of each category are going to be analyzed and a summary will be
provided at the end, in order to have a global view of the outcome.
5.1. Guatemala vs. Spain
The first countries being analyzed are Guatemala and Spain; two countries very far
away from each other, but with the same native language and some similarities in
culture and religion. In Hofstede´s classification it can be seen that Guatemalans have a
higher power distance and uncertainty avoidance in the culture than the Spanish (The
Hofstede Center, 2014). First the value dimensions are being compared between both
countries, and then the satisfaction and loyalty will be analyzed. Each of the tables will
show the mean of each country, the equality of means of the T-test and if the
hypotheses are accepted or refused. The first table displays the comparison in the value
of quality in the industry of Fast Food Restaurants:
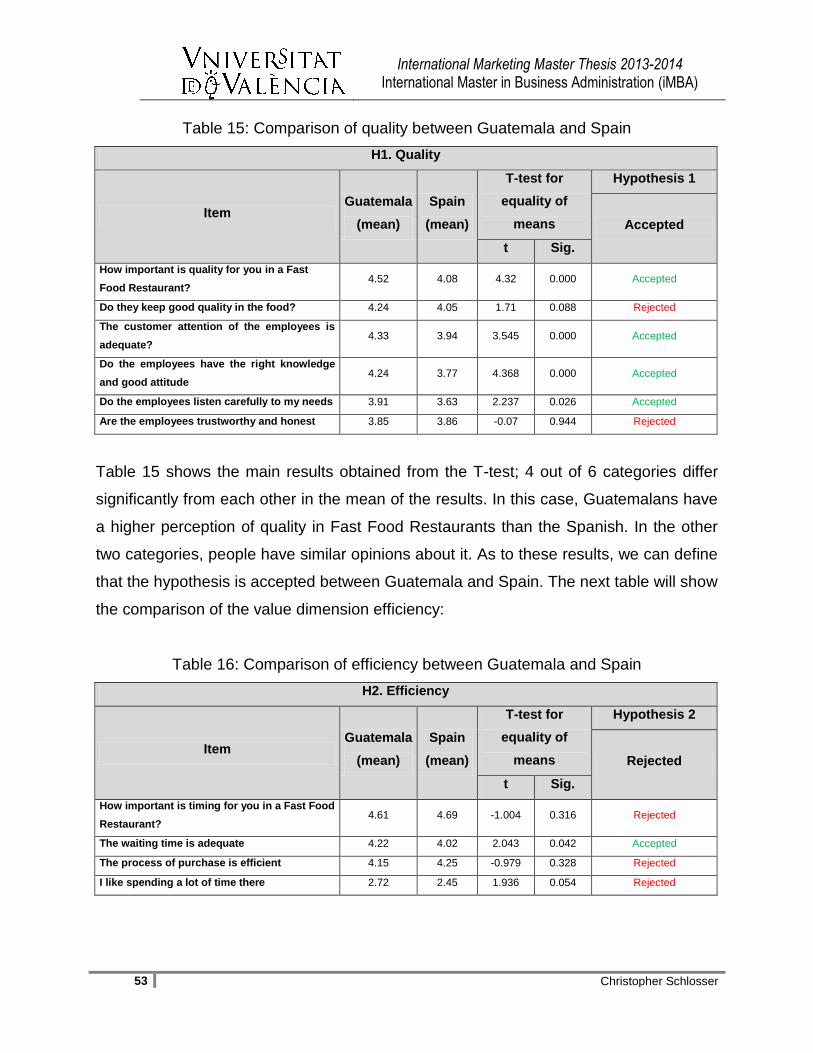
International Marketing Master Thesis 2013-2014 International Master in Business Administration (iMBA)
53 Christopher Schlosser
Table 15: Comparison of quality between Guatemala and Spain
H1. Quality
Item Guatemala
(mean)
Spain
(mean)
T-test for
equality of
means
Hypothesis 1
Accepted
t Sig.
How important is quality for you in a Fast
Food Restaurant? 4.52 4.08 4.32 0.000 Accepted
Do they keep good quality in the food? 4.24 4.05 1.71 0.088 Rejected
The customer attention of the employees is
adequate? 4.33 3.94 3.545 0.000 Accepted
Do the employees have the right knowledge
and good attitude 4.24 3.77 4.368 0.000 Accepted
Do the employees listen carefully to my needs 3.91 3.63 2.237 0.026 Accepted
Are the employees trustworthy and honest 3.85 3.86 -0.07 0.944 Rejected
Table 15 shows the main results obtained from the T-test; 4 out of 6 categories differ
significantly from each other in the mean of the results. In this case, Guatemalans have
a higher perception of quality in Fast Food Restaurants than the Spanish. In the other
two categories, people have similar opinions about it. As to these results, we can define
that the hypothesis is accepted between Guatemala and Spain. The next table will show
the comparison of the value dimension efficiency:
Table 16: Comparison of efficiency between Guatemala and Spain
H2. Efficiency
Item Guatemala
(mean)
Spain
(mean)
T-test for
equality of
means
Hypothesis 2
Rejected
t Sig.
How important is timing for you in a Fast Food
Restaurant? 4.61 4.69 -1.004 0.316 Rejected
The waiting time is adequate 4.22 4.02 2.043 0.042 Accepted
The process of purchase is efficient 4.15 4.25 -0.979 0.328 Rejected
I like spending a lot of time there 2.72 2.45 1.936 0.054 Rejected
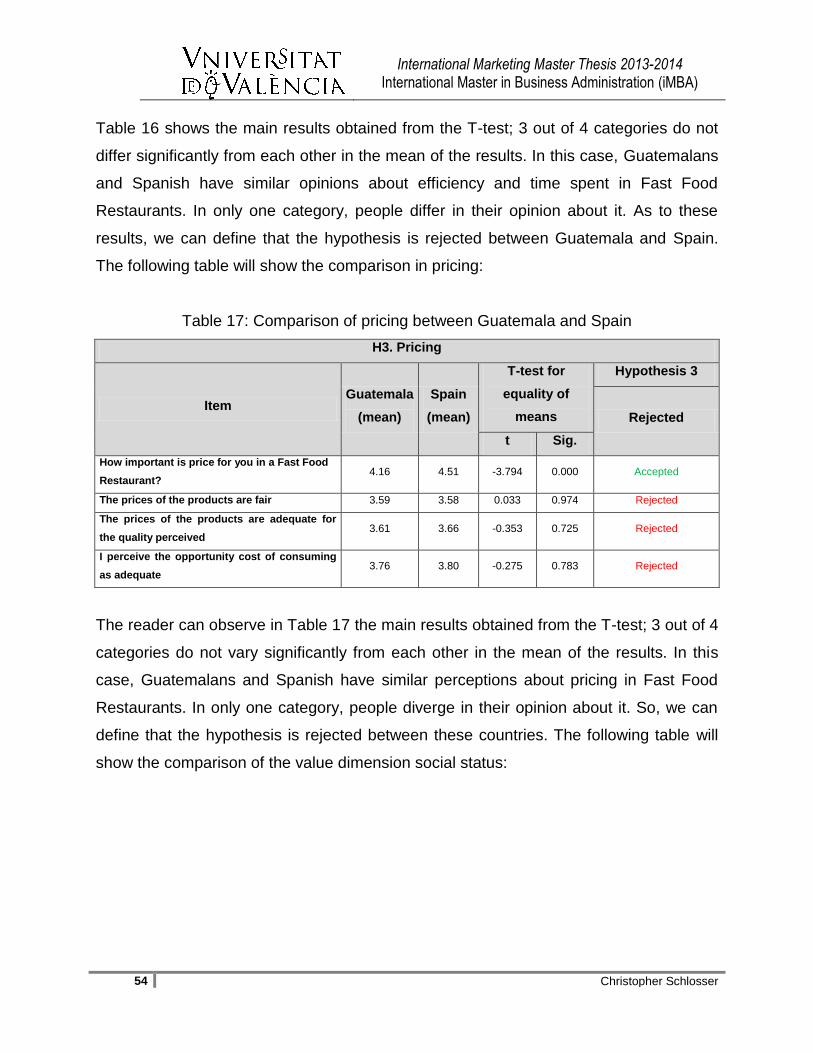
International Marketing Master Thesis 2013-2014 International Master in Business Administration (iMBA)
54 Christopher Schlosser
Table 16 shows the main results obtained from the T-test; 3 out of 4 categories do not
differ significantly from each other in the mean of the results. In this case, Guatemalans
and Spanish have similar opinions about efficiency and time spent in Fast Food
Restaurants. In only one category, people differ in their opinion about it. As to these
results, we can define that the hypothesis is rejected between Guatemala and Spain.
The following table will show the comparison in pricing:
Table 17: Comparison of pricing between Guatemala and Spain
H3. Pricing
Item Guatemala
(mean)
Spain
(mean)
T-test for
equality of
means
Hypothesis 3
Rejected
t Sig.
How important is price for you in a Fast Food
Restaurant? 4.16 4.51 -3.794 0.000 Accepted
The prices of the products are fair 3.59 3.58 0.033 0.974 Rejected
The prices of the products are adequate for
the quality perceived 3.61 3.66 -0.353 0.725 Rejected
I perceive the opportunity cost of consuming
as adequate 3.76 3.80 -0.275 0.783 Rejected
The reader can observe in Table 17 the main results obtained from the T-test; 3 out of 4
categories do not vary significantly from each other in the mean of the results. In this
case, Guatemalans and Spanish have similar perceptions about pricing in Fast Food
Restaurants. In only one category, people diverge in their opinion about it. So, we can
define that the hypothesis is rejected between these countries. The following table will
show the comparison of the value dimension social status:
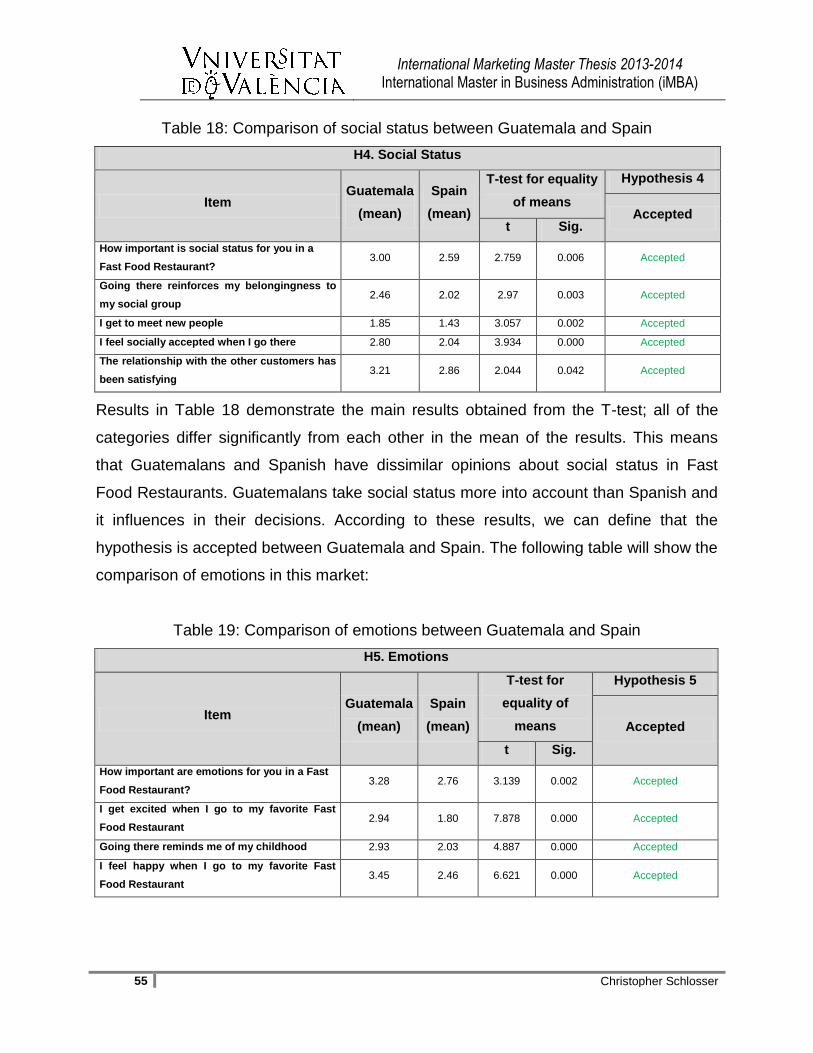
International Marketing Master Thesis 2013-2014 International Master in Business Administration (iMBA)
55 Christopher Schlosser
Table 18: Comparison of social status between Guatemala and Spain
H4. Social Status
Item Guatemala
(mean)
Spain
(mean)
T-test for equality
of means
Hypothesis 4
Accepted t Sig.
How important is social status for you in a
Fast Food Restaurant? 3.00 2.59 2.759 0.006 Accepted
Going there reinforces my belongingness to
my social group 2.46 2.02 2.97 0.003 Accepted
I get to meet new people 1.85 1.43 3.057 0.002 Accepted
I feel socially accepted when I go there 2.80 2.04 3.934 0.000 Accepted
The relationship with the other customers has
been satisfying 3.21 2.86 2.044 0.042 Accepted
Results in Table 18 demonstrate the main results obtained from the T-test; all of the
categories differ significantly from each other in the mean of the results. This means
that Guatemalans and Spanish have dissimilar opinions about social status in Fast
Food Restaurants. Guatemalans take social status more into account than Spanish and
it influences in their decisions. According to these results, we can define that the
hypothesis is accepted between Guatemala and Spain. The following table will show the
comparison of emotions in this market:
Table 19: Comparison of emotions between Guatemala and Spain
H5. Emotions
Item Guatemala
(mean)
Spain
(mean)
T-test for
equality of
means
Hypothesis 5
Accepted
t Sig.
How important are emotions for you in a Fast
Food Restaurant? 3.28 2.76 3.139 0.002 Accepted
I get excited when I go to my favorite Fast
Food Restaurant 2.94 1.80 7.878 0.000 Accepted
Going there reminds me of my childhood 2.93 2.03 4.887 0.000 Accepted
I feel happy when I go to my favorite Fast
Food Restaurant 3.45 2.46 6.621 0.000 Accepted
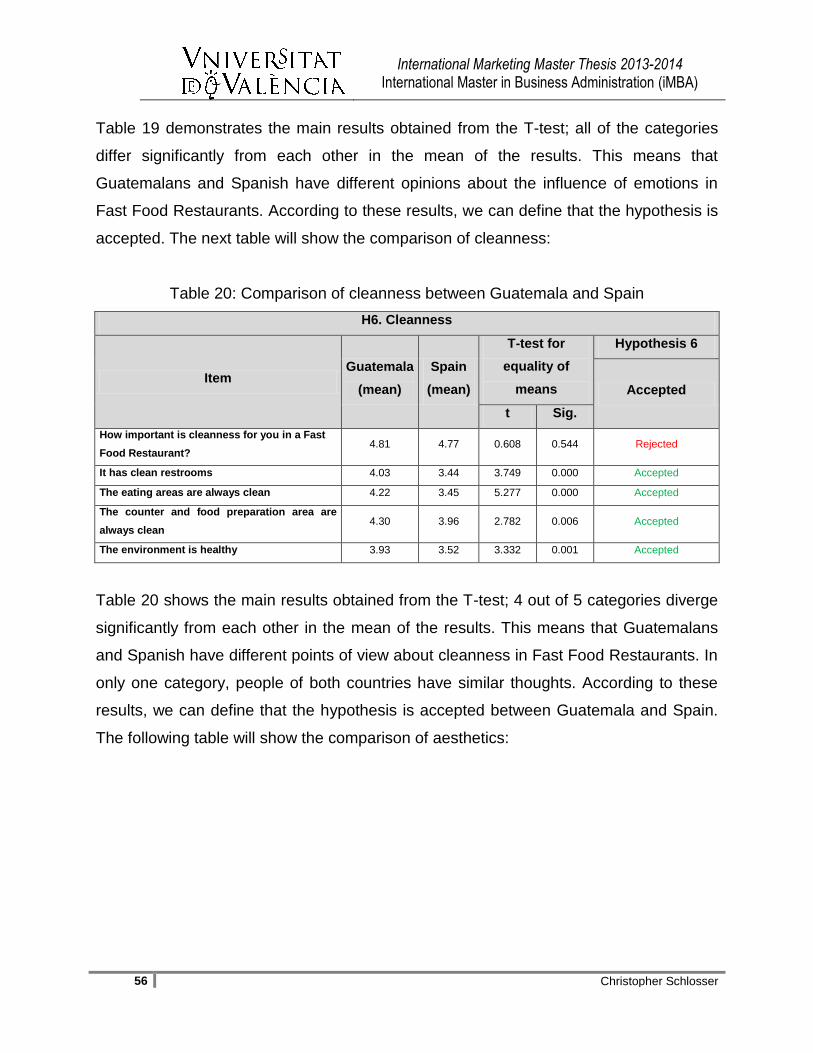
International Marketing Master Thesis 2013-2014 International Master in Business Administration (iMBA)
56 Christopher Schlosser
Table 19 demonstrates the main results obtained from the T-test; all of the categories
differ significantly from each other in the mean of the results. This means that
Guatemalans and Spanish have different opinions about the influence of emotions in
Fast Food Restaurants. According to these results, we can define that the hypothesis is
accepted. The next table will show the comparison of cleanness:
Table 20: Comparison of cleanness between Guatemala and Spain
H6. Cleanness
Item Guatemala
(mean)
Spain
(mean)
T-test for
equality of
means
Hypothesis 6
Accepted
t Sig.
How important is cleanness for you in a Fast
Food Restaurant? 4.81 4.77 0.608 0.544 Rejected
It has clean restrooms 4.03 3.44 3.749 0.000 Accepted
The eating areas are always clean 4.22 3.45 5.277 0.000 Accepted
The counter and food preparation area are
always clean 4.30 3.96 2.782 0.006 Accepted
The environment is healthy 3.93 3.52 3.332 0.001 Accepted
Table 20 shows the main results obtained from the T-test; 4 out of 5 categories diverge
significantly from each other in the mean of the results. This means that Guatemalans
and Spanish have different points of view about cleanness in Fast Food Restaurants. In
only one category, people of both countries have similar thoughts. According to these
results, we can define that the hypothesis is accepted between Guatemala and Spain.
The following table will show the comparison of aesthetics:

International Marketing Master Thesis 2013-2014 International Master in Business Administration (iMBA)
57 Christopher Schlosser
Table 21: Comparison of aesthetics between Guatemala and Spain
H7. Aesthetics
Item Guatemala
(mean)
Spain
(mean)
T-test for
equality of
means
Hypothesis 7
Rejected
t Sig.
How important is aesthetics for you in a Fast
Food Restaurant? 4.01 3.66 2.828 0.005 Accepted
The design of the inside is important 3.83 3.95 -1.051 0.294 Rejected
The design of the outside is important 3.74 3.87 -1.111 0.268 Rejected
The infrastructure is important 3.86 3.89 -0.276 0.783 Rejected
The lighting is adequate 3.97 3.96 0.053 0.958 Rejected
Table 21 demonstrates the outcome obtained from the T-test; 4 out of 5 categories do
not vary significantly from each other in the mean of the results. This means that
Guatemalans and Spanish have similar attitudes towards aesthetics in Fast Food
Restaurants. In only one category, people of both countries have different opinions
about it. This means that the hypothesis is rejected between these countries. The
following table will show the comparison of facilities:
Table 22: Comparison of facilities between Guatemala and Spain
H8. Facilities
Item Guatemala
(mean)
Spain
(mean)
T-test for
equality of
means
Hypothesis 8
Rejected
t Sig.
How important are the facilities for you in a
Fast Food Restaurant? 3.87 3.81 0.477 0.634 Rejected
The facilities are well designed 3.85 3.84 0.077 0.938 Rejected
There is a lot of space for me to move around 3.71 3.03 5.348 0.000 Accepted
The parking space is big enough 3.69 3.43 1.67 0.096 Rejected
Table 22 illustrates the key results obtained from the T-test; 3 out of 4 categories do not
fluctuate significantly from each other in the mean of the results. This means that
Guatemalans and Spanish have related attitudes towards the facilities in Fast Food
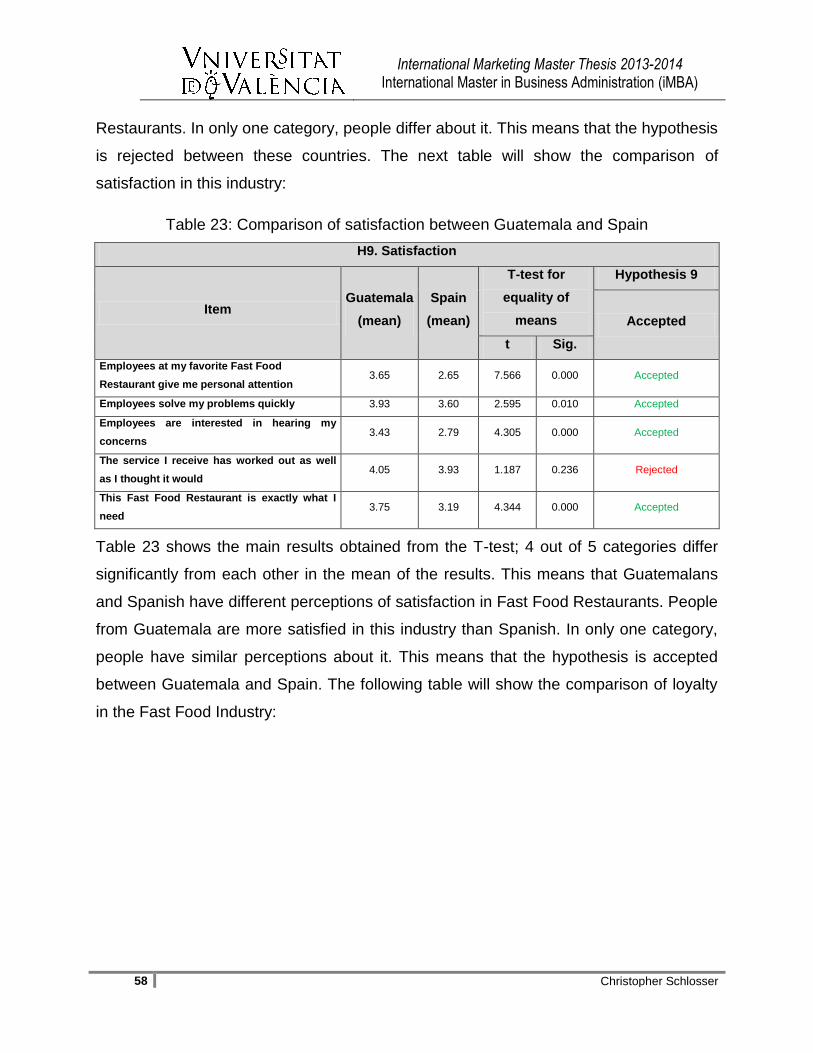
International Marketing Master Thesis 2013-2014 International Master in Business Administration (iMBA)
58 Christopher Schlosser
Restaurants. In only one category, people differ about it. This means that the hypothesis
is rejected between these countries. The next table will show the comparison of
satisfaction in this industry:
Table 23: Comparison of satisfaction between Guatemala and Spain
H9. Satisfaction
Item Guatemala
(mean)
Spain
(mean)
T-test for
equality of
means
Hypothesis 9
Accepted
t Sig.
Employees at my favorite Fast Food
Restaurant give me personal attention 3.65 2.65 7.566 0.000 Accepted
Employees solve my problems quickly 3.93 3.60 2.595 0.010 Accepted
Employees are interested in hearing my
concerns 3.43 2.79 4.305 0.000 Accepted
The service I receive has worked out as well
as I thought it would 4.05 3.93 1.187 0.236 Rejected
This Fast Food Restaurant is exactly what I
need 3.75 3.19 4.344 0.000 Accepted
Table 23 shows the main results obtained from the T-test; 4 out of 5 categories differ
significantly from each other in the mean of the results. This means that Guatemalans
and Spanish have different perceptions of satisfaction in Fast Food Restaurants. People
from Guatemala are more satisfied in this industry than Spanish. In only one category,
people have similar perceptions about it. This means that the hypothesis is accepted
between Guatemala and Spain. The following table will show the comparison of loyalty
in the Fast Food Industry:
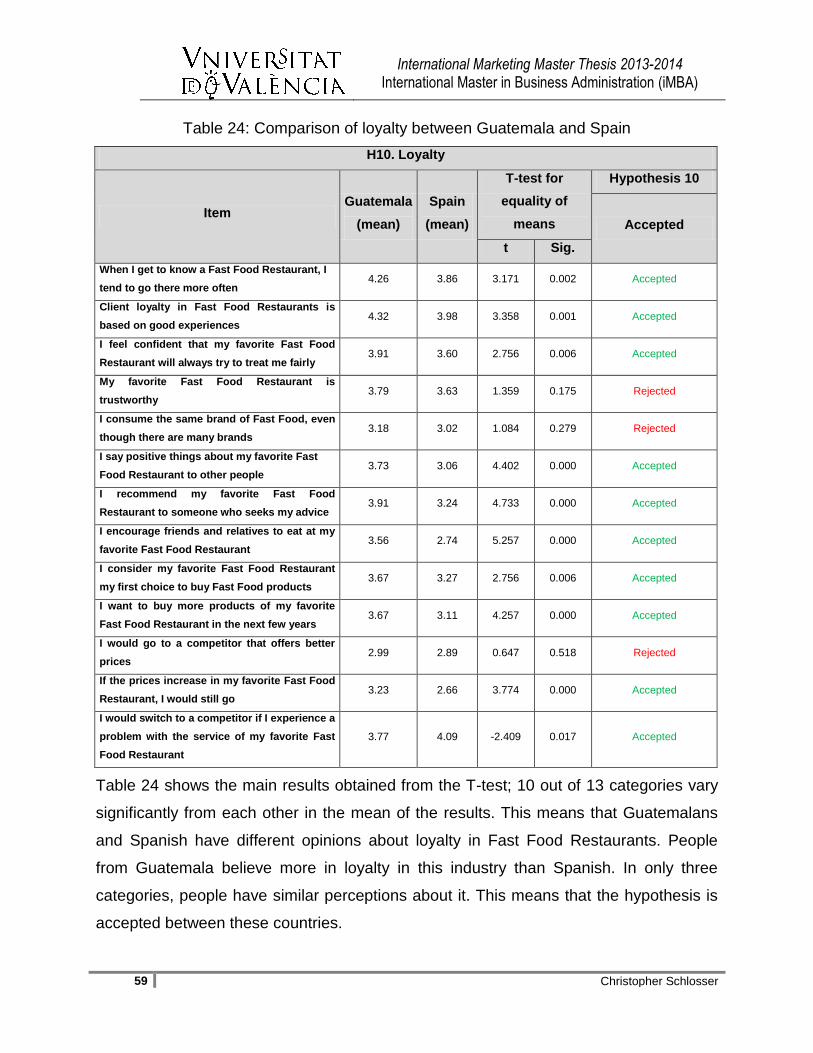
International Marketing Master Thesis 2013-2014 International Master in Business Administration (iMBA)
59 Christopher Schlosser
Table 24: Comparison of loyalty between Guatemala and Spain
H10. Loyalty
Item Guatemala
(mean)
Spain
(mean)
T-test for
equality of
means
Hypothesis 10
Accepted
t Sig.
When I get to know a Fast Food Restaurant, I
tend to go there more often 4.26 3.86 3.171 0.002 Accepted
Client loyalty in Fast Food Restaurants is
based on good experiences 4.32 3.98 3.358 0.001 Accepted
I feel confident that my favorite Fast Food
Restaurant will always try to treat me fairly 3.91 3.60 2.756 0.006 Accepted
My favorite Fast Food Restaurant is
trustworthy 3.79 3.63 1.359 0.175 Rejected
I consume the same brand of Fast Food, even
though there are many brands 3.18 3.02 1.084 0.279 Rejected
I say positive things about my favorite Fast
Food Restaurant to other people 3.73 3.06 4.402 0.000 Accepted
I recommend my favorite Fast Food
Restaurant to someone who seeks my advice 3.91 3.24 4.733 0.000 Accepted
I encourage friends and relatives to eat at my
favorite Fast Food Restaurant 3.56 2.74 5.257 0.000 Accepted
I consider my favorite Fast Food Restaurant
my first choice to buy Fast Food products 3.67 3.27 2.756 0.006 Accepted
I want to buy more products of my favorite
Fast Food Restaurant in the next few years 3.67 3.11 4.257 0.000 Accepted
I would go to a competitor that offers better
prices 2.99 2.89 0.647 0.518 Rejected
If the prices increase in my favorite Fast Food
Restaurant, I would still go 3.23 2.66 3.774 0.000 Accepted
I would switch to a competitor if I experience a
problem with the service of my favorite Fast
Food Restaurant
3.77 4.09 -2.409 0.017 Accepted
Table 24 shows the main results obtained from the T-test; 10 out of 13 categories vary
significantly from each other in the mean of the results. This means that Guatemalans
and Spanish have different opinions about loyalty in Fast Food Restaurants. People
from Guatemala believe more in loyalty in this industry than Spanish. In only three
categories, people have similar perceptions about it. This means that the hypothesis is
accepted between these countries.
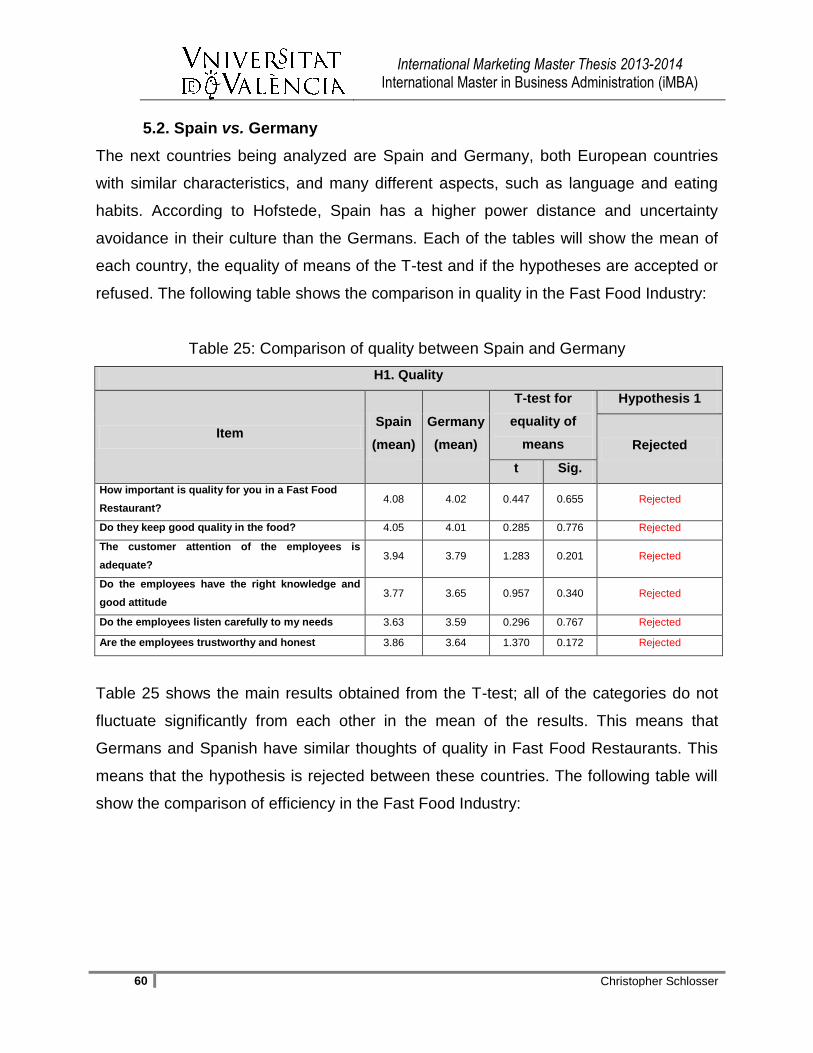
International Marketing Master Thesis 2013-2014 International Master in Business Administration (iMBA)
60 Christopher Schlosser
5.2. Spain vs. Germany
The next countries being analyzed are Spain and Germany, both European countries
with similar characteristics, and many different aspects, such as language and eating
habits. According to Hofstede, Spain has a higher power distance and uncertainty
avoidance in their culture than the Germans. Each of the tables will show the mean of
each country, the equality of means of the T-test and if the hypotheses are accepted or
refused. The following table shows the comparison in quality in the Fast Food Industry:
Table 25: Comparison of quality between Spain and Germany
H1. Quality
Item Spain
(mean)
Germany
(mean)
T-test for
equality of
means
Hypothesis 1
Rejected
t Sig.
How important is quality for you in a Fast Food
Restaurant? 4.08 4.02 0.447 0.655 Rejected
Do they keep good quality in the food? 4.05 4.01 0.285 0.776 Rejected
The customer attention of the employees is
adequate? 3.94 3.79 1.283 0.201 Rejected
Do the employees have the right knowledge and
good attitude 3.77 3.65 0.957 0.340 Rejected
Do the employees listen carefully to my needs 3.63 3.59 0.296 0.767 Rejected
Are the employees trustworthy and honest 3.86 3.64 1.370 0.172 Rejected
Table 25 shows the main results obtained from the T-test; all of the categories do not
fluctuate significantly from each other in the mean of the results. This means that
Germans and Spanish have similar thoughts of quality in Fast Food Restaurants. This
means that the hypothesis is rejected between these countries. The following table will
show the comparison of efficiency in the Fast Food Industry:
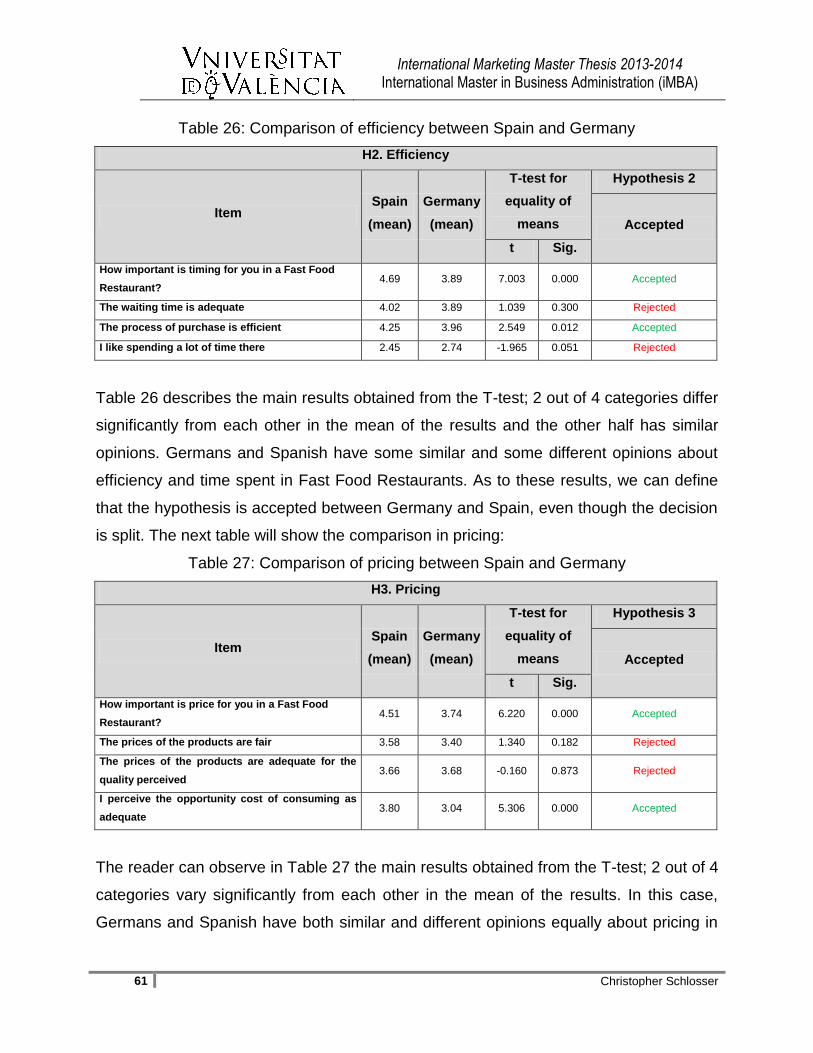
International Marketing Master Thesis 2013-2014 International Master in Business Administration (iMBA)
61 Christopher Schlosser
Table 26: Comparison of efficiency between Spain and Germany
H2. Efficiency
Item Spain
(mean)
Germany
(mean)
T-test for
equality of
means
Hypothesis 2
Accepted
t Sig.
How important is timing for you in a Fast Food
Restaurant? 4.69 3.89 7.003 0.000 Accepted
The waiting time is adequate 4.02 3.89 1.039 0.300 Rejected
The process of purchase is efficient 4.25 3.96 2.549 0.012 Accepted
I like spending a lot of time there 2.45 2.74 -1.965 0.051 Rejected
Table 26 describes the main results obtained from the T-test; 2 out of 4 categories differ
significantly from each other in the mean of the results and the other half has similar
opinions. Germans and Spanish have some similar and some different opinions about
efficiency and time spent in Fast Food Restaurants. As to these results, we can define
that the hypothesis is accepted between Germany and Spain, even though the decision
is split. The next table will show the comparison in pricing:
Table 27: Comparison of pricing between Spain and Germany
H3. Pricing
Item Spain
(mean)
Germany
(mean)
T-test for
equality of
means
Hypothesis 3
Accepted
t Sig.
How important is price for you in a Fast Food
Restaurant? 4.51 3.74 6.220 0.000 Accepted
The prices of the products are fair 3.58 3.40 1.340 0.182 Rejected
The prices of the products are adequate for the
quality perceived 3.66 3.68 -0.160 0.873 Rejected
I perceive the opportunity cost of consuming as
adequate 3.80 3.04 5.306 0.000 Accepted
The reader can observe in Table 27 the main results obtained from the T-test; 2 out of 4
categories vary significantly from each other in the mean of the results. In this case,
Germans and Spanish have both similar and different opinions equally about pricing in
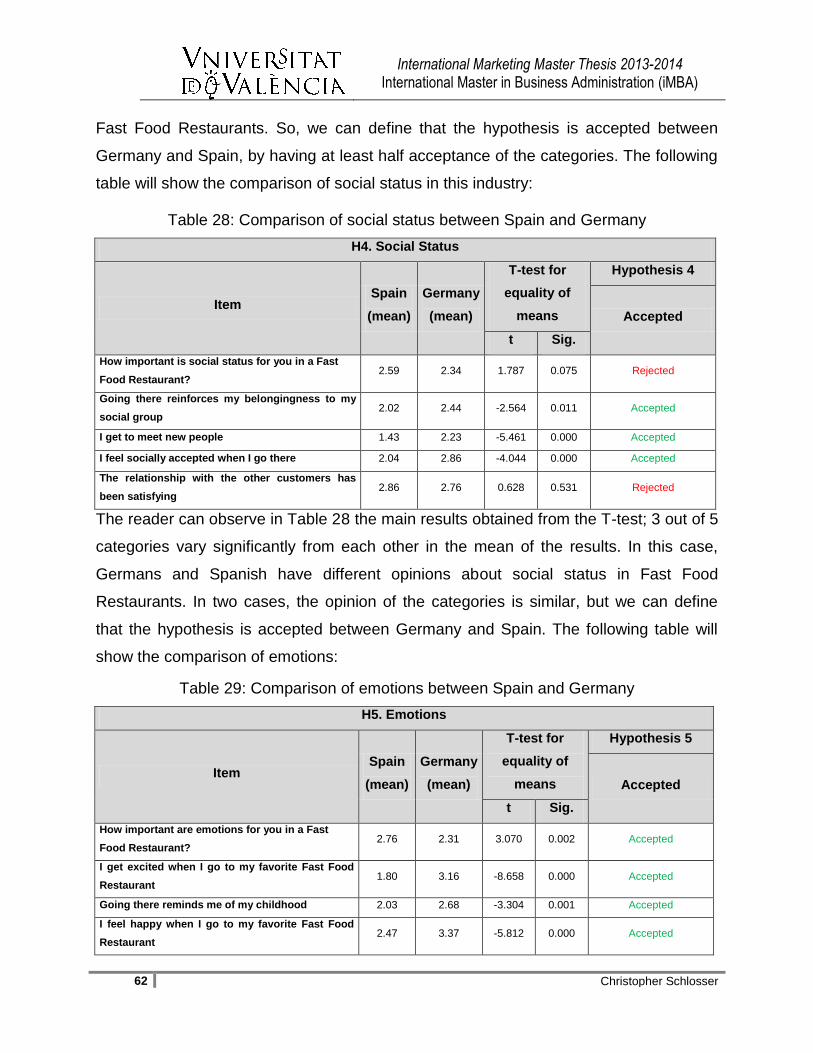
International Marketing Master Thesis 2013-2014 International Master in Business Administration (iMBA)
62 Christopher Schlosser
Fast Food Restaurants. So, we can define that the hypothesis is accepted between
Germany and Spain, by having at least half acceptance of the categories. The following
table will show the comparison of social status in this industry:
Table 28: Comparison of social status between Spain and Germany
H4. Social Status
Item Spain
(mean)
Germany
(mean)
T-test for
equality of
means
Hypothesis 4
Accepted
t Sig.
How important is social status for you in a Fast
Food Restaurant? 2.59 2.34 1.787 0.075 Rejected
Going there reinforces my belongingness to my
social group 2.02 2.44 -2.564 0.011 Accepted
I get to meet new people 1.43 2.23 -5.461 0.000 Accepted
I feel socially accepted when I go there 2.04 2.86 -4.044 0.000 Accepted
The relationship with the other customers has
been satisfying 2.86 2.76 0.628 0.531 Rejected
The reader can observe in Table 28 the main results obtained from the T-test; 3 out of 5
categories vary significantly from each other in the mean of the results. In this case,
Germans and Spanish have different opinions about social status in Fast Food
Restaurants. In two cases, the opinion of the categories is similar, but we can define
that the hypothesis is accepted between Germany and Spain. The following table will
show the comparison of emotions:
Table 29: Comparison of emotions between Spain and Germany
H5. Emotions
Item Spain
(mean)
Germany
(mean)
T-test for
equality of
means
Hypothesis 5
Accepted
t Sig.
How important are emotions for you in a Fast
Food Restaurant? 2.76 2.31 3.070 0.002 Accepted
I get excited when I go to my favorite Fast Food
Restaurant 1.80 3.16 -8.658 0.000 Accepted
Going there reminds me of my childhood 2.03 2.68 -3.304 0.001 Accepted
I feel happy when I go to my favorite Fast Food
Restaurant 2.47 3.37 -5.812 0.000 Accepted
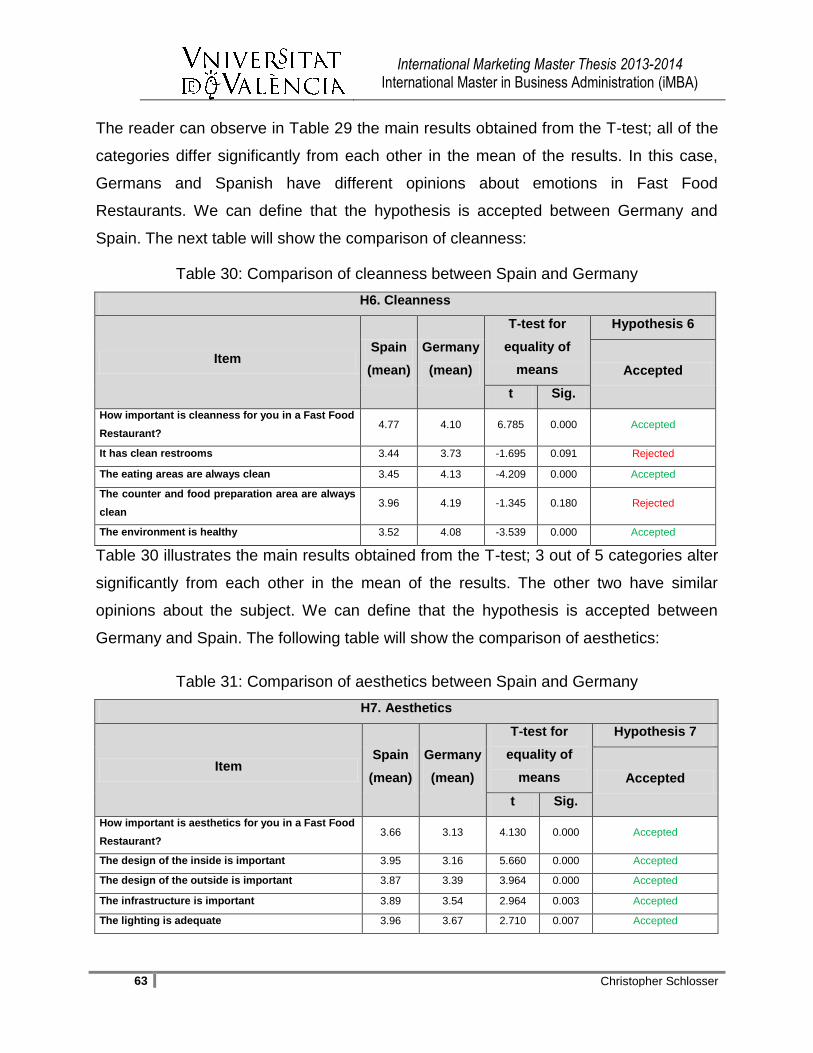
International Marketing Master Thesis 2013-2014 International Master in Business Administration (iMBA)
63 Christopher Schlosser
The reader can observe in Table 29 the main results obtained from the T-test; all of the
categories differ significantly from each other in the mean of the results. In this case,
Germans and Spanish have different opinions about emotions in Fast Food
Restaurants. We can define that the hypothesis is accepted between Germany and
Spain. The next table will show the comparison of cleanness:
Table 30: Comparison of cleanness between Spain and Germany
H6. Cleanness
Item Spain
(mean)
Germany
(mean)
T-test for
equality of
means
Hypothesis 6
Accepted
t Sig.
How important is cleanness for you in a Fast Food
Restaurant? 4.77 4.10 6.785 0.000 Accepted
It has clean restrooms 3.44 3.73 -1.695 0.091 Rejected
The eating areas are always clean 3.45 4.13 -4.209 0.000 Accepted
The counter and food preparation area are always
clean 3.96 4.19 -1.345 0.180 Rejected
The environment is healthy 3.52 4.08 -3.539 0.000 Accepted
Table 30 illustrates the main results obtained from the T-test; 3 out of 5 categories alter
significantly from each other in the mean of the results. The other two have similar
opinions about the subject. We can define that the hypothesis is accepted between
Germany and Spain. The following table will show the comparison of aesthetics:
Table 31: Comparison of aesthetics between Spain and Germany
H7. Aesthetics
Item Spain
(mean)
Germany
(mean)
T-test for
equality of
means
Hypothesis 7
Accepted
t Sig.
How important is aesthetics for you in a Fast Food
Restaurant? 3.66 3.13 4.130 0.000 Accepted
The design of the inside is important 3.95 3.16 5.660 0.000 Accepted
The design of the outside is important 3.87 3.39 3.964 0.000 Accepted
The infrastructure is important 3.89 3.54 2.964 0.003 Accepted
The lighting is adequate 3.96 3.67 2.710 0.007 Accepted
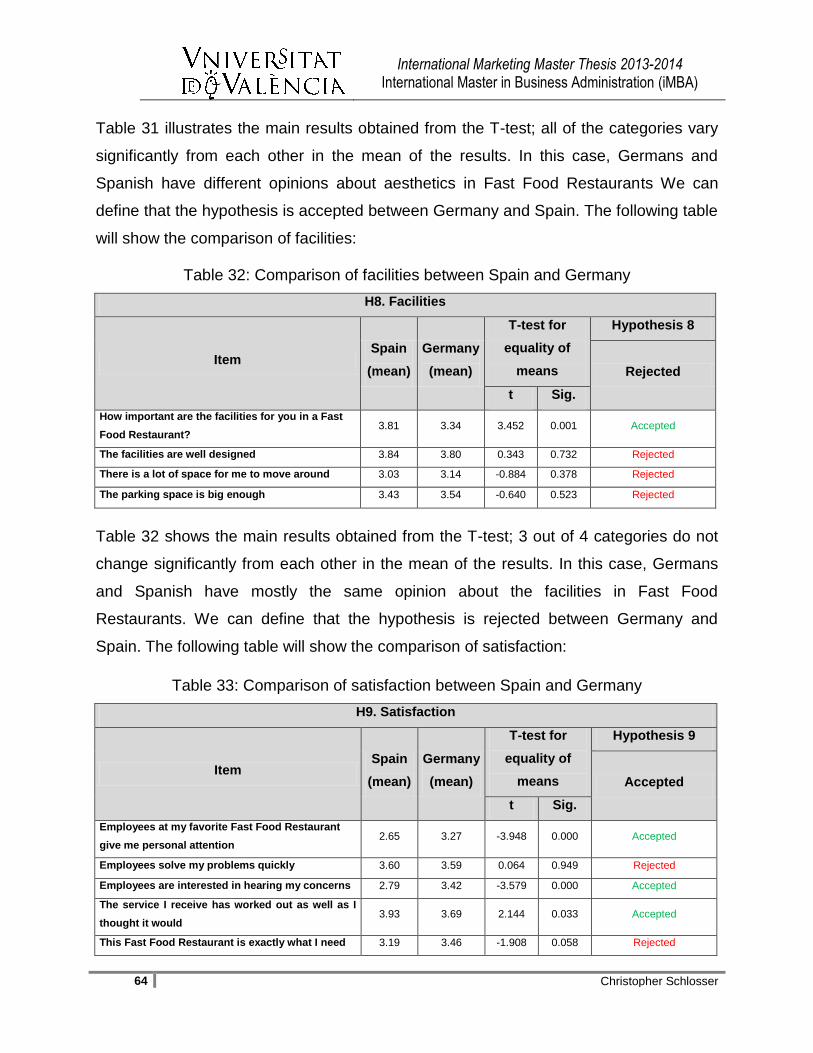
International Marketing Master Thesis 2013-2014 International Master in Business Administration (iMBA)
64 Christopher Schlosser
Table 31 illustrates the main results obtained from the T-test; all of the categories vary
significantly from each other in the mean of the results. In this case, Germans and
Spanish have different opinions about aesthetics in Fast Food Restaurants We can
define that the hypothesis is accepted between Germany and Spain. The following table
will show the comparison of facilities:
Table 32: Comparison of facilities between Spain and Germany
H8. Facilities
Item Spain
(mean)
Germany
(mean)
T-test for
equality of
means
Hypothesis 8
Rejected
t Sig.
How important are the facilities for you in a Fast
Food Restaurant? 3.81 3.34 3.452 0.001 Accepted
The facilities are well designed 3.84 3.80 0.343 0.732 Rejected
There is a lot of space for me to move around 3.03 3.14 -0.884 0.378 Rejected
The parking space is big enough 3.43 3.54 -0.640 0.523 Rejected
Table 32 shows the main results obtained from the T-test; 3 out of 4 categories do not
change significantly from each other in the mean of the results. In this case, Germans
and Spanish have mostly the same opinion about the facilities in Fast Food
Restaurants. We can define that the hypothesis is rejected between Germany and
Spain. The following table will show the comparison of satisfaction:
Table 33: Comparison of satisfaction between Spain and Germany
H9. Satisfaction
Item Spain
(mean)
Germany
(mean)
T-test for
equality of
means
Hypothesis 9
Accepted
t Sig.
Employees at my favorite Fast Food Restaurant
give me personal attention 2.65 3.27 -3.948 0.000 Accepted
Employees solve my problems quickly 3.60 3.59 0.064 0.949 Rejected
Employees are interested in hearing my concerns 2.79 3.42 -3.579 0.000 Accepted
The service I receive has worked out as well as I
thought it would 3.93 3.69 2.144 0.033 Accepted
This Fast Food Restaurant is exactly what I need 3.19 3.46 -1.908 0.058 Rejected
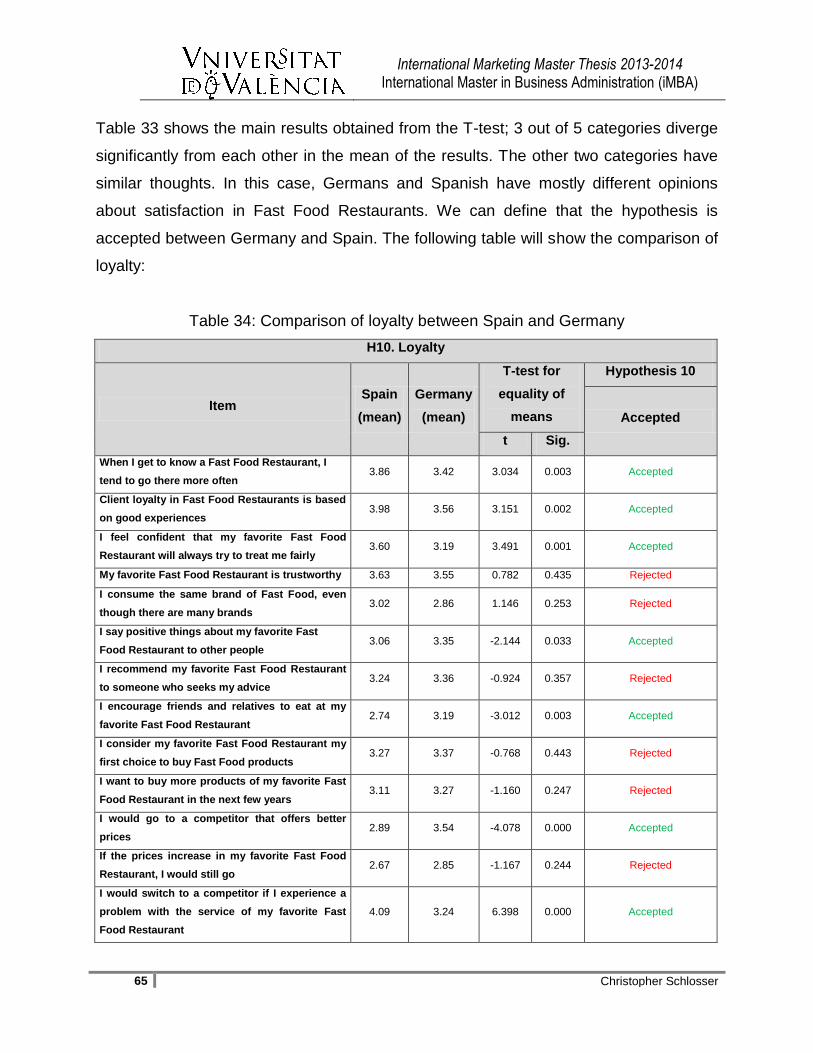
International Marketing Master Thesis 2013-2014 International Master in Business Administration (iMBA)
65 Christopher Schlosser
Table 33 shows the main results obtained from the T-test; 3 out of 5 categories diverge
significantly from each other in the mean of the results. The other two categories have
similar thoughts. In this case, Germans and Spanish have mostly different opinions
about satisfaction in Fast Food Restaurants. We can define that the hypothesis is
accepted between Germany and Spain. The following table will show the comparison of
loyalty:
Table 34: Comparison of loyalty between Spain and Germany
H10. Loyalty
Item Spain
(mean)
Germany
(mean)
T-test for
equality of
means
Hypothesis 10
Accepted
t Sig.
When I get to know a Fast Food Restaurant, I
tend to go there more often 3.86 3.42 3.034 0.003 Accepted
Client loyalty in Fast Food Restaurants is based
on good experiences 3.98 3.56 3.151 0.002 Accepted
I feel confident that my favorite Fast Food
Restaurant will always try to treat me fairly 3.60 3.19 3.491 0.001 Accepted
My favorite Fast Food Restaurant is trustworthy 3.63 3.55 0.782 0.435 Rejected
I consume the same brand of Fast Food, even
though there are many brands 3.02 2.86 1.146 0.253 Rejected
I say positive things about my favorite Fast
Food Restaurant to other people 3.06 3.35 -2.144 0.033 Accepted
I recommend my favorite Fast Food Restaurant
to someone who seeks my advice 3.24 3.36 -0.924 0.357 Rejected
I encourage friends and relatives to eat at my
favorite Fast Food Restaurant 2.74 3.19 -3.012 0.003 Accepted
I consider my favorite Fast Food Restaurant my
first choice to buy Fast Food products 3.27 3.37 -0.768 0.443 Rejected
I want to buy more products of my favorite Fast
Food Restaurant in the next few years 3.11 3.27 -1.160 0.247 Rejected
I would go to a competitor that offers better
prices 2.89 3.54 -4.078 0.000 Accepted
If the prices increase in my favorite Fast Food
Restaurant, I would still go 2.67 2.85 -1.167 0.244 Rejected
I would switch to a competitor if I experience a
problem with the service of my favorite Fast
Food Restaurant
4.09 3.24 6.398 0.000 Accepted
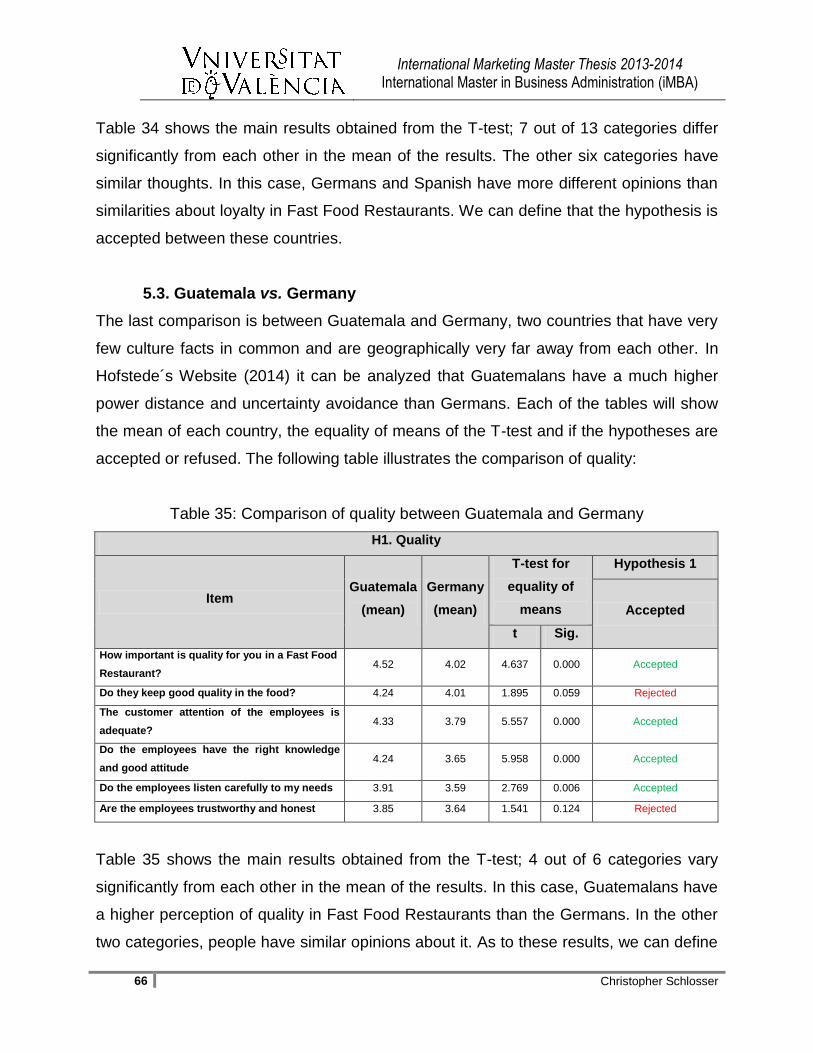
International Marketing Master Thesis 2013-2014 International Master in Business Administration (iMBA)
66 Christopher Schlosser
Table 34 shows the main results obtained from the T-test; 7 out of 13 categories differ
significantly from each other in the mean of the results. The other six categories have
similar thoughts. In this case, Germans and Spanish have more different opinions than
similarities about loyalty in Fast Food Restaurants. We can define that the hypothesis is
accepted between these countries.
5.3. Guatemala vs. Germany
The last comparison is between Guatemala and Germany, two countries that have very
few culture facts in common and are geographically very far away from each other. In
Hofstede´s Website (2014) it can be analyzed that Guatemalans have a much higher
power distance and uncertainty avoidance than Germans. Each of the tables will show
the mean of each country, the equality of means of the T-test and if the hypotheses are
accepted or refused. The following table illustrates the comparison of quality:
Table 35: Comparison of quality between Guatemala and Germany
H1. Quality
Item Guatemala
(mean)
Germany
(mean)
T-test for
equality of
means
Hypothesis 1
Accepted
t Sig.
How important is quality for you in a Fast Food
Restaurant? 4.52 4.02 4.637 0.000 Accepted
Do they keep good quality in the food? 4.24 4.01 1.895 0.059 Rejected
The customer attention of the employees is
adequate? 4.33 3.79 5.557 0.000 Accepted
Do the employees have the right knowledge
and good attitude 4.24 3.65 5.958 0.000 Accepted
Do the employees listen carefully to my needs 3.91 3.59 2.769 0.006 Accepted
Are the employees trustworthy and honest 3.85 3.64 1.541 0.124 Rejected
Table 35 shows the main results obtained from the T-test; 4 out of 6 categories vary
significantly from each other in the mean of the results. In this case, Guatemalans have
a higher perception of quality in Fast Food Restaurants than the Germans. In the other
two categories, people have similar opinions about it. As to these results, we can define
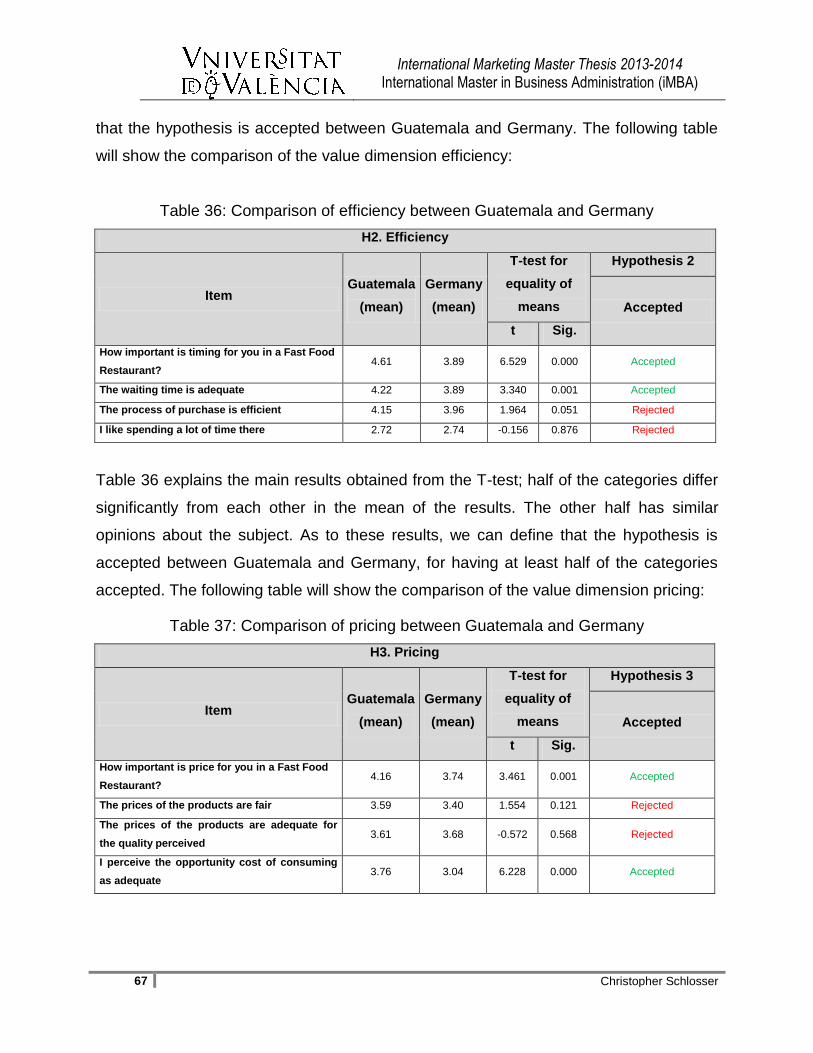
International Marketing Master Thesis 2013-2014 International Master in Business Administration (iMBA)
67 Christopher Schlosser
that the hypothesis is accepted between Guatemala and Germany. The following table
will show the comparison of the value dimension efficiency:
Table 36: Comparison of efficiency between Guatemala and Germany
H2. Efficiency
Item Guatemala
(mean)
Germany
(mean)
T-test for
equality of
means
Hypothesis 2
Accepted
t Sig.
How important is timing for you in a Fast Food
Restaurant? 4.61 3.89 6.529 0.000 Accepted
The waiting time is adequate 4.22 3.89 3.340 0.001 Accepted
The process of purchase is efficient 4.15 3.96 1.964 0.051 Rejected
I like spending a lot of time there 2.72 2.74 -0.156 0.876 Rejected
Table 36 explains the main results obtained from the T-test; half of the categories differ
significantly from each other in the mean of the results. The other half has similar
opinions about the subject. As to these results, we can define that the hypothesis is
accepted between Guatemala and Germany, for having at least half of the categories
accepted. The following table will show the comparison of the value dimension pricing:
Table 37: Comparison of pricing between Guatemala and Germany
H3. Pricing
Item Guatemala
(mean)
Germany
(mean)
T-test for
equality of
means
Hypothesis 3
Accepted
t Sig.
How important is price for you in a Fast Food
Restaurant? 4.16 3.74 3.461 0.001 Accepted
The prices of the products are fair 3.59 3.40 1.554 0.121 Rejected
The prices of the products are adequate for
the quality perceived 3.61 3.68 -0.572 0.568 Rejected
I perceive the opportunity cost of consuming
as adequate 3.76 3.04 6.228 0.000 Accepted
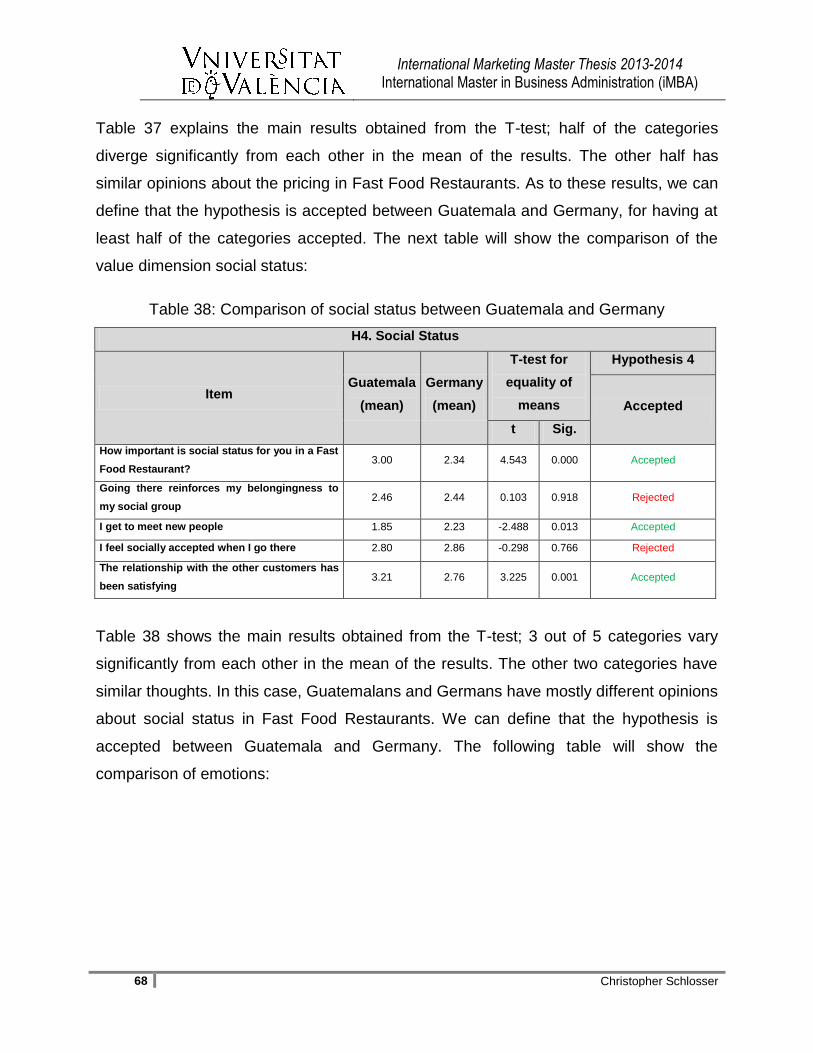
International Marketing Master Thesis 2013-2014 International Master in Business Administration (iMBA)
68 Christopher Schlosser
Table 37 explains the main results obtained from the T-test; half of the categories
diverge significantly from each other in the mean of the results. The other half has
similar opinions about the pricing in Fast Food Restaurants. As to these results, we can
define that the hypothesis is accepted between Guatemala and Germany, for having at
least half of the categories accepted. The next table will show the comparison of the
value dimension social status:
Table 38: Comparison of social status between Guatemala and Germany
H4. Social Status
Item Guatemala
(mean)
Germany
(mean)
T-test for
equality of
means
Hypothesis 4
Accepted
t Sig.
How important is social status for you in a Fast
Food Restaurant? 3.00 2.34 4.543 0.000 Accepted
Going there reinforces my belongingness to
my social group 2.46 2.44 0.103 0.918 Rejected
I get to meet new people 1.85 2.23 -2.488 0.013 Accepted
I feel socially accepted when I go there 2.80 2.86 -0.298 0.766 Rejected
The relationship with the other customers has
been satisfying 3.21 2.76 3.225 0.001 Accepted
Table 38 shows the main results obtained from the T-test; 3 out of 5 categories vary
significantly from each other in the mean of the results. The other two categories have
similar thoughts. In this case, Guatemalans and Germans have mostly different opinions
about social status in Fast Food Restaurants. We can define that the hypothesis is
accepted between Guatemala and Germany. The following table will show the
comparison of emotions:

International Marketing Master Thesis 2013-2014 International Master in Business Administration (iMBA)
69 Christopher Schlosser
Table 39: Comparison of emotions between Guatemala and Germany
H5. Emotions
Item Guatemala
(mean)
Germany
(mean)
T-test for
equality of
means
Hypothesis 5
Rejected
t Sig.
How important are emotions for you in a Fast
Food Restaurant? 3.28 2.31 6.353 0.000 Accepted
I get excited when I go to my favorite Fast
Food Restaurant 2.94 3.16 -1.430 0.154 Rejected
Going there reminds me of my childhood 2.93 2.68 1.281 0.201 Rejected
I feel happy when I go to my favorite Fast
Food Restaurant 3.45 3.37 0.576 0.566 Rejected
Table 39 shows the main results obtained from the T-test; 3 out of 4 categories do not
vary significantly from each other in the mean of the results. In this case, Germans and
Guatemalans have mostly the same opinion about emotions in Fast Food Restaurants.
We can define that the hypothesis is rejected between Germany and Guatemala. The
next table will show the comparison of cleanness:
Table 40: Comparison of cleanness between Guatemala and Germany
H6. Cleanness
Item Guatemala
(mean)
Germany
(mean)
T-test for
equality of
means
Hypothesis 6
Rejected
t Sig.
How important is cleanness for you in a Fast
Food Restaurant? 4.81 4.10 7.418 0.000 Accepted
It has clean restrooms 4.03 3.73 2.080 0.039 Accepted
The eating areas are always clean 4.22 4.13 0.742 0.459 Rejected
The counter and food preparation area are
always clean 4.30 4.19 0.795 0.457 Rejected
The environment is healthy 3.93 4.08 -1.104 0.271 Rejected
Table 40 shows the main results obtained from the T-test; 3 out of 5 categories do not
differ significantly from each other in the mean of the results. The other two categories

International Marketing Master Thesis 2013-2014 International Master in Business Administration (iMBA)
70 Christopher Schlosser
have different opinions. In this case, Guatemalans and Germans have mostly the same
perception about cleanness in Fast Food Restaurants. We can define that the
hypothesis is rejected between Guatemala and Germany. The following table will show
the comparison of aesthetics:
Table 41: Comparison of aesthetics between Guatemala and Germany
H7. Aesthetics
Item Guatemala
(mean)
Germany
(mean)
T-test for
equality of
means
Hypothesis 7
Accepted
t Sig.
How important is aesthetics for you in a Fast
Food Restaurant? 4.01 3.13 6.583 0.000 Accepted
The design of the inside is important 3.83 3.16 5.360 0.000 Accepted
The design of the outside is important 3.74 3.39 3.013 0.003 Accepted
The infrastructure is important 3.86 3.54 2.838 0.005 Accepted
The lighting is adequate 3.97 3.67 3.160 0.002 Accepted
Table 41 illustrates the main results obtained from the T-test; all of the categories alter
significantly from each other in the mean of the results. In this case, Germans and
Guatemalans have different opinions about aesthetics in Fast Food Restaurants. We
can define that the hypothesis is accepted between Germany and Guatemala. The next
table will show the comparison of facilities:
Table 42: Comparison of facilities between Guatemala and Germany
H8. Facilities
Item Guatemala
(mean)
Germany
(mean)
T-test for
equality of
means
Hypothesis 8
Accepted
t Sig.
How important are the facilities for you in a
Fast Food Restaurant? 3.87 3.34 4.151 0.000 Accepted
The facilities are well designed 3.85 3.80 0.496 0.620 Rejected
There is a lot of space for me to move around 3.71 3.14 5.096 0.000 Accepted
The parking space is big enough 3.69 3.54 1.061 0.290 Rejected
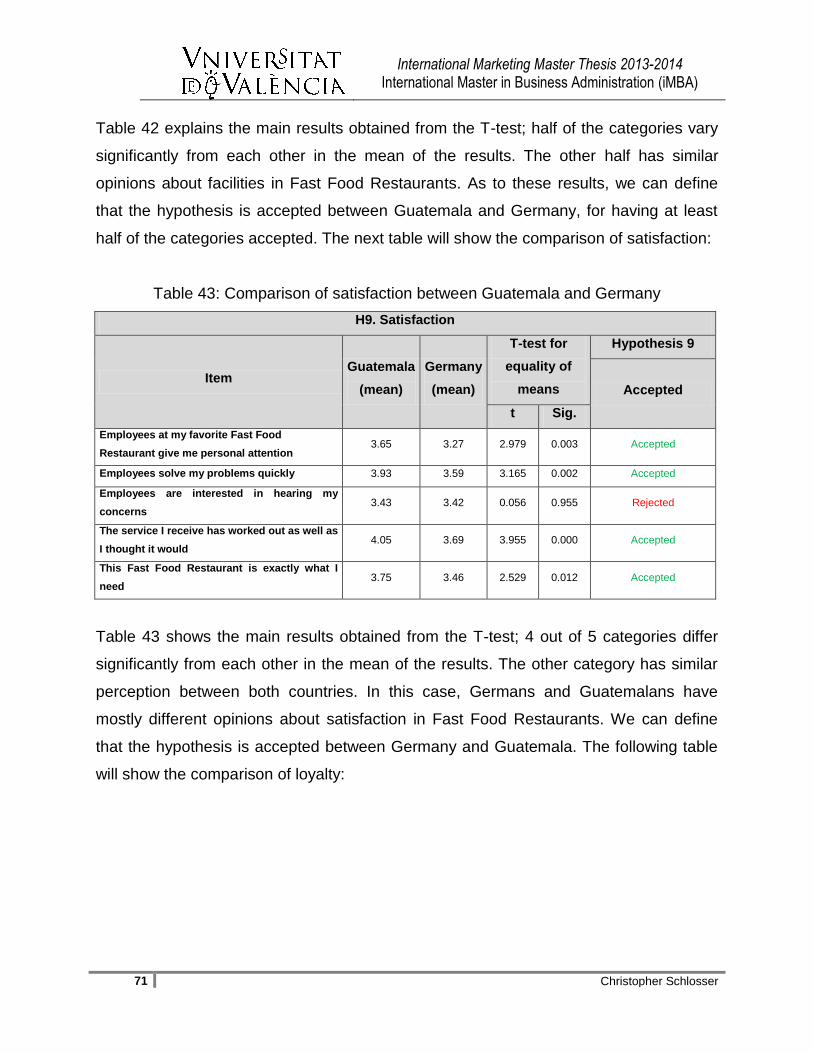
International Marketing Master Thesis 2013-2014 International Master in Business Administration (iMBA)
71 Christopher Schlosser
Table 42 explains the main results obtained from the T-test; half of the categories vary
significantly from each other in the mean of the results. The other half has similar
opinions about facilities in Fast Food Restaurants. As to these results, we can define
that the hypothesis is accepted between Guatemala and Germany, for having at least
half of the categories accepted. The next table will show the comparison of satisfaction:
Table 43: Comparison of satisfaction between Guatemala and Germany
H9. Satisfaction
Item Guatemala
(mean)
Germany
(mean)
T-test for
equality of
means
Hypothesis 9
Accepted
t Sig.
Employees at my favorite Fast Food
Restaurant give me personal attention 3.65 3.27 2.979 0.003 Accepted
Employees solve my problems quickly 3.93 3.59 3.165 0.002 Accepted
Employees are interested in hearing my
concerns 3.43 3.42 0.056 0.955 Rejected
The service I receive has worked out as well as
I thought it would 4.05 3.69 3.955 0.000 Accepted
This Fast Food Restaurant is exactly what I
need 3.75 3.46 2.529 0.012 Accepted
Table 43 shows the main results obtained from the T-test; 4 out of 5 categories differ
significantly from each other in the mean of the results. The other category has similar
perception between both countries. In this case, Germans and Guatemalans have
mostly different opinions about satisfaction in Fast Food Restaurants. We can define
that the hypothesis is accepted between Germany and Guatemala. The following table
will show the comparison of loyalty:

International Marketing Master Thesis 2013-2014 International Master in Business Administration (iMBA)
72 Christopher Schlosser
Table 44: Comparison of loyalty between Guatemala and Germany
H10. Loyalty
Item Guatemala
(mean)
Germany
(mean)
T-test for
equality of
means
Hypothesis10
Accepted
t Sig.
When I get to know a Fast Food Restaurant,
I tend to go there more often 4.26 3.42 7.033 0.000 Accepted
Client loyalty in Fast Food Restaurants is
based on good experiences 4.32 3.56 6.324 0.000 Accepted
I feel confident that my favorite Fast Food
Restaurant will always try to treat me fairly 3.91 3.19 7.011 0.000 Accepted
My favorite Fast Food Restaurant is
trustworthy 3.79 3.55 2.323 0.021 Accepted
I consume the same brand of Fast Food,
even though there are many brands 3.18 2.86 2.332 0.020 Accepted
I say positive things about my favorite Fast
Food Restaurant to other people 3.73 3.35 2.840 0.005 Accepted
I recommend my favorite Fast Food
Restaurant to someone who seeks my
advice
3.91 3.36 4.351 0.000 Accepted
I encourage friends and relatives to eat at
my favorite Fast Food restaurant 3.56 3.19 2.721 0.007 Accepted
I consider my favorite Fast Food Restaurant
my first choice to buy Fast Food products 3.67 3.37 2.411 0.017 Accepted
I want to buy more products of my favorite
Fast Food Restaurant in the next few years 3.67 3.27 3.243 0.001 Accepted
I would go to a competitor that offers better
prices 2.99 3.54 -3.884 0.000 Accepted
If the prices increase in my favorite Fast
Food Restaurant, I would still go 3.23 2.85 2.743 0.007 Accepted
I would switch to a competitor if I experience
a problem with the service of my favorite
Fast Food Restaurant
3.77 3.24 4.151 0.000 Accepted
Table 44 shows the main results obtained from the T-test; all of the categories differ
significantly from each other in the mean of the results. This means that Guatemalans
perceive loyalty better than the Germans, or at least they believe in loyalty in this
industry. In this case, we can define that the hypothesis is accepted between
Guatemala and Germany.

International Marketing Master Thesis 2013-2014 International Master in Business Administration (iMBA)
73 Christopher Schlosser
In order to have a clear picture of all the results, the next table shows the summary of
the status of each hypothesis of the three countries. This will help the reader analyze
the data in a much easier way, as well as to have an idea of the tendency of the results
of the research.
Table 45: Summary of hypotheses of comparisons between Guatemala, Spain and
Germany
Hypotheses summary
Guatemala vs.
Spain Spain vs. Germany
Guatemala vs. Germany
H1. Quality Accepted Rejected Accepted
H2. Efficiency Rejected Accepted Accepted
H3. Pricing Rejected Accepted Accepted
H4. Social status Accepted Accepted Accepted
H5. Emotions Accepted Accepted Rejected
H6. Cleanness Accepted Accepted Rejected
H7. Aesthetics Rejected Accepted Accepted
H8. Facilities Rejected Rejected Accepted
H9. Satisfaction Accepted Accepted Accepted
H10. Loyalty Accepted Accepted Accepted
In this table we can observe the acceptance or rejection of each hypotheses and the
comparison between the countries. The hypotheses of quality, efficiency, pricing,
emotions, cleanness and aesthetics show that 2 out of 3 comparisons each were
accepted and the other rejected. So we can say that these hypotheses are accepted,
because the perceptions of these value dimensions generally differ among the
countries. The hypothesis of social status is accepted, because in every country, people
differ in their perceptions towards this value dimension. The hypothesis of the facilities
is rejected in 2 out of 3 comparisons, so it is rejected globally.
In the 8 different hypotheses of value dimensions, 7 of them were accepted globally,
because they applied for the majority of the cases. The only hypothesis of value
dimension that was rejected was the perception of the facilities in Fast Food
Restaurants. The other two hypotheses were also accepted, by having different
perceptions in all the comparisons. This means that in satisfaction and loyalty, each
International Marketing Master Thesis 2013-2014 International Master in Business Administration (iMBA)
74 Christopher Schlosser
country perceives it differently. In order to sum up all the data gathered from the results,
we are analyzing the main differences between the countries:
Guatemala vs. Spain
Quality of Fast Food is perceived better in Guatemala; as well as the customer
attention by employees.
The prices impact more in the purchase decision in Spanish than Guatemalans; it
is a very important factor for them.
Social status and emotions are perceived very differently in these countries;
Guatemalans take it more into consideration than Spanish; even though these
value dimensions are not seen as very influential in their purchase decision.
The Fast Food Restaurants are seen cleaner in Guatemala than in Spain, for
example, the restrooms, eating areas and counter.
The space inside the restaurants is more comfortable for Guatemalans; they
have more space to move around.
The satisfaction level is higher in Guatemala; this is mainly from the result of the
good attention provided by employees.
Guatemalans are more loyal in Fast Food Restaurants than Spanish; they go
there often, get treated fairly, they trust in it and recommend it to people they are
surrounded
Spain vs. Germany
Spanish people perceive better the process of purchase in Fast Food
Restaurants than Germans.
The opportunity cost of consuming in a Fast Food Restaurant is better perceived
in Spain.
Social status is seen as not important in both countries, but Germans tend to take
in more into account when purchasing.
Germans get more excited and happy when the go to a Fast Food Restaurant,
but it is not a critical issue for the purchase decision.

International Marketing Master Thesis 2013-2014 International Master in Business Administration (iMBA)
75 Christopher Schlosser
In Germany the environment is felt healthier and the eating areas, restrooms and
counter are cleaner than in Spain.
The design of the inside and outside of the restaurants is more influential for
Spanish consumers.
The employee attention and service received is better perceived in Germany.
German costumers tend to be more loyal then Spanish; they encourage friends
and relatives to consume there by saying positive things about it.
Guatemala vs. Germany
Customer attention is better perceived in Guatemala than Germany; employees
have a better attitude and right knowledge.
The waiting time is seen as adequate by Guatemalans, as well as the opportunity
cost of consuming in Fast Food Restaurants.
Germans get to meet new people in these restaurants, but Guatemalans
perceive that their relationship with the other customers is more satisfying.
The infrastructure, design, lighting and the comfortable space to move around of
the restaurants are more important for Guatemalans in their purchase decision.
Guatemalans are more satisfied with the service and the problem solving of
employees of Fast Food Restaurants than Germans.
It is very clear that Guatemalans are more loyal than Germans in the Fast Food
Industry; they encourage people to go there, go there very often, trust in it and
want to continue to go there in the future.
Comparing to other authors that have done researches about cross cultural differences
in the Fast Food Industry, it can be said that this is the first study that analyzed
Guatemala, Spain and Germany together. It is important to mention that only a few
researches have been done for the Fast Food Industry in Guatemala. There have been
similar studies done, but with other countries for comparison, as well as different value
dimensions used as in this study (Baek, Ham & Yang, 2006; Brady, Robertson &
Cronin, 2001; Etemad-Sajadi & Rizzuto, 2013; Gilbert, Veloutsou, Goode & Moutinho,
2004). There are previous studies that have tried to proof and measure loyalty and
International Marketing Master Thesis 2013-2014 International Master in Business Administration (iMBA)
76 Christopher Schlosser
satisfaction in the Fast Food Industry (Sahagun & Vasquez-Parraga, 2014; Gilbert,
Veloutsou, Goode & Moutinho, 2004) which explained that there is loyalty in this
industry and that there is a difference in the cultural behavior of customers.
The following section will conclude the key findings of this research, which will indicate
the main differences of perceptions in the three countries being analyzed and the most
important facts of this research. It will also include the managerial implications, which
will show the most important factors that can be considered from this study to apply in a
managerial environment. Lastly the study limitations will be shown in order to
demonstrate the impact they had on this study, as well as the further research that is
recommended to keep on studying.
International Marketing Master Thesis 2013-2014 International Master in Business Administration (iMBA)
77 Christopher Schlosser
6. Conclusion
From this research, we spread our knowledge of the differences of value dimensions
perceptions, satisfaction and loyalty between Guatemala, Germany and Spain; to the
best of our knowledge, it is the first research study that compares these three countries
in the Fast Food Industry. The importance of the combination of these countries can be
seen from cultural points of view, as well as from globalization in the Fast Food Market.
There are a lot of differences in cultures, such as language, food habits and family
values, but the globalization of brands has impacted most nations worldwide. The key
findings and analysis of the results according to the Master Thesis objectives are going
to be shown, as well as the study limitations, and the managerial implications and
further research. This study shows the comparison of eight different value dimensions,
satisfaction and loyalty of these three countries. It is very impressive how people think
differently about these subjects in each country; this means that the cultural aspect of
each country plays a big role in the purchase intention of people.
6.1. Key Findings
The results of this study indicate that 9 out of 10 of the hypotheses were accepted; the
variables researched (i.e. value dimensions, satisfaction and loyalty) do differed among
the three chosen countries. This means that at least in two comparisons of the
countries, the hypothesis was accepted among the different categories that were
measured. The only hypothesis that was rejected was the difference in opinion of the
facilities in Fast Food Restaurants. The rest of the hypotheses showed that there is a
difference in the thoughts of people in different value dimensions, satisfaction and
loyalty. The following key findings were extracted from this research:
The perception of quality is different in Guatemala comparing with Spain and
Germany; Guatemalans have a better perception of product quality in Fast Food
Restaurants, they see these restaurants as high in quality in their offerings.
Germans and Spanish have similar opinions about this subject and they give this
subject importance, but not as much as Guatemalans. This quality includes the
product itself and the service received from employees.
International Marketing Master Thesis 2013-2014 International Master in Business Administration (iMBA)
78 Christopher Schlosser
Efficiency and the time spent, the pricing issues and aesthetics in these
restaurants are seen differently in Germany comparing with Spain and
Guatemala; Germans see the time and efficiency as not adequate for what it is
offered, contrary to the price. Guatemalans think that in general these
restaurants are efficient and that the aesthetics are very important in their
behavioral intentions. The design in the interior and outside of the facilities
impacts the behavior of the purchase intention of customers.
In the value dimension of social status, all of the analyzed countries have
different perceptions; Guatemalans take this more into account in their behavioral
purchase intentions than the Germans and Spanish. The categories show that
the Europeans do not give this value dimension importance as Latin American
countries, even though it is not a high influencer in customers.
Emotional Value is not seen as very important among the countries, but they
have different opinions about this value dimension and the influence it has on
their purchase decisions. Most of the participants did not consider that they felt
emotions or childhood memories when purchasing in Fast Food Restaurants.
The cleanness is a very important issue that customers evaluate in Fast Food
Restaurants; Guatemalans and Germans think this is a vital aspect in order for
them to purchase in these restaurants, Spanish think it is very important as well,
but the restaurants are not always very clean. It is normal in most cultures the
eating places have to be incredibly clean in order to look attractive to costumers;
there are only a few regions in the world where it is not considered.
The only hypothesis that was rejected was the importance of the physical
facilities in this industry; most of the countries think that it is not that important
and most of them have the same opinion about it (Hypothesis 8). It clearly
showed that in two comparisons (Spain with Germany and Guatemala) the
hypothesis was rejected; the results showed that the opinion on each category
was mostly similar.
Both satisfaction and loyalty differ in all the countries in their opinion of their
application in Fast Food Restaurants. Guatemalans are more satisfied than
International Marketing Master Thesis 2013-2014 International Master in Business Administration (iMBA)
79 Christopher Schlosser
Germans and Spanish and they also are more loyal in this industry, according to
the different categories analyzed. The tendency of Spanish and Germans is that
they are lightly satisfied and loyal in this industry. A lot of people think that they
are not loyal at all, but when diverse categories measure loyalty from different
points of view, it can be seen that they are, even though they do not recognize it.
For Guatemalans, consumers can be loyal in this industry, but for Spanish and
Germans this is not very clear. This could be because of the food culture of these
countries; they still do not support these types of restaurants that much, even
though this is changing.
Guatemalans have a better overall perception of Fast Food Restaurants than the
European countries being analyzed; they recognize this industry as high quality
and excellent customer attention. Spanish and Germans do not recognize this
type of food as high quality or very good customer attention. This could be
because of the socio-economic status of the population or the food culture.
The impact of globalization has influenced consumers all around the world; the
main Fast Food chains have expanded their businesses globally and are
changing the food habits and influencing cultures. So, 90% of the hypotheses
were accepted in this study, which can be said that there is a variance in the
perception of the researched value dimensions between these countries. Most of
these chains adapt their offerings to the customer´s needs and then they study
them so they can try to satisfy them in order to become loyal.
6.2. Managerial implications
One of the objectives of this study is that managers of the Fast Food Industry can use
this research to get to know the different cultural aspects of these countries and the
impact it has on customer´s decisions, so they can learn more about them and offer
them products that can satisfy their needs. The expert of this industry clearly exposed
his knowledge in this subject; he had a very good perception of this market and in the
purchase intentions of customers from different cultures. This was very helpful for
creating the focus group questions as well as the questionnaire. The value dimensions
that demonstrated to be different in the countries analyzed are the ones that managers
International Marketing Master Thesis 2013-2014 International Master in Business Administration (iMBA)
80 Christopher Schlosser
have to take into account in order to focus them accordingly to the different regions. The
perception in each country is different, as well as with satisfaction and loyalty. In
Guatemala people tend to be more loyal than in Spain and Germany, so managers
should focus on getting to know the clients more and satisfying them at all costs.
The value dimensions that were the most considered and important for the three
countries were quality of the product, efficiency of the service, the price, cleanness and
aesthetics. The results clearly show that people take them into account when they enter
a Fast Food Restaurant. This should be considered by managers in this industry so they
can improve in these subjects and make customers satisfied, in order for them to
become loyal. Managers should consider the culture in each country when taking
marketing decisions, because people have different thoughts and family values. This
implies that in every segment, people will react differently, so managers have to study
them and focus in their needs.
The globalization of Fast Food Chains around the globe has impacted a lot in food
cultures in different regions. These restaurants are adapting their offerings to people´s
needs; they are diverse in each region. But they are also offering standardized products
and people are responding well to it. Customers feel identified with the restaurants that
offer them something that they can relate with; this will give them confidence to keep on
purchasing and trying new products with this brand. As the reader can see in the
literature review, the top Fast Food Restaurants in the industry of the analyzed
countries are from international chains; they are gaining a lot of strength globally and
are known in almost every part of the world. This means that people are recognizing
them and changing their habits for consuming these types of products.
6.3. Study Limitations and further research
There were many important limitations to this research, according to its academical
nature, so having financial and methodological shortcomings. First, methodologically,
one of the main limitations was the asymmetrical use of secondary information available
for the three countries, due to the lack of information of the Fast Food Industry in
Guatemala; there are not any previous studies of this industry in the mentioned country.

International Marketing Master Thesis 2013-2014 International Master in Business Administration (iMBA)
81 Christopher Schlosser
This could happen because of the inefficient education system in this country, as well as
the lack of importance for research companies to analyze Fast Food in a third world
country. The literature review in this section was taken from newspaper articles,
websites and other sources, but there was not a full study with detailed information
about this market, in comparison with Spain and Germany.
Secondly, another limitation of this research was the reach of the questionnaires;
although the final number is relatively high (366) they had to be done via electronic,
because the study was measured in three different countries. The ideal scenario would
be to perform them person-to-person, but this takes a lot of time and in some cases it is
very expensive. So it was difficult to be sure that the participants were answering in an
honest and fair way, but it is the fastest, cheapest and easiest method to handle
questionnaires in different regions in a short period of time. There are many helpful tools
to develop questionnaires and distribute them to the target market that the authors
want, so this helps reaching the desired audience. Thirdly, the statistical procedure
followed to provide valuable information out of the data collected has been limitated to
bidimensional analysis (t test). In this sense, further analyses could have been
undertaken in order to better know relationships and impacts between the value
dimensions theirselves, and between them and customer satisfaction and loyalty.
According to these and other limitations, several areas of future research emerge at the
end of this work. One of the areas that can be further researched is the cultural and
economic aspects that influence in customer behavior; there is a big difference in the
wealth of people of third and first world countries. It is recommended to research the
impact of social and economic influence in the purchase decisions. For example, in
Guatemala, a Fast Food Restaurant is view by the majority of the population as a
luxury; this is because of the vast poverty in the area (most habitants of Guatemala are
poor and uneducated). For countries like Germany and Spain, who are more educated
and have higher levels of economy, these industry is seen generally as cheap and
unhealthy.
Another area of research interest is the cultural food habits of the different regions
around the world and the impact of Fast Food and globalization in it. All countries have
International Marketing Master Thesis 2013-2014 International Master in Business Administration (iMBA)
82 Christopher Schlosser
their own food culture and a lot of people have their own personal food habits. With
globalization taking place in the last decades, these habits are changing and are
adapting to the offerings of big global restaurant chains. The question for researching
this subject is how big companies manage to reach almost the entire globe, if they
adapt to them and slowly introduce new products or if these habitants ask and search
for these types of products until they get them.
The impact of health issues in the Fast Food Restaurants has been a major subject in
the last decade; many companies have tried to stop people from eating this type of
food, because it is harmful for consumers. Nowadays people are tending to eat
healthier; Fast Food is seen as unhealthy, so there are many campaigns that convince
people to stop eating there. To counterattack these allegations, companies are offering
healthier products and some of them are changing their processes in order to offer
better products. It would be interesting to investigate how these chains changed or
reacted when the health campaigns started.
International Marketing Master Thesis 2013-2014 International Master in Business Administration (iMBA)
83 Christopher Schlosser
7. References
Albrecht, K. (1992). The only thing that matters. Harper; 1st edition. New York.
Anderson, J.C. & Narus, J.A. (1998). ―Business Marketing: understand what
customers value‖. Harvard Business Review Vol. 76 (6) , pp. 53-65
Axelson, M., L. (1986). "The Impact of Culture on Food-Related Behavior."
Annual Review of Nutrition, Vol. 6, pp. 345-363.
Baek, S., Ham, S. & Yang, I. (2006). ―A cross-cultural comparison of Fast Food
Restaurant selection criteria between Korean and Filipino college students‖.
International Journal of Hospitality Management, Vol. 25(4), pp. 683-698
Bagozzi, R., P., Wong, N., Abe, S. & Bergami, M. (2000). "Cultural and
Situational Contingencies and the Theory of Reasoned Action: Application to
Fast Food Restaurant Consumption." Journal of Consumer Psychology. Vol. 9
(2), pp. 97-106
Baker, J., Berry, L.L. and Parasuraman, A. (1988). "The marketing impact of
branch facility design". Journal of Retail Banking, Vol. 10(2), pp.33-42.
Baraban, R., S. & Durocher, J., F. (2010). Successful Restaurant Design. John
Wiley & Sons. New Jersey.
Batra, A. (2008). ―Foreign tourists' motivation and information source(s)
influencing their preference for eating out at ethnic restaurants in Bangkok‖.
International Journal of Hospitality and Tourism Administration, Vol. 9(1), pp. 1-
17
Batra, R. & Ahtola, O., T. (1990). "Measuring the Hedonic and Utilitarian Sources
of Consumer Attitude". Marketing Letters, Vol. 2(2), pp. 159-170.
Beck, L., C., Trombetta, W., L. & Share, S. (1986). "Using focus group sessions
before decisions are made." North Carolina Medical Journal, Vol. 47(2), pp. 73 –
74.
Beldona, S., Moreo, A., P. & Mundhra, G., D. (2010). ―The role of involvement
and variety-seeking in eating out behaviors.‖ International Journal of
Contemporary Hospitality Management, Vol. 22(3), pp. 433-444.

International Marketing Master Thesis 2013-2014 International Master in Business Administration (iMBA)
84 Christopher Schlosser
Berry, L., L. (1995). ―Relationship Marketing of Services – Growing Interest,
Emerging Perspectives‖. Journal of the Academy of Marketing Science. Vol. 23,
pp. 236-345.
Bigné, J.E., Moliner, M.A. & Callarisa, L.J. (2000). “El valor y la fidelización de
clientes: propuesta de modelo dinámico de comportamiento”. Revista Europea
de Dirección y Economía de la Empresa, Vol. 9 (3), pp. 65-78.
Brady, M., K., Robertson, C., J. & Cronin, J., J. (2001). ―Managing behavioral
intentions in diverse cultural environments: an investigation of service quality,
service value, and satisfaction for American and Ecuadorian fast-food
customers.‖ Journal of International Management. Vol. 7 (2), pp. 129-149.
Brink, A., & Berndt, A. (2008). Relationship Marketing & Customer Relationship
Management. Lansdowne. Juta and Co Ltd.
CentralAmericaData.com. (2012). Guatemalan Food Businesses Looking To
Expand.
Website:http://en.centralamericadata.com/en/article/home/Food_Businesses_no_
Longer_Fit_in_Guatemala
CentralAmericaData.com. (2011). Restaurant Franchises Keep Growing. From
Website:http://en.centralamericadata.com/en/article/home/Restaurant_Franchise
s_Keep_Growing
Chen, J., S. (2000). ―Cross-cultural differences in travel information acquisition
among tourists from three pacific-rim countries‖. Journal of Hospitality and
Tourism Research, Vol. 24(2), pp. 239-251
Cheung, G., W., Murrmann, K., F., Murrmann, S., K. & Becker, C. (2004).
‖Noninvariant measurement versus traditional approaches for studying cultural
differences: A case of service expectations.‖ Journal of Hospitality and Tourism
Research, Vol. 28(4), pp. 375-390
Choudhary, A. (2011). Improving the quality and efficiency of Fast Food
Restaurants. From the Operations & Supply Chain Club, Iim Raipur. Website:
http://opepiimraipur.blogspot.com.es/2011/05/improving-quality-and-efficiency-
of.html
International Marketing Master Thesis 2013-2014 International Master in Business Administration (iMBA)
85 Christopher Schlosser
Cohen, N. & Glover, M. (2013). ‗A‘ Is for American Food: Does Culture or
Cleanliness Determine a Restaurant‘s Grade?. From New York Observer. Web
site: http://observer.com/2013/06/a-is-for-american-food-does-culture-or-
cleanliness-determine-a-restaurants-grade/
Cravens, David W., Charles W. Holland, Charles W. Lamb Jr. and William C.
Moncrieff. (1988). ―Marketing‘s Role in Product and Service Quality,‖ Industrial
Marketing Management, Vol. 17, pp. 285–304.
Cronin Jr., J.J, Brady, M.K. & Hult, G.T.M. (2000). "Assessing the Effects of
Quality, Value, and Customer Satisfaction on Consumer Behavioral Intentions in
Service Environments". Journal of Retailing, Vol. 76, pp. 193-218.
Dave, J., M., An, L., C., Jeffery, R., W., & Ahluwalia, J., S. (2009). Relationship of
Attitudes Toward Fast Food and Frequency of Fast-food Intake in Adults. Obesity
2009, Vol. 17, pp. 1164-1170.
De Wulf, K., Odekerken-Schröder, G. & Iacobucci, D. (2001). "Investments in
Consumer Relationships: A Cross-Country and Cross-Industry Exploration."
Journal of Marketing. Vol. 65 (4), pp. 33-50.
Dick, A., S. & Basu, K. (1994). "Customer Loyalty: Toward an Integrated
Conceptual Framework". Journal of the Academy of Marketing Science, Vol. 22
(2), pp. 99-113.
Dodds, W., B., Monroe, K., B. & Grewal, D. (1991). ―Effects of Price, Brand, and
Store Information on Buyers ‗Product Evaluations‖. Journal of Marketing
Research, Vol. 28, pp. 307-19.
El Periódico. (2011). Pollo y pizza, los platillos favoritos de los chapines. From
Web site: http://www.elperiodico.com.gt/es/20110618/economia/196998/
Etemad-Sajadi, R. & Rizzuto, D. (2013). "The antecedents of consumer
satisfaction and loyalty in Fast Food industry: A cross-national comparison
between Chinese and Swiss consumers". International Journal of Quality &
Reliability Management. Vol. 30 (7), pp. 780-798
Euromonitor International. (2013). Consumer Foodservice in Spain.
Euromonitor International. (2013). Consumer Foodservice in Germany.

International Marketing Master Thesis 2013-2014 International Master in Business Administration (iMBA)
86 Christopher Schlosser
Fitz-Gibbon, C., T. & Morris, L., L. (1987). How to Analyze Data. SAGE
Publications, Inc. USA
Fumerton, P. (1991). Cultural aesthetics: Renaissance Literature and the
Practice of Social Ornament. The University of Chicago Press. USA.
Gallarza, M., G. & Gil-Saura, I. (2006). ―Desarrollo de una escala
multidimensional para medir el valor percibido de una experiencia de servicio‖.
Spanish Journal of Marketing Research ESIC.
Gallarza, M., G., Gil-Saura, I. & Arteaga, F. (2013). "The quality-value-
satisfaction-loyalty chain: relationships and impacts". Tourist Review, Vol. 68 (1),
pp. 3-20.
Gallarza, M., G., Gil-Saura, I. & Holbrook, M.B. (2012). "Customer Value in
Tourism Services; Meaning and Role for a Relationship Marketing Approach". in
Tsiotsou, R. and Goldsmith R.E. (eds) Strategic Marketing in Tourism Services,
Chapter 10, pp. 147-162
Gallarza, M. G., Gil-Saura, I. & Holbrook, M. B. (2011). "The value of value:
Further excursions on the meaning and role of customer value". Journal of
Consumer Behaviour, Vol. 10(4), pp. 179-191.
Ghemawat, P. (2004). "Distance Still Matters, the Hard Reality of Global
Expansion". Harvard Business Review.
Gilbert, G.R., Veloutsou, C, Goode, M.M.H. & Moutinho, L., (2004) "Measuring
customer satisfaction in the Fast Food industry: a cross-national approach".
Journal of Services Marketing, Vol. 18 (5), pp.371 – 383
Gilmore, A. (2003). Services Marketing and Management. London. SAGE
Publications Ltd.
Grönroos, C. (1982). "A service quality model and its marketing implications".
European Journal of Marketing, Vol. 18 (4), pp. 36-44.
Gusapari, J. (1996). ―El valor: competitividad de los 90´‖. Harvard Deusto
Marketing y Ventas, Vol. 12, pp. 8-12.
Harter, H., L. & Balakrishnan, N. (1997). Tables for the Use of Range and
Studentized Range in Test of Hypotheses. CRC Press LLC. USA.
International Marketing Master Thesis 2013-2014 International Master in Business Administration (iMBA)
87 Christopher Schlosser
Heiens, R., A. & Pleshko, L., P. (2008). "An Application of the Customer Loyalty
Classification Framework in the Fast Food Hamburger Market". Journal of Food
Products Marketing, Vol. 3 (1), pp. 1-12.
Holbrook, M.B. (1999). Consumer value. A framework for analysis and research.
Ed. Routledge, London.
Holbrook, M.B. & Hirschmann, E., C. (1982). "The Experiential Aspects of
Consumption: Consumption Fantasies, Feelings and Fun". Journal of Consumer
Research, Vol. 9, pp. 132-140.
Horovitz, B. (2013). Would you eat in a restaurant with a dirty bathroom? From
USA Today, Website:
http://www.usatoday.com/story/money/business/2013/07/03/dirty-bathrooms-
restaurants-fast-food-mcdonalds-starbucks/2486647/
Jalili, P.P. (2008). The Impact of Customer Relationship Marketing on Market
Performance – a study among Iranian telecommunication service. Master Thesis
– Lulea University of Technology.
Johns, N., Pine, R. (2002). "Consumer behavior in the food service industry: a
review". International Journal of Hospitality Management Vol. 21 (2), pp. 119-
134.
Jones, T., O. & Sasser, W., E. (1995). "Why satisfied customers defect". Harvard
Business Review, November/December, pp. 88-99.
Jorgensen, N. (2001). A contingency model for the company´s use of relationship
building. 17 the IMP Conference.
Kara, A., Kaynak, E. & Kucukemiroglu, O. (1995). "Marketing strategies for
fast‐food restaurants: a customer view", International Journal of Contemporary
Hospitality Management, Vol. 7 (4), pp.16 - 22.
Keegan, W., J. & Green, M., C. (2013). Global Marketing, Global Edition 7th
edition, Prentice Hall, London, NY.
Kim, D. (2008). ―Customers' responses to crowded restaurant environments:
Cross-cultural differences between American and Chinese‖. Journal of Hospitality
and Leisure Marketing, Vol. 16(1-2), pp. 137-157
International Marketing Master Thesis 2013-2014 International Master in Business Administration (iMBA)
88 Christopher Schlosser
Kim, W., G. & Moon, Y., J. (2009). ―Customers‘ cognitive, emotional, and
actionable response to the servicescape: A test of the moderating effect of the
restaurant type.‖ International Journal of Hospitality Management, Vol. 28 (1), pp.
144-156.
King, D. & Lawley, S. (2013). Organizational Behaviour. Oxford University Press.
Oxford.
Kotler, P., Kartajaya, H., Huan, H., D. & Liu, S. (2008). Rethinking Marketing:
Sustainable Market-ing Enterprise in Asia. Pearson. Singapore.
Knutson, B., J. (2000). "College Students and Fast Food: How Students perceive
Restaurant brands". Cornell Hotel and Restaurant Administration Quarterly, Vol.
200, pp. 41-68.
Lanier & Saini. (2008). "Understanding Consumer Privacy: A Review and Future
Directions". Vancouver. Academy of Marketing Science.
Leclerc, F.; Schmitt, B.H. & Dubé, L. (1995). ―Waiting time and decision making:
is time like money?‖, Journal of Consumer Research, Vol. 22 pp. 110-119.
Lee, S., Y. & Kim, J., H. (2014). "Effects of Servicescape on Perceived Service
Quality, Satisfaction and Behavioral Outcomes in Public Service Facilities".
Journal of Asian Architecture and Building Engineering. Vol. 131.
Lee, M. & Ulgado, F., M. (1997). "Consumer evaluations of fast‐food services: a
cross‐national comparison." Journal of Services Marketing, Vol. 11 (1), pp.39 -
52.
Leidner, R. (1993). Fast Food, Fast Talk: Service Work and the Routinization of
Everyday Life. The Regents of the University of California. USA.
Li, M. (2014). ―Cross-cultural tourist research: A meta-analysis.‖ Journal of
Hospitality and Tourism Research, Vol. 38(1), pp. 40-77
Lord, K., R., Putrevu, S., & Zheng, S., Y. (2006). ―Cross-border restaurant
patronage: Cultural determinants of perception and satisfaction‖. International
Journal of Hospitality and Tourism Administration, Vol. 6(4), pp. 33-47.
Martín, D.; Barroso, C. & Martín, E. (2004). “El valor percibido de un servicio”.
Spanish Journal of Marketing Research ESIC, Vol. 8 (1), pp. 47-71
International Marketing Master Thesis 2013-2014 International Master in Business Administration (iMBA)
89 Christopher Schlosser
Mathew, K. & Leitch, L. (2011). "An Exploratory Examination of Supervisor
Undermining, Employee Involvement Climate, and the Effects on Customer
Perceptions of Service Quality in Quick-Service Restaurants". Journal of
Hospitality & Tourism Research 2013, Vol. 37, pp.29.
Masip, J. (2008). Estudio de Mercado: El Sector de las Franquicias en
Guatemala. Consejería de Economía e Innovación Tecnológica, Comunidad de
Madrid.
Mattila, A., S. (2000). ―The impact of culture and gender on customer evaluations
of service encounters.‖ Journal of Hospitality and Tourism Research, Vol. 24(2),
pp. 263-273.
Miele, M., & Murdoch, J. (2002). ―Fast food/slow food: standardizing and
differentiating cultures of food.‖ Globalization, localization and sustainable
livelihoods 2002, pp. 25-41.
Miele, M., & Murdoch, J. (2002). "The Practical Aesthetics of Traditional Cuisines:
Slow Food in Tuscany". Journal of the European Society for Rural Sociology
2002, Vol. 42 (4), pp. 312-328.
Oliver, R.L. (1999). Value as excellence in the consumption experience in
Holbrook, M.B. (ed.) Consumer value. A framework for analysis and research
Rutledge. London, pp. 43-62.
Oliver, R. L. (2010). Satisfaction: A behavioral perspective on the consumer. New
York. M.E. Sharpe, Inc.
Palmatier, R. W. (2008). Relationship Marketing. Marketing Science Institute,
Cambridge.
Park, C. (2004). "Efficient or enjoyable? Consumer values of eating-out and Fast
Food Restaurant consumption in Korea". International Journal of Hospitality
Management. Vol. 30 (1), pp. 87-94.
Park, J. -., & Jang, S. S. (2014). "Why do customers switch? More satiated or
less satisfied". International Journal of Hospitality Management, Vol. 37, pp. 159-
170.
International Marketing Master Thesis 2013-2014 International Master in Business Administration (iMBA)
90 Christopher Schlosser
Parvatiyar, A. & Sheth, J., N. (2001). "Customer Relationship Management:
Emerging Practice, Process, and Discipline". Journal of Economic and Social
Research Vol. 3(2) 2001, 2002 Preliminary Issue, pp. 1-34.
Pearce, J., Blakely, T., Witten, K. & Bartie, P. (2007). "Neighborhood Deprivation
and Access to Fast-Food Retailing: A National Study." American Journal of
Preventive Medicine. Vol 32. (5). pp. 375-382.
Picón, A., Castro, I., & Roldán, J. L. (2014). "The relationship between
satisfaction and loyalty: A mediator analysis". Journal of Business Research, Vol.
67(5), pp. 746-751.
Rosemberg, J.M. (1995). Dictionary of retailing and merchandising. National
Retail Federation. John Wiley and Sons. USA
Sahagun, M. A. & Vasquez-Parraga, A.Z. (2014). "Can Fast Food consumers be
loyal customers, if so how? Theory, method and findings". Journal of retailing and
consumer services, Vol. 21, pp. 168-174.
Saura, I. G., & Gallarza, M. G. (2008). "Investigating perceived value from a
marketing viewpoint". [La investigación en valor percibido desde el marketing]
Innovar, Vol. 18(31), pp. 9-18.
Sheldon, P., J. & Fox, M. (1988). "The Role Of Foodservice In Vacation Choice
And Experience: A Cross-Cultural Analysis." Journal of Travel Research, Vol. 27
(2), pp. 9-15
Smith, A. (2006). Encyclopedia of Junk Food and Fast Food. Greenwood Press.
Westport, CT.
Smith, S. (2012). How to Measure Customer Satisfaction: Do You Overlook these
4 Key Customer Satisfaction Measurements? From Q Qualtrics, Q Insights
Customer Satisfaction 101, Website: http://www.qualtrics.com/blog/customer-
satisfaction-measurement/
Stank, T.P., Goldsby, T.J. & Vickery, S.K. (1999). "Effect of service supplier
performance on satisfaction and loyalty of store managers in the Fast Food
Industry". Journal of Operations Management, Vol. 17 (4), pp. 29–447.
International Marketing Master Thesis 2013-2014 International Master in Business Administration (iMBA)
91 Christopher Schlosser
Sweeney, J., C. & Soutar, G., N. (2001). "Consumer perceived value: The
development of a multiple item scale". Journal of Retailing, Vol. 77, pp. 203-220.
Terblanche, N., S. (2006). "The relationship between customer satisfaction and
loyalty : an application of the American Customer Satisfaction Index in the South
African Fast Food Industry." Journal of the Southern African Institute for
Management Scientists. Vol. 15 (2), pp. 31-42
The Hofstede Center. (2014). Cultural Tools; Country Comparison. Web site:
http://geert-hofstede.com/the-hofstede-centre.html
The New Definition of Fast Food. (2010). From QSR Magazine: Web site:
http://www.qsrmagazine.com/news/new-definition-fast-food
Tuttle, B. (2014). Fast Food Chains Are Desperate to Kill the Dollar Menu. From
Time. Website: http://business.time.com/2014/01/14/fast-food-chains-are-
desperate-to-kill-the-dollar-menu/
Witkowski, T., H., Ma, Y. & Zheng, D. (2003). "Cross‐cultural influences on brand
identity impressions: KFC in China and the United States", Asia Pacific Journal of
Marketing and Logistics, Vol. 15 (1/2), pp.74 - 88.
Yadav, M.S. & Monroe, K., B. (1993). ―How buyers perceive savings in a Bundle
price: an examination of a bundle´s transaction value‖, Journal of Marketing
Research, Vol. 30, pp. 350-358.
Yanow, D. & Schwarz-Shea, P. (2014). Interpretation and Method: Empirical
Research Methods and the Interpretive Turn. M. E. Sharpe, Inc. USA.
Yoo, S., A. (2012). Customer Perceptions of Restaurant Cleanliness: A Cross
Cultural Study. Thesis submitted to the faculty of the Virginia Polytechnic Institute
and State University.
Zeithaml, V.A. (1984) ―Issues in conceptualizing and measuring consumer
response to price‖. Advances in consumer research, Vol. 11, pp. 612-616.
Zeithaml, V.A. (1988) ―Consumer perceptions of price, quality, and value: a
means-end model and synthesis of evidence‖. Journal of Marketing, Vol. 52, pp.
22.
International Marketing Master Thesis 2013-2014 International Master in Business Administration (iMBA)
92 Christopher Schlosser
Zeithaml, V., A., Berry, L., Parasuraman, A. (1996). "The behavioral
consequences of service quality". Journal of Marketing, Vol. 60, (2).
Zeithaml, V., A. & Bitner, M., J. (2003). Services Marketing: Integrating Customer
Focus across the Firm. Irwin McGraw-Hill. Boston.
International Marketing Master Thesis 2013-2014 International Master in Business Administration (iMBA)
93 Christopher Schlosser
8. Appendices
8.1. Appendix A: Focus Group Guide and Summary
Introduction
Introduction: Background of the topic and personal experience
General Purpose: To understand the different perceived value dimensions of the
Fast Food Industry, the satisfaction level and loyalty.
Warm-up period
Getting to know participants better
Names and background
Question period
Which perceived value dimensions do you think are important for customers in
the Fast Food Industry? For example, quality, time, price, social status,
emotional, aesthetic, etc.
Do they influence in the customer´s satisfaction?
Do you think that a satisfied customer is a loyal customer in the QSR industry?
Does the culture affect the perceived value dimensions in customers?
Do you think customers can be loyal in the Fast Food Industry? Why, Why not?
Which is the main focus of the restaurants towards customer satisfaction? Which
are the most important to satisfy them?
Summary
Clarify and summarize
Review the perceived value dimensions
Other considerations
Thank you / wrap-up
Thank you very much for the valuable information.
Anonymity reminder
International Marketing Master Thesis 2013-2014 International Master in Business Administration (iMBA)
94 Christopher Schlosser
Focus Group Summary
Key findings
Perceived values for customers in the Fast Food Industry
Cleanness inside the restaurants
Time and efficiency
Quality of the food
Aesthetics: external and internal design, fashion
Convenience
Customer service and service recovery
Emotions since customers were very young
One of the main focus of fast food restaurants are kids
Price and sales promotions are vital
Relationship between satisfaction and loyalty
Customers can be loyal if they are satisfied, but it is not always like this
The prices and price promotions can make customers change the supplier
Service recovery is key for loyalty
Relationship between culture and perceived values in customers
Restaurants adapt their offers to each culture or country
Globalization plays a big role in the food culture in each country
People in Spain do not like takeaways and home delivery, they like to take their
time to eat
People in Guatemala like home delivery and don´t take much time for eating
The main focus of the restaurants towards customer satisfaction
In Spain: quality, price and advertising
In Guatemala: customer service and service recovery, price promotions and
advertising
International Marketing Master Thesis 2013-2014 International Master in Business Administration (iMBA)
95 Christopher Schlosser
Participants
9 young adults between ages of 23 and 30 years old from Guatemala and living in
Valencia participated in the focus group conducted by Christopher Schlosser, a
Master´s student of Universitat de Valencia.
Sample Selection
For the qualitative research there were 9 people selected who participated in the
interview of the focus group. The sample was representative among the people who
have knowledge of the Fast Food Industry in Guatemala and Spain; they were inclusive
of both genders and academics.
Focus Group Results
The following results summarize the data collected from the participants‘ ideas and
thoughts in the focus group, for Spain and Guatemala.
Spain
Bad customer service and do not apply service recovery
The culture demands very good food
Price promotions are vital for the purchase intentions
People are not loyal, they go to the restaurant that has the best offers
Give little priority to takeaway and delivery
Aesthetics are very important as well as convenience
Fast Food Restaurants adapt to Spanish culture
Guatemala
The main focus is customer service and service recovery
Good quality in Fast Food Restaurants
Aesthetics are very important
Have a lot of price promotions and influence a lot in customers
International Marketing Master Thesis 2013-2014 International Master in Business Administration (iMBA)
96 Christopher Schlosser
Loyalty goes together with service recovery
Convenience is key in many occasions
There is no strong culinary culture, globalization plays a huge role, as well as
North American influence

97 Christopher Schlosser
8.2. Appendix B: In-depth Interview Guide
The in-depth interview was made to an expert of the Quick Service Restaurants
Industry of Guatemala, having worked for more than 20 years in this industry. This
interview can help the researcher analyze key findings on the qualitative research in
order to develop the hypothesis. The following summary of the interview will give the
reader a glance at the ideas presented by the expert.
Questions:
1. Which perceived value dimensions do you think are important for
customers in the Fast Food Industry? For example, quality, time, price,
social status, emotional, aesthetic, etc)
Different values apply to the different segments of the Fast Food Market:
For the adult market (this means from 35 years old and up), quality is the
most appreciated value that may influence in the purchase decision
Adults will be impressed by the service and cleanliness of the restaurants
Young customers (teenagers and 20-30 years old) will appreciate the cool
places to hang out or the trends of the youth, as well as sale promotions
The social status will be an important item in this group (young customers)
Price will be high qualified by youngsters, too. So it has to be a high value
that businesses have to take care of
Family groups will enjoy playgrounds, birthday party rooms, clowns, and
any kind of entertainment the Quick Service Restaurant industry will
provide
Promotional items (premiums) will attract young members of the families
(ages below 12) and these will influence their parents to do the purchase
If promotional items are attractive enough, the kids will influence greatly in
the choosing decision of a Quick Service Restaurant.
Quality and price are not a big issue in these cases.
Location and convenience are becoming items of great value for this
segment

International Marketing Master Thesis 2013-2014 International Master in Business Administration (iMBA)
98 Christopher Schlosser
The working customers that use the Quick Service Restaurant during the
week (very high volume of sales) will decide upon price, service time and
cleanliness.
They would be attracted to frequent customer’s offers and promotions
This is the segment to try to capture at all times
The value they obtain for the price they paid is the decision maker
Delivery is a key value in some markets
Local chains will focus on national / typical products, too.
Not all the Quick Service Restaurant focuses their marketing strategy on the same
value dimensions. Some focus on quality only, others are pricing only. This will
automatically segregate the segments they will attract. The premiums for young kids
are used mainly by the big players in the market (McDonald´s, Burger King and
Wendy´s).
2. Do they influence in the customer´s satisfaction?
These values will attract different segments to the Quick Service Restaurant and
probably will generate customer´s satisfaction. Once the customers arrive to the
location, service will be a key value to watch in order to keep the segment members
coming back.
3. Does the culture affect the perceived value dimensions in customers?
Cultural customs, including language, can be perceived as negative
values in some cases. But in other cases it affects a lot and Quick Service
Restaurant have to adapt to them.
Some people who do not speak English will not like to go to a Quick
Service Restaurant with product names in English because they do not feel
comfortable ordering these items.
Some cultures will enjoy going to an International/American Quick Service
Restaurant for the value of social status.
International Marketing Master Thesis 2013-2014 International Master in Business Administration (iMBA)
99 Christopher Schlosser
Some countries consume products that are not sold in the Quick Service
Restaurant (wine and beer). Some chains have added these items to their
menu, some have not.
4. Do you think customers can be loyal in the Fast Food Industry? Why,
Why not?
Some customers are loyal, but not the main share of the market. The loyalty will vary
if the competition will offer a different or a new value, such as price and new
products. A new location could attract customers from other sites.
5. Which is the main focus of the restaurants towards customer
satisfaction? Which value dimensions are the most important to satisfy
them?
Each Quick Service Restaurant will focus their marketing strategy and
customer satisfaction based on the values they think will attract most of
the customers.
Some will focus on pricing, some will choose other values.
Customer service is a must for Quick Service Restaurant