master of science thesis egi 2013: 053msc a mapping of
TRANSCRIPT

Master of Science Thesis EGI 2013: 053MSC
A Mapping of Scandinavian Smart Grid Development in the Distribution System
from an ICT perspective
Anja Christensson
Nadine Gerson
Edit Wallin
Approved
June 11th 2013
Examiner
Per Lundqvist
Supervisor
Per Lundqvist Commissioner
ERICSSON
Contact person
Amanda Hasselberg Anders Bylund

1
Abstract The power system stands in front of a paradigm shift towards a future power system with increased intelligence, also called the Smart Grid. Smart Grid will inquire the integration of power technologies and Information and communication technology (ICT). This research focuses on the distribution system operators (DSOs), which are considered central actors in the development towards Smart Grid. By a case study based on qualitative interviews with DSOs in the Scandinavian countries, this research provides a mapping of the direction, current situation, driving forces and challenges related to the Smart Grid development from an ICT perspective. Motivators for the development differ with geographical location and in Scandinavia increased share of renewables is stated as the general motivator for Smart Grid.
The case study clearly showed that it is not the renewable energy in itself that motivates the Smart Grid development directly. Instead it is both regulations aimed at realizing energy goals further ahead and regulations enabling market competition that currently drive the development. Findings from the research show that the DSOs have difficulties in finding positive business cases and that the changeable political agenda causes lack of confidence in political incentives to endure long enough for the large investments to pay back. Regardless of the business cases, Smart Grid will undoubtedly happen and new ICT solutions will be widely implemented in the electricity grid.

2

Acknowledgement This master thesis is the final examination for our Master in Industrial Engineering and Management written at the Energy Technology Department at the Royal Institute of Technology (KTH) in Stockholm, Sweden. The master thesis is equivalent of 30 ECTS credits and has been conducted between January 2013 and June 2013. Our supervisor, as well as our examiner, at KTH was Per Lundqvist (professor in energy technology). The thesis is written on behalf of Ericsson, where our supervisors were Amanda Hasselberg and Anders Bylund.
We would like to thank our supervisors, both at KTH and at Ericsson, for helping us with our master thesis; Per Lundqvist for helping us with the academic approach and Amanda Hasselberg and Anders Bylund for their support, genuine interest and continuous feedback that improved the outcome of the thesis. We would also like to thank all interviewees taking part of the case study, both at the external companies and at Ericsson, making it possible for us to conduct the research.
Stockholm, June 12th 2013
Anja Christensson Nadine Gerson Edit Wallin


3
Table of Contents Methodology .............................................................................................................................................. 15
1 Research strategy ............................................................................................................................... 17
1.1 Delimitations ................................................................................................................................ 17
2 Research Process ............................................................................................................................... 19
2.1 Pre-Study .................................................................................................................................... 19
2.2 Case study .................................................................................................................................. 21
2.3 Results and Analysis ................................................................................................................... 21
2.4 Division of Responsibilities .......................................................................................................... 21
2.5 Limitations ................................................................................................................................... 21
2.6 Quality of Research ..................................................................................................................... 22
Literature Review ...................................................................................................................................... 23
3 Smart Grid Transformation .................................................................................................................. 25
3.1 System Theory ............................................................................................................................ 25
3.2 Smart Grid Definition ................................................................................................................... 25
3.3 Smart Grid Characteristics .......................................................................................................... 27
3.4 Realize Smart Grid ...................................................................................................................... 29
4 Smart Grid Communication ................................................................................................................. 30
4.1 Smart Grid Communication Infrastructure .................................................................................. 30
4.2 Transition from AMR to AMI to Smart Grid ................................................................................. 31
4.3 Communication Network Requirements ..................................................................................... 32
4.4 Communication Protocols ........................................................................................................... 33
Nordic Power System ............................................................................................................................... 37
5 One-Way Power System ..................................................................................................................... 39
5.1 Interconnected System ............................................................................................................... 41
6 Electricity Generation and Consumption ............................................................................................. 42
7 Towards a Nordic Harmonization ........................................................................................................ 43
8 Policies and Directives ........................................................................................................................ 45
Country Overviews ................................................................................................................................... 47
9 Sweden ............................................................................................................................................... 49
9.1 Energy Market ............................................................................................................................. 49
9.2 Electricity market ......................................................................................................................... 49
9.3 Distribution Market Structure ....................................................................................................... 52
9.4 Vision, Targets and Policy Measures .......................................................................................... 53
9.5 Electricity Price ............................................................................................................................ 54

4
9.6 Grid Price Regulation .................................................................................................................. 56
9.7 Quality of Supply ......................................................................................................................... 56
10 Denmark .......................................................................................................................................... 57
10.1 Energy Market ............................................................................................................................. 57
10.2 Electricity Market ......................................................................................................................... 57
10.3 Distribution Market Structure ....................................................................................................... 59
10.4 Vision, Targets and Policy Measures .......................................................................................... 60
10.5 Electricity Price ............................................................................................................................ 61
10.6 Grid Price Regulation .................................................................................................................. 62
10.7 Quality of Supply ......................................................................................................................... 62
11 Norway ............................................................................................................................................ 64
11.1 Energy Market ............................................................................................................................. 64
11.2 Electricity Market ......................................................................................................................... 64
11.3 Distribution Market Structure ....................................................................................................... 66
11.4 Visions, Targets and Policy Measures ........................................................................................ 66
11.5 Electricity Price ............................................................................................................................ 67
11.6 Grid Price Regulations ................................................................................................................ 68
11.7 Quality of Supply ......................................................................................................................... 69
12 Comparative and Summarizing Table ............................................................................................. 70
Results ....................................................................................................................................................... 71
13 Results Sweden .............................................................................................................................. 73
13.1 Smart Grid Definition ................................................................................................................... 73
13.2 Direction ...................................................................................................................................... 74
13.3 Current Situation ......................................................................................................................... 77
13.4 Driving Forces ............................................................................................................................. 78
13.5 Challenges .................................................................................................................................. 80
14 Results Denmark ............................................................................................................................. 82
14.1 Smart Grid Definition ................................................................................................................... 82
14.2 Direction ...................................................................................................................................... 83
14.3 Current Situation ......................................................................................................................... 85
14.4 Driving Forces ............................................................................................................................. 86
14.5 Challenges .................................................................................................................................. 87
15 Results Norway ............................................................................................................................... 89
15.1 Smart Grid Definition ................................................................................................................... 89
15.2 Direction ...................................................................................................................................... 90

5
15.3 Current Situation ......................................................................................................................... 91
15.4 Driving Forces ............................................................................................................................. 92
15.5 Challenges .................................................................................................................................. 93
Analysis & Conclusion ............................................................................................................................. 97
16 Analysis ........................................................................................................................................... 99
16.1 Smart Grid Definition ................................................................................................................... 99
16.2 Direction .................................................................................................................................... 100
16.3 Current Situation ....................................................................................................................... 102
16.4 Driving forces ............................................................................................................................ 103
16.5 Challenges ................................................................................................................................ 105
17 Conclusion ..................................................................................................................................... 107
17.1 Suggestions for Future Research ............................................................................................. 107
18 List of References ........................................................................................................................ 109

6
7
List of Figures Figure 1, Illustration of the research process .............................................................................................. 19 Figure 2, DCDC framework used for interviews with DSOs ....................................................................... 20 Figure 3, Prosumer ..................................................................................................................................... 28 Figure 4, High level common communication infrastructure ....................................................................... 30 Figure 5, The evolution of the Smart Grid ................................................................................................... 31 Figure 6, The Nordics .................................................................................................................................. 39 Figure 7, A general illustration of the Nordic power system ....................................................................... 39 Figure 8, Generation capacity by producers, 2008 ..................................................................................... 40 Figure 9, Distribution capacity by DSOs, 2012 ........................................................................................... 40 Figure 10, Nordic electricity generation, 2010 ............................................................................................ 42 Figure 11, Sweden's total primary energy production, gross energy usage per fuel and gross energy usage by energy product after transformation, 2010 .................................................................................. 49 Figure 12, Sweden’s electricity usage, 2000-2011 ..................................................................................... 50 Figure 13, Electricity production by type of producer in Sweden, 2011 ...................................................... 50 Figure 14, Sweden's contribution of renewable energy to electricity production, 2010 .............................. 50 Figure 15, Renewable electricity generation in the electricity certificate system, 2003-2011 .................... 50 Figure 16, Sweden’s net imports and net exports of electricity, 1970–2011 .............................................. 51 Figure 17, Swedish electricity price areas .................................................................................................. 55 Figure 18, Revenue cap framework ............................................................................................................ 56 Figure 19, Denmark's total primary energy production, gross energy usage per fuel and gross energy usage by energy product after transformation, 2011 .................................................................................. 57 Figure 20, Denmark’s electricity usage 1990-2011 .................................................................................... 58 Figure 21, Electricity production by type of producer in Denmark, 2011 .................................................... 58 Figure 22, Denmark's contribution of renewable energy to electricity production, 2011 ............................ 58 Figure 23, Denmark’s net imports and net exports of electricity 1980–2011 in percentage ....................... 59 Figure 24, Danish electricity price areas ..................................................................................................... 61 Figure 25, Nord Pool system yearly average price for Denmark ................................................................ 61 Figure 26, Decomposition of energy prices for households ........................................................................ 62 Figure 27, Norway's total primary energy production, gross energy usage per fuel and gross energy usage per product after transformation, 2008/2009 .................................................................................... 64 Figure 28, Electricity generation in Norway by type 2011 ........................................................................... 65 Figure 29, Norway's contribution of renewable energy to electricity production, 2011 ............................... 65 Figure 30, Norway's electricity import and export 1995-2010 ..................................................................... 65 Figure 31, Norwegian electricity price areas ............................................................................................... 67

8
9
List of Tables Table 1, CATWOE elements ....................................................................................................................... 27 Table 2, Interconnection capacity between the Nordic countries, 2012 ..................................................... 41 Table 3, DSOs' in Sweden market share and network customers ............................................................. 53 Table 4, DSOs' in Denmark market share and network customers ............................................................ 60 Table 5, DSOs' in Norway market share and network customers .............................................................. 66 Table 6, Summary in a comparative format of previously presented information ....................................... 70 Table 7, Company characteristics for interviewed companies in Sweden .................................................. 73 Table 8, Company characteristics for interviewed companies in Denmark ................................................ 82 Table 9, Company characteristics for interviewed companies in Norway .................................................. 89

10

11
List of Abbreviations 2G Second Generation 3G Third Generation 4G Fourth Generation ADSL Asymmetric Digital Subscriber Lines AMI Advanced Meter Infrastructure AMR Automatic Meter Reading AMS Advanced Metering System CENS Cost of Energy Not Supplied DEA Danish Energy Agency DERA Danish Energy Regulatory Authority DKK Danish Krone DSL Digital Subscriber Lines DSO Distribution System Operator EEA European Economic Area EV Electrical Vehicle FASiT Faults And Interruptions Statistics in the Total network GIS Geographical Information System GPRS General Packet Radio Service GSM Global System for Mobile HAN Home Area Network HV High Voltage ICT Information and Communication Technology IT Information Technology kV Kilovolt kWh Kilowatt hour LTE Long Term Evolution LV Low Voltage MDM Meter Data Management MPE Ministry of Petroleum and Energy MV Medium Voltage MWh Megawatt hour NAN Neighborhood Area Network NIS Network Information Service NOK Norwegian Krone NVE Norwegian Water Resources OMS Outage Management System PLC Power Line Communication PSO Public Service Organization PV Photovoltaic QoS Quality of Service RD&D Research, Development & Demonstration RTU Remote Terminal Unit SAIDI System Average Interruption Duration Index SAIFI System Average Interruption Frequency Index SCADA Supervisory Control And Data Acquisition SEK Swedish Krone SWOT Strengths, Weaknesses, Opportunities, Threats TSO Transmission System Operator TWh Terawatt hour WAN Wide Area Network VAT Value Added Tax

12

13
Introduction Smart Grid refers to the transition to a more intelligent energy system, primarily electricity system, and is a highly discussed topic within the energy industry today. Although the name Smart Grid was founded in the 21th century, the future energy system has been speculated in longer. The definition of Smart Grid is ambiguous and a well agreed upon definition is conspicuous by its absence. In this report the definition below is used.
Smart Grid is a bi-directional electric and communication network aimed to increase the efficiency of the operation of the grid through small to large-scale generation, transmission, distribution and usage. Regardless of the exact definition, Smart Grid will require more monitoring and control with shorter time intervals, up to real-time. The change will primarily take place in the distribution grid and below. The need for increased transparency of the grid steers the industry towards a higher dependency of ICT (information and communication technology) solutions. This intersection creates new opportunities and challenges that need to be addressed.
The conditions for Smart Grid development differ with geographical location, which decreases the relevance of analyzing the development from a global perspective. In this thesis the scope is the Nordic countries, were the development is highly driven by the ambitious goals for increased share renewable energy.
The aim was to map the Nordic Smart Grid status in the distribution system from an ICT perspective. It is necessary to incorporate this perspective when analyzing the development of Smart Grid and understand the mechanisms behind it since it is the increased ICT dependency that distinguishes Smart Grid from conventional power system improvements.
This is a qualitative study of the distribution system operators (DSO) Smart Grid development from an ICT perspective. DSOs in Sweden, Denmark and Norway were interviewed adding up to 26 qualitative interviews. The DSOs were targeted since they are the core of the power grid system and key actors in a Smart Grid development. The study aimed to see what the DSOs directions are, their current situation, what drives the development and what the main challenges are in a Smart Grid development.

14
15
This research is done in both the electricity industry and the ICT industry. This section will declare methods applied for the research including a comprehensive description of the work process in terms of collecting and analyzing data to understand the process of this research. This section also includes delimitations and limitations of the research.
Methodology

16
17
1 Research strategy Three master students, referred to as the project team, studying industrial engineering and management with specialization in energy systems at the Royal Institute of Technology (KTH) have carried out the research with supervision from KTH and a well-established ICT Company, Ericsson. As Smart Grid is considered to be a paradigm shift of the utility industry it was naturally chosen as a topic of interest due to the students’ academic background and personal interests. The scope was proposed by the students’ with the aim to evaluate the current status of what is happening on the market when the utility industry will be more dependent on ICT. The study was carried out with an ICT perspective as it was identified as a key component in the development towards Smart Grid even though it was not a part of the student’s academic background. In the textbox below the scope is stated together with the reports’ research questions.
1.1 Delimitations The research has been delimited in terms of geography, market actors and the technical perspective. Scandinavia forms the geographical delimitation of the research. As the power system from a technical perspective has great similarities all over the world and the driving forces and prerequisites differs more, the two latter parameters functioned as the basis for the geographical demarcation. In some markets the security of supply is the main driver, in some markets it is the prevention of electricity frauds, in some countries the increase of renewable intermittent energy sources drives the
A mapping of Scandinavian Smart Grid development in the distribution system from an ICT perspective:
1) What is Smart Grid according to current literature and what communication is needed to realize it?
2) What are the characteristics of the Nordic electricity system? What has it looked like historically and where is it headed?
3) What are the specific situation and conditions in the countries, for the energy system in general and electricity system in particular.
a. What energy sources do each country depend on, specifically for electricity production?
b. What are the national energy and electricity goals, where are the countries headed?
c. How is the electricity price set and what factors affects it?
d. How are the DSO regulated?
4) Where are the DSOs in their Smart Grid development from an ICT perspective today?
a. What is their direction?
b. What is their current situation?
c. What drives the development?
d. What are the main challenges in the development?

18
development and sometimes it is technology companies, such as ICT companies, that want to gain a good global position as a supplier of Smart Grid solutions. The Nordic countries all face an increase of renewable energy sources, which has impact on the development towards Smart Grid. The Nordics can be seen as one combined area of interest due to that the countries (except Iceland) are interconnected with power lines and also heading towards a common end-user market. Students prerequisites of the Nordic energy system in general and the Swedish in particular, combined with the geographical proximity that facilitated logistics resulted in a Nordic focus. Together with Ericsson decision was made to focus on Sweden, Norway and Denmark in the Case Study, but these countries would be investigated in the context of the Nordic market.
The second delimitation was made in terms of market actors. Smart Grid is a wide concept and the electricity system consists of many actors, addressed in Nordic Electricity System that in one way or another is involved in the evolution of Smart Grid. The distribution system operators (DSOs) is considered being the main actor of Smart Grid development and therefore the DSOs were chosen as the representatives from the actors in the value chain of the electricity system. Smart Grid from the view of generation- or retail actors has not been part of the research.
The last delimitation of the research is the technical perspective. As ICT is considered a key component of Smart Grid but outside the original core business of the DSOs new conditions appears on the market. The research has therefore looked at Smart Grid from an ICT perspective.

19
2 Research Process The process was carried out during 20 weeks. To address the research topic a comprehensive case study was carried out that represents the core of the research that the analysis is based on. As found in the figure 1 the process was divided into four sub-processes parallel to the Report Writing, 1) Pre Study, 2) Case Study, 3) Results and Analysis followed by 4) Presentation which will be further described in the following paragraphs.
2.1 Pre-Study The pre-study consisted of five parts; Defining and Re-defining the Scope, Literature Study, Contextualization the Pre-Case Study and Creation of Framework. All together the pre-study served as a foundation for the research of the master thesis.
The definition of the scope started from the students’ area of interest where Smart Grid was considered as the most interesting topic. Different perspectives were evaluated and communication was chosen because it complemented their earlier academic background. Communication is a key component of all “smart” development and especially for a more intelligent power grid. The students contacted the well-established ICT company Ericsson, that came to be a collaboration partner to gain knowledge about the communication perspective. During the process a more precise definition and reformulation of the scope was made in dialogue with Ericsson.
Knowledge about Smart Grid as a subject in itself and about Smart Grid communication technologies and requirements was gathered in the initial phase of the research and forms the literature review. An additional part about the Nordics and the specific countries where the research was conducted was also carried out as a complement to the literature review, discussed in the next paragraph Contextualization. The information was gathered trough secondary data from
Figure 1, Illustration of the research process

20
scientific articles and relevant internet sources such as energy authorities and related organizations. As Smart Grid is a contemporary topic newer articles were preferred, where most articles were not older than three years. The literature review addressed research question one. As a complement to reading literature the project team participated in seminars related to the subject to keep themselves updated in the field of study.
The contextualization was carried out parallel to the Literature Review to understand specific conditions for each of the three markets; Denmark, Norway and Sweden as well as the Nordic market in general since the Nordic market represents the context the countries are a part of, as mentioned earlier. The Contextualization contributed to a good understanding of the market conditions in terms of energy mix in production, number of DSOs, smart meter penetration, and market structure in terms of actors and regulations. The contextualization served as a foundation for the Case Study where a selection of DSOs within each market was interviewed. In order to gather required information articles and reports from organizations within the industry and governmental institutions was used together with consultancy reports. The literature has been complemented by interviews with Energy Authorities in each county where current and future regulations and market conditions were discussed. The contextualization answered research question two and three.
The last part of the Pre-Study was a descriptive case study called Pre-Case Study, which gave a knowledge platform of current ICT solutions that can be used for Smart Grid Communication. The Pre-Case Study contributed to the last part of research question one and enable the ICT perspective that permeated the research. Primary data was collected through semi-structured interviews with selected employees at Ericsson such as technical specialists and strategic leaders. Semi-structured interviews was considered to be most suitable due to the need for specific answers combined with probes to get a broader insight and understanding of the subject as the students had limited prior ICT knowledge.
To investigate the status of the DSOs the project team constructed a new framework, used for the interviews and analysis of the research. The framework was created by a comprehensive mapping of existing frameworks and opinions were collected from dialogs with professionals from various backgrounds. The framework has similarities to the well-known SWOT analysis where strengths, weaknesses, opportunities and threats are addressed. For the research of this report the direction, current situation, driving forces and challenges were consolidated to be the most relevant parameters to investigate and the DCDC framework was constructed, illustrated in figure 2.
D Direction C Current Situation
D Driving Forces C Challanges
Figure 2, DCDC framework used for interviews with DSOs

21
2.2 Case study The case study served as the foundation for further analysis and the ability to answer research question four. Several DSOs were contacted and due to logistics and limited time the two main actors were prioritized in Denmark and Norway. As the study was carried out in Sweden it was possible to meet both main actors and additional smaller ones. Interviewed companies are found in Results. To reduce personal impact and opinions and to get insights from various parts of the organization at least two persons at each company were interviewed. The interview objects were deliberately selected and represent both policy makers and specialists in the area of grid operation, Smart Grid programs and business development. All interviews were made face-to-face in the location of the company with 90 minutes duration per respondent and were conducted by two or three of the students, where one of them took comprehensive notes and one asked questions and probes. The interviews were of semi-structured character and adjusted to the professional role of the respondent. The interviews were recorded to the extent that it was allowed and the respondents were allowed to be anonymous. All interviews were initiated with a question to address the respondents’ definition of Smart Grid due to its impact for the rest of the interviewee’s answers.
2.3 Results and Analysis Short time after each interview the recordings and notes were reviewed. The results then served as a basis for discussions where key elements in relation to the research topic were identified and addressed for deeper analysis. In addition, the results were presented for a selection of employees with various professional backgrounds at Ericssonto gain complimentary perspectives on parameters of interest.
2.4 Division of Responsibilities As the research was conducted by three students a division of responsibilities was made both in terms of practical tasks when carrying out the research and in terms of theoretical tasks when writing the report. The Pre-Case Study and Case Study was performed by the students’ together. In the report Nadine Gerson was responsible for the part in the Literature Review addressing Smart Grid Transformation and Anja Christensson for the technical part, Smart Grid Communication. Edit Wallin was responsible for The Nordic Electricity Market, which is part of the Contextualization. In addition the Country Overview and assembly of Results were divided among the students were Nadine Gerson compiled the parts related to Sweden, Anja Christensson those related to Denmark and Edit Wallin compiled the parts related Norway. The members of the research have worked closely together to benefit from their complementary skills and perspectives. The analysis and conclusions was carried out by the students together.
2.5 Limitations The research has been limited to a time period of 20 weeks, carried out by the three full time master students. Defining the scope of the research was included in the timeframe. The communication technology knowledge base of the authors was not extensive before the thesis was initiated, which

22
limited the depth and complexity of the parts covering ICT, both during interviews and in the report. Another limitation was the possible interview candidates’ availability and as a consequence all possible interview candidates could not be interviewed. The scope of the results might also be seen as a limitation because the answers that were obtained during the performed interviews were the only ones that could be used to compile the results. Some interviews contributed less than others to the results, but only those answers that were obtained could contribute to the result and analysis. The absence of Finland in the study was also a limitation since the desired scope was the Nordics, but was then limited to Scandinavia due to the joint discussion with Ericsson. Finally, the master thesis work has inevitably been affected by the cooperation with Ericsson by factors such as internal policies and interests of the firm, which would be the case cooperating with any type of firm for a master thesis.
2.6 Quality of Research With an interpretive approach using case studies built on qualitative data conducted by semi-structured interviews the context will be particular and findings will be likely to lack in generalizability. In order to increase reliability, referred to as the absence of discrepancy in the result if the research were repeated, several people were interviewed at each company with different roles to cover various opinions. The interviews were conducted with the same interview framework to further increase reliability, but some interviewees were not able to respond to certain questions due to incompetence in certain fields or privacy issues. However, if the research was to be repeated different results would probably be obtained on the detailed level due to individual interview answers, but the high level results would probably not differ to a large extent. As the method used is characterized by in-depth interviews with people working at DSOs, which are the objects of study, comprehensive insights were gained and high validity achieved. The validity of the report is considered to be higher than the reliability, which is often the case with qualitative research.
23
Literature Review The literature review is divided into two parts; Smart Grid Transformation and Smart Grid Communication. The first part is a description of the transformation of the traditional energy system to Smart Grid. The latter describes the Smart Grid communication architecture, techniques used for Smart Grid communication and the requirements.

24

25
Five basics considerations for a system (Churchman, 1984): 1. The total system’s objective 2. The system’s environment 3. The resources of the system 4. Components of the system 5. The mangement of the system
3 Smart Grid Transformation In order to fully understand Smart Grid it is important to grasp the underlying assumptions and the paradigm used. Therefore, this chapter starts with some system theory that can be used to identify the Smart Grid definition and then dig deeper into what the concept of Smart Grid means and how it is a transformation of the energy system.
3.1 System Theory In the following paragraph the system around Smart Grid will be analyzed. The analysis is inspired by Checkland and Churchman’s view on building conceptual models and the “systems approach”. Checkland describes that the technique to build conceptual models start with finding a root definition, which is the definition of the concept:
“…the minimum number of verbs necessary for the system to be the one named and concisely described...” (Checkland, 1999).
The root definition should state what the system is and not what it does. After identifying the root definition the aim is to find an activity model of what must go on in the system, and then how that is done. Further Checkland proposes the use of the CATWOE elements in order to find the activities of the system. The letters stand for: C – Customers, A – Actors, T – Transformation, W - Worldview (Weltanschauung), O – Owners and E – Environment (Checkland, 1999).
Churchman (1984), in his systems approach defines five basic considerations that must be kept in mind when thinking about a meaning of a system shown to the right. By looking at these five points incorporating Checkland’s view, the first bullet point could be identified as the system objective, while the last four points could be a way of identifying the what and the how.
With base in Checkland and Churchman, the approach to analyze the concept of Smart Grid is to start by defining the concept, then continue by describing what Smart Grid does, and conclude by a description of how it can be enabled.
3.2 Smart Grid Definition There is no ubiquitous definition of Smart Grid. Instead many different authors and organizations try to describe the concept of Smart Grid. Below is a selection of different definitions of Smart Grid with different perspectives.

26
Some try to describe the characteristics of a Smart Grid:
“The Smart Grid can be considered as a modern electric power grid infrastructure for enhanced efficiency and reliability through automated control, high-power converters, modern communications infrastructure, sensing and metering technologies, and modern energy management techniques based on the optimization of demand, energy and network availability, and so on” (Güngör, et al., 2011).
While others focus more on ICT in their descriptions of Smart Grid:
“…as the concept of modernizing the electric grid. The Smart Grid is integrating the electrical and information technologies in between any point of generation and any point of consumption” (International Electrotechnical Commission, 2010).
“The new power grid, which is also called the Smart Grid, aims to integrate the recent technological advancements in the Information and Communication Technology (ICT) field to the power engineering field” (Erol-Kantarci & Mouftah, 2011).
Other definitions try to give a high-level holistic perspective of the concept, which may lead to ambiguity of what the concept really means, such as the one from the European Technology Platform:
“A Smart Grid is an electricity network that can intelligently integrate the actions of all users connected to it - generators, consumers and those that do both – in order to efficiently deliver sustainable, economic and secure electricity supplies” (European Technology Platform, 2010).
While some definitions try to include large part of the energy system such as this definition from the Smart Grid Dictionary that covers many different parts of the energy system:
“The Smart Grid is a bi-directional electric and communication network that improves the reliability, security, and efficiency of the electric system for small to large-scale generation, transmission, distribution and storage.
It includes software and hardware applications for dynamic, integrated and interoperable optimization of electric system operations, maintenance, and planning; distributed generation interconnection and integration; and feedback and controls at the consumer level” (Hertzog, 2012).
Common for all definitions is that they are trying to describe a change in the energy system. However, going back to the root definition described by Checkland (1999), a system defintion should consist of the minimal number of verbs describing the concept in a concise - and at the same time comprising - manner (1999). Therefore the definition used as a point of reference in this report will be:
Smart Grid is a bi-directional electric and communication network aimed to increase the efficiency of the operation of the grid through small to large-scale generation, transmission, distribution and usage.

27
In order to extend the Smart Grid concept, a CATWOE for the system can be seen in table 1 below.
There are some characteristics of the Smart Grid energy system that are frequently mentioned in the literature that describes what the Smart Grid does.
3.3 Smart Grid Characteristics Below some of the most significant characteristics of the Smart Grid are mentioned, in an attempt to describe what Smart Grid does. Since there is no clearly defined concept in the literature, the characteristics are based on what is mentioned. The characteristics of the Smart Grid are developed to improve the existing grid in order to meet future demands and requirements. Most importantly the Smart Grid depicts a different picture than the traditional energy system; instead of having a one-way flow of both electricity and communication, there is a two-way flow where all generators, households, devices etc. will be interconnected (Farhangi, 2010). The last paragraph Geographical Motivators describes how the importance of the characteristics varies with prerequisites in different parts of the world.
Increases Security, Reliability and Efficiency in the Grid With more meters and sensors in the electricity grid, more information will be available to the utility companies. This will enable a fast response to incidents occurring in the grid, even when many happen simultaneously and interdependently. The autonomous grid can dynamically react to changing factors such as the ambient conditions, failures and increased or decreased consumer demand. Information can therefore increase security and reliability of the grid which is two keywords mentioned in the Smart Grid context (Erol-Kantarci & Mouftah, 2011). The flow of more information in the grid together with new technology will also enable self-healing grids that can be switched to other routes (Güzelgöz, Arslan, Islam, & Domijan, 2011). One of the most significant differences between the existing grid and the Smart Grid is that Smart Grid will handle complexity in a more efficient and effective way (European Commission, 2011).
Activates the Consumer The consumer plays a central part in the future electricity grid, and microgeneration becomes an important feature (Vaccaro, Velotto, & Zobaa, 2011). With microgeneration the consumer takes an active part in the electricity generation and can help optimize the operation of the system. The
Table 1, CATWOE elements
CATWOE element
Customers Supplier and users
Actors Utility companies (Generation, transmission & distribution), suppliers in power technology, ICT companies, grid users, application and service providers, meter operators, and power exchange platform operators
Transformation From the traditional grid to a smarter grid in order to maintaining security of supply and reliability
Worldview Smart Grid is a necessary and unavoidable transformation of the energy system
Owners Utility companies (Generation, transmission & distribution), suppliers in power technology, ICT
companies, Energy users
Environment Regulations and market condition

28
Figure 3, Prosumer (European Technology Platform, 2010)
distinction between the producers and consumers are then blurred out and will be more replaced by a prosumer, a user that may act both as a producer and a consumer at various times during the day (Cecati, Citro, Piccolo, & Siano, 2011).
The image of the prosumer is depicted in figure 3 where one can see the prosumer takes an active part of the energy system surrounded by the traders and retailers (European Technology Platform, 2010). The consumer is also thought to have an active role in the home, where it through visualization services can decrease its energy usage or shift the energy load in order to save money. Others claim that the consumer will take a passive role in reducing energy usage and load shifting rather by self-controlled technology (Clastres, 2011).
Communicates The two-way communication is another significant feature of the Smart Grid. With more installed renewable energy, both from large-scale power plants and microgeneration, the requirements on the grid increases and the two-way communication systems are required. It is also needed in order to enable active participation from the consumers (Farhangi, 2010). Given the big investments needed in ICT to implement a more intelligent grid it is likely that the development will be evolutionary rather than revolutionary (Farhangi, 2010).
Geographical Motivators There are various driving forces for a Smart Grid development in different parts of the world, e.g. in the U.S, in Japan and in Europe. In the U.S the most important driving force is security of supply and reliability linked to the problems with devastating blackouts. In Japan and Korea there is a larger focus on integration with technology home appliances. Technology drives the development since the domestic companies see their opportunity to use their own user interface on the market to create installed-based opportunities. Whether as, in Europe, and the Nordics in particular, Smart Grid development is very much driven by ambitious goals for renewables (Lundström, 2013). Therefore the focus of the different characteristics described above will have varying importance, depending on geographical location, e.g. activating the consumer is of greater importance in Korea since it enhances the business cases for in-home technologies. As previously mentioned, in this thesis the focus is on the Nordic countries, where the primarily motivator is the ambitious goals for renewables.
The paragraphs above describe what the Smart Grid does and the following paragraph gives a short and high level description of how that could be done.

29
3.4 Realize Smart Grid The following is a non-exhaustive high level paragraph aimed to answer the question how the Smart Grid characteristics described in the previous section can be realized.
To increase security, reliability and efficiency in the grid more meters and sensors are needed. Also, to handle the data the meters and sensors will generate, more advanced information and communication systems need to be implemented to optimize the operation of the grid. In order to increase security, reliability and efficiency there is also a need for implementing new updated power technology devices in the grid (European Commission, 2011).
With the aim of providing the possibility for more intermittent energy to be fed in to the grid the regulatory power needs to be adjusted so that it can be more flexible and can be turned on or off in a shorter time, but information and communication systems must also be implemented to be able to meet the growing demand on a real-time basis. In order to increase security, reliability and efficiency in the grid, the right regulations will be needed to facilitate cross-border trading of power to increase importing possibilities when there is deficit of energy (U.S. Department of Energy, 2008).
To allow for active and flexible consumers, information and communication systems will be needed to enable information to the consumer, possible automation of home- or industry devices, and information about the customer to the billing system. Most importantly an interest from the consumers is needed as well as economic incentives for being an active or flexible consumer (European Commission, 2006).
To prepare for microgeneration a toolbox of technical solutions needs to be developed, in order to enable for all types of produced energy to be fed in to the grid. The technical solutions need to be cost effective and should be compatible with the existing grid. For all technical solutions needed to develop Smart Grid it is important that both technical standards and communication protocols are developed (European Commission, 2006).
Even though meters are important in realizing the Smart Grid, it is important to state that the Smart Meter is only an enabling technology for Smart Grid. Having a Smart Meter is not Smart Grid, however using the Smart Meter and other technical appliances in order to improve operations efficiency, cost efficiency and reliability of the grid is however in line with a Smart Grid development (U.S. Department of Energy, 2008).
To summarize from the above, some of the competences and activities that are needed for Smart Grids are: regulation actions, system knowledge, IT skilled electrical technicians and innovators, and entrepreneurs (Nordström, 2010). In addition collaboration between many different industries and parties together with new business models will be needed.
As seen above ICT systems are crucial to enable Smart Grid development. Smart Grid communication is the focus of this report, and will therefore be presented in more detail in the next chapter.

30
4 Smart Grid Communication The communication system is, as mentioned, essential for the Smart Grid infrastructure. The new infrastructure with the integration of advanced technologies and applications will generate a much larger amount of data than before, data that will need refining into information, which in turn can be used for further analysis, real-time pricing and control methods. Therefore it is of great importance for utility companies to find the best-suited infrastructure technology to handle the bidirectional data transfer whilst being highly reliable, secure and cost-efficient. Smart Grid enhances the relationship between the power grid and the communication system (Güngör, Lu, & Hancke, 2010). The communication system described in most literature on Smart Grid could be divided into two main parts: the communication between the Smart Meter and the appliances, and between the Smart Meter and the utility companies’ data centers (Güngör, et al., 2011), which again shows how focused the current literature is around Smart Meters. This master thesis will primarily focus on the communication infrastructure between the Smart Meter and the utility, which is not limited to Smart Meter data.
4.1 Smart Grid Communication Infrastructure Although there is no consensus view on the communication infrastructure some terminologies are commonly adopted by the power utilities with regards to the architecture. These include home area network (HAN), local area network (LAN) and wide area network (WAN). The HAN refers to the network inside the customer’s premises beyond the Smart Meter, used for communicating loads, appliances and sensors;; the LAN is the network between the customer’s premises and the substations and includes the integrated Smart Meters, gateways and field components; lastly the WAN is the network connecting to the utility asset, e.g. substations, power plants etc. The high level common communication infrastructure architecture is illustrated in figure 4 below. The HAN and the LAN may be integrated (Güngör, et al., 2011). In some cases referring to Smart Grid communication the term neighborhood area network (NAN) can be used instead of LAN (Güzelgöz, Arslan, Islam, & Domijan, 2011). Last Mile Communication can also be used, i.e. the part of the communication that reaches the customer. The communication infrastruct-ure described is primarily applicable for Smart Meter data transfer. Figure 4, High level common communication infrastructure (Inspired by Luan, Sharp &
Lancashire, 2010)
31
4.2 Transition from AMR to AMI to Smart Grid In order for Smart Grid to increase the security and reliability of the grid it is important to handle the biggest and most important modernizations that have been done on the distribution network recently, which have been the introduction of automatic meter reading (AMR) systems. The AMR system enables the utility companies to remotely read the consumers’ electricity usages records as well as in some cases provide information about blackouts and alarm functions. The AMR system brought big infrastructure investment costs on the utilities, and was thought to be very attractive. Although, as time passed, it showed that the AMR systems did not address the demand side management aspects, which was important for the utilities. The AMR systems only provide a one-way communication, from the reader to the billing system and to the operations centers, and not a two-way communication platform that can enable the utilities to take corrective actions based on the information provided by the readers. Therefore, AMR systems are being taken over by advanced meter infrastructure (AMI) systems which can provide the necessary two-way communication needed (Farhangi, 2010).
AMI systems can, besides enabling a two-way communication, modify customers’ service-level parameters. The utilities can now get immediate information about demand, both individual and aggregated, impose limitations on usage and have the possibility to try various revenue models to reduce costs and maximize profit. With these characteristics, AMI satisfy the utilities’ targets for load management as well as for revenue protection. Since technology is ever evolving it is getting increasingly important to possess AMI systems that can be compatible with yet-to-be-realized technologies within the Smart Grid development (Farhangi, 2010), which requires automatic and remote software updates. Further, utilities are to a larger extent trying to find ways to combine an outage management system (OMS) with a geographical information system (GIS), utilizing both AMI systems as well as grid-side applications. Utilities focus more and more on the business case, not only through the combination of demand response and AMI, but also by adding aspects such as automation and volt control (Tai & hÓgáin, 2009).
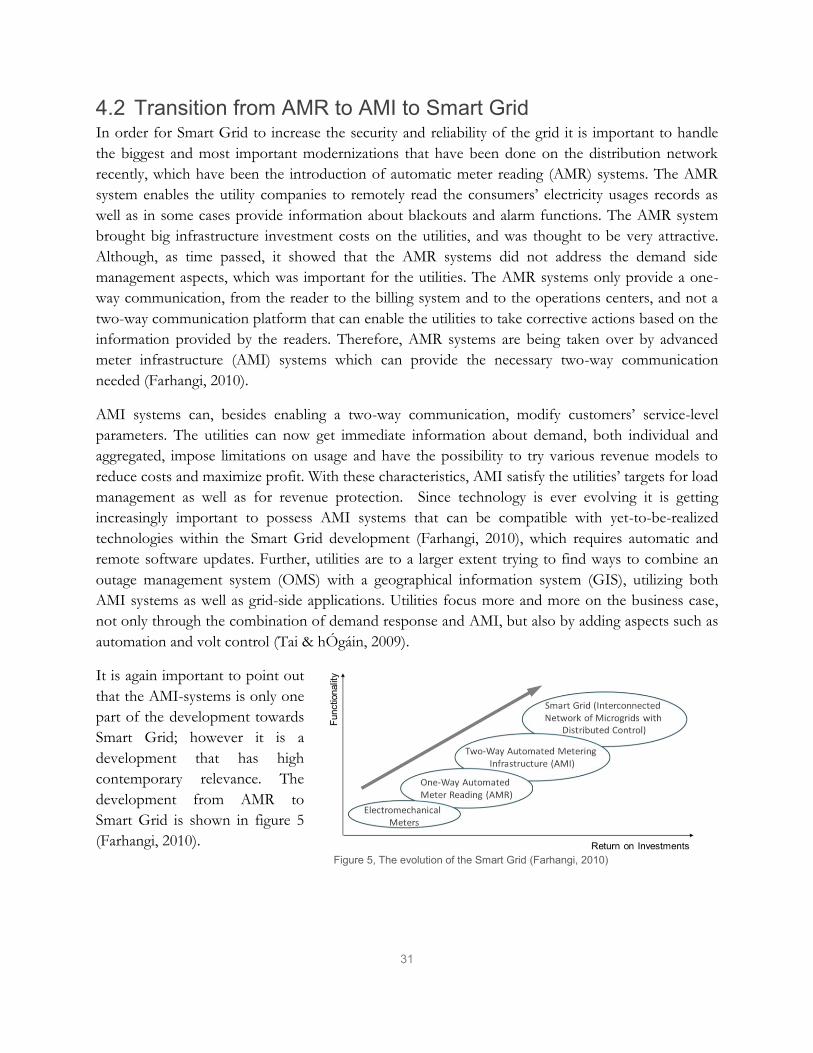
It is again important to point out that the AMI-systems is only one part of the development towards Smart Grid; however it is a development that has high contemporary relevance. The development from AMR to Smart Grid is shown in figure 5 (Farhangi, 2010).
Figure 5, The evolution of the Smart Grid (Farhangi, 2010)
32
4.3 Communication Network Requirements Communication networks in the Smart Grid infrastructure undertake an important responsibility of information exchange since it is part of the foundation for devices in the network to work synergistically. Insufficient communication performance will limit the Smart Grid from achieving full energy efficiency, quality of service and can pose possible damages to the power grid system (Wang, Xu, & Khanna, 2011). A number of independent organizations all over the world propose and endorse expectations and visions for the Smart Grid power system (Kannberg, et al., 2003). However, there is not a unified view on what Smart Grid is and no universal accepted requirements on the communication system needed to enable Smart Grid. Below are security, reliability and Quality of Service briefly described as requirement areas for Smart Grid communication.
Security Security in general is an issue directly for both the utility companies and for the private consumer. For the utilities’ grid control and billing purposes, secure information transfer and storage are of high importance. Efficient security mechanisms for the whole system ought to be developed and standardized to avoid attacks aimed at the backbone or the distribution system (Güngör, Lu, & Hancke, 2010).
Smart Meters in particular increase the risk of attacks since they increase the number of contact points to the energy system and can be manipulated. Hackers who are able to compromise a meter can easily monetize their vulnerability by fabricating false electricity readings. Similarly the old readers could be shifted upside down to allow the meter to count backwards. However, the Smart Meters could allow for remote hacking and allow hackers to launch a large scale attack on the energy system if not proper security measures are undertaken (McDaniel & McLaughin, 2009), as before mentioned.
While consumer perception generally is positive towards Smart Grid in general and Smart Meters in particular, one common reason for negative attitude is experienced risk to security and privacy (Krishnamurti, et al., 2012). Hackers could monitor data between the private homes and the connection point if it is not encrypted and through that channel obtain a lot of information about the customers’ behavior, which could facilitate burglaries (Lisovich, Mulligan, & Wicker, 2010).
Reliability The reliability has always been the major focus in power grid development, design and operation; it is a key factor for the utility companies and the highest prioritized requirement. Outages impose large costs for utilities: fault identification, fault correction, lost sales and depending on country there might be a penalty for the unreliable supply to the customer. Meeting the future challenges in the grid requires a gridwide IT structure that enables coordinated monitoring and control over the grid (Moslehi & Kumar, A Reliability Perspective of the Smart Grid, 2010).
The challenges in reliability are driven by multiple factors, one of them being the need for more capacity. The grid needs to operate closer to the capacity limit due to aging infrastructure and

33
insufficient conventional investments in the grid, increasing peak demand, utilization of distributed resources etc. Distributed generation causes congestion in grid since the power grid wasn’t originally built to handle the electricity fed into the medium or low voltage grid. Instead of increasing the capacity of the grid by expanding, information and communication system can help operating the grid closer to the capacity limit. The part of the ICT system realizing this is mission critical and reliability is of essence. However, other parts of the ICT systems such as billing information from the Smart Meters are non-critical and reliability is not as important (Moslehi & Kumar, 2010).
Quality of Service The reliability requirement on some of the data transfer calls for a need to implement a Quality of Service (QoS) mechanism. Flaws in performance can cause delays or outages that may compromise stability and therefore protocols based on best effort service will not be sufficient for the communication network in the Smart Grid, protocols applied need to support message prioritization to allow latency-intolerant, critical data prior to other network data traffic (Jeon, 2011). Hence, Güngör et al (2011) identifies two critical questions unique to Smart Grid:
How to define the QoS requirement in the context of Smart Grid. How to ensure the QoS requirement from the home appliance in the communications
network.
4.4 Communication Protocols The data transfer between the Smart Meter, distribution grid and the utility company uses different communication technologies mainly supported by either of two communication media, wired and wireless. Wireless solutions generally have a lower cost on infrastructure installation and facilitate installation on difficult, remote or unreachable locations. However, unlike wired solutions wireless solutions are often battery dependent, can have interference problems and data transmission over long distance can cause the signal to attenuate (Güngör, et al., 2011).
Since the condition for the energy systems vary widely depending on location, there is no universal standard solution. Instead several different techniques are deployed. The integration of disparate systems and functions as parts of a distributed system is believed to create problems caused by the absence of standards to ensure a common vocabulary among system components (Farhangi, 2010). In the following text, some common Smart Grid communication technologies and their employment are explained briefly. SCADA (supervisory control and data acquisition) is part of the traditional energy systems, primarily the transmission system, and will not be elaborated on.
Power Line Communication Power Line Communication, also known as Power Line Carrier, (PLC) uses existing power lines to transmit high speed data signals (2-3 Mb per second) between devices (Güngör, et al., 2011). The technique is used broadly on electric power lines today and has been used since the beginning of the 1920s (Silva & Whitney, 2002). Power Line Communication is an obvious choice for communication to the electricity meter since there already is a direct connection to the meter (Lewis,
34
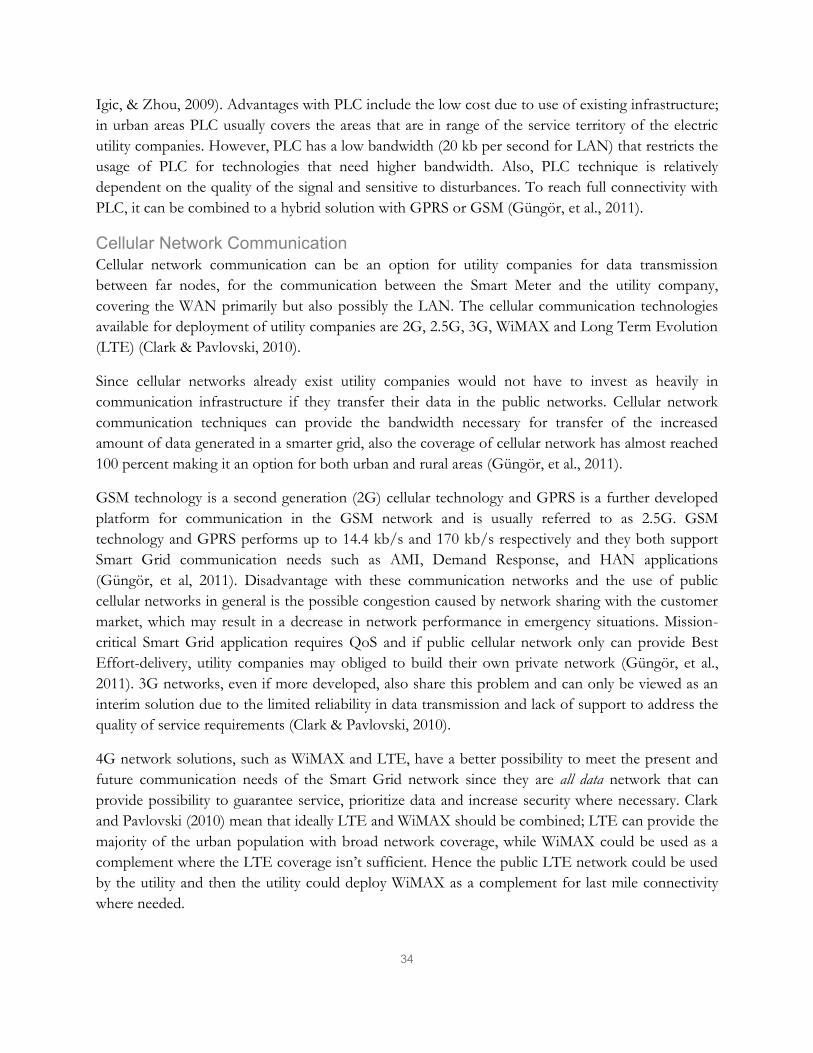
Igic, & Zhou, 2009). Advantages with PLC include the low cost due to use of existing infrastructure; in urban areas PLC usually covers the areas that are in range of the service territory of the electric utility companies. However, PLC has a low bandwidth (20 kb per second for LAN) that restricts the usage of PLC for technologies that need higher bandwidth. Also, PLC technique is relatively dependent on the quality of the signal and sensitive to disturbances. To reach full connectivity with PLC, it can be combined to a hybrid solution with GPRS or GSM (Güngör, et al., 2011).
Cellular Network Communication Cellular network communication can be an option for utility companies for data transmission between far nodes, for the communication between the Smart Meter and the utility company, covering the WAN primarily but also possibly the LAN. The cellular communication technologies available for deployment of utility companies are 2G, 2.5G, 3G, WiMAX and Long Term Evolution (LTE) (Clark & Pavlovski, 2010).
Since cellular networks already exist utility companies would not have to invest as heavily in communication infrastructure if they transfer their data in the public networks. Cellular network communication techniques can provide the bandwidth necessary for transfer of the increased amount of data generated in a smarter grid, also the coverage of cellular network has almost reached 100 percent making it an option for both urban and rural areas (Güngör, et al., 2011).
GSM technology is a second generation (2G) cellular technology and GPRS is a further developed platform for communication in the GSM network and is usually referred to as 2.5G. GSM technology and GPRS performs up to 14.4 kb/s and 170 kb/s respectively and they both support Smart Grid communication needs such as AMI, Demand Response, and HAN applications (Güngör, et al, 2011). Disadvantage with these communication networks and the use of public cellular networks in general is the possible congestion caused by network sharing with the customer market, which may result in a decrease in network performance in emergency situations. Mission-critical Smart Grid application requires QoS and if public cellular network only can provide Best Effort-delivery, utility companies may obliged to build their own private network (Güngör, et al., 2011). 3G networks, even if more developed, also share this problem and can only be viewed as an interim solution due to the limited reliability in data transmission and lack of support to address the quality of service requirements (Clark & Pavlovski, 2010).
4G network solutions, such as WiMAX and LTE, have a better possibility to meet the present and future communication needs of the Smart Grid network since they are all data network that can provide possibility to guarantee service, prioritize data and increase security where necessary. Clark and Pavlovski (2010) mean that ideally LTE and WiMAX should be combined; LTE can provide the majority of the urban population with broad network coverage, while WiMAX could be used as a complement where the LTE coverage isn’t sufficient. Hence the public LTE network could be used by the utility and then the utility could deploy WiMAX as a complement for last mile connectivity where needed.
35
Wireless Mesh/Radio A wireless mesh network is a flexible communication network consisting of radio nodes organized in a mesh topology. New radio nodes can easily be added to the network and each of the nodes have the possibility to act as an independent router. The network have the possibility to self-heal enabled by redundancy; if a node should fail, the remaining functioning nodes can reroute and maintain the communication among each other, either directly or indirectly via another node (Yarali, 2008).
Wireless mesh networking is scalable, cost efficient, self-healing, dynamic solution for Smart Grid communication. In urban areas the coverage can be good and the ability of multi-hop routing (Yarali, 2008). The major challenges are the network capacity, fading and interference. Since the network requires redundancy to create reliability, the number of needed nodes can increase quickly, which will have an impact on cost. Furthermore, since metering data will pass through several access points encryption will be needed to ensure security (Güngör, et al., 2011).
Digital Subscriber Lines Digital Subscriber Lines (DSL) uses the wires of the telephone network and is a high-speed digital data transmission technology. DSL technologies are typically used as last mile connectivity and it is difficult to generally characterize the performance of DSL technology since the throughput is highly dependent on the distance between the customer and the serving telephone exchange. The technology Asymmetric Digital Subscriber Lines (ADSL) allows for better throughput for data over voice telephone line since it uses frequencies not used by the voice service, frequencies around 1 MHz are common on ADSL enabled voice telephone lines (Laverty, Morrow, Best, & Crossley, 2010).
As for other wired solutions, e.g. PLC technology, the DSL technology has the advantage of already being widespread which decreases the installation cost in urban areas, however the cost of installing fixed infrastructure in rural areas may not be feasible for Smart Grid usage. Potential downtime and reliability also limits the use to non-critical activities in the Smart Grid communication system. Further, the DSL technology has a higher bandwidth then PLC technology, but greater efforts are made in standardizing PLC which makes it more suitable for Smart Grid (Güngör, et al., 2011).
ZigBee ZigBee, a suite of high level communication protocols, uses small and low-power digital radios and has coverage of 20-100 meters. To transmit data over longer distances ZigBee protocol is preferably used as a wireless mesh network and is low in power usage, complexity, cost of deployment and data rate and is a suitable technology to be used for Smart Grid appliances within the home area network (Peizhong, Iwayemi, & Zhou, 2011). ZigBee Smart Energy Profile has, due to its characteristics, been identified as the most suitable standard for device communication and information within the HAN of National Institute of Standard and Technology in the U.S (NIST, 2010).

36

37
Nordic Power System The Nordic power system starts by presenting the One-Way Power System to give an overview of actors and system characteristics of the Nordic market. After follows a description of Electricity Generation and Consumption and then the section about the transformation Towards a Nordic Harmonization that addresses the vision and key issues for the collaboration between the countries. The last part of Nordic power system elaborates on Policies and Directives in order to get high level insight of common regulations for the Nordics.

38

39
Figure 7, A general illustration of the Nordic power system (Svenska Kraftnät, 2013)
GENERATION POWER EXCHANGE NORD POOL
RETAILERS
TRANSMISSION DISTRIBUTION
END USER
5 One-Way Power System The electricity system in the Nordic countries is well interconnected and the countries share a common electricity market, Nord Pool, that is known for being successful worldwide, producing electricity from a variety of energy sources (Ea Energy Analyses, 2012). As figure 6 shows, Norway, Sweden, Finland and Denmark is referred to as the Nordic countries in this context.
The power grid is a vital part in the Nordic society as electricity is rather seen as a human right than a privilege. The physical power systems within the Nordic countries basically look the same. The power system is characterized by a one directional power flow, from the generation in the power stations in one end via transmission lines and distribution systems to the final user in the other end, which is illustrated in figure 7 below. The large central power stations locations are determined mainly by two factors; access to production resources and economies of scale. The Nordic countries differ a lot in terms of conditions and assets. The market for generation is highly competitive in contrast to the transmission and distribution system operated by monopolies and natural monopolies respectively. The natural monopolies are run as either regional or national bodies under the control of energy authorities (European Commission, 2006). The main actors in the Nordic energy system are shortly presented on the next page.
Figure 6, The Nordics (Statnet, 2013) In this report Norway, Sweden, Finland and Denmark is referred to as the Nordic Countries
40
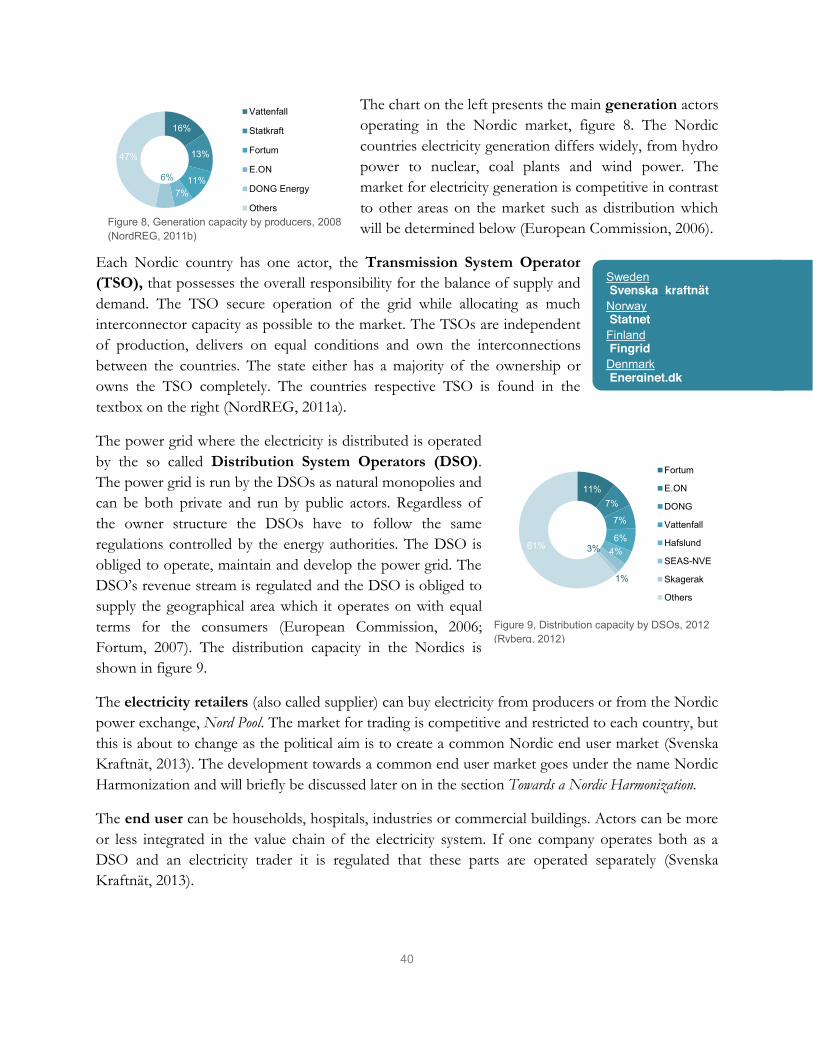
The chart on the left presents the main generation actors operating in the Nordic market, figure 8. The Nordic countries electricity generation differs widely, from hydro power to nuclear, coal plants and wind power. The market for electricity generation is competitive in contrast to other areas on the market such as distribution which will be determined below (European Commission, 2006).
Each Nordic country has one actor, the Transmission System Operator (TSO), that possesses the overall responsibility for the balance of supply and demand. The TSO secure operation of the grid while allocating as much interconnector capacity as possible to the market. The TSOs are independent of production, delivers on equal conditions and own the interconnections between the countries. The state either has a majority of the ownership or owns the TSO completely. The countries respective TSO is found in the textbox on the right (NordREG, 2011a).
The power grid where the electricity is distributed is operated by the so called Distribution System Operators (DSO). The power grid is run by the DSOs as natural monopolies and can be both private and run by public actors. Regardless of the owner structure the DSOs have to follow the same regulations controlled by the energy authorities. The DSO is obliged to operate, maintain and develop the power grid. The DSO’s revenue stream is regulated and the DSO is obliged to supply the geographical area which it operates on with equal terms for the consumers (European Commission, 2006; Fortum, 2007). The distribution capacity in the Nordics is shown in figure 9.
The electricity retailers (also called supplier) can buy electricity from producers or from the Nordic power exchange, Nord Pool. The market for trading is competitive and restricted to each country, but this is about to change as the political aim is to create a common Nordic end user market (Svenska Kraftnät, 2013). The development towards a common end user market goes under the name Nordic Harmonization and will briefly be discussed later on in the section Towards a Nordic Harmonization.
The end user can be households, hospitals, industries or commercial buildings. Actors can be more or less integrated in the value chain of the electricity system. If one company operates both as a DSO and an electricity trader it is regulated that these parts are operated separately (Svenska Kraftnät, 2013).
16%
13%
11% 7%
6%
47%
Vattenfall
Statkraft
Fortum
E.ON
DONG Energy
OthersFigure 8, Generation capacity by producers, 2008 (NordREG, 2011b)
11% 7%
7%
6% 4% 3%
1%
61%
Fortum
E.ON
DONG
Vattenfall
Hafslund
SEAS-NVE
Skagerak
Others
Figure 9, Distribution capacity by DSOs, 2012 (Ryberg, 2012)
Sweden Svenska_kraftnät
Norway Statnet
Finland Fingrid
Denmark Energinet.dk

41
5.1 Interconnected System The development of the Nordic electricity market has primary focused on the creation of an efficient and competitive wholesale market facilitated by strong interconnections between the countries (Ea Energy Analyses, 2012).
The power systems within the Nordic countries are combined as one whole synchronous Nordic power system through the interconnected transmission grid, excluding western Denmark. The Nordic system is also connected to Germany, Estonia, Poland, Netherlands and Russia (NordREG, 2012a). The first electricity transportation connection between the Nordic countries was established in the early 60’s. The objective was originally to meet the need for the individual countries but additional benefits was recognized such as enabling of a more efficient use of generation capacity when taking advantage of the differences within the system and the interconnection also enhanced security of supply (NordREG, 2011a). The TSOs have been cooperating between the countries since the first interconnection was built. The interconnection has expanded gradually over the years to better handle daily and yearly variations of electricity demand (Grönkvist, Stenkvist, & Paradis, 2008). Table 2 shows the interconnection capacity between the countries.
In order to handle structural congestions and improve market efficiency the Nordic market is divided in price areas. The total number of areas is twelve, Norway is divided into five price areas, Sweden four areas, Denmark is divided into two and Finland is not divided into price areas. The price areas help to identify problem areas when demand is high and work as an indicator for the need of future grid reinforce investments. Significant reinforcements are planned in the Nordic transmission system in the coming years, but it is not economically beneficial to invest to be able to meet demand for all hours. In 2011 the price differed during 72 percent of the hours in one or more of the price areas due to limitations in the physical power system. Still there are less price variations within the Nordic region compared with adjacent countries such as Germany. The Nordic stability is mainly due to the great supply of hydro power. Trading between the Nordics and other countries is mainly driven by price variations. The Nordics typically exports when the load is high and import when the load is low. The average electricity price is lower in the Nordics compared to Germany, and the trading is a way for both parts to use the total production assets more efficiently (Nord Pool, 2013a; NordREG, 2012a; Damsgaard, 2008).
Table 2, Inter-connection capacity between the Nordic countries in MW, 2012 (horizontal axis; from and vertical axis; to) (Ea Energy Analyses, 2012)
Denmark Finland Norway Sweden
Denmark - - 1 400 2 440
Finland - - 100 1 750
Norway 1 000 100 - 3 750
Sweden 2 040 1 050 3 450 -

42
6 Electricity Generation and Consumption The Nordic countries differ a lot in terms of topography, natural resources and therefore also in terms of how the electricity is generated. The supply of primary energy sources is determined by three main factors: assets, infrastructure and climate policies (Grönkvist, Stenkvist, & Paradis, 2008). The Nordics are net exporters of energy; in 2011 the generation was twice the size of the Nordic energy demand (IEA & Nordic Energy Research, 2013). Norway is the country with highest self-sufficiency grade of primary energy (Grönkvist, Stenkvist, & Paradis, 2008).
Electricity usage is relatively high in the Nordics due to the climate; the high level of electricity heating and also a high amount of energy intensive industries results in larger electricity consumption. The Nordics are very dependent of reservoir levels and inflow due to the high level of hydro power. In year 2011 total electricity generation in the Nordics was 370 TWh, a decrease with 3 TWh or 1 percent from the year before. By the end of 2010 the reservoir level was 49 percent compared to 2011 when it was 79 percent. The Nordic energy usage amounted to 379.6 TWh in 2011, a decrease with 4.4 percent compared to 2010. The decrease was due to the weak economy, weather conditions and a decrease of demand for electric heating. The electricity production is dominated by hydro power, nuclear power, thermal power and wind power, shown in figure 10. Hydro power represents about half of the electricity produced in the Nordics and as a result the dependency of water inflow is significant, as previously mentioned. The variation of produced hydro power can vary much, up to 70 TWh from one year to one other. Denmark is the only country in the Nordics without hydro power, Finland is a small actor and Norway and Sweden stands for the main part of the production from hydro power. Nuclear power is only present in Sweden and Finland (NordREG, 2012a).
The Nordics has a high share of renewables, corresponding to 30 percent of the renewables produced in the EU countries, and the share of non-hydro renewables is increasing. In 2020 the total wind power capacity in the Nordic countries is expected to be 15 000 MW generating 44 TWh per year. This implies significant challenges for the energy system due to increased wind; variation in generation and difficulties in accurately prediction generation (ENSTO-E, 2010). The Nordics are in a favorable position with hydro power, geothermal power and nuclear, making it at large a decarbonized electricity system. Even though hydro power is a great source of renewable electricity it is not likely that either Norway or Sweden would expand their existing range in order to protect the nature (IEA & Nordic Energy Research, 2013; Grönkvist, Stenkvist, & Paradis, 2008). The vast hydro power resources is of significant importance for the Nordic countries and gives the region an increasingly important position as a provider for flexible electricity responding to non-hydro renewables energy plants in Central European countries (IEA & Nordic Energy Research, 2013).
50%
25%
20%
3% 2% Hydro power
Thermal power
Nuclear power
Wind Power
Other
Figure 10, Nordic electricity generation in 2010 (Ea Energy Analyses, 2012)
43
7 Towards a Nordic Harmonization The Nordics has a long history of collaboration. With the objective to enhance competition and strengthen the consumer’s position the Nordic countries initiated the deregulation of their electricity markets during the 90’s. The power exchange, Nord Pool Spot was established in 1996 as collaboration between Norway and Sweden, after a few years Finland and Denmark also acceded to the common power exchange (Nord Pool, 2013b). Nord Pool Spot is the largest and oldest international power exchange in the world and it is known as both efficient and liquid. In order to utilize the Nordic generation capacity in an optimal way, the electricity price in the Nordic wholesale market is determined on a day-ahead auction process on Nord Pool (NordREG, 2012a). The excellent electricity wholesale market, Nord Pool, in combination with the richness of resources for electricity production the Nordic countries have the advantage of having relatively low electricity prices compared to OECD countries (IEA & Nordic Energy Research, 2013). The Nordic counties all have increased amount of renewable energy sources on their agendas which will imply new challenges for the power system. In order to cope with the challenges the Nordic power system and electricity market will develop into a smart grid (Nordic Energy Research, 2011).
The next step on the agenda for the Nordic countries is to extend the collaboration between the countries with a common end user market, the project is discussed as a Nordic Harmonization. The Nordic Energy Regulators, NordREG, owns the responsibility of the harmonization and has stated the vision;; “All Nordic electricity customers will enjoy free choice of supplier, efficient and competitive prices and reliable supply through the internal
Nordic and European electricity market” (NordREG, 2013). None of the Nordic countries has a supranational body with decision-making power or control of regulations and laws, and therefore the political engagement will be vital for the Nordic harmonization and it is important that the collaboration can go on regardless of the political situation in each country. A Nordic retail markets demands a harmonization of both internal and external processes for the actors on the market (Larsen & Odenbrand Linder, 2012).
It is suggested, but not required, that Smart Meters should be introduced to the entire market. Each independent country owns the decision; the social-economic benefits should be proven to outweigh the cost before a mandatory rollout is initiated. The functional requirements and timetable for rolling out Smart Meters is determined not to be critical and has therefore been up to each individual country to determine, and therefore Smart Meter status differs as will be explained in Country Overviews (NordREG, 2012b).
All Nordic electricity customers will enjoy free choice of supplier, efficient and competitive prices and reliable supply through the internal Nordic and European electricity market.

44
NordREG has stated that the most important business processes to establish is a well-functioning retail market where there is information exchange between the actors participating on the electricity market. NordREG has pointed out issues that are needed to take in to consideration. Some of the issues identified are briefly presented below and listed in the textbox on the right (NordREG, 2012b).
As the customer is in the focus for the Nordic harmonization access to customer data is brought up as an important issue. A model called Supplier Centric Model is suggested where the customer only needs to have contact with the retailer and not the DSO. The supplier will then be responsible of providing other actors with customer data if needed. The suggestion of a common Nordic data hub is partly a result of the issue about access to customer data (NordREG, 2012c). The Nordic harmonization will result in regulatory changes for each country as the market place will be one instead of four (five including Iceland). The actors on the markets will face changes, primarily different requirements on IT systems and business processes (NordREG, 2012c).
Billing is addressed as an issue regarding correctness of information given in the customers’ bill and also combined- or separate bills for grid fee and usage and in addition who the actor responsible for sending the bill should be in case of combined bills. NordREG considers billing to be a critical issue in the harmonization and therefore advocates compulsory combined bills performed by the retailer that charges the end user for both the grid fee and consumed electricity (NordREG, 2012b).
Even though differences between the Nordic countries supplier switching models are minor, NordREG finds it relevant to harmonize the markets in order to minimize barriers to entry and enhance the end users’ ability to be active in the choice of supplier. Therefor supplier switch is addressed as an issue of relevance (NordREG, 2012b).
Another issue that is addressed in the context of Nordic Harmonization is moving. When the end user moves, information exchange is required between the DSO and supplier. Today there are only regulations concerning moving in Norway and Denmark, and it is stated that it needs to be regulated likewise all over the Nordics to some extent. One step is to make it clear which actor the end user initiate the contact with (NordREG, 2009).
The DSO is responsible for meter reading in all Nordic countries and the process of providing metering data to other actors will be regulated across the region, but the actual reading could be outsourced to a service provider (NordREG, 2009).
There is a need for information exchange between DSOs and other actors on the market. The importance for actors to be able to use the same IT system not depending on specific country’s regulations is recognized and a harmonization of information exchange is therefore critical (NordREG, 2012c).
Issues Addressed Access to Customer Data Billing Supplier Switch Moving Meter Reading Information Exchange

45
8 Policies and Directives The significant role that energy possesses in a modern society also makes it a vital political question. Highlighting the importance of the climate aspect is a visible trend in the Nordics, a trend represented in European policy actions that are of great importance to the market. Short term policies will determine the primary energy sources in the energy mix and long term also affect the development of new technologies, which will have even greater effects on the use of primary energy sources (Grönkvist, Stenkvist, & Paradis, 2008).
The Nordics has a genuine history of collaboration and implementing environmental policy measures such as CO2 and energy taxes, which have contributed to a relatively high level of renewables. The current power system is shifting towards fossil free and more renewables will be implemented (Krook-Riekkola, 2013). The increase of renewables will have great implications on the market where larger price variations is expected as well as an increased need for reserve capacity and expanded transmission capabilities (Damsgaard, 2008). In order to ease the transformation and make it more cost efficient for the Nordic countries with high ambitions and targets, a system approach is of great importance (IEA & Nordic Energy Research, 2013). Both individually and collectively the Nordic countries has set ambitious climate and energy agendas compared to the rest of the world with challenging targets. Sweden and Denmark are members of EU and as Norway is a member of the European Economic Area (EEA), as a consequence all Nordic countries follow energy related directives from EU (IEA, 2011a). The Nordic EU members have set their targets even higher than given EU 20-20-20 targets, and Norway has equal targets (IEA & Nordic Energy Research, 2013). EU decided on a new energy efficiency directive in 2012 with the objective to ensure the 20-20-20 targets by establishing national indicative action plan towards those targets as the old directives only where considered to reach half way. The energy efficiency directive comprises initiatives to handle market failures, affecting efficiency in the supply and usage of energy and is also formulated to remove barriers in the energy market (European Commission, 2012). In the Smart Grid sector EU has initiated the European Technology Platform for Electricity Networks of the Future, also called Smart Grids ETP, a link between EU related initiatives (Smart Grids ETP, 2013). Smart Grid ETP is a forum for technology research, policies and development of pathways for the Smart Grid sector. The EU has also started to develop network codes that are sets of rules that will apply to one or many parts of the electricity system. Common rules are needed for network operators, generators, retailers and consumers to operate more effectively, resulting in a well-functioning cross-border electricity market (ENTSO-E; European Commission, 2013).
Nordic harmonization as well as Smart Grid development is on the agenda for the Nordic countries. In the following section the countries where interviews for the research has been performed will be further elaborated on in terms of regulations and current state related to Smart Grid development. At the end of the following chapters a Comparative and Summering Table is found.
Climate policies will in the long term affect the development of new technology

46
47
Country Overviews This part of the report gives an overview of conditions for the electricity system for the countries included in the research: Sweden, Denmark and Norway. The conditions for the electricity system are needed since they define the conditions for Smart Grid development.

48

49
9 Sweden Sweden has a population of 9.5 million (SCB, 2013a) and is the largest country in the Nordic region, both in terms of area and population. The population is concentrated around the largest cities: Stockholm (capital), Gothenburg, Malmoe, Uppsala etc. Stockholm with surroundings has a population of almost 2.1 million. Stockholm is northern Europe’s fastest growing city;; in 2011 the population increased with 37 000 people, which stood for 55 percent of the total growth in population that year (Boverket, 2012).
9.1 Energy Market The total energy supply has increased with 34 percent from 1970 to 2010 when it reached 614 TWh, but the share of primary energy carriers has shifted. For example the use of crude oil has decreased with 46 percent from 77 percent in 1970 to 31 percent in 2010. The first graph in figure 11 shows Sweden’s total energy supply by energy carriers in 2010. It is clear that nuclear power, crude oil and biofuels, peat & waste are the main energy carriers and constitute of 80 percent of the total energy supply in Sweden (Energimyndigheten, 2012a). The second and third graph in figure 11 shows Sweden’s gross energy production by fuel and gross energy usage per energy product in 2010.
The total energy usage in Sweden has slightly increased to 395 TWh in 2010 from 375 TWh in 1970 (Energimyndigheten, 2012a).
9.2 Electricity market The Swedish electricity market is a part of Nord Pool, initiated together with Norway in 1996 when the power market was deregulated. At that point, Nord Pool was composed of a power exchange between Sweden and Norway. The consumers, however, experienced a deregulated market in 1999 when the demand on hourly reading was revoked, which allowed consumers to choose their electricity supplier. Although there is still a monopoly on the electricity grid, companies own local parts of the distribution grid and consumers are automatically supplied by that part of the grid (Thorstensson, 2012).
The electricity usage accounted for almost 33 percent of the energy usage in 2010. During the last 10 years the electricity usage has been stable (SCB, 2013b), see figure 12 on the next page.
28%
2% 4%
19%
33%
14%
Oil
Natural gas
Coal and coke
Biofuels, peat &wasteElectricity
District heating
5%
29%
3% 29%
34%
Solid fuels
Pretolium Products
Natural gas
Nuclear heat
Renewable energy
31%
3% 4% 22%
11%
27%
2% Crude oil
Natural gas
Coal & coke
Biofuels, peat &wasteHydro power
Nuclear power
Others
Figure 11, From the left: total primary energy production, gross energy usage per fuel and gross energy usage by energy product after transformation, all breakdown figures from 2010 (Energimyndigheten, 2012b; Eurostat, 2013)

50
Figure 12, Sweden’s electricity usage 2000-2011 (SCB, 2013b)
The total installed electricity capacity in Sweden was 36 420 MW and the total production was 146 TWh. The production constituted of 45 percent hydro power, 40 percent nuclear power, 4 percent by wind power and 11 percent by biofuel and fossil based production, shown in figure 13. There is a difference in the installed capacity and the electricity production because all installed capacity is not available at all times, e.g. not all hydro power is used at the same time and the wind power is dependent upon the weather (Energimyndigheten, 2012a).
Figure 14 shows the share of different renewables in Sweden’s electricity production in 2010. As one can see hydro power covers the majority of the supply of renewable energy into the electricity production. Solar power only constituted of approximately 9 TWh in 2010 (too small share to be visualized in figure 14), exclusively coming from solar cells (Regeringskansliet, 2011).
The government of Sweden has adopted a national planning framework for wind power equivalent to reach an annual production of 30 TWh by 2020, of which 20 TWh is onshore wind power and 10 TWh offshore (Näringsdepartementet, 2012). Figure 15 shows the renewable electricity generation in the electricity certificate system, broken down by water, wind and biomass power from 2003 and 2011. It is obvious that there is an increase in the use of renewables for electricity production (Energimyndigheten, 2012b). Wind power production has increased dramatically in Sweden recent years; between 2010 and 2011 it increased by 74 percent from approximately 3.5 TWh to 6 TWh (Energimyndigheten, 2012a).
120
140
160
1990 1995 2000 2005 2010
TWh
81%
4% 15%
Hydro power
Wind Power
Biofuels
Figure 14, Contribution of renewable energy to electricity production per energy carrier, 2010 (Regeringskansliet, 2011)
0
5
10
15
20
25
2003 2004 2005 2006 2007 2008 2009 2010 2011
Elec
tric
ity p
rodu
ctio
n [T
Wh]
Wind power
Hydro power
Biofuels
Figure 15, Renewable electricity generation in the electricity certificate system, broken down by water, wind and biomass power (excluding peat), 2003-2011, in TWh (Energimyndigheten, 2012b)
45%
4%
4% 11%
Hydro power
Nuclear power
Wind power
Biofueled &fossil based
Figure 13, Electricity production by type of producer 2011 (Energimyndigheten, 2012a)

51
More than 40 percent of electricity used in Sweden comes from nuclear power (Energimyndigheten, 2012a). During the 1950’s Sweden was one of the most successful industry countries and in need of reliable and cost-effective power supply. The possibility of further expanding the hydro power was limited, there was no coal supply within Sweden and the import of oil increased. To avoid long-term import dependence, construction of nuclear power plants was considered the best option. In Sweden today there are twelve nuclear reactors at three different locations, ten of them are currently operating. Benefits with nuclear power are low-cost operation (although installation cost are very high), high security and no carbon dioxide emissions (Jönsson, 2011).
Before 2009 there was law against replacing the existing reactors with new ones. However, this was revoked by the government in 2009. Therefore it is today possible to replace existing reactors at their current position with more secure and effective ones, but not increase number of reactors beyond the ten operating today. The building of new power plants will not be subsidized (Svantesson, 2009).
Import and Export In Sweden there are cross-border links to Norway, Finland, Denmark, Germany and Poland to enable energy exchange, and there is work in progress to build a cable to Lithuania. Sweden’s use of increased use of biomass and decreased use of fossil fuels has made Sweden less dependent on import of primary energy carriers. Natural gas is today only imported from Denmark. Oil is mostly imported from Norway (Energimyndigheten, 2012a).
Regarding secondary energy carriers, electricity is imported and exported throughout the year. During warm years Sweden is often a net exporter of electricity and during cold years Sweden is often a net importer of electricity (Energimyndigheten, 2012b). Sweden both imported and exported most electricity to Norway in 2011.
Figure 16 shows the net import and export from an annual perspective. The net balance is dependent upon the weather in Sweden, as previously mentioned. From the figure it is clear that the variation between import and export have become more frequent with larger variations in the amount of net export and import in the recent fifteen years.
-15
-10
-5
0
5
10
15
1970 1975 1980 1985 1990 1995 2000 2005 2010
TWh
Figure 16, Sweden’s net imports (+) and net exports (–) of electricity 1970–2011 in TWh (Energimyndigheten, 2012b)

52
9.3 Distribution Market Structure The section below will describe the structure of the electricity market, with special focus on the factors influencing the electricity distribution.
Actors The institutions in Sweden influencing the energy market and the electricity market in particular include (IEA, 2013):
The Ministry of the Environment (Miljödepartementet) is the lead ministry for climate and environment policy. It is in charge of the global and EU climate change negotiations, as well as co-operation in the Nordic regions.
The Ministry of Enterprise, Energy and Communications is the ministry for energy policies. In Sweden, it is the Minister for Information Technology and Energy within the ministry that is in charge of the energy policies. The Swedish Electricity Safety Board is a part of the ministry and oversees safety of electricity supply.
The Swedish Energy Agency (Statens Energimyndighet) is a central governmental agency responsible for implementing energy policies. It acts under the Ministry of Enterprise, Energy and Communication. The authority’s tasks include carrying out energy forecasts, provide energy statistics, administrate the electricity certificate program, implement the sustainability criteria for biofuels, promote wind power development and to administrate the project-based mechanism from the Kyoto Protocol.
The Swedish Energy Markets Inspectorate (Energimarknadsinspektionen) was founded in 2008 and works under the Ministry of Enterprise, Energy and Communication. It is the independent regulator that supervises the electricity, natural gas and district heating markets. Regarding the consumer perspective, the Swedish Energy Markets Inspectorate is supported by the Swedish Consumer Agency (Konsumentverket).
Swedish national grid (Svenska Kraftnät) is the transmission system operator and it owns the national high-voltage electricity grid. It has the responsibility to maintain the overall balance, and the security of supply of electricity.
The Government decided in May 2012 to set up a Coordination Council for Smart Grid, with an associated knowledge platform. The council should set up a national action plan for the development of Smart Grid (Regeringskansliet, 2013).
Swedish DSOs are both local and national players. Sweden has approximately 170 DSOs, of which most are small and locally owned. The Swedish DSOs have monopoly over the geographical area they operate in (Energimarknadsinspektionen, 2013).
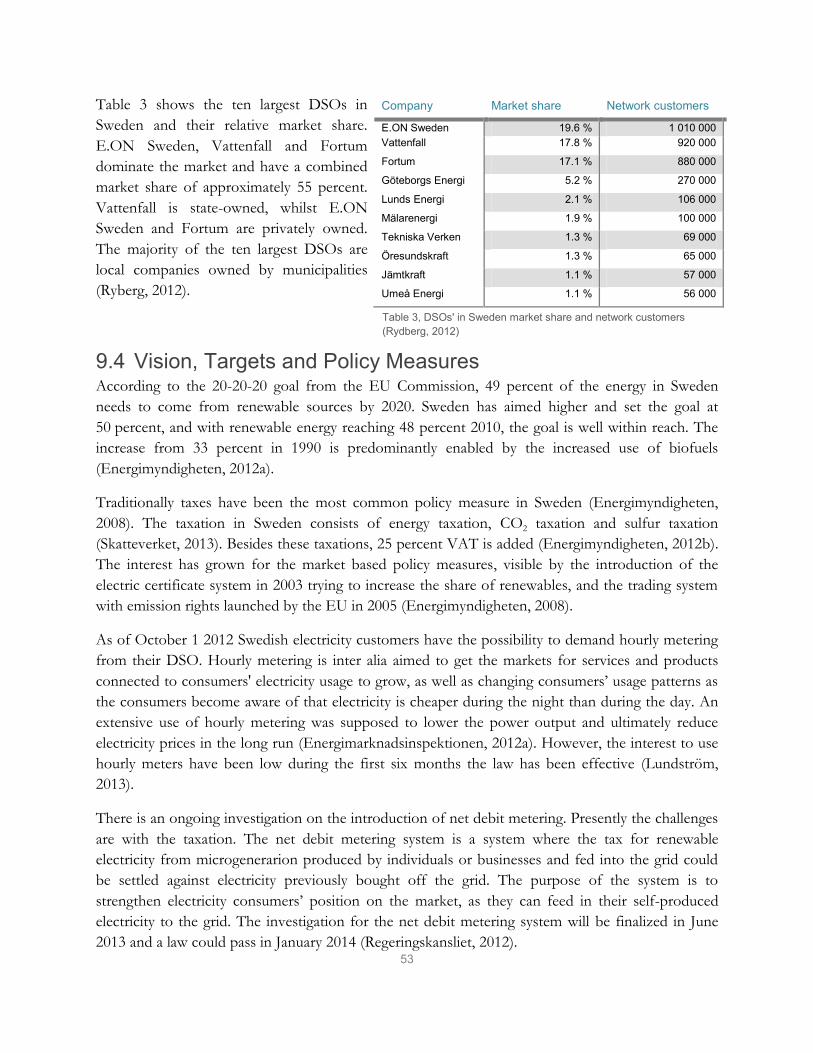
53
Table 3 shows the ten largest DSOs in Sweden and their relative market share. E.ON Sweden, Vattenfall and Fortum dominate the market and have a combined market share of approximately 55 percent. Vattenfall is state-owned, whilst E.ON Sweden and Fortum are privately owned. The majority of the ten largest DSOs are local companies owned by municipalities (Ryberg, 2012).
9.4 Vision, Targets and Policy Measures According to the 20-20-20 goal from the EU Commission, 49 percent of the energy in Sweden needs to come from renewable sources by 2020. Sweden has aimed higher and set the goal at 50 percent, and with renewable energy reaching 48 percent 2010, the goal is well within reach. The increase from 33 percent in 1990 is predominantly enabled by the increased use of biofuels (Energimyndigheten, 2012a).
Traditionally taxes have been the most common policy measure in Sweden (Energimyndigheten, 2008). The taxation in Sweden consists of energy taxation, CO2 taxation and sulfur taxation (Skatteverket, 2013). Besides these taxations, 25 percent VAT is added (Energimyndigheten, 2012b). The interest has grown for the market based policy measures, visible by the introduction of the electric certificate system in 2003 trying to increase the share of renewables, and the trading system with emission rights launched by the EU in 2005 (Energimyndigheten, 2008).
As of October 1 2012 Swedish electricity customers have the possibility to demand hourly metering from their DSO. Hourly metering is inter alia aimed to get the markets for services and products connected to consumers' electricity usage to grow, as well as changing consumers’ usage patterns as the consumers become aware of that electricity is cheaper during the night than during the day. An extensive use of hourly metering was supposed to lower the power output and ultimately reduce electricity prices in the long run (Energimarknadsinspektionen, 2012a). However, the interest to use hourly meters have been low during the first six months the law has been effective (Lundström, 2013).
There is an ongoing investigation on the introduction of net debit metering. Presently the challenges are with the taxation. The net debit metering system is a system where the tax for renewable electricity from microgenerarion produced by individuals or businesses and fed into the grid could be settled against electricity previously bought off the grid. The purpose of the system is to strengthen electricity consumers’ position on the market, as they can feed in their self-produced electricity to the grid. The investigation for the net debit metering system will be finalized in June 2013 and a law could pass in January 2014 (Regeringskansliet, 2012).
Company Market share Network customers E.ON Sweden 19.6 % 1 010 000 Vattenfall 17.8 % 920 000
Fortum 17.1 % 880 000
Göteborgs Energi 5.2 % 270 000
Lunds Energi 2.1 % 106 000
Mälarenergi 1.9 % 100 000
Tekniska Verken 1.3 % 69 000
Öresundskraft 1.3 % 65 000
Jämtkraft 1.1 % 57 000
Umeå Energi 1.1 % 56 000
Table 3, DSOs' in Sweden market share and network customers (Rydberg, 2012)
54
Smart Meter Status Sweden has a 100 percent penetration of Smart Meters. Sweden was the first country in EU to introduce legislation that forced DSOs to install Smart Meters for all electricity customers as well as the first country in EU to reach 100 percent penetration of Smart Meters. The process started in 2003, and was completed six years later. The legislation only states that meter readings should be done twelve times a year on a monthly basis from 1 July 2009. One reason for introducing the legislation was to provide the customer a more comprehensive bill based on actual consumption, which was thought to be an incentive for consumers to lower their energy usage (Hierzinger, et al., 2012). The metering service in Sweden is carried out by the DSOs as a monopoly business and the Smart Meters are also property of the DSOs (Vasconcelos, 2008).
There are approximately 5.1 million residential meters installed today. Sweden’s ten largest DSOs accounted for approximately two thirds of the Smart Meter rollout. Vattenfall started early with its implementation in 2003, before the legislation was completed. E.ON Sweden started with pilots in 2004, and then awarded its contracts in three rounds; 2005, 2006 and 2007. Whilst both Vattenfall and E.ON Sweden decided to work with several contractors, Fortum decided to only go with one. Göteborg Energi, Mälarenergi, Tekniska Verken, Jämtkraft, Umeå Energi (five of the top ten DSOs) and some smaller DSOs collaborated in what is called the SAMS buying consortium, representing 1.1 million meter points. SAMS initiated a common meter data management system infrastructure and decided to go with eleven different vendors (Ryberg, 2012). Vattenfall was an early adopter, but most DSOs waited a longer time with their Smart Meter rollout. 70 percent of the units were installed in the last eighteen months during 2008 and 2009, because the DSOs needed time for project planning and waited for more technical advanced devices. The result is that around 85 percent of the meters allow for registration of hourly values, 41 percent support remote load control and 33 percent support remote disconnection (Ryberg, 2012).
The Smart Meter communication used varies across different companies as well as within a company. PLC is the most common used Smart Meter communication technology in Sweden (about 60 percent), followed by GPRS and radio (about 20 percent each). Vattenfall has the largest installation of PLC with 750 000 meters. Fortum mainly uses GPRS, while E.ON Sweden uses a combination of PLC and GPRS (Ryberg, 2012).
9.5 Electricity Price Physical trading of electricity is made via Nord Pool spot exchange per hour, the price is excluding network charges (Energimyndigheten, 2012a). The consumer electricity price is not solely based on supply and demand and varies between customer category as well as town and countryside. The reasons are varied distribution costs, differences in taxation, subsidies, government regulation and electricity market structure (Thorstensson, 2012). The electricity price is also affected by the weather, e.g. a cold winter increases the electricity price. The consumer price for electricity constitutes of three parts:
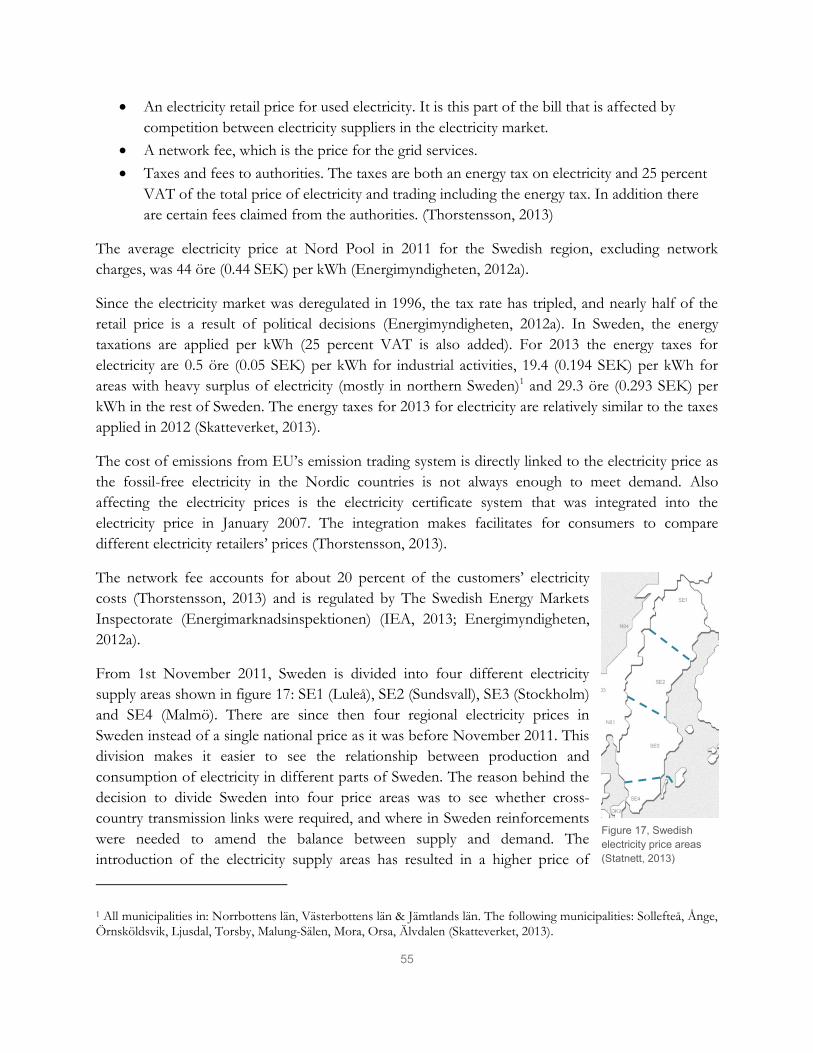
55
An electricity retail price for used electricity. It is this part of the bill that is affected by competition between electricity suppliers in the electricity market.
A network fee, which is the price for the grid services. Taxes and fees to authorities. The taxes are both an energy tax on electricity and 25 percent
VAT of the total price of electricity and trading including the energy tax. In addition there are certain fees claimed from the authorities. (Thorstensson, 2013)
The average electricity price at Nord Pool in 2011 for the Swedish region, excluding network charges, was 44 öre (0.44 SEK) per kWh (Energimyndigheten, 2012a).
Since the electricity market was deregulated in 1996, the tax rate has tripled, and nearly half of the retail price is a result of political decisions (Energimyndigheten, 2012a). In Sweden, the energy taxations are applied per kWh (25 percent VAT is also added). For 2013 the energy taxes for electricity are 0.5 öre (0.05 SEK) per kWh for industrial activities, 19.4 (0.194 SEK) per kWh for areas with heavy surplus of electricity (mostly in northern Sweden)1 and 29.3 öre (0.293 SEK) per kWh in the rest of Sweden. The energy taxes for 2013 for electricity are relatively similar to the taxes applied in 2012 (Skatteverket, 2013).
The cost of emissions from EU’s emission trading system is directly linked to the electricity price as the fossil-free electricity in the Nordic countries is not always enough to meet demand. Also affecting the electricity prices is the electricity certificate system that was integrated into the electricity price in January 2007. The integration makes facilitates for consumers to compare different electricity retailers’ prices (Thorstensson, 2013).
The network fee accounts for about 20 percent of the customers’ electricity costs (Thorstensson, 2013) and is regulated by The Swedish Energy Markets Inspectorate (Energimarknadsinspektionen) (IEA, 2013; Energimyndigheten, 2012a).
From 1st November 2011, Sweden is divided into four different electricity supply areas shown in figure 17: SE1 (Luleå), SE2 (Sundsvall), SE3 (Stockholm) and SE4 (Malmö). There are since then four regional electricity prices in Sweden instead of a single national price as it was before November 2011. This division makes it easier to see the relationship between production and consumption of electricity in different parts of Sweden. The reason behind the decision to divide Sweden into four price areas was to see whether cross-country transmission links were required, and where in Sweden reinforcements were needed to amend the balance between supply and demand. The introduction of the electricity supply areas has resulted in a higher price of
1 All municipalities in: Norrbottens län, Västerbottens län & Jämtlands län. The following municipalities: Sollefteå, Ånge, Örnsköldsvik, Ljusdal, Torsby, Malung-Sälen, Mora, Orsa, Älvdalen (Skatteverket, 2013).
Figure 17, Swedish electricity price areas (Statnett, 2013)
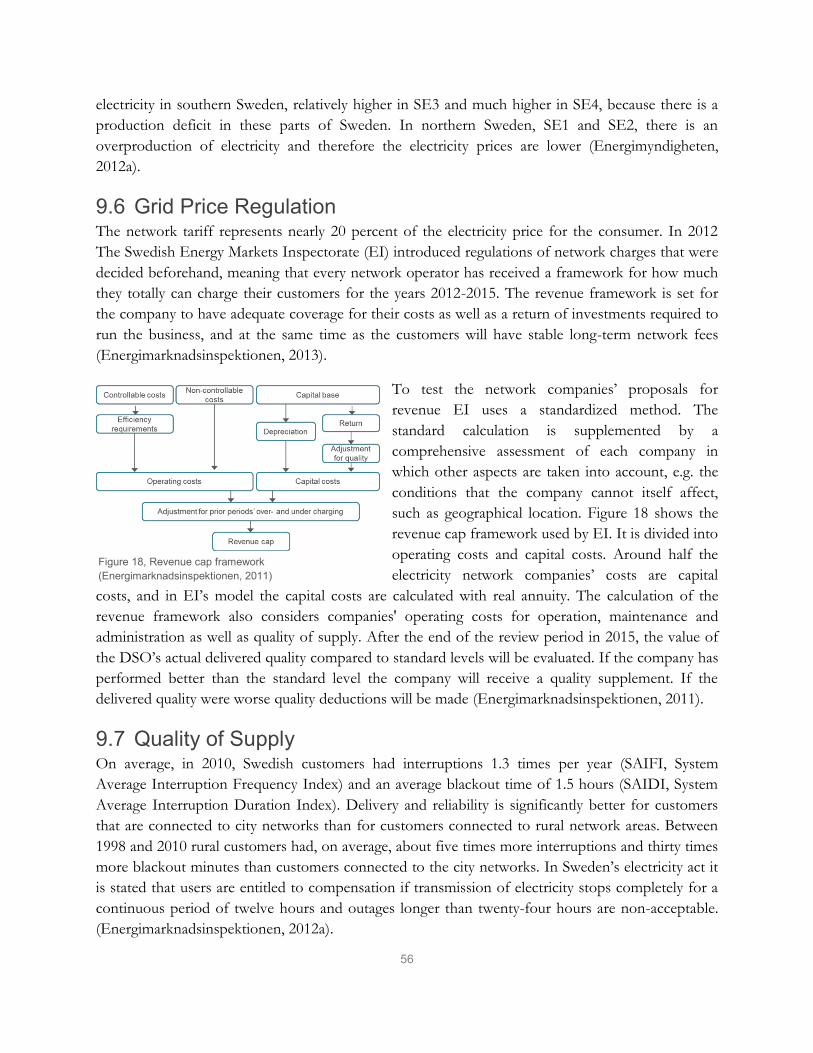
56
electricity in southern Sweden, relatively higher in SE3 and much higher in SE4, because there is a production deficit in these parts of Sweden. In northern Sweden, SE1 and SE2, there is an overproduction of electricity and therefore the electricity prices are lower (Energimyndigheten, 2012a).
9.6 Grid Price Regulation The network tariff represents nearly 20 percent of the electricity price for the consumer. In 2012 The Swedish Energy Markets Inspectorate (EI) introduced regulations of network charges that were decided beforehand, meaning that every network operator has received a framework for how much they totally can charge their customers for the years 2012-2015. The revenue framework is set for the company to have adequate coverage for their costs as well as a return of investments required to run the business, and at the same time as the customers will have stable long-term network fees (Energimarknadsinspektionen, 2013).
To test the network companies’ proposals for revenue EI uses a standardized method. The standard calculation is supplemented by a comprehensive assessment of each company in which other aspects are taken into account, e.g. the conditions that the company cannot itself affect, such as geographical location. Figure 18 shows the revenue cap framework used by EI. It is divided into operating costs and capital costs. Around half the electricity network companies’ costs are capital
costs, and in EI’s model the capital costs are calculated with real annuity. The calculation of the revenue framework also considers companies' operating costs for operation, maintenance and administration as well as quality of supply. After the end of the review period in 2015, the value of the DSO’s actual delivered quality compared to standard levels will be evaluated. If the company has performed better than the standard level the company will receive a quality supplement. If the delivered quality were worse quality deductions will be made (Energimarknadsinspektionen, 2011).
9.7 Quality of Supply On average, in 2010, Swedish customers had interruptions 1.3 times per year (SAIFI, System Average Interruption Frequency Index) and an average blackout time of 1.5 hours (SAIDI, System Average Interruption Duration Index). Delivery and reliability is significantly better for customers that are connected to city networks than for customers connected to rural network areas. Between 1998 and 2010 rural customers had, on average, about five times more interruptions and thirty times more blackout minutes than customers connected to the city networks. In Sweden’s electricity act it is stated that users are entitled to compensation if transmission of electricity stops completely for a continuous period of twelve hours and outages longer than twenty-four hours are non-acceptable. (Energimarknadsinspektionen, 2012a).
Figure 18, Revenue cap framework (Energimarknadsinspektionen, 2011)
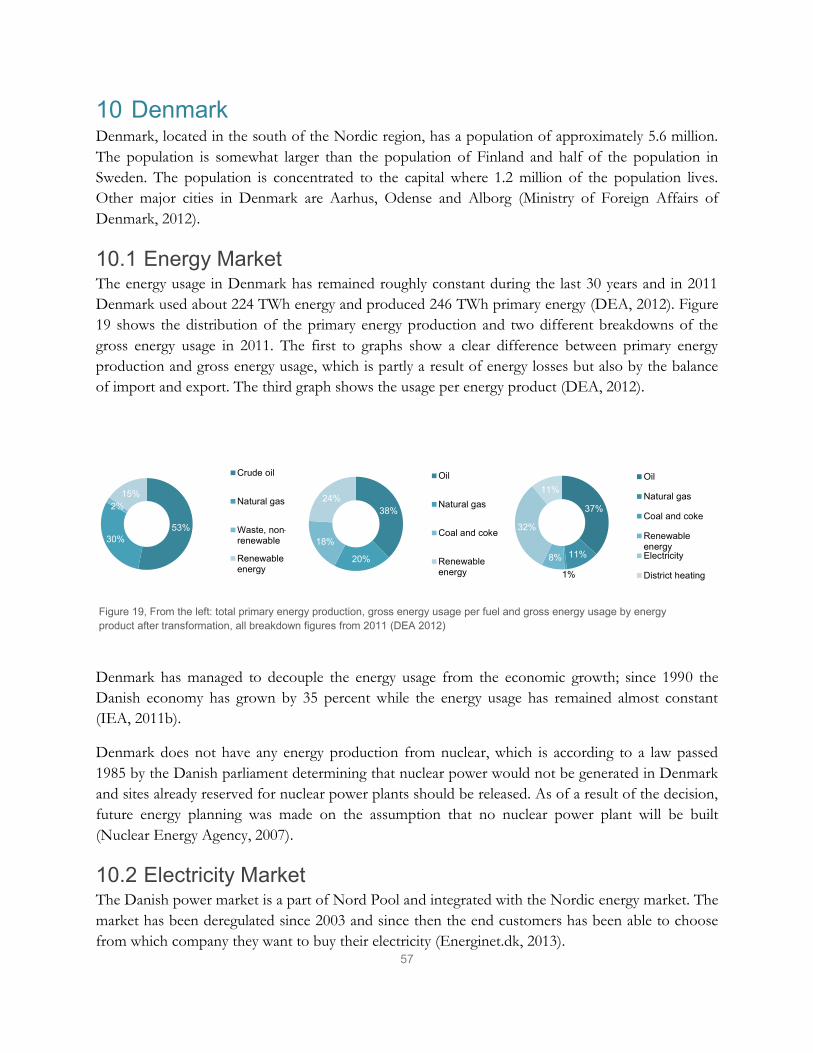
57
10 Denmark Denmark, located in the south of the Nordic region, has a population of approximately 5.6 million. The population is somewhat larger than the population of Finland and half of the population in Sweden. The population is concentrated to the capital where 1.2 million of the population lives. Other major cities in Denmark are Aarhus, Odense and Alborg (Ministry of Foreign Affairs of Denmark, 2012).
10.1 Energy Market The energy usage in Denmark has remained roughly constant during the last 30 years and in 2011 Denmark used about 224 TWh energy and produced 246 TWh primary energy (DEA, 2012). Figure 19 shows the distribution of the primary energy production and two different breakdowns of the gross energy usage in 2011. The first to graphs show a clear difference between primary energy production and gross energy usage, which is partly a result of energy losses but also by the balance of import and export. The third graph shows the usage per energy product (DEA, 2012).
Denmark has managed to decouple the energy usage from the economic growth; since 1990 the Danish economy has grown by 35 percent while the energy usage has remained almost constant (IEA, 2011b).
Denmark does not have any energy production from nuclear, which is according to a law passed 1985 by the Danish parliament determining that nuclear power would not be generated in Denmark and sites already reserved for nuclear power plants should be released. As of a result of the decision, future energy planning was made on the assumption that no nuclear power plant will be built (Nuclear Energy Agency, 2007).
10.2 Electricity Market The Danish power market is a part of Nord Pool and integrated with the Nordic energy market. The market has been deregulated since 2003 and since then the end customers has been able to choose from which company they want to buy their electricity (Energinet.dk, 2013).
53% 30%
2% 15%
Crude oil
Natural gas
Waste, non-renewable
Renewableenergy
37%
11%
1%
8%
32%
11% Oil
Natural gas
Coal and coke
RenewableenergyElectricity
District heating
38%
20%
18%
24%
Oil
Natural gas
Coal and coke
Renewableenergy
Figure 19, From the left: total primary energy production, gross energy usage per fuel and gross energy usage by energy product after transformation, all breakdown figures from 2011 (DEA 2012)

58
In 2011 the Danish electricity usage was 31.4 TWh; the electricity usage has increased by about 10 percent since 1990, but remained relatively stable for the last ten years, which is shown in figure 20 (DEA, 2012).
The electricity production by type of producer is shown in figure 21. The share of renewable energy has increased over the years and is now equally large as the share produced from coal, about 14 TWh or 40 percent (DEA, 2012). Since 1996 renewable resources have been developed and as a result the importance of coal has been, and still is, decreasing (IEA, 2011b). Compared to the total energy production, the electricity production has a very limited use of oil; in 2011 less than one percent of the energy was generated by the use of oil (DEA, 2012).
As mentioned previously, renewable energy accounted for 40 percent (14.2 TWh) of the electricity in 2011 (DEA, 2012). Figure 22 shows the breakdown of the renewable energy used for electricity. Wind power accounts for almost 70 percent of the electricity produced of renewables, which corresponded to 28.1 percent of the total domestic energy usage of the electricity. About 65 percent of wind power electricity came from onshore installations and the remaining 35 percent from off-shore installations (DEA, 2012). In general, characteristic for the Danish energy market is the high level of renewables primarily enabled by wind power and the strong interconnections with the neighboring countries (IEA, 2011b). In the next chapter the import and export will be further described.
Import and Export Denmark has cross-borders links to Sweden, Norway and Germany. Denmark has been a net exporter of energy since 1997, when the balance of import and export first reached a state of equilibrium, which is shown in figure 23 on the next page. The degree of self-sufficiency was 112 percent in 2011 where the primary net energy exported was mainly crude oil and natural gas while coal, coke and renewable energy were net imported (DEA, 2012).
25
30
35
1990 1995 2000 2005 2009 2010 2011
TWh
Figure 20, Denmark’s electricity usage 1990-2011 (DEA, 2012)
69% 0,12%
28%
3% Wind
Hydro
Biomass
Biogas
Figure 22, Denmark’s contribution of renewable energy to electricity production per energy carrier in 2011 (DEA, 2012)
1% 17%
40% 2%
40%
Oil
Natural gas
Coal
Waste, non-renewableRenewableenergy
Figure 21, Electricity production by type of producer 2011 (DEA, 2012)

59
Even if the foreign trade of electricity results in considerable net exchange for Denmark some years, the foreign trade of electricity varies more in Denmark than in any other country. The variation is caused by price trends in Nord Pool, which in turn is a result of the varying precipitation patterns in Sweden and Norway due to the hydro power dominated production in these countries (DEA, 2012; IEA, 2011b).
10.3 Distribution Market Structure The section below will describe the structure of the electricity market, with special focus on the factors influencing the energy distribution.
Actors The institutions in Denmark influencing the energy market and the electricity market in particular include (IEA, 2011b):
The Danish Energy Regulatory Authority (DERA) is the independent regulatory body that oversees the electricity, natural gas and district heating. DERA regulates network tariffs for distribution and transmission, and does also determine the level of obligation to supply tariffs.
Energinet.dk is Denmark’s transmission system operator (TSO). It owns the high voltage (400 kV) transmission system, the natural gas transmission system and is co-owner of the electricity interconnections between Sweden, Norway and Germany. It is an independent public enterprise represented by the Danish Energy of Climate, Energy and Building and owned by the state.
The Danish Ministry of Climate, Energy and Building is responsible for international and national efforts to diminish climate change. It was established by the government in November 2007 as a part of an increased effort to promote a greener and more sustainable society.
The Danish Energy Agency (DEA) is an agency under the Ministry of Climate, Energy and Buildings responsible for all tasks related to production, transmission and utilization of energy and also its impact the climate change. The agency was established in 1976.
-100%
-80%
-60%
-40%
-20%
0%
20%
40%
60%
80%
1980 1985 1990 1995 2000 2005 2010
Per
cent
age
Figure 23, Denmark’s net imports (+) and net exports (–) of electricity 1980–2011 in percentage, (DEA, 2012)

60
There are around 95 DSO companies in Denmark. Table 4 shows the five largest DSOs in Denmark and their relative market share. DONG Energy is the largest with almost 30 percent of the market, second is SEAS-NVE covering 11.5 percent of the customers and third SE covering 8 percent (Ryberg, 2012). The DSO’s have monopoly in their distribution grid and their revenues are therefore regulated, which will be described further in the section about grid price regulation.
10.4 Vision, Targets and Policy Measures The Danish Commission on Climate Change Policy concluded in 2010 that it would be feasible for Denmark to transfer to a fossil fuel independent society by 2050. The government has developed a road map for reaching the goal and emphasis is also on a cost-efficient transformation in order to promote the economic growth: Energy Strategy 2050 (The Danish Government, 2011).
Today renewable energy accounts for 21.8 percent of the total energy usage. In accordance with the 20-20-20 goal from the EU commission Denmark needs to have more than 35 percent of renewable in final energy usage. The goals also include 50 percent of the electricity being generated by wind power, compared to the 28.1 percent today (Ministry of Climate, 2012).
In 2010 the Smart Grid Network was established in Denmark consisting of important players in the industry to investigate how the electricity sector and authorities could promote Smart Grid development and make recommendations. The government has continued on this work and in May 2013 Danish Ministry of Climate, Energy and Building released Smart Grid Strategy presenting a high level framework for future Smart Grid development (Danish Ministry of Climate, Energy and Building, 2013).
Denmark is using different types of policy measures to help reach the climate goals. Energy policy measures have a large impact on the electricity market, since the 32 percent of the Danish energy system is electricity based. The importance of electricity is likely to increase since electricity share of energy usage is likely to reach at least 70 percent long term, if the vehicle fleet is electrified (IEA, 2011b). Two important policy measures is emission trading allowances and taxation.
Denmark sanctioned the EU directive in CO2 emission allowance trading allowance and made it legislation; the trading with emission rights have been an essential part of the Danish climatic strategy since February 2003. The system covers about 380 Danish production units (DEA, 2013). Additionally, Denmark heavily uses taxation as an energy policy measure. Denmark has the highest energy taxation of the European countries. The energy tax accounts for 57 percent of the average retail price (Ryberg, 2012). More about the taxation on electricity in particular can be found in the section about the electricity price further down.
Company Market share Network customers
DONG Energy 29.6 % 970 000
SEAS-NVE 11.5 % 376 000
SE 8.0 % 262 000
NRGI 6.3 % 206 000
EnergiMidt 5.8 % 176 000
Table 4, DSOs' in Denmark market share and network customers (Rydberg, 2012)
Company Market share Network customers
DONG Energy 29.6 % 970 000
SEAS-NVE 11.5 % 376 000
SE 8.0 % 262 000
NRGI 6.3 % 206 000
EnergiMidt 5.8 % 176 000
Company Market share Network customers

61
Smart Meter Status The Smart Meter penetration in Denmark is about 50 percent when this report is written (Klima-, Energi- og Bygningsministeriet, 2013). In Denmark electricity customers can be roughly divided into two categories: large customers (with an annual usage exceeding 100 MWh per year) and smaller customers. The large customers have had hourly metering since 2005 when it became mandatory for all electricity customers consuming 100 MWh or more per year (Renner, et al., 2011). For the smaller customers there are presently no regulations supporting Smart Metering hence the regulations allow for long intervals between readings (Ryberg, 2012).
In 2008 the government called for an investigation of future national Smart Metering requirement and standards, although the Minister of Energy and Climate decided that the cost per household to implement Smart Meters were too high to justify a regulation. However, after the general elections in 2011 a new coalition government was formed with a change in attitudes. The government drafted a new law in 2012, allowing help for DSOs to finance their Smart Meter investments through higher network levies i.e. by allowing the installation to be a part of the necessary new investments in the revenue cap. The revenue cap is more thoroughly explained in the section Grid Price Regulation further down. The state-controlled utility company DONG Energy had requested this law prior to the decision. DONG is the only large DSO not committed to Smart Metering and is expected to resume Smart Meter roll-out and therefore extend coverage of Smart Meters to the remaining Danish households (Ryberg, 2012).
10.5 Electricity Price Denmark is divided into two price areas: DK1 and DK2, which are shown in figure 24. In 2010, the Great Belt Power Link was commissioned, which is 400 kV direct current cables that connects the two areas. The interconnection between the price areas increases the flexibility in the electricity system (IEA, 2011b).
The spot price on Nord Pool is one of the elements that determine the electricity price for all consumers in Denmark. Figure 25 shows the yearly average spot price for Denmark per 100 kWh. The price has more than doubled over the last ten years (DEA, 2012).
0
20
40
60
1999 2000 2001 2002 2003 2004 2005 2006 2007 2008 2009 2010 2011
DK
K
Figure 25, Nord Pool system yearly average for Denmark, price per 100 kWh (DEA, 2012)
Figure 24, Danish electricity price areas (Statnett, 2013)

62
The actual price for electricity paid by customers is determined not only by the spot price on Nord Pool but also taxes to the state (including VAT, Public Service Obligations (PSO)), electricity transmission and the subscription. The total taxes to the state include electricity tax, electricity distribution tax, electricity savings contribution, electricity savings tax (previously CO2 tax) and VAT. In 2012 the revenues to the state per kWh were DKK 1.26, compared to DKK 0.96 in 2001.
Figure 26 shows the decomposition of the electricity price for households for the years 1980, 1990, 2000 and 2011. As mentioned before, Denmark has high energy taxation and electricity is no exception. It’s clear that more than half of the price paid by private consumers is taxation; in 2011 the taxation was 56 percent of the price (DEA, 2012).
10.6 Grid Price Regulation In Denmark, as in the other Nordic countries, there is a grid monopoly. In Denmark it is called the Revenue Cap Regulation. The revenue cap is based on the DSO’s necessary cost per transported kWh in 2004, the relationship is given by equation 1.
Revenue cap price2004=Revenue2004
kWh2004
The revenue cap price from 2004 is price-adjusted with regards to inflation and part of the calculations for the total allowed revenues, showed in equation 2. There is also a possibility to raise the revenue cap due to “necessary investments”, which would be public requirements that fall outside the general obligations of the DSOs (DERA, 2011; Bank & Carlsen, 2013).
Revenue2012=Revenue cap price2012∙ kWh2012+Nni2012
During 2010 DERA developed an economic model to regulate the relationship between the necessary investments and revenue cap for a distribution company (DERA, 2011).
In addition to the revenue cap, there is also a maximum rate of return for the DSOs. The maximum rate of return equals to the average long term rate for mortgage bonds (denominated in DKK) plus 1 percentage point. Hence, some companies are limited by the revenue cap, others by the maximum allowed rate of return (Bank & Carlsen, 2013).
10.7 Quality of Supply Quality of supply is regarded as crucial in the Danish electricity system. DERA monitor and benchmarks the DSO’s SAIFI and SAIDI (abbreviations explained in the equivalent section for the Swedish market), to be able to access the companies’ quality of supply. In the benchmark there is a
0%
20%
40%
60%
80%
100%
1980 1990 2000 2011
VAT
Energy tax
Net price(excl. tax)
Figure 26, Decomposition of energy prices for households (DEA, 2012)
(1)
(2)
63
distinction made between different types of interruptions, which are weighted differently in the calculation for the benchmark. Unplanned interruptions are weighted 100 percent while planned interruptions are weighted 50 percent. Interruptions as a consequence of force major are excluded completely, while interruptions caused by third party are weighted 10 percent (NordREG, 2011b). In 2010 average SAIDI 17 min and SAIFI 0.50 times (CEER, 2012).
For both SAIFI and SAIDI, the DSO’s with larger weighted SAIFI/SAIDI than the aggregated DSOs holding 80 percent of the gets a penalized. A higher SAIDI results in an up to a 1 percent reduction in the operational cost, while scoring relatively high on both SAIDI and SAIFI can be penalized with an up to 2 percent reduction in operational costs (NordREG, 2011b).
Since it his harder for the DSO companies to secure the quality of supply for customers in scarcely populated parts of their distribution area, there is a regulation to not neglecting these customers whilst still keeping an average low enough to not get penalized. If 1 percent of the DSO’s customers experience more interactions than the aggregated experience of 99.5 percent of the Danish customers (both measured on a yearly basis), the DSO also get penalized (NordREG, 2011b).

64
11 Norway Norway, located in the west of the Nordic region, is one of the world’s richest countries with a population slightly above 5 million people. The population of Norway is geographically spread over the country of 43 094 km2 with a concentration by 80 percent of the population located in urban areas. The largest cities are the capital Oslo, Bergen, Stavanger and Trondheim, in decreasing order (SSB, 2013).
11.1 Energy Market In terms of population Norway is the smallest of the Nordic countries (excluding Iceland) but still a major player in the Nordic as well as the world market of energy. Norway has a rich supply of natural resources for energy production mainly based on offshore deposits of oil and gas and large assets of hydroelectric power. Norway is the world’s third largest exporter of energy and exports most of its oil and gas production. The asset of oil is the main reason behind Norway being one of the world’s richest courtiers (IEA, 2011a).
Norway has consequently the largest degree of self-sufficiency of the Nordic countries. In year 1975 the self-sufficiency was 109 percent and 20 years later it had increased to 775 percent (Grönkvist, Stenkvist, & Paradis, 2008). In year 2009 oil amounted to 52 percent of the total energy production, natural gas amounted to 41 percent and the seven remaining percent mainly came from hydro power. This numbers puts the export of energy in a context as electricity is the main carrier with 46 percent of the final energy use in Norway where hydro power amounts for more than 90 percent. In the graphs below, figure 27, the primary energy production, gross energy usage per fuel and the energy usage by carrier is illustrated (IEA, 2011a).
11.2 Electricity Market The Norwegian power market is part of Nord Pool and integrated with the Nordic energy market. Electricity is the main carrier of energy in Norway and annually amounts almost half of the energy use in Norway as shown in figure 27 in previous paragraph (IEA, 2011a). With an annual use of 14 400 kWh per household Norway has by far the highest electricity usage per household in Europe (Ryberg, 2012). As shown in figure 28 electricity is mainly generated by hydro power, which in
52% 41%
5% 2%
Oil
Natural gas
Hydro power
Other
34%
20%
39%
5% 2%
Oil
Natural gas
Hydro power
Biomass &wasteCoal
46%
40%
14% Electricity
Oil
Other
Figure 27, From the left; total primary energy production, gross energy usage per fuel and gross energy usage per product after transformation 2008/2009 (IEA, 2011a)

65
2011 amounted 95 percent, consequently the share from fossil- and bio fueled thermal power and wind power are minor in comparison. The significant amount of hydro power makes Norway the IEA member with the highest share of renewables and as a result Norway has the lowest CO2-emissions per generated kWh (IEA, 2011a). In 2011 electricity generation amounted to 128.1 TWh with more than 96 percent from renewables (NVE, 2012a). Electricity produced by renewables amounted to 123.9 TWh, clearly dominant hydro power accounted 122.1 TWh, wind power accounted 1.3 TWh and biofuel approximately 0.5 TWh, which is illustrated in figure 29 (NVE, 2012b).
Import and Export of Electricity Norway is, as previously mentioned, highly dependent on hydro power as it stands for the majority of electricity generation. The electricity price and the import/export depend heavily on the water inflow and reservoir levels. Wet years typically make Norway a net exporter, and during particularly dry years Norway becomes a net importer where the Nordic neighbors cater to the need with other generation sources or import from outside the Nordics. Norway often exports during the day and import at nights and weekends; in 2011 Norway was a net exporter by 3.5 TWh (IEA, 2011a). In the diagram below, figure 30, Norway’s net import and export from year 1995 to 2010 is illustrated as export minus import based on data from Norway Statistics (SSB, 2013).
-20
-10
0
10
20
30
1995 2000 2005 2010
Elec
trici
ty T
Wh
Figure 30, Norway’s electricity Import (-) and Export (+),TWh, 1995-2010 (SSB, 2013)
95%
3.5%
0.5% 1% Hydro power
Fossil fueledthermal powerWind power
Biofueledthermal power
Figure 28, Electricity generation in Norway by type 2011 (NVE, 2012b)
98,5%
1% 0,5%
Hydro power
Wind power
Bio fules
Figure 29, Norway's contribution of renewable energy to electricity production per energy carrier in 2011 (NVE, 2012c)

66
11.3 Distribution Market Structure This section will briefly present the Norwegian electricity market with a main focus on the distribution network.
Actors Below is a short presentation of the institutions regulating and/or involved in the Norwegian electricity market (IEA, 2011a).
The Ministry of Petroleum and Energy (MPE) is responsible for managing petroleum resources. MPE owns the responsibility of Statnett and Enova, and is also superior of NVE (see below).
The Norwegian Water Resources and Energy Directorate (NVE) is responsible for managing energy and water resources and the Norwegian regulatory authority for electricity. NVE is obliged to promote cost-efficient energy system and efficient use of energy as well as efficient electricity trading. NVE is the primarily actor affecting the DSOs.
Ministry of the Environment are responsible for environmental- and climate policies and Norwegian Competition Authority monitors competition.
Statnett is the transportation system operator of Norway. Statnett is a government-owned monopoly with revenues regulated by NVE.
Enova is assigned by the government and supervised by MPE to promote energy savings, environmentally friendly use of natural gas and promoting new renewable energy sources.
Norway has 2.8 million electricity customers, 208 companies involved in generation and 159 distribution system operators (DSO) (NVE, 2011). The five largest DSOs are presented with amount of customers and relative market share in table 5. The ownership of the DSOs is mostly shared between municipalities and the state-owned Statkraft (Ryberg, 2012).
11.4 Visions, Targets and Policy Measures The climate concern is high in Norway, which is reflected on both regulations and determined targets. Even though Norway isn’t a member of the European Union, several energy regulations and directives by EU has been implemented due to the membership of European Economic Area (EEA), and climate targets are in unity with those of the other Nordic EU members. Norway has set a target to be carbon-neutral by 2050 (emission compensation abroad taken in to account), a step in that direction is the target to reduce global greenhouse gas emission by 30 percent of the level of 1990 by the year of 2020. Norway also has a target to reach 67.5 percent of renewable energy share by 2020 (MPE, 2011). Targets are ambitious and challenging particularly as the electricity supply and
Company Market share Network customers
Hafslund 20 % 560 000 Skagerak Energi 6.8 % 190 000
BKK 6.4 % 180 000
Agder Energi 6.4 % 180 000
Eidsiva Energi 5 % 140 000
Table 5, DSOs' in Norway market share and network customers (Rydberg, 2012)

67
use in buildings are mainly carbon free already. Norway aims to be leading in implementing new technologies with high efficiency and to lowest possible emission of greenhouse gases or other harm to the environment (IEA, 2011a).
Norway aim to be leaders in the development of renewable energy and public founding for RD&D is a key element supporting the vision. From 2007 to 2010 the government more than tripled the spending for RD&D on renewables and carbon capture (IEA, 2011a). In Norway the establishment of a Smart Grid center has taken place, members are represented by the utility industry, universities, telecom operators and ICT companies. Norwegian Smart Grid centre promote a national Smart Grid strategy and are active in RD&D and business development (Norwegian Smart Grid centre, 2013).
Smart Meter Status Smart Meters has taken place on the Norwegian regulatory agenda since several years back, NVE analyzed the opportunities in 2007, which resulted in a proposal for mandatory rollout in 2013. After consolidating stakeholders the time for latest implementation was moved forward to 2017 (Ryberg, 2012). After further influence from stakeholders the time for full rollout was set to the first of January 2019 due to the process being described as “huge and demanding” for the DSOs who have opposed the regulation. Smart Meter rollout is often used as an equivalent for advanced meter system (NVE, 2013).
The legal requirement states that the minimum resolution for meter values should be one hour, but the meters should support a 15 minute resolution for future changes. The DSO should have the data uploaded on a daily basis and available for the end user at 9 am the following day. A local communication interface is required that supports standard base communication and enables external devices to access metering data and tariff information (Ryberg, 2012). In the current situation a few of the smaller DSOs has implemented Smart Meter system, which corresponds to a Smart Meter penetration of about seven percent (Ryberg, 2012). In Norway AMS (Advanced Metering System) is used synonymously with Smart Meter system.
11.5 Electricity Price Norway is divided into five price areas, figure 31, to better handle congestion. NO1 covers the area around Oslo, NO2 is the most southern price area and covers Kristiansand, NO3 comprises Trondheim, NO4 is the most northern part with Tromsø and NO5 which in terms of area is the smallest of them and comprises Bergen. Similar to Sweden Norway possesses large supply of hydro power in the north part and the consumption is concentrated to the southern part where the electricity price generally is higher (NVE, 2011). The average system price on Nord Pool Spot was approximately NOK 275 per MWh on the second half of 2011, compared to NOK 600 per MWh in the beginning of the year. The fluctuation was due to hydro conditions (NVE, 2011).
Figure 31, Norwegian electricity price areas (Statnet, 2013)

68
The retail price in Norway is among the lowest for households and industries of IEA members due to the high share of hydro (IEA, 2011a). Norway is divided into five price areas due to management of congestion. The electricity bill that the end users pays in Norway consists of the actual electricity price, payment for transmission, electricity tax, consumption tax, value-ad-tax (VAT) and a earmarked part on the transmission tariffs goes to an Energy Found contributing to the financing of Enova. In 2010 the consumption tax amounts NOK 0.11 per kWh for non-industrial consumers and NOK 0.0045 per kWh for industries. The VAT is standardized to 25 percent (MPE, 2008).
In 2009 Norway and Sweden agreed on a common green certificate market, also called electricity certificates, meaning the use of tradable commodity providing electricity production by renewables to a certain amount which is reflected in the electricity price (The Norwegian Trade Portal, 2011).
11.6 Grid Price Regulations NVE regulates the DSOs by annual revenue in order to enable reasonable rate of return on invested capital and at the same cover their operational costs and depreciation, while maintain reasonable prices to the customers. The revenue cap is based on expected values and if there is a deviation from the actual cost the deviation will be reflected in the revenue cap two years later. The regulation is called revenue cap and is determined according to equation 3.
Revenue capt=0.4Ct+0.6Ct*
Ct is the cost base for the DSO year t-2 and Ct* is the cost norm based on benchmarking analysis
from year t-2. The cost base reflects on both quality of supply, which will be addressed in the next paragraph, as well as annual depreciations, regulatory asset base and the weighted average cost of capital (WACC) to give a reasonable return on investments for the DSOs. The revenue cap system is under evaluation as the industry objects to the fact that companies with low costs will benefit from the model in comparison with those companies that invest in their grid. The revenue cap system is under evaluation since the industry objects to the fact that investments in the grid is not encouraged but rather the opposite; companies with low investments benefits from the existing revenue cap model (NVE, 2011).
Before 2019 all DSOs in Norway are required to replace all meters that do not fulfill the requirements in the new legalization. The Smart Meter regulation will imply that some companies must replace meters that are not yet fully depreciated, and NVE decided to compensate the companies that will suffer the most from the regulation (NVE, 2011).
Since 2010 NVE has taken action to facilitate end consumer who generates electricity for self-usage. The annual generation should not exceed the annual use, but in times when generation exceeds the surplus can be distributed out on the grid. It is not mandatory for grid companies to offer the consumer the possibility to feed in surplus to the grid but it is encouraged (NVE, 2011).
NVE applies benchmarking among the DSOs in order to compare cost efficiency by using the Data Envelopment Analysis model (DEA). By the benchmarking the most cost efficient companies gets
(3)

69
rewarded and the ranking takes parameters like energy demand, number of customers, length of grid transporting higher more than 1 kV, number of transformers, interface to regional grid, geographical conditions and MW input from small hydro power plants into consideration (NordREG, 2011b).
11.7 Quality of Supply Norway has a standardized reporting system for interruptions and faults called Fault and Interruption Statistics in the Total Network (FASiT). The interruptions are divided in two categories: short, which are up to three minutes and long, which persist more than three minutes. The DSOs are all obliged to report all interruptions to NVE that exert incentives and penalty mechanisms to ensure efficient and reliable service by the DSOs. FASiT enables the mechanisms issued by NVE such as quality dependent revenues, cost of energy not supplied (CENS) and direct compensation for outages longer than twelve hours. The objective with the mechanisms is to give the right incentives for efficient and reliable operation of the grid and fast outage management regardless of size (IEA, 2011a; NordREG, 2011b). The revenue cap described in equation 3 reflects the quality of supply in the cost base Ct, since it is based on parameters such as the operation and maintenance, CENS and power losses counted with reference prices (NordREG, 2011b). In Norway average SAIDI 2010 was 66 min and SAIFI 1.50 times (CEER, 2012).

70
12 Comparative and Summarizing Table
Table 6, Summary in a comparative format of previously presented information
Sweden Denmark Norway
Population 9.5 million 5.6 million 5 million
Area 449 964 km² 43 094 km² 324 220 km²
EU renewable energy goal 2020
49 % (own target 50 %) 35 % 67.5 % Not a member of EU but member of EEA
Electricity production by type 2011
Net importer or exporter of electricity
Differs from year to year, mainly dependent upon warm or cold climate
Net exporter since 1997 Exporter during wet years and importer during dry years
Contribution of renewable energy to electricity production per energy carrier
Annual average electricity consumption per household
8 600 kWh 3 700 kWh 14 400 kWh
Number of DSOs 170 95 159
Main DSOs Vattenfall, Fortum and E.ON Sweden
DONG Energy and SEAS-NVE Hafslund and Skagerak Energi
Smart Meter penetration
100 %, mandatory rollout 2009 50 %, mandatory for large customers (≥ 100 MWh) since 2005, since 2012 allowing DSOs to fund it by necessary new investment in the revenue cap
7 %, Mandatory roll-out pushed forward several times to 2019
SAIDI (2010) 92 minutes 17 minutes 66 minutes
SAIFI (2010) 1.33 times 0.50 times 1.50 times
Key Points Large hydro power share High SAIDI
Large wind power share High energy taxes
Large hydro power share High energy supply Largest EV share in world
per capita

71
Results In total 8 utility companies were interviewed; 4 in Sweden, 2 in Norway and 2 in Denmark. In Sweden the second, third, sixth and tenth largest DSOs were interviewed. In Norway and Denmark the largest and second largest DSOs were interviewed.
The interviews took 90 minutes each and followed the DCDC platform presented in chapter 3 Methodology. As conveyed to the interviewees, the answers are anonymous on an individual level but the company will be transparent. The results will be divided into Smart Grid definition, Direction, Current Situation, Driving forces and Challenges.

72

73
13 Results Sweden Table 7 below is a brief presentation of the four interviewed companies in Sweden.
Two interviews were performed at Vattenfall, four at Fortum, two at Mälarenergi and five at Umeå Energi. Below the results from the fourteen interviews performed at four companies in Sweden are presented. It is a compilation of the interviews carried out during about twenty one hours.
At Vattenfall two people working within their Smart Grid program were interviewed. At Fortum two network developers, one focusing more on IT and one more on customer behavior, and two business developers were interviewed. At Mälarenergi a person working with network planning and a person working with market aspects of the grid. At Umeå Energi a business developer, a person working with overall decisions regarding the grid, a person working with communication solutions in the grid, a person working with meter readings and a person working at UmeNet were interviewed.
13.1 Smart Grid Definition All interviewees were given the question of what Smart Grid means for them. Interviewees within some of the companies answered similarly, though the answers within other companies differed more. Frequently mentioned concepts were the use of ICT, active consumers, finding new market models and the transformation to the future energy system.
At Vattenfall the two interviewed gave similar types of answers to the question what Smart Grid means for them. They agreed that Smart Grid is a buzzword and uses the concept in a wide meaning describing the conversion of the energy system (Vattenfall, 2013).
At Fortum four different types of answers were given from the four interviews on the meaning of Smart Grid. One interviewee focused mostly on renewable energy, one focused on information transfer, one focused on the consumer perspective whereas one focused on the Smart Grid concept being trite and really only referring to the next generations’ electricity grid. The latter also said that Fortum usually stick to Euroelectric’s definition of Smart Grid, which is the same as European Technology Platforms’ definition (described in 1.5 Smart Grid Definition) (Fortum, 2013).
Vattenfall Fortum Mälarenergi Umeå Energi Turnover (corporate group)
SEK 181 billion (2011) 6.2 billion EUR (2012) SEK 2.7 billion (2012) SEK 1.8 billion (2012)
Ownership Swedish state 100 % Finnish state 60 %, Private ownership 40 %
City of Västerås 100 % Umeå municipality 100 %
Vertical integration Generation, distribution & retail
Generation, distribution & retail
Generation, distribution & retail
Generation, distribution & retail
Distribution market share
17,8 % 17,1 % 1,9 % 1,1 %
Smart Meter penetration
100 % 100 % 100 % 100 %
Table 7,Company characteristics for interviewed companies in Sweden (Vattenfall; Fortum; Mälarenergi; Umeå Energi; Ryberg, 2012)

74
The two interviewees at Mälarenergi both included the active consumer and the importance of finding new market models. One of the two interviewees also mentioned that Smart Grid is a buzzword and that it requires technology development (Mälarenergi, 2013).
From the five interviews performed at Umeå Energi different types of answers were given to the question. One interviewee answered that Smart Grid communicates, another interviewee focused on the Smart Meters, one focused on control in the electricity grid and the communication related to it, whereas two interviewees focused more on the active customers and market models (Umeå Energi, 2013).
13.2 Direction The section describing the current situation is divided into three sections: Power System Transformation, ICT Solutions, Customer Involvement, Pricing of Electricity, Outage Management and Possibility of a Non Smart Grid Scenario.
Power System Transformation According to one interviewee at Vattenfall Smart Grid will lead to a different usage pattern. “Pressing more electricity into a network that is not built for it, forces you to either extend it or shovel it around in a better way. Then you need to do things such as demand response and quality assurance” (Vattenfall, 2013).
Fortum believes in what they call a Solar Economy in the future near 2030-2050, when solar power will be the major source for electricity production. During the coming 10 years Fortum believes that the solar power will increase and wind power will grow at the current rate. However, they are not uncertain about what will happen to the electrical vehicle stock. With more information about the grid operation it will be easier to know what to invest in. Fortum believes that there will probably be more change in 20 years’ time compared to a 10 year time horizon;; one possibility could be that the Swedish nuclear power has disappeared by then. Fortum is furthermore thinking about the DSOs role in the future electricity system and believes that the role will include enabling third party service providers (2013).
Mälarenergi believes that the electricity production generated by solar cells and the electric vehicles stock will increase in the future energy system. The company states that the development of EV development is less progressed than previously expected, but Mälarenergi still believe that EVs will stand for a significant portion of the vehicle fleet in ten years. Mälarenergi also believes that everyone will have hourly metering in ten to fifteen years (2013).
All the interviewed companies believed that there would be a significant portion of installed microproduction in the future and that it would be a challenge for the physical grid both electricity wise and communication wise. The production needs to be balanced, the reliability of the electricity usage needs to be high and the right amount of electricity needs to be invoiced to the consumer (Fortum; Mälarenergi; Umeå Energi; Vattenfall, 2013).
Pressing more electricity into a network that is not built for it, forces you to either extend it or shovel it around in a better way
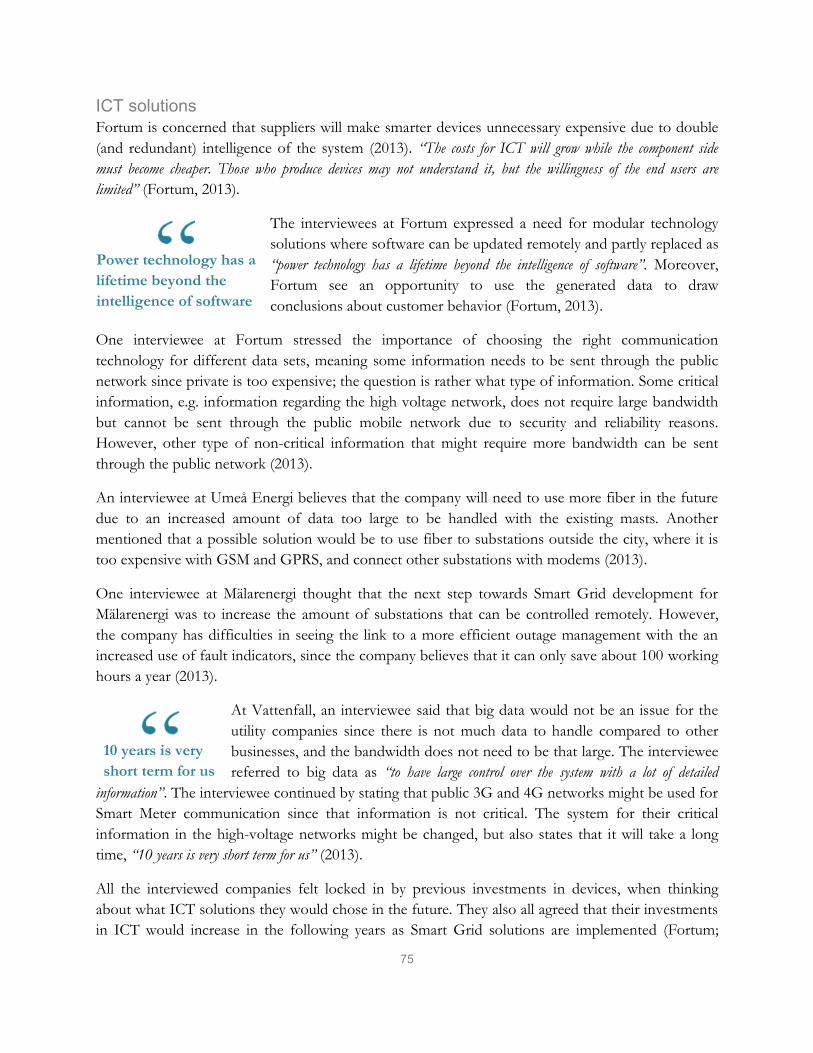
75
ICT solutions Fortum is concerned that suppliers will make smarter devices unnecessary expensive due to double (and redundant) intelligence of the system (2013). “The costs for ICT will grow while the component side must become cheaper. Those who produce devices may not understand it, but the willingness of the end users are limited” (Fortum, 2013).
The interviewees at Fortum expressed a need for modular technology solutions where software can be updated remotely and partly replaced as “power technology has a lifetime beyond the intelligence of software”. Moreover, Fortum see an opportunity to use the generated data to draw conclusions about customer behavior (Fortum, 2013).
One interviewee at Fortum stressed the importance of choosing the right communication technology for different data sets, meaning some information needs to be sent through the public network since private is too expensive; the question is rather what type of information. Some critical information, e.g. information regarding the high voltage network, does not require large bandwidth but cannot be sent through the public mobile network due to security and reliability reasons. However, other type of non-critical information that might require more bandwidth can be sent through the public network (2013).
An interviewee at Umeå Energi believes that the company will need to use more fiber in the future due to an increased amount of data too large to be handled with the existing masts. Another mentioned that a possible solution would be to use fiber to substations outside the city, where it is too expensive with GSM and GPRS, and connect other substations with modems (2013).
One interviewee at Mälarenergi thought that the next step towards Smart Grid development for Mälarenergi was to increase the amount of substations that can be controlled remotely. However, the company has difficulties in seeing the link to a more efficient outage management with the an increased use of fault indicators, since the company believes that it can only save about 100 working hours a year (2013).
At Vattenfall, an interviewee said that big data would not be an issue for the utility companies since there is not much data to handle compared to other businesses, and the bandwidth does not need to be that large. The interviewee referred to big data as “to have large control over the system with a lot of detailed
information”. The interviewee continued by stating that public 3G and 4G networks might be used for Smart Meter communication since that information is not critical. The system for their critical information in the high-voltage networks might be changed, but also states that it will take a long time, “10 years is very short term for us” (2013).
All the interviewed companies felt locked in by previous investments in devices, when thinking about what ICT solutions they would chose in the future. They also all agreed that their investments in ICT would increase in the following years as Smart Grid solutions are implemented (Fortum;
Power technology has a lifetime beyond the intelligence of software
10 years is very short term for us

76
Mälarenergi; Umeå Energi; Vattenfall, 2013). All of the interviewed companies also said they would need to find new partners within the communication areas since the companies today lack the competence (Fortum; Mälarenergi; Umeå Energi; Vattenfall, 2013).
Customer Involvement All interviewed companies believed that the consumer will play a central part in the future electricity system. The consumers will have the possibility to be active if they want to control their costs. However, all agree incentives for the consumer to change its behavior either for load shifting or for saving electricity are weak. Presently, there is not much money to earn by machine washing during the night instead of during peak load. This is related to the pricing of electricity as higher electricity prices will lead to larger cost incentives for the consumers which is further elaborated on in the next section (Fortum; Mälarenergi; Umeå Energi; Vattenfall, 2013).
Fortum mentioned that load shifting would primarily be relevant for large industries, e.g. the paper industry, since the possible financial gain could make a sufficient incentive (2013).
Pricing of Electricity The companies, particularly Mälarenergi believes the price for electricity is too low (2013). Fortum, Umeå Energi, and Mälarenergi states that they will need to change the pricing for the consumers and believe it will go more towards effect-based prices. One employee at Fortum also mentioned that the electricity companies, as well as the consumers, most likely wanted to have simple models for their pricing but Smart Grid on the contrary will probably lead to more complex electricity pricing (2013),
All companies were asking themselves and questioning if the consumers were willing to pay for higher reliability and better outage management (Fortum; Mälarenergi; Umeå Energi; Vattenfall, 2013).
Outage Management Most of the electricity companies today describe their outage management at the lower voltage levels as dependent on customers’ calls to detect a power failure. However, outage management is improving as the Smart Meters are able to send signals to the operations center. The companies want to automate their outage management to a larger extent in the future, with self-healing nets and faster fault localization (Fortum; Mälarenergi; Umeå Energi; Vattenfall, 2013).
Both Umeå Energi and Mälarenergi said they are in progress of integrating their Smart Meter system into the NIS (Network Information Service) and the GIS (Geographic Information System), which would lead to better outage management in the future (Mälarenergi, 2013; Umeå Energi, 2013).
In 10 years Fortum believes to have better information about blackouts and will be able to predict future blackouts (2013). Fortum knows there will be new technology available for outage management in the future, but they feel unsure on how much the customers are willing to pay for better reliability compared to today (2013).

77
Possibility of a Non Smart Grid Scenario The interviewed companies expressed little concerns with Smart Grid not happening, and saw no other option (Mälarenergi; Umeå Energi; Vattenfall, 2013). One interviewee at Fortum said that if Sweden decides to continue expanding nuclear power, does not invest in wind or solar power, does not share its regulatory capacity with other countries and the customer does not care about the electricity and environmental costs; then Smart Grid might not develop. This future scenario is however not seen as likely and the same person describes the Smart Grid as: “The ball is already rolling” (Fortum, 2013).
13.3 Current Situation The section describing the current situation is divided into three sections: Visions for Smart Grid, Present ICT Solutions, Enabling Microgeneration and Outage Management.
Vision for Smart Grid None of the interviewed companies had a clear vision for Smart Grid (Fortum; Mälarenergi; Umeå Energi; Vattenfall, 2013). Vattenfall said that they have been working with Smart Grid for 8 years, but had no vision (at least none shared during the interviews). However, the big companies have visions for the future energy system: Vattenfall wants to become “the smart energy enabler” and Fortum believes in solar generation, referred to as the solar economy, as previously mentioned (2013).
Present ICT solutions All of the interviewed companies in Sweden made a clear distinction between their ICT solutions on the high voltage grid, compared to the low voltage grid. The high voltage grid ICT is seen as much smarter, with real time information, more sensors and better fault detection with help of SCADA and RTUs (Remote Terminal Units) (Fortum; Mälarenergi; Umeå Energi; Vattenfall, 2013). However, the Smart Metering ICT solutions distinguish the companies.
Vattenfall have three communication solutions for their Smart Metering data up to the concentrator; PLC, GSM and Radio. PLC accounts for 60 percent of the meters, is the cheapest alternative and is mostly used in urban areas. The next most common communication technology used is radio, which is used for 30 percent of the meters. GSM accounts for 10 percent and is used for rural areas only since it is the most costly alternative. After the concentrator the data is sent through their backhaul system through the mobile network (2013).
Fortum uses Zigbee as Smart Meter communication for villas, and PLC for urban tall buildings together with GPRS (2013).
Umeå Energi has four different meter types. The company bought a collection engine (head end system) from Powell called ELIN that were supposed to speak to all types of meters. Altough, it did not work out the as intended, and now the company has and needs to pay for four different systems. Umeå Energi pays around SEK 700 000 for their data collection each year (Umeå Energi, 2013).
78
Mälarenergi uses a radio based system for urban areas for their Smart Meter communication, while they use PLC in more rural areas. The company was first in Sweden to build an integrated system down to the customers. Mälarnergi has started to integrate radio based meters with their DMS (Distribution Management System). The company has four different collection systems that costs SEK 15-20 million annualy, even though the head end system from ELIN was supposed to handle the four different metering types installed. There is a cost of SEK 400 per consumer for collecting meter information, billing and customer support per year (2013). The network therefore has a lot of systems today but can be improved. “We do not have a dumb grid today, it is semi-smart” (Mälarenergi, 2013).
Enabling Microproduction Fortum, Umeå Energi, Mälarenergi and Vattenfall have enabled a kind of microproduction for their customers, when doing that they need to change their existing meter to a more advanced meter that can measure both production and usage. They do not see this as a capacity problem presently since the feed in of electricity still is quite low (2013).
Outage Management 90 percent of Fortum’s Smart Meters sends an alarm to the operations center in conjunction with blackouts. When several meters are out the operations center can draw conclusions on what has happened. Outages can be costly, and Fortum received a fine of a few million from Energi-marknadsinspektionen after the storm Dagmar in Hälsingland (2013).
Fortum does not have their own field workforce, but outsource it to an external company. Their outage management is therefore connected to this field force, and they are to a high extent dependent on this external collaboration for outage management (2013).
Mälarenergi have little control in the low voltage network, where there is a dependency on people calling to the operations center when there are going through a blackout. The company is currently trying to connect the meters with the NIS (Network information system), although cost for blackouts is not a major cost item for them (2013). Umeå Energi’s situation is very similar; faults in the high or middle voltage network can be fixed automatically, whereas they on the low voltage network are dependent upon calls from the customers (2013).
13.4 Driving Forces The driving forces can mainly be divided into Regulations, Customers, and the DSOs own benefit. Most interviewees separated these different driving forces even though they are interrelated, whereas an interviewee from Vattenfall did not want to separate the driving forces as it saw the driving force as “society as an organism that drives forward” (2013).
We do not have a dumb grid today, it is semi-smart

79
Regulations The driving force mentioned most frequently for Smart Grid development was regulations. This follows from DSOs being monopolies regulated by authorities, and greatly influenced by changes in the rules and laws. A clear example was the law that forced the DSOs to a Smart Meter rollout when the business cases still was premature. The rollout changed the market for ICT solutions in the utility industry. Other regulations that are thought to change the landscape for ICT solutions connected to Smart Grid are hourly rates, net metering system, more renewable energy integration, Nordic harmonization and more connections to continental Europe. The Nordic harmonization will probably lead to a single point of contact with the end consumer: the retail company. Therefore a billing systems need to be implemented that can send metering information from DSOs to the retail companies across the Nordics (Fortum; Mälarenergi; Umeå Energi; Vattenfall, 2013). Vattenfall and Fortum believes that connection to continental Europe would drive the ICT development since more communication systems would be needed to be developed to handle the electricity prices. The largest interviewed companies also both took Germany as an example on how regulations can change everything in a short time span. In Germany the installation of microgeneration exploded due to governmental subsidiaries, which fundamentally changed the German energy system (Fortum; Vattenfall, 2013).
EU goals and new standards can heavily affect the type of ICT solutions that will be implemented. Examples are the Energy Efficiency Directive and the 20-20-20 goals (Fortum; Mälarenergi; Umeå Energi; Vattenfall, 2013). Another initiative coming from the EU with likelihood of becoming a driving force for Smart Grid development is the grid codes. New protocols, quality standards and more detailed metering demands are supposed to drive the
development for ICT involvement in the utility industry with more connected devices (Mälarenergi; Umeå Energi, 2013). ”A political policy measure can turn everything upside down” (Vattenfall, 2013).
Customers Even though Umeå Energi does not see customers as a driving force toward Smart Grid development today, the company is positive towards such a development since the aim is to make the everyday life simpler for the electricity consumers. However, if customers would start to care more it could drive the development enormously (2013). Mälarenergi also believes that the customer may be a large part in the future development (2013). Vattenfall stresses that the regulatory driving force really is driven by consumers, since the authorities are the customer representative (2013).
DSOs Own Benefit Umeå Energi wants to develop Smart Grid in order to gain cheaper operation by efficiency measures and to be able to avoid manual work to a large extent (2013). This view was also expressed by Vattenfall, which also wanted to use Smart Grid to postpone cost heavy reinforcement investments in the grid (2013).
A political policy measure can turn everything upside down

80
13.5 Challenges The challenges for a Smart Grid development were fairly similar between the four different companies and fourteen different interviews performed in Sweden. The main challenges could be divided into Revenue Cap Restrictions, Intertia within the Industry, Finding New Business Models, Political Uncertainty and Lack of Standardizations and IT competence and Big Data Handling.
Revenue Cap Restrictions Even though there is a large interest to invest in R&D and new projects, it is difficult to get coverage for these costs in the revenue regulation (Fortum, 2013). Some believe that the revenue cap model instead should be based on some kind of best practice to run the network (Mälarenergi, 2013). “Everything costs money and in the end it is always the customer who pays” (Umeå Energi, 2013).
The depreciation time decided by Energimarknadsinspektionen is also an obstacle for the Smart Grid development. “We have a depreciation time of 40 years on our energy production facilities. In 40 years from now it is 2053, how does the society look like then? Of course we can guess, but we might make the wrong decisions…Everything is spinning very fast now and we need to know what the regulations are in relation to how long the depreciation times are in order to make the right decisions” (Vattenfall, 2013). Umeå Energi experiences the same type of concern as more and more equipment in the grid will need to be replaced with shorter time intervals (2013).
Inertia within the Industry The energy industry has not gone through major transformations in a long time. People within the company may therefore not believe in the positive change that Smart Grid will generate (Fortum, 2013). The grid operators are too rigid and do not dare to admit new kinds of actors since it means decreased control. The need for control is historically rooted, because DSOs have always strived to have as much control as possible in order to supply electricity with high possible quality (Umeå Energi, 2013).
Finding New Business models The business cases for Smart Grid are presently not very favorable. The DSOs need to understand what their future business models to recognize their role as a grid operator (Vattenfall, 2013), which is also connected to how electricity will be priced, and how models to send right prize signals to the customers should be created. Even though there are mental barriers for people in the industry, new business models needs to be applied in order to be profitable (Umeå Energi, 2013).
Political Uncertainty and Lack of Standardizations The DSOs find it hard to predict future energy policies. At the same time as policy measures are important driving forces, the political uncertainty creates a fear of unnecessary investments. “Network owners should be seeing a red thread about where politicians are going” (Umeå Energi, 2013). Fortum expressed a fear of choosing communication technology, because the government is perceived as technology neutral at this time
Network owners should be seeing a red thread about where politicians are going

81
even though standards might come in the near future (2013). Standardizations, for example, would drive the Smart Grid development but the lack of them is now delaying the development (Mälarenergi, 2013). Today the legal requirements are short, “…it means that we do not want to work with a long term strategy to 2020 or 2025” (2013).
There is presently an ongoing investigation about a net debit system with focus on taxation. As a result the Swedish DSOs have a hard time making decisions on how to address net debit issues presently. It hinders the development for Smart Grid since there is an uncertainty in what the investigation will conclude (Fortum; Mälarenergi, 2013).
IT Competence and Big Data Handling DSOs need to build up ICT competence, as well as learning to handle big data.
“We must learn to handle big data analysis and draw conclusions from it” (Fortum, 2013).
“…it is hard with the big IT-systems;; everyone tries to build in everything in them and that it hard for us” (Mälarenergi, 2013).
“The more information that comes in to the operations center, the harder it will be for us” (Umeå Energi, 2013).
Vattenfall dismissed the handling of big data as a major challenge since it believes that the datasets will be much lower than in other industries (2013).
The increased of data from the meters, especially when approaching real-time reading, it is also a challenge to get the right information into the billing systems. When information on electricity usage is visualized to the consumers it is important that the information visualized corresponds to the information on the bill sent out to the consumer (Umeå Energi, 2013).
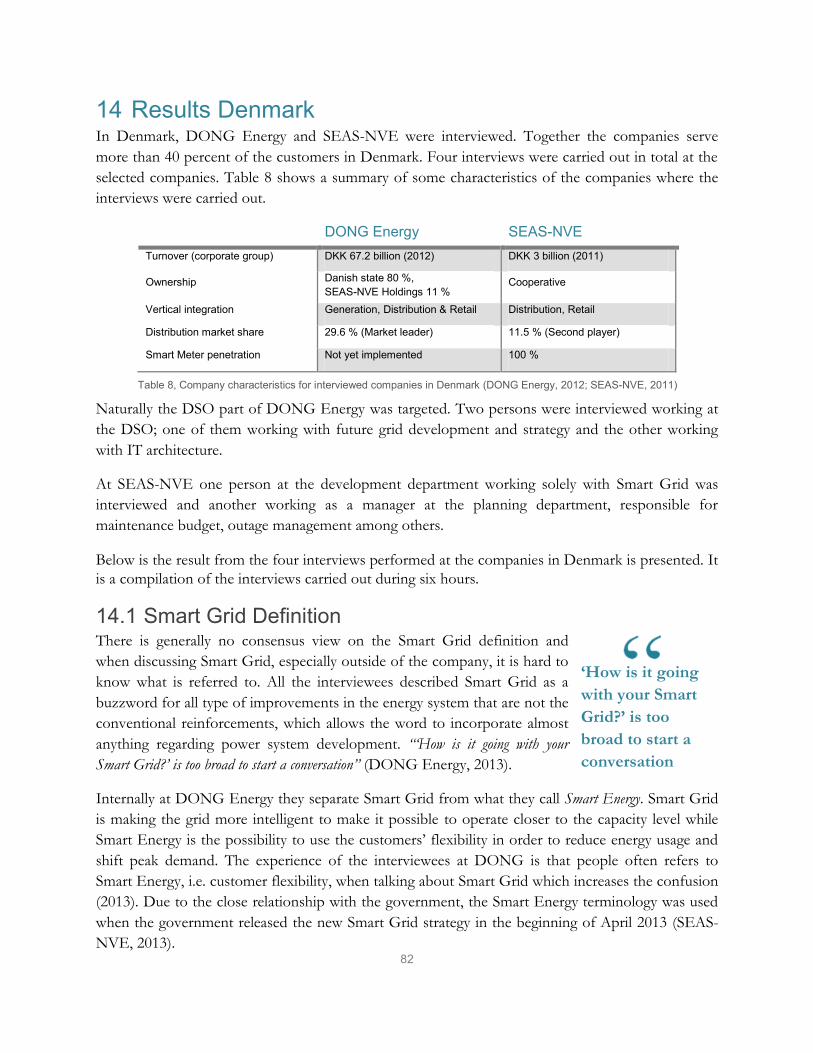
82
14 Results Denmark In Denmark, DONG Energy and SEAS-NVE were interviewed. Together the companies serve more than 40 percent of the customers in Denmark. Four interviews were carried out in total at the selected companies. Table 8 shows a summary of some characteristics of the companies where the interviews were carried out.
DONG Energy SEAS-NVE Turnover (corporate group) DKK 67.2 billion (2012) DKK 3 billion (2011)
Ownership Danish state 80 %, SEAS-NVE Holdings 11 %
Cooperative
Vertical integration Generation, Distribution & Retail Distribution, Retail
Distribution market share 29.6 % (Market leader) 11.5 % (Second player)
Smart Meter penetration Not yet implemented 100 %
Naturally the DSO part of DONG Energy was targeted. Two persons were interviewed working at the DSO; one of them working with future grid development and strategy and the other working with IT architecture.
At SEAS-NVE one person at the development department working solely with Smart Grid was interviewed and another working as a manager at the planning department, responsible for maintenance budget, outage management among others.
Below is the result from the four interviews performed at the companies in Denmark is presented. It is a compilation of the interviews carried out during six hours.
14.1 Smart Grid Definition There is generally no consensus view on the Smart Grid definition and when discussing Smart Grid, especially outside of the company, it is hard to know what is referred to. All the interviewees described Smart Grid as a buzzword for all type of improvements in the energy system that are not the conventional reinforcements, which allows the word to incorporate almost anything regarding power system development. “‘How is it going with your Smart Grid?’ is too broad to start a conversation” (DONG Energy, 2013).
Internally at DONG Energy they separate Smart Grid from what they call Smart Energy. Smart Grid is making the grid more intelligent to make it possible to operate closer to the capacity level while Smart Energy is the possibility to use the customers’ flexibility in order to reduce energy usage and shift peak demand. The experience of the interviewees at DONG is that people often refers to Smart Energy, i.e. customer flexibility, when talking about Smart Grid which increases the confusion (2013). Due to the close relationship with the government, the Smart Energy terminology was used when the government released the new Smart Grid strategy in the beginning of April 2013 (SEAS-NVE, 2013).
‘How is it going with your Smart Grid?’ is too broad to start a conversation
Table 8, Company characteristics for interviewed companies in Denmark (DONG Energy, 2012; SEAS-NVE, 2011)

83
At SEAS-NVE the definition varies slightly between the interviewees; for one Smart Grid is mainly a question about how to handle a larger feed of renewables into the system and the other thought it was everything in the grid system, to be able to extend lifetime and reduce grid cost. However, both of them thought it had synergies and optimally combined with what DONG Energy refers to as Smart Energy (2013).
14.2 Direction Direction for the interviewed DSO companies in Denmark is categorized into Smart Meter Rollout, Increased Measuring and Control, Flexibility for Industry Customers, Less Customer Contact and Possibility of a Non Smart Grid Scenario.
Smart Meter Rollout DONG Energy employs conservative development towards Smart Grid, with every step justified by a positive business case. It is the last large DSO in Denmark not to roll out Smart Meters to its customers. Smart Meter roll out are currently in the pipeline and tender for Smart Meter procurement is planned; about 1 000 000 Smart Meters are needed. Smart Meter roll out is realized by regulations from the state, but also realized by a pressure from DONG Energy on the state to change regulations to make a Smart Meter rollout more feasible (2013).
DONG’s procurement of the Smart Meters will be a tender based on a functionality description rather than a technology description. The company is open for any type of solution, mentioning telecom solutions such as GSM, PLC solutions to the substation, wireless mesh and ZigBee, as long as the solution fulfills the functionality requirements. However, DONG believes some kind of telecommunication solution would be favorable since the company believes it would be preferable to have all the devices communicating to a central server to facilitate more high level control (2013).
SEAS-NVE has recently installed Smart Meters to all of its customers and is in process of identifying and realizing the benefits of them. The business case wasn’t an obvious one before the installation and the company is aiming to make the best of it in hindsight (2013).
Increased Measuring and Control DONG Energy will within one year’s horizon prioritize investment that will allow them to be able to monitor and control the grid better; it will primarily mean investment in IT and a lot of sensors. Of their 10 000 secondary substations, there is a plan to put ICT equipment in 3000 of them, compared to the 500 that are equipped today. The company has four or five different ICT solutions for the secondary substations with various degree of automation. Self-healing grid will be possible for the secondary substations linked to the AMR system that is under implementation and will be fully integrated within a year. This will only be feasible for about 200 secondary substations that are strategically located. DONG Energy will have a tender, possibly this year, for a meter data management (MDM) system (DONG Energy, 2013).

84
In the low voltage grid there are currently no devices, except for the coming Smart Meters. The company has some pilots for increased measuring in the low voltage grid, primarily on the feeders and in the cable boxes, but with the Smart Meter implementation DONG Energy believes other devices will be redundant and not economically feasible (2013).
Flexibility for Industry Customers All the interviewees emphasized the importance of flexibility in the future electricity system. Both companies are exploring possibilities to take advantage of customer flexibility through pilots and projects and they are both targeting industry customers. None of the interviewees believed in customer flexibility for private customers since the impact of their flexibility would be too small to create a positive business case (DONG Energy; SEAS-NVE, 2013).
“Is it really economically beneficial to try to control when you should start your washing machine? We need to try to find out what is most important and we will not start with the washing machine” (SEAS-NVE, 2013).
DONG Energy is currently exploring, through different projects, the feasibility in Smart Energy; how they can create a business model for rewarding customers for flexibility in electricity usage. The aim is to find agreements with large customers to be able to take advantage of their flexibility when there is a shortage of capacity, and reimburse them for that (2013).
Less End Consumer Contact The Data Hub in Denmark will collect all the metering data where the retailer in turn can collect the data and send only one bill to the customer, including the electricity distribution costs. When this is fully implemented, the DSO will have no contact with the end consumer. One interviewee meant that the grid companies see no gain in offering the end customer directly any extra services or features when the DSO has nothing to do with retail. However, the interviewee saw an opportunity to partner with service provider in the future to be able to offer other services beside the core business (SEAS-NVE, 2013).
Possibility of a Non Smart Grid Scenario The interviewees at DONG Energy were fully convinced that the development will continue towards a Smart Grid (2013). The interviewees at SEAS-NVE believed Smart Grid most likely would happen though one of the interviewees expressed two other scenarios as well, other solutions for enabling a larger share of wind power being fed into the power system. The first scenario is the development of storage technology to handle the time discrepancy between production and consumption, although the technology is not mature yet. The other scenario is an increased intercontinental transfer of electricity working as extended regulatory capacity; especially since Norway and Sweden has as much hydro power. Moreover the interviewee meant that Smart Grid as a way of postponing conventional investments only has a limited transit window because eventually conventional investments will be needed anyhow and then the Smart Grid opportunity will be gone (SEAS-NVE, 2013).
...we will not start with the washing machine
85
14.3 Current Situation The section describing the current situation is divided into three sections: Smart Meter Status, Forecasting and Pilots.
Smart Meter Status SEAS-NVE has already rolled out Smart Meters to its customers. The Smart Meters allow for readings with an interval of 15 minutes. The Smart Meters measure the usage very accurately and the customer gets a bill based on the actual usage and not the expected use, which also has allowed the company to collect reimbursement from customers who prior to the implementation paid less than they should have. The company uses GPRS and collects the data daily. There is delay in the data transmission and real-time information is not possible with the current set-up. SEAS-NVE implemented Smart Meters before the change in the revenue cap regulation and has realized in hindsight that the business case was barely positive (SEAS-NVE, 2013).
DONG Energy, as mentioned prior, has not yet implemented Smart Meters.
Forecasting DONG Energy has for the last five years worked a lot with forecasting, primarily electricity usage and transportation to the customers’ premises. Since three years ago the figures are aligned with external partners and DONG Energy wants to always have a consensus view with all the actors in the energy branch, primarily the TSO and Danish Energy Association, about the forecasts to improve accuracy when working with scenarios. “We assure that the figures we base our future on is actually in consensus with the industry” (DONG Energy, 2013). This is a method for reducing uncertainty.
Pilots Both companies are currently working with different type of pilots and the future choices depend on the success of these. DONG Energy highlights the current pilot in consumer flexibility; there is one existing agreement with a greenhouse and DONG Energy called the company earlier this year to ask them to reduce the load and it worked as it should. This is their first flexibility product for a DSO (2013).
SEAS-NVE highlights the project Smart City Kalundborg, which started in November last year, which is the most advanced Smart City project in Denmark so far. It includes an open platform for different suppliers of energy services to provide innovative solutions for energy and environment. It is aligned with the goal to have 50 percent of the electricity from wind power in 2050. In the project real-time data is collected from the consumers and is realized by using the consumers own internet since the PLC to the Smart Meter is too slow (SEAS-NVE, 2013).
We assure that the figures we base our future on is actually in consensus with the industry.

86
14.4 Driving Forces The identified driving forces are below categorized into Postpone Investments, Improve Outage Management and Enable Renewable Energy.
Postpone Investments The most prominent reason for Smart Grid implementation is the possibility to postpone conventional investments in the grid. The interviews companies see two categories of possibilities in Smart Grid to obtain this: one is the consumer flexibility for industry costumers and the other is increased ICT in the grid to allow for operation closer to the capacity limit (DONG Energy; SEAS-NVE, 2013).
“If you don’t have sensors you have to build the grid much bigger than it actually needs to be, but if you add sensors all the way, you can now exactly when the demand is high or low and go much closer to the capacity limit” (DONG Energy, 2013).
Today the every-day-operation reaches about 70 percent of the capacity limit since the redundancy in the grid is built to prevent outage when a feeder fails, which statistically happens one or maximum two times per year. DONG Energy means that the business case for consumer flexibility is very simple: to reinforce a feeder costs about DKK 2 000 000 and every year it is possible to postpone this investment due to consumer flexibility, DONG Energy are able to pay the customer half of the money earned (or saved) on the yearly interest rate for the investment. Hence, with an interest rate on 5 percent it would be possible to pay the costumer DKK 50 000 per year for being flexible and still earn (save) DKK 50 000 for the company (2013).
Improve Outage Management Both companies relay on customer phone calls to localize faults and outages in the power grid today and there is a common view that the this type of system is too old fashioned. Both companies, SEAS-NVE in particular, expresses a wish to improve this service to the customer and be more proactive in fault detection to minimize the outage time, which would be realized by more monitoring and control of the grid (DONG Energy; SEAS-NVE, 2013).
Enable Renewable Energy Both companies have been affected by the rapid increase in photo voltaic (PV) cells due to favorable regulations for installation for the private customer. The number solar panels installed grew too quickly and the government had to change the regulation partly because it was not possible for all grid companies to handle the feed in at any voltage level in the grid. The grid needs to be developed in order to be able to handle renewable energy in a larger scale into any voltage level of the grid (SEAS-NVE, 2013). DONG Energy have decided that the company wants to make it as easy and cheap as possible for customers to install PV cells an feed solar energy back into the grid, and currently customers do not have to pay grid cost for the energy that’s being fed back. DONG Energy also wants to enable electrical vehicles in a cost-effective way for its customers (2013).
If you don’t have sensors you have to build the grid much bigger than it actually needs to be

87
The biggest obstacle for Smart Grid is that is not much money in it
14.5 Challenges The section describing current challenges is divided into Uncertainty in Consumer Flexibility, Security and Limited economic gains.
Uncertainty in Consumer Flexibility The interviewed companies, both advocating industry costumer flexibility, are uncertain about the actual potential. To be able to postpone investments as a result, the flexibility must be very reliable for the companies to ensure quality of supply. “We separate Smart Energy from Smart Grid because we know we will do Smart Grid and we hope we will do Smart Energy” (DONG Energy, 2013).
Both companies mean that the agreement with the consumer to be flexible also needs to be long term, since grid reinforcement can’t be done on an ad hoc basis if the customer after two years decides to not be flexible. DONG Energy means that it will take at least 10 years before an agreement that allow them to postpone investments in reinforcement can be entered (2013).
Security Cyber security is believed to be a relatively new concern when moving towards Smart Grid. It has not been an issue so far, but since the next generations of Smart Meters even allow for the possibility to switch off customers’ electricity, security issues will gain increasing attention. The interviewees at DONG Energy saw two parts of cyber security; one relating to the private consumer and one to the grid company. For the customer perspective the issues concern accessibility to electricity usage and user profiles via the Smart Meter, if security is insufficient hackers will be able to either steal energy or gain access to the private consumers’ behavioral patterns. From the DSOs perspective the implementation of Smart Meters will rapidly increase the number of entry points to the power system and which may make it possible to reach their main system. At DONG Energy the IT support is very concerned with making sure their central system is protected from unauthorized use, although the security issue does not affect the choice of private or public communication network. For the customer security, the company will follow present regulations (2013).
Limited Economic Gains The companies’ major challenge for Smart Grid development is the limited economic gains it offers. A development for the sake of development is not feasible for either of the companies. “The biggest obstacle for Smart Grid is that is not much money in it” (DONG Energy, 2013).
The electricity consumers are in the end paying for the development and there is currently not sufficient interest in energy to drive the development. Furthermore, much of the technology on the market for enhancing the monitoring and controlling in the grid is developed
We separate Smart Energy from Smart Grid because we know we will do Smart Grid and we hope we will do Smart Energy

88
for substations in the high-voltage grid; they are much fewer and have much higher requirement. It is not feasible to use this same equipment (from companies such as ABB or Siemens) for the secondary substations in the distribution grid, when the numbers of substations multiplicities by a factor of 100 compared to the high voltage grid (DONG Energy; SEAS-NVE, 2013).
“The challenge is to keep it simple and not overkill your solution. It is easy to think big systems, but companies fail because technology investments become too heavy. If we can retrieve 80 percent of our data with little technology it is better for us than 100 percent of fancy data” (SEAS-NVE, 2013).
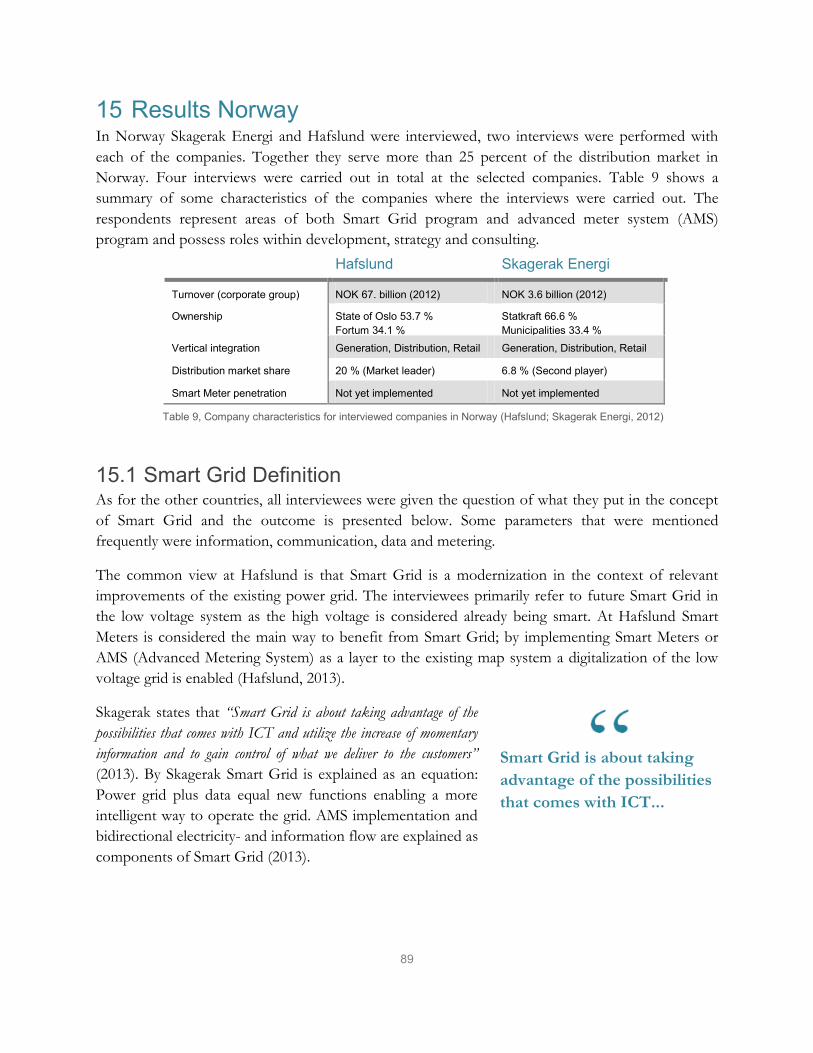
89
Hafslund Skagerak Energi
Turnover (corporate group) NOK 67. billion (2012) NOK 3.6 billion (2012)
Ownership State of Oslo 53.7 % Fortum 34.1 %
Statkraft 66.6 % Municipalities 33.4 %
K Vertical integration Generation, Distribution, Retail Generation, Distribution, Retail
Distribution market share 20 % (Market leader) 6.8 % (Second player)
Smart Meter penetration Not yet implemented Not yet implemented
15 Results Norway In Norway Skagerak Energi and Hafslund were interviewed, two interviews were performed with each of the companies. Together they serve more than 25 percent of the distribution market in Norway. Four interviews were carried out in total at the selected companies. Table 9 shows a summary of some characteristics of the companies where the interviews were carried out. The respondents represent areas of both Smart Grid program and advanced meter system (AMS) program and possess roles within development, strategy and consulting.
15.1 Smart Grid Definition As for the other countries, all interviewees were given the question of what they put in the concept of Smart Grid and the outcome is presented below. Some parameters that were mentioned frequently were information, communication, data and metering.
The common view at Hafslund is that Smart Grid is a modernization in the context of relevant improvements of the existing power grid. The interviewees primarily refer to future Smart Grid in the low voltage system as the high voltage is considered already being smart. At Hafslund Smart Meters is considered the main way to benefit from Smart Grid; by implementing Smart Meters or AMS (Advanced Metering System) as a layer to the existing map system a digitalization of the low voltage grid is enabled (Hafslund, 2013).
Skagerak states that “Smart Grid is about taking advantage of the possibilities that comes with ICT and utilize the increase of momentary information and to gain control of what we deliver to the customers” (2013). By Skagerak Smart Grid is explained as an equation: Power grid plus data equal new functions enabling a more intelligent way to operate the grid. AMS implementation and bidirectional electricity- and information flow are explained as components of Smart Grid (2013).
Smart Grid is about taking advantage of the possibilities that comes with ICT...
Table 9, Company characteristics for interviewed companies in Norway (Hafslund; Skagerak Energi, 2012)

90
15.2 Drection The direction of the interviewed DSO companies in Norway is categorized into Vision, Roadmap for Smart Grid, Future Power System and ICT solutions, Requirements of Future Implementations, Market Structure and Possible Future Partners.
Vision Skagerak aims to be in the front of Norwegian DSOs when it comes to Smart Grid and utilization of ICT. For 2019 Skagerak has the target to have the best operator center in the Nordics. The vision is to enable measuring, control and secure delivery of energy by being proactive and take advantage of the regulations. Skagerak ascribes great importance to the ability to measure, stating that “the reality should be measured” (2013). Currently Hafslund has no stated vision for Smart Grid but the plan is to accomplish one in the context of the AMS program (2013).
Road Map for Smart Grid Hafslund roadmap for Smart Grid exclusively involves AMS implementation in terms of activities each year until the mandatory rollout for Smart Meters. In 2013 planning of processes for Smart Meter rollout will be taking place. In 2014 a major IT project will take place including the establishment of support systems and requirements for enabling integrations with the SCADA system. In 2014 Hafslund will initiate the procurement of ICT systems and Smart Meters. Smart Grid pilot projects will take place in 2015 and the actual rollout will be initiated in 2016 and completed in the middle of 2018 allowing half a year margin until the completed rollout is mandatory. Hafslund will invest NOK 1-2 billion in the mandatory rollout of Smart Meters (2013).
For Skageraks AMS is the first step; the roadmap has been postponed accordingly to the postponement of mandatory rollout. The roadmap from 2013 to 2019 consists of AMS implementation, demand response, reduction of outages and by 2019 the aim is a self-healing grid. Skagerak will invest NOK 3 billion in a period of five years in what they call Smart Grid Program and estimates that ICT carries 30 percent of the total cost related to AMS implementation (2013).
Future Power System and ICT Solutions Skagerak believes that the electricity system will be coordinated and integrated with gas- and water systems as the municipalities usually possesses ownership in all parts, but it is not expected to happen within the coming ten years. Both companies expect an increase of microgeneration but not to a large extent as the customer demand is considered to be low. Hafslund will require adequate support system that can handle microgeneration in the future if the customer demand would increase significantly (2013). The companies are in consensuses that in the future it will be fewer DSOs operating on the Norwegian market due to either directly regulations or indirectly due to tough economical requirements. Both Hafslund and Skagerak believe in the Smart Grid scenario and the development toward Smart Grid is expressed as inevitable (2013).
The reality should be measured

91
Requirements of Future Implementations Skagerak underlines the importance of building a flexible communication system as it will take time until standards will be agreed upon and therefore the flexibility of a communication implementation is vital. Skagerak also highlights the importance of the communication system to be stable and operationally reliable, handling large volumes of data and also managing the data, “collecting the data is not synonymous with the ability to managing it” (2013). With Smart Grid Skagerak expects to enable efficient demand response, increased meter data, enhanced attention to the operation, efficient operational processes, improved error detection, analysis and documentation, increased automation and increased development of services (2013).
Hafslund wants to enable improved outage management and demand response management by implementing sensors in the grid. Hafslund wants the Smart Meters to be connected to the SCADA system in the high voltage system and that devices will be implemented all over the power grid system to enhance control. However, the future development also needs to be characterized by cost-efficiency. “It should just work and not cost anything” (Hafslund, 2013).
Market Structure Both companies expects the number of DSOs to decrease since the smaller DSOs today can’t take on all their costs and some of their expenses is transferred to the larger DSOs, which isn’t sustainable. Hafslund have ambitions to grow in distribution not only due to the expected growth of Oslo but rather by mergers of smaller DSOs. Paradoxically, there were indications during the interviews that the grid part of the company would be sold off (2013).
Possible Future Partner Hafslund consider there to be two paths to go in terms of partnership for Smart Grid, either as a service by telecom operators such as Telenor, Telia and Ericsson, or to invest in their own WiMAX or PLC solutions. A combination is most likely. Hafslund underlines that they are open minded for all sorts of communication systems. Skagerak also considers telecom operators to be possible future partners and highlights great potential in related smart phone applications. Skagerak expects more third part involvements in the future (2013).
15.3 Current Situation The current situation of the interviewed companies in Norway is categorized into Smart Meters and Existing Systems, Workforce and Time Perspective and Pilots.
Smart Meters and Existing Systems Currently Smart Grid is mainly about AMS from the perspective of both companies, where Skagerak extends the perspective and has a broader and more proactive approach. Skagerak describes the current status of Smart Grid development to be standing still due to the mandatory Smart Meter rollout being postponed (2013). Hafslund expresses that “Our operational center in the high voltage level is
Collecting data is not synonymous with the ability to manage it
92
the most advanced in Europe; it is just that the term ‘smart’ is not used” (2013). Hafslund and Skagerak both describe their high voltage system and the SCADA system to be smart and therefore consider the current Smart Grid concept to be focusing primarily on the low and medium voltage grid. In the high voltage system Hafslund have established an operation center together with Samsung. In the operation center SCADA is connected with the DMS, the outage management system (OMS) and geographical information system (GIS). However, they are just in the starting blocks when it comes to the low voltage part and underlines that the future communication system is not determined. Skagerak considers itself to be in a good position mainly due to the existing excellent DMS from Tekla (2013).
Workforce and Time Perspective With the current AMS project 30 persons on Hafslund are involved, and 3-5 persons are dedicated to Smart Grid. At Skagerak 350 persons are employed at the network company and about five persons are involved and two of them in great extent dedicated to Smart Grid. Mainly Skagerak, but also Hafslund to some extent, address that the whole industry possesses a relative old workforce and that a generation shift will take place, which probably brings new perspectives of significance to the Smart Grid development (2013).
Hafslund believes that “in five years’ time Smart Grid is still a project” and in ten years the whole grid is digitalized, which means that the infrastructure part of Smart Grid will be reached in ten years but not the related services (2013).
Pilots Hafslund have carried out minor pilots in Smart Metering and will continue with pilots in larger scale by 2015 and then gradually increase the amount of Smart Meters as a fully implementation is obliged first of January 2019 (Hafslund, 2013).
Skagerak’s pilot approach is more proactive and they have carried out a lot of pilots related to Smart Grid, and AMS implementation in particular. Knowledge about the metering has been gained but competence in the communication and the system is lacking. Skagerak also looks at solar generation, photovoltaic system (PV), because the belief is a PV increase integrated in buildings even though it is not subsidized by the government due to the rich supply of hydro power (2013).
15.4 Driving Forces The identified driving forces towards Smart Grid by the interviewed companies in Norway are categorized into Regulatory Directives, Changed Consumer Pattern and Postpone and Optimize Planned Investments.
Regulatory Directives In the current situation Smart Grid is almost exclusively about Smart Meters and the AMS implementation, which is due to the focus from the regulatory authorities (Skagerak Energi, 2013).
In five years’ time Smart Grid is still a project...
93
Both Hafslund and Skagerak are mainly driven by regulations but Skagerak possesses a more proactive approach by the willingness to explore benefits and take advantages of implemented regulations. Regulations drive the development both by direct directives with Smart Meter implementation for example but also indirect where electrical vehicles (EVs) are brought up as one example. Both companies agree that a continued increase of EVs will drive the development. The Norwegian mandatory rollout of Smart Meters was postponed from 2013 to 2017 and then to 2019, which is the current date and the roadmaps for each of the companies have been deferred accordingly. The benefit Skagerak mentions with the postponement to 2019 is that they will have longer time to evaluate techniques and prepare the rollout. Hafslund will do what the regulators require and is satisfied about not being proactive in making investments that are not required (2013).
Changed Consumer Pattern Hafslund wants to be a part of the concept green energy including EVs, solar panels and surplus customers. Surplus customers are rare and Hafslund expects an increased interest from the customers, but not to a large extent. But currently the customer is not seen as a driving force (Hafslund, 2013).
On the other hand, Skagerak has a more pronounced customer focus: “It is the customer that should govern the development of the grid” (2013). Electricity is taken for granted by the customers, there is low acceptance for outages and the customer puts pressure on the DSO requiring information updates with low latency. To offer the customers that sort of information and a correct and not estimated bill is one of the benefits and drivers behind AMS implementation, even though it is currently no customer demand for it. Both Hafslund and Skagerak questions the customers’ interest in getting involved and change behavior due to the low price of electricity. Skagerak still sees the possibilities to involve some household customers in flexible price structure but has a larger interest for industry customers. The interest in energy from the consumer side is expected to rise if the electricity price increases (Hafslund; Skagerak Energi, 2013).
Postpone and Optimize Planned Investments Skagerak will ensure to benefit as much as possible from the regulations by being proactive and finding advantages that can be extracted from the regulations. The possibility to postpone heavy investments, such as reparations and maintenance, optimize operation and the enablement to handle peak load are mentioned as the company’s own main drivers. Hafslund mainly sees the possibility to improve investment planning as a motivator for Smart Grid investments, which will be enabled by increased monitoring of the grid operation. The companies both consider improved outage management to be a driver as it is one of the main cost items (2013).
15.5 Challenges Skageraks reason for not having invested in Smart Grid prior is a question about financial priorities, while Hafslund rather saw the investments as bad business cases (2013). The challenges of the interviewed companies in Norway are categorized into Regulations and Financing, ICT Implementation, Changed Electricity Use Behavior and Market Structure and the Industry Itself.

94
Regulations and Financing The common view is that regulations are the main driving force but also the main challenge. Primarily because innovation, R&D and pilots are not encouraged by regulations as the revenue cap doesn’t take these costs in to account. Hafslund has an issue of identifying “who should pay?” (2013) and considers it to be a lack in the business case.
The challenge to cope with changing directives is expressed by both companies. The complexity of regulations is a challenge. “If all DSOs carry outs equal investments it will not have an impact on benchmarking, leading to a caution that inhibits innovation” (Skagerak Energi, 2013). Regulation is currently also considered being a hinder for the integration of the electricity system and gas- and water system (Skagerak Energi, 2013).
Hafslund and Skagerak consider the lack of regulated standardizations in the field of Smart Grid as a challenge. Moreover, a modification of the depreciation time is needed as the technology will not last for as long as other components that exists in the grid today (2013).
ICT Implementation Hafslund states two additional vital challenges towards a Smart Grid development. The first main challenge is to choose the right communication technology that is future compatible and reasonable to operate as investment costs wishes to be low. The second challenge is the integration of different systems and the third is security as the technology needs to be secure. Skagerak also recognizes the challenge of future collaborations and underlines that regulations from NVE will have an impact on the possible actors to collaborate with (2013).
Both Hafslund and Skagerak addresses the challenge of ICT implementation and integrating new devices into the exciting grid, Skagerak is concerned about the conflict with old components and both companies about the lasting of new installed devices. Hafslund states that a new installed ICT system must be able to handle remote updates (2013).
Changed Electricity Use Behavior Even though both companies have low faith in the willingness of household end users interest of changing behavior both companies refers to changes in the electricity usage. The increased load on the grid due to electrical vehicles is considered as a challenge by both companies, as well as systems to handle microproductions in households. Both Skagerak and Hafslund address electrical vehicles as a challenge that differentiates Norway from the other Nordic countries due to the high amount of EVs and the continued increase (2013).
Market Structure and the Industry Itself The expected growth of Oslo will be challenging according to Hafslund, and a lot of Smart Meters will need to be implemented. Both companies considers the number of DSOs as an issue and that the amount will need to decrease (and expect it to happen) as the larger DSOs by regulation take on the costs of the smaller DSOs as the smaller actors find it difficult to handle the regulations.
Who should pay?

95
Hafsluds recognizes one future challenge to be mergers because when the company intends to grow independent systems will have to be integrated. Both companies, Skagerak in particular, addressed the single point of contact by the retailer as a challenge due to decreased customer contact and the DSOs still have to find a way to relate to the customers and their requirements (2013).
Skagerak expresses dissatisfaction with NVE: “NVE have faced pressure from DSOs arguing that AMS rollout is unnecessary by questioning why they should make investments on the behalf of the consumer’s price, when it all already works fine” (2013). But Skagerak also puts faith in the future: “We as well as the whole Nordic energy sector stands in front of a paradigm shift, our younger staff have the possibility to drive the development towards higher intelligence integrated in the operation” (2013). Skagerak is alone in addressing the issue of the industry in itself and believes that the industry resists changes towards Smart Grid development. Skagerak also states that one of the main challenges is to get everyone within the company to steer towards the same goal as there is a resistance to change, which is a management solved with clear prioritizing (2013). A general challenge in the industry is the mindset of employees within companies and Skagerak considers itself as being in a good position from that perspective. However, the old workforce and ability to attract young talents in competition with the oil industry are still considered to be issues that will have impact on the Smart Grid development (Skagerak Energi, 2013).

96

97
Analysis & Conclusion The following sections cover the analysis and the conclusion. The analysis is based on the results and also incorporates knowledge from Literature Review, Nordic Power System and Country Overview according to the interview framework; Smart Grid definition, direction, current situation, driving forces and challenges. Scandinavia is analyzed as a whole but examples are given from particular countries. The conclusion summarizes the research, states the contribution of the research and gives some proposals for future research.

98

99
16 Analysis Below is the analysis presented in accordance with the interview framework: Smart Grid definition, direction, current situation, driving forces and challenges. It also incorporates knowledge from other parts of the research presented earlier.
16.1 Smart Grid Definition The definition of Smart Grid was investigated in the literature review and in addition defined by each respondent in the case study, which is analyzed below.
Ambiguous definition opposes a straight development As a consequence of Smart Grid being a so called buzzword and lacks an established general definition, various descriptions are found and the concept has become ambiguous. As a point of reference the definition below based on literature is used in this report.
Smart Grid is a bi-directional electric and communication network aimed to increase the efficiency of the operation of the grid through small to large-scale generation, transmission, distribution and usage.
In the case study of this research the Smart Grid elements mentioned by the representatives from the utility industry all fit in the definition. It is rather the focus on different elements in the descriptions that distinguish the companies’ view on Smart Grid, which causes the ambiguity. While some descriptions of Smart Grid were characterized by a holistic perspective where everything from generation to the behavior of the end consumer was included, other descriptions exclusively considered Smart Meters. The ambiguity could be an explanation for the existent lack of visions, strategies and standards for Smart Grid, both within the companies and the countries.
A sprawling development of Smart Grid is likely to be a consequence of the ambiguity. As the Nordic harmonization will progress, collaboration will increase and the countries will have more influence on each other, the absence of a general and established definition of Smart Grid can become a significant weakness.
As written in the literature review, a root definition could only contain a minimum number of verbs necessary to name and concisely describe the system. However, a short definition describing a paradigm shift in the power system will create ambiguity regardless of the wording. Therefore the overall definition needs to be complemented with definitions of the different parts of the Smart Grid, as it can be seen as systems within the system. In Denmark the largest DSO, DONG Energy, makes an attempt to separate systems from each other, making a distinction between Smart Grid and Smart Energy. A clear distinction between grid optimization and consumer flexibility facilitates strategy and goals, and reduces ambiguity.

100
16.2 Direction The analysis of Direction resulted in the following insights: Smart Grid will undoubtedly become reality, larger investments in new ICT solutions for middle voltage and low voltage grid, larger DSOs likely increase the need of outsourced ICT and demand for modular ICT solutions with remote updates, which all will be described further below.
Smart Grid will undoubtedly become reality The industry and policy makers are almost all in consensus regarding that Smart Grid will become reality. Although there is ambiguity in the use of the term Smart Grid, it is a topic on the political agenda as well as on those of the DSOs’. Only once during the case study of this research was a non Smart Grid scenario mentioned, which was brought up by the Danish DSO SEAS-NVE. The company saw a storage scenario and a scenario with increased intercontinental electricity transfer as possible substitutes. This is however rather a matter of definition since both storage and increased intercontinental electricity transfer can be a part of the Smart Grid scenario.
Smart Grid figures on the political agenda, as previously mentioned. Regulations drives the development to a more efficient power market and Smart Grid is likely to be realized regardless if the business cases for the DSOs are positive or not. A realization of Smart Grid will in turn require a development of ICT solutions adjusted to the DSOs’ operation.
Larger investments in new ICT solutions for MV and LV grids The research itself was performed from an ICT perspective because the need for ICT in the future power grid will be significantly higher than it has been historically, which will be reflected in the new investments. This was confirmed in the case study where all of the interviewed companies see an increase in ICT investments over the coming years, when adding more intelligence to the medium and low voltage grids.
The interviewed companies expressed a need for new ICT solutions, since the ICT in the high voltage grid is not suitable for the distribution grid. The high voltage grid technology is overqualified for usage in the distribution grid; the technical requirements are unnecessary advanced and accordingly the price is too high to be used in the distribution grid where the number of substations to be equipped is a least 100 times higher. This creates a new niche and opportunities for new actors for the development of medium and low voltage network ICT solutions.
On a similar topic, a common billing solutions need to be evolved since the Nordic harmonization will include a single-point of contact for the customers. One alternative could be to extend the previously mentioned Data Hub in Denmark to the rest of the Nordic countries. Synchronizing a pan-Nordic billing solution would also require larger investments in ICT.
Larger DSOs likely increases the need of outsourced ICT Nordic harmonization will increase the governance of the DSOs, which will be demanding for the smaller actors and likely lead to fewer DSOs acting on the Nordic market. Fewer and larger DSOs will imply larger ICT systems to be implemented to cover the same amount of consumers. The size
101
of the ICT system clearly affects the complexity and competence required to manage the system. It is thus clear that the DSOs need more ICT competence, but it is not clear how the DSOs will gain this field of expertise. Additionally, it was clear in the case study that the larger DSOs were more inclined to outsource ICT related activities and focus on what the companies considered core business while the smaller DSOs preferred to keep the ICT competence in-house. A consolidating market is therefore likely to increase the total market for outsourced ICT, partly as a result of the Nordic harmonization.
For use of public vs. private network a similar pattern could be seen; the larger companies such as Vattenfall, Fortum, Hafslund and DONG Energy were more open to public solutions than the smaller companies. However, none of the interviewed companies were willing to have critical information such as high voltage grid information in the public network, but only information they thought was less critical, such as customer or Smart Metering information, could be sent through public networks.
As more ICT related tasks will be outsourced there will be an increased need for partnerships with new stakeholders. The results from the case study imply that ICT companies will be integrated in the DSOs businesses to a larger extent and if the DSOs can specify their needs and requirements it will facilitate and increase the number of new actors on the power distribution market.
Demand for modular ICT solutions with remote updates The technological development goes towards integration of several systems into one single holistic ICT solution. Some companies have already started their integration of their DMS with NIS and GIS, but a larger scale integration of all ICT solutions is approaching. However, the interviewed DSOs felt locked by previous ICT investments when considering new ICT investments. Companies are reluctant to make large ICT investments due to uncertainty of future requirements. The lack of present and future standards forces the utilities to optimize the technology solutions after their own current needs. Therefore modular ICT solutions where the software could be changed in order to adjust to future requirements were requested by the DSOs during the interviews. The possibility to adjust to future needs becomes one of the most important requirements for ICT solutions.
102
16.3 Current Situation The analysis of Current Situation resulted in the following insights: well-functioning power grid with no urgent need for change and presently Smart Grid nearly synonymous with Smart Metering, which will be described further.
Well-functioning power grid with no urgent need for change The change in the power grid will be executed by the DSOs, but since their common view is that the existing grid is well-functioning little development will be driven by DSOs themselves. From the literature review it is clear that Smart Grid characteristics are designed to improve deficiencies in today’s power grid, but if the DSOs believe everything would work without a change there is no direct incentives to make that change. As can be found in Direction it is without doubt that Smart Grid will happen, but since the DSOs believe there is no urgent need for change the time horizon for the development increases. The utility industry, especially compared to the ICT industry, is already significantly more long-term where 10 years is regarded as a short time frame.
Presently Smart Grid nearly synonymous with Smart Metering Smart Metering is the first step in a development from the traditional grid towards Smart Grid in the Nordics and therefore it is used as a synonym for Smart Grid in some contexts. In the Literature Review it is clear that current literature primarily focuses on Smart Metering communication technology but refers to it as Smart Grid communication technology. This was also confirmed in the case study where many of the companies had a disproportionate Smart Meter focus. Norway, the country furthest behind in the Smart Grid development, solely focuses on Smart Metering as Smart Grid development. The focus is likely to shift towards a more general grid perspective as the development progresses.

103
16.4 Driving forces The analysis of Driving Forces resulted in the following insights: regulations are the main driving force, share of intermittent energy decide development pace and Smart Grid investment evaluated against regular investments, which will be described further below.
Regulations are the main driving force The results from this research clearly show that the regulations is, beyond dispute, the strongest driving force, which to a certain extent can be explained by the DSOs acting in a natural monopoly governed by regulations. Even though the DSOs are governed by regulations it is worth noting that regulations was described as a much stronger driving force than the DSOs own benefit of implementing Smart Grid technologies, which in current state particularly involves Smart Meters. Most of the DSOs do not see the business case for Smart Grid applications, but it is still on all agendas to implement Smart Grid due to pressure from the regulator. The mandatory rollout of Smart Meters in Sweden 2009 is an example showing the significant regulatory impact.
Larger DSOs seem to have a greater impact on regulators than smaller, which is particularly evident in Norway and Denmark. In Norway and Denmark Hafslund respectively DONG Energy have the possibility to affect the regulations according to their own benefit. However, this only seems to be the case when there is a single DSO that possesses much larger market share than the others as this is not the case in Sweden where Fortum, Vattenfall and E.ON all have large market shares. Smaller DSOs seem to have a hard time affecting the regulators unless they are active in forums that can lobby for their cause, like Mälarenergi are. Since regulations are crucial for the DSOs development, forums with political and industry representatives will be of great importance and the relevance of lobbying is likely to increase from the DSOs’ perspective.
Share of intermittent energy decide development pace Literature and reports state that the major driving force for Smart Grid in Europe, and especially in the Nordics, is the high integration of renewables into the power grid. However, it is principally relevant to focus on the share of intermittent renewables, such as wind and solar power, which creates new production patterns that strain the existing power grid.
In contrast to other renewables such as biofuels or hydro power the intermittent sources require improvement actions where better ICT solutions can be an alternative. The high share of large scale hydro power that Norway and Sweden possesses is a good prerequisite to manage a coming increase of intermittent renewables, with less need for ICT solutions. Denmark on the other hand holds a great share of wind power and the amount will increase in a foreseeable future because of the climate targets. The large amount of intermittent energy in combination with a lack of complementary regulatory capacity means that Denmark has great incentives to find solutions to handle the unreliability in supply.
Similar, in terms of creating a new pattern that strains the existing power grid, is a substantial increase of electrical vehicles (EVs) on the user side, which is also likely to drive the development.

104
Norway already has the largest share of EVs per capita in the world and the vehicle fleet is expected to increase due to heavy subsidies.
Within ten years the share of renewables will increase and the amount of intermittent renewables will decide the pace of which Smart Grid is developed; therefore the future development will probably progress faster in Denmark than in Sweden and Norway.
Smart Grid investment evaluated against regular investment Smart Grid investments intend to improve the existing power grid and therefore all Smart Grid investments are weighted against regular power grid investments. As mentioned earlier, the DSOs are mainly driven by regulations and can be forced to do Smart Grid investments as in the cases with mandatory Smart Meter rollout. In these cases the DSOs chose the extent of the investment based on the business case being positive or not. Positive business cases for Smart Grid are often characterized by the possibility to postpone conventional investments. There are mainly two different business cases for postponing investments that can be distinguished:
1. The DSOs can invest in Smart Grid technology that enables them to have a better overview of where the networks are under pressure and then reroute the electricity flow to avoid bottlenecks that stresses the grid, which could be compared to the cost of doing reinforcements on the grid where there are bottlenecks.
2. The DSOs can invest in Smart Grid technology that enables monitoring and load shifting, e.g. through customer flexibility, to run the electricity flow closer to the capacity limit, which could be compared to the cost of enforce the grid to increase capacity.
The evaluation against regular investments determines the investment space for ICT solutions. The comparison with alternative regular investments could inhibit the development of Smart Grid as synergies in the complex system of ICT implementation can be ignored. On the other hand decreased costs for ICT implementations will instead rather drive the development towards Smart Grid when related investments are compared to regular investments.

105
16.5 Challenges The analysis of Challenges resulted in the following insights: regulations aimed at competition suboptimize Smart Grid, challenge to analyze big data not to collect it and lack of business case due to uncertainty, which will be described below.
Regulations aimed at competition suboptimize Smart Grid Regulations applied for Scandinavian utility industry, and DSOs in particular, mainly aim to improve market competition and strengthen the customers’ position. The Nordic harmonization further confirms the focus on these two targets. Regulations are the main driving force towards Smart Grid development but Smart Grid in itself is not a dedicated purpose. In addition the DSOs rarely see a clear business case and as a consequence the inevitable deployment of Smart Grid risks to be suboptimized, when the aim is market competition and not Smart Grid optimization.
Challenge to analyze big data and not to collect it The distribution networks’ transformation towards a digitalized operation platform leads to emergence of big data. It implies both collecting the data and extracting value from it, which currently is discussed by the DSOs in the context of Smart Metering. Some DSOs are already collecting the Smart Meter data, but do not exploit the full potential of the possible value extraction. The DSOs are in need of additional competence to be able to extract the value and to understand the possibilities that can be enabled. Some results from interviews with DSOs revealed a misconception about big data, for example Vattenfall dismissed the issue of big data and argued that the amount of data in the utility industry will be much lower compared to other industries. What Vattenfall misses in the statement is the main part of big data considering the extraction of value. Even though most DSOs did underline the importance and challenge of managing data, it is a major challenge to enable better understanding of the possibilities that comes with increased data. The industry must gain larger understanding and be convinced about possible benefits that can come with increased data in order to consider it being a preferable business case.
Lack of business case due to uncertainty Aside from the size of the cost for ICT investments, additional parameters characterized by uncertainty cause difficult business cases for Smart Grid from the DSOs’ perspective. Uncertainty is caused by concern about the political climate and doubts about customer flexibility. Since Smart Grid largely is driven by regulations the political climate is of significance. From the interviews with the DSOs a great concern about easily changeable political agendas were widely conveyed, revealing caution for investments to become outdated rapidly. It is not only the lack of guidelines, requirements and standards, it is also the lack of confidence that political incentives will endure long enough for the large investments to pay back. For example, the additional requirement for hourly metering that was decided after the mandatory rollout of Smart Meters in Sweden leaves approximately 30 percent of the installed meters outdated long before depreciation time. Furthermore the costs for R&D and Smart Grid pilots are not taken into account in the revenue cap

106
models for the DSOs, which hamper the DSOs ability to evaluate alternative solutions and recognize potential benefits.
Besides the political uncertainty the DSOs also lack confidence in the customers’ willingness to change behavior as the monetary incentives are low. If confidence in customer flexibility and also willingness to pay for increased information and wider range of options is absent, the DSOs see no business case for the consumer-side of Smart Grid and will not invest on their own initiative. However, a larger interest from the consumers would create a public opinion that would affect policy progression and uncertainty would be reduced. A consistent and long term political agenda would be needed to reduce uncertainty concerning political changes and as a consequence increase the DSOs’ willingness to make sustainable investments.

107
17 Conclusion Smart Grid as a topic can be seen as an intersection between the two industries of utility and information and communication technology (ICT). The analysis of this research clearly shows that Smart Grid will become reality, but there is also an ambiguity attached to the concept and the lack of strategies will hamper the development. In Scandinavia Smart Grid has almost become synonymous with Smart Metering, and in the same way Smart Metering communication technology used synonymous with Smart Metering communication technology. This is the case since Smart Metering is the first step towards Smart Grid, confirmed by both the general literature review and the Scandinavian specific case study.
The business cases for Smart Grid are not obvious to the DSOs. The investments are weighted against conventional investments and it is widely considered that the power grid is well functioning and in no urgent need of change. Positive business cases for Smart grid are likely to emerge if the relative cost for ICT solutions becomes viable. In addition to the cost parameter, uncertainty in political incentives also contributes to the lack of business case. It is not only a lack of requirements and standards, but also a lack of confidence for political incentives to endure long enough for the large investments to pay back. The uncertainty in political climate is of significant importance as regulations are undeniably the main driving force for Smart Grid development. To a large extent regulations aim to make the market place for DSOs more competitive, which might suboptimize the development towards Smart Grid as Smart Grid in itself is not the purpose. In terms of Smart Grid development, regulations are both the major driving force and a major challenge.
The Scandinavian countries’ high ambitions for increased renewables will in terms of intermittent energy sources cause new patterns in generation, which will strain the existing power grid and give reasons for Smart Grid investments. As Denmark does not have flexible large scale hydro power to compliment the country’s large and increasing share of wind power, it can be expected that Denmark will have a more stringent developed towards Smart Grid than the other Scandinavian countries.
The contribution of this research is to map the Smart Grid development in the Scandinavian countries from a distribution perspective, hence anchoring the ambiguous Smart Grid concept to real development taking place in this geographical area and explaining the mechanisms behind the development.
17.1 Suggestions for Future Research Proposed future research is a continuation of this study in other parts of the world to map the DSOs’ global development and better understand how the mechanisms behind the development differs by geographical location. Another proposal would be to conduct this type of research in other parts of the energy value chain, such as from the perspective of retailers and end users, to obtain the whole perspective of the development.

108
109
18 List of References Bank, L., & Carlsen, L. (2013, April 10). Energitilsynet. (A. Christensson, N. Gerson, & E. Wallin,
Interviewers) Copenhagen.
Boverket. (2012). Boende: Boverket. Retrieved March 18, 2013, from Boverket: http://www.boverket.se/Boende/Analys-av-bostadsmarknaden/Bostadsmarknadsenkaten/Region-karta-over-kommuntyper/Storstockholm/Byggandet/
Cecati, C., Citro, C., Piccolo, A., & Siano, P. (2011, October). Smart Operation of Wind Turbines and Diesel Generators According to Economic Criteria. IEEE Transactions on Industrial Electronics, 58(10), 4514-4525.
CEER. (2012). 5th CEER Benchmarking Report on the Quality of Electricity Supply. Brussels: Council of European Energy Regulators.
Checkland, P. (1999). Systems Thinking, Systems Practice. Wiley.
Churchman, C. W. (1984). The Systems Approach. Dell Pub Co.
Clark, A., & Pavlovski, C. J. (2010). Wireless Networks for the Smart Energy Grid: Application Aware Networks. International MultiConference of Engineers and Computer Scientists . II. Hong Kong: IMECS.
Clastres, C. (2011). Smart grids :Another step towards competition,energy security and climate. Energy Policy, 39, 5399-5408.
Damsgaard, N. (2008). Energimarknader. IVA.
Danish Ministry of Climate, Energy and Building. (2013). Smart Grid Strategy - The intelligent energy system of the future. Copenhagen: Danish Ministry of Climate, Energy and Building.
DEA. (2012). Energy Statistics 2011. Copenhagen: The Danish Energy Agency.
DEA. (2013). Emission Trading Scheme: Danish Energy Agency. Retrieved 25 April, 2013, from Danish Energy Agency: http://www.ens.dk/en-US/ClimateAndCO2/emissiontradingscheme/Sider/Forside.aspx
DERA. (2011). 2011 National Report to the European Commission Denmark. Danish Energy Regulatory Authority. Eurpean Regulators Group for Elerctricity and Gac.
DONG Energy. (2012). Annual Report . Copenhagen: DONG Energy A/S.
DONG Energy. (2013, April 8). (A. Christensson, N. Gerson, & E. Wallin, Interviewers) Copenhagen, Denmark.
110
Ea Energy Analyses. (2012). The Nordic electricity market and how it can be improved. Copenhagen : Ea Energy Analyses and Hagman Energy.
Energimarknadsinspektionen. (2011). Ram sätts för elnätsföretagens avgifter. Eskilstuna: Energimarknadsinspektionen.
Energimarknadsinspektionen. (2012a). Ei ger ut nya regler om timmätning. Retrieved April 20, 2012, from Energimarknadsinspektionen: http://www.energimarknadsinspektionen.se/sv/nyhetsrum/nyheter/nyhetsarkiv-2012/ei-ger-ut-nya-regler-om-timmatning/
Energimarknadsinspektionen. (2012b). Leveranssäkerhet i elnäten 2010; Statistik och analys av elavbrotten i Sverige. Eskilstuna: Energimarknadsinspektionen.
Energimarknadsinspektionen. (2013, January 31). Elnät och nätprisreglering. Retrieved April 20, 2013, from Energimakrnadsinspektionen: http://www.energimarknadsinspektionen.se/sv/el/Elnat-och-natprisreglering/
Energimyndigheten. (2008, January 4). Styrmedel. Retrieved April 23, 2013, from Energimyndigheten: http://www.energimyndigheten.se/sv/Om-oss/Energi--och-klimatpolitik/Styrmedel/
Energimyndigheten. (2012a). Energiläget 2012. Eskilstuna: Energimyndigheten.
Energimyndigheten. (2012b). Energiläget i siffror 2012. Energimyndigheten.
Energinet.dk. (2013, May 1). The retail market: Energinet.dk. Retrieved May 1, 2013, from Energinet.dk: http://www.energinet.dk/EN/El/Detailmarked/Sider/default.aspx
ENSTO-E. (2010). Impact of Increased Amounts of Renewable Energy on Nordic Power System Operation. Brussels: European Network of Transmission System Operators for Electricity.
ENTSO-E. (2013). Network Code Overview. Retrieved May 25, 2013, from European network of transmission system operators for electricity: https://www.entsoe.eu/major-projects/network-code-development/
Erol-Kantarci, M., & Mouftah, H. T. (2011). Wireless multimedia sensor and actor networks for the next generation. Ad Hoc Networks, 9, 542–551.
European Commission. (2006). European Smart Grid Technlogy Platform - Vision and Strategy for Europe's Electricity Networks of the Future. Luxembourg: EU Publications Office.
European Commission. (2011). Smart Grids: from innovation to deployment. Brussels: European Commission.
European Commission. (2012, October 25). Energy Efficiency Directive. Retrieved April 29, 2013, from Europena Commission: http://ec.europa.eu/energy/efficiency/eed/eed_en.htm
111
European Commission. (2013). Single market for gas & electricity. Retrieved May 25, 2013, from Energy: http://ec.europa.eu/energy/gas_electricity/codes/codes_en.htm
European Technology Platform. (2010). SmartGrids;; Strategic Deployment Document for Europe’s Electricity Networks of the Future.
Eurostat. (2013, February 26). Gross inland energy consumption, by fuel. Retrieved May 4, 2013, from Eurostat: http://epp.eurostat.ec.europa.eu/tgm/refreshTableAction.do?tab=table&plugin=1&pcode=tsdcc320&language=en
Farhangi, H. (2010, January/February). The path of the Smart Grid. IEEE Power and Energy Magazine, 18-28.
Fortum. (2007, September 24). Den Nordiska elmarknaden - Idag och i morgon. Retrieved April 25, 2013, from http://www.fortum.com/countries/se/SiteCollectionDocuments/Elmarknad_broschyr_0709241.pdf
Fortum. (2012). Om koncernen. Retrieved April 25, 2013, from Fortum: http://www.fortum.com/countries/se/om-fortum/om-koncernen/pages/default.aspx
Fortum. (2013, March/April). (A. Christensson, N. Gerson, & E. Wallin, Interviewers) Stockholm, Sweden.
Grönkvist, S., Stenkvist, M., & Paradis, H. (2008). Nordeuropeisk Energikarta. IVA.
Güngor, V., Sahin, D., Kocak, T., Ergut, S., Buccella, C., Cecati, C., et al. (2011, November). Smart Grid Technologies: Communication Technologies and Standards. Industrial Informatics, IEEE Transactions on, 7(4), 529-539.
Güngör, V. C., Lu, B., & Hancke, G. P. (2010). Opportunities and challenges of wireless sensor networks in smart grid. IEEE Transactions on Industrial Electronics, 57(10), 3557-3564.
Güzelgöz, S., Arslan, H., Islam, A., & Domijan, A. (2011). A Review of Wireless and PLC Propagation Channel. Journal of Electrical and Computer Engineering, 2011.
Hafslund. (2013, April 15). (A. Christensson, N. Gerson, & E. Wallin, Interviewers) Oslo, Norway.
Hertzog, C. (2012). Smart Grid Dictionary: 4th Edition. GreenSpring Marketing LLC.
Hierzinger, R., Albu, M., van Elburg, H., Scott, A. J., Lazicki, A., Penttinen, L., et al. (2012). European Smart Metering Landscape Report 2012. Vienna: EU; Intelligent Energy Europe.
IEA & Nordic Energy Research. (2013). Nordic Energy Technology Perspective - Pathways to a Carbon Neutral Energy Future. IEA; Nordic Energy Reserach.

112
IEA. (2011a). Energy Policies of IEA Countries - Norway. International Energy Agency.
IEA. (2011b). Energy Policies of IEA Countries - Denmark 2011 Review. Paris: International Energy Agency.
IEA. (2013). Energy Policies of IEA Countries; Sweden 2013 Review. France: International Energy Agency.
International Electrotechnical Commission. (2010). IEC Smart Grid Standardization Roadmap. International Electrotechnical Commission.
Jeon, Y.-H. (2011, March). QoS Requirements for the Smart Grid Communications System. IJCSNS International Journal of Computer Science and Network Security, 11(3), 86-94.
Jönsson, M. (2011, August 9). Kärnkraftsproduktion: Svensk Energi. Retrieved March 19, 2013, from Svensk Energi: http://www.svenskenergi.se/sv/Om-el/Karnkraft/Produktion/
Kannberg, L. D., Kintner-Meyer, M. C., Chassin, D. P., Pratt, R. G., DeSteese, J. G., Schienbein, L. A., et al. (2003). GridWiseTM: The Benefits of a Transformed Energy System. Pacific Northwest National Laboratoty.
Klima-, Energi- og Bygningsministeriet. (2013). Smart Grid-Strategy - fremtidens intelligente energisystem. Copenhagen: Klima-, Energi- og Bygningsministeriet .
Krishnamurti, T., Schwartz, D., Davis, A., Fischhoff, B., de Bruin, W. B., Lave, L., et al. (2012). Preparing for smart grid technologies: A behavioral decision research approach to understanding consumer expectations about smart meters. Energy Policy, 41, 790-797.
Krook-Riekkola, A. (2013, January 24). IEA-rapport visar vägen till koldioxidneutralt Norden 2050. Retrieved April 5, 2013, from Luleå Tekniska Universitet: http://www.ltu.se/org/ets/Nyheter-och-aktuellt/IEA-rapport-visar-vagen-till-koldioxidneutralt-Norden-2050-1.101786
Larsen, V., & Odenbrand Linder, A. (2012). En gemensam nordisk slutkundsmarknad - Konsekvenser och vägval för aktörer på en elmarknad under förändring. Royal Institution of Technology, Department of Energy Technology.
Laverty, D. M., Morrow, D. J., Best, R., & Crossley, P. A. (2010). Telecommunications for Smart Grid: Backhaul solutions for the distribution network. Power and Energy Society General Meeting (pp. 1-6). IEEE.
Lewis, R. P., Igic, P., & Zhou, Z. (2009). Assessment of Communication Methods for Smart Electricity Metering in the U.K. Conference on Sustainable Alternative Energy (SAE), 2009 IEEE PES/IAS, (pp. 1-4).
Lisovich, M. A., Mulligan, D. K., & Wicker, S. B. (2010, January/February). Inferring Personal Information from Demand-Response Systems. Security & Privacy, IEEE, 8(1), 11-20.
113
Luan, W., Sharp, D., & Lancashire, S. (2010). Smart Grid Communication Network Capacity Planning for Power Utilities. Transmission and Distribution Conference and Exposition, 2010 IEEE PES, (pp. 1-4). New Orleans.
Lundström, F. (2013, February 28). Forskningsstöd, Förnybar energi, Energimyndigheten. (A. Christenssson, N. Gerson, & E. Wallin, Interviewers)
McDaniel, P., & McLaughin, S. (2009, May/June). Security and Privacy Challenges in the Smart Grid. Security & Privacy, IEEE, 7(3), 75-77.
Ministry of Climate. (2012). The Danish Energy Agreement of March 2012. Ministry of Climate, Energy and Building. Copenhagen: Prinfohhk.dk.
Ministry of Foreign Affairs of Denmark. (2012). Facts and Statistics: Denmark. Retrieved February 26, 2013, from Denmark: http://denmark.dk/en/quick-facts/facts/
Moslehi, K., & Kumar, R. (2010, June). A Reliability Perspective of the Smart Grid. IEEE Transactions on Smart Grid, 1(1), 57-64.
MPE. (2008). Fact 2008 - Energy and Water Resources in Norway. Norwegian Ministry of Petroleum and Energy . Norwegian Water Recources and Energy Directorate.
MPE. (2011, July 7). Target of 67.5 percent for Norway’s renewable energy share by 2020. Retrieved May 10, 2013, from Norwegian Ministry of Petroleum and Energy: http://www.regjeringen.no/en/dep/oed/press-center/press-releases/2011/target-of-675-percent-for-norways-renewa.html?id=651715
Mälarenergi. (2012). Företagsfakta. Retrieved April 25, 2013, from Mälarenergi: http://www.malarenergi.se/sv/om-malarenergi/foretagsfakta/
Mälarenergi. (2013, March 20). (A. Christensson, N. Gerson, & E. Wallin, Interviewers) Västerås, Sweden.
NIST. (2010). NIST Framework and Roadmap for Smart Grid Interoperability Standards,Release 1.0. U.S Departmemt of Commerce. Gaithersburg: National Institute of Standards and Technology.
Nord Pool. (2013a, April 21). Bidding Areas. Retrieved April 21, 2013, from Nord Pool: http://www.nordpoolspot.com/How-does-it-work/Bidding-areas/
Nord Pool. (2013b, April 26). History. Retrieved April 26, 2013, from Nord Pool Spot: http://www.nordpoolspot.com/About-us/History/
Nordic Energy Research. (2011). Status of harmonisation in the Nordic Electricity market 2011 - Status and developments following the Nordic Council of Ministers' Action Plan for a borderless electricity market. Nordic Council of Ministers Electricity Market Group.

114
NordREG. (2009). Market Design - Nordic end user Market. Nordic Energy Regulators.
NordREG. (2011a). Nordic Market Report 2009 - Development in the Nordic Electricity Market. Nordic Energy Regulators. Oslo: NordREG.
NordREG. (2011b). Economic regulation of electricity grid in Nordic countries. Copenhagen: Nordic Energy Regulators.
NordREG. (2012a). Nordic Market Report 2012. Nordic Energy Regulators.
NordREG. (2012b). Road map towards a common harminised Nordic end-user market. Nordic Energy Regulators.
NordREG. (2012c). High level suggestions for common Nordic processes forinformation exchange- obstacles and possibilities. Nordic Energy Regulators.
NordREG. (2013, April 22). About NordREG. Retrieved April 22, 2013, from NordREG: https://www.nordicenergyregulators.org/About-NordREG/
Nordström, L. (2010). Smarta Elnät. Stockholm: IVA Avd II.
Norwegian Smart Grid centre. (2013, April 20). Norwegian Smart Grid centre. Retrieved April 20, 2013, from http://smartgrids.no/senteret/senteret/
Nuclear Energy Agency. (2007). Regulatory and Institutional Framework for Nuclear Activities. Paris: OECD Publishing.
NVE. (2011). Annual Report 2011 - The Norwegian Energy Regulator. Norwegian Water Resources and Energy Directorate.
NVE. (2012a, August 10). Electricity disclosure 2011. Retrieved April 26, 2013, from Norwegian Water Resources and Energy Directorate: http://www.nve.no/en/Electricity-market/Electricity-disclosure-2011/
NVE. (2012b, August 10). Electricity disclosure 2011. Retrieved April 26, 2013, from Norwegian Water Resources and Energy Directorate: http://www.nve.no/en/Electricity-market/Electricity-disclosure-2011/
NVE. (2013, February 18). Utsatt frist for utrulling av AMS. Retrieved April 19, 2013, from Norwegian Water Resources and Energy Directorate : http://www.nve.no/no/Nyhetsarkiv-/Pressemeldinger/Utsatt-frist-for-utrulling-av-AMS/
Näringsdepartementet. (2012, September 25). Förnybar energi. Retrieved April 23, 2013, from Regeringskansliet: http://www.regeringen.se/sb/d/2448

115
Peizhong, Y., Iwayemi, A., & Zhou, C. (2011, March). Developing ZigBee deployment guideline under WiFi interference for smart grid applications. IEEE Trans. Smart Grid, 2, 110-120.
Regeringskansliet. (2011). Sveriges första rapport om utvecklingen av förnybar energi enligt artikel 22 i Direktiv 2009/28/EG.
Regeringskansliet. (2012, June 18). Nettodebitering av el och skattskyldighet för energiskatt på el. Retrieved April 25, 2013, from Regeringskansliet: http://www.regeringen.se/sb/d/15686/a/192088
Regeringskansliet. (2013, May 6). Samordningsråd för smarta elnät. Retrieved May 6, 2013, from Regeringskansliet: http://www.regeringen.se/sb/d/16444
Renner, S., Albu, M., van Elburg, H., Heinemann, C., Łazicki, A., Penttinen, L., et al. (2011). European Smart Metering - Landscape Report. Vienna: Austrian Energy Agency (AEA).
Ryberg, T. (2012). Smart Metering in Europe. Gothenburg: Berg Insight.
SCB. (2013a, February 20). Befolkningsstatistik 2012 - befolkningsförändringar. Retrieved March 18, 2013, from Statistiska Centralbyrån: http://www.scb.se/Pages/PressRelease____350650.aspx
SCB. (2013b, February 28). Annual energy statistics (electricity, gas and district heating). Retrieved April 22, 2013, from Statistiska centralbyrån: http://www.scb.se/Pages/TableAndChart____24271.aspx
SEAS-NVE. (2011). Annual report. Haslev: SEAS-NVE.
SEAS-NVE. (2013, April 9). (A. Christensson, G. Nadine, & E. Wallin, Interviewers)
Silva, J. M., & Whitney, B. (2002, April). Evaluation of the Potential for Power Line Carrier (PLC) to Interfere With Use of the Nationwide Differential GPS Network. IEEE Transactions on Power Delivery, 17(2), 348-352.
Skagerak Energi. (2013, April 16). (A. Christensson, N. Gerson, & E. Wallin, Interviewers) Porsgrund, Norway.
Skatteverket. (2013). Energi-, koldioxid- och svavelskatt. Retrieved Apriel 23, 2013, from Skatteverket: http://www.skatteverket.se/foretagorganisationer/skatter/punktskatter/allapunktskatter/energiskatter.4.18e1b10334ebe8bc8000843.html
Smart Grids ETP. (2013). Smart Grids European Technology Platform. Retrieved May 25, 2013, from European technology platform for the electricity networks of the future: http://www.smartgrids.eu/

116
SSB. (2013, March 20). Electricity, annual figures, 2011. (Statistisk Sentralbyrå Norge) Retrieved April 27, 2013, from Statistics Norway: http://www.ssb.no/en/energi-og-industri/statistikker/elektrisitetaar/aar/2013-03-20?fane=tabell&sort=nummer&tabell=104211
Svantesson, E. (2009, February 5). Grönt ljus för ny kärnkraft: DN. Retrieved March 19, 2013, from DN: http://www.dn.se/nyheter/politik/gront-ljus-for-ny-karnkraft
Svenska Kraftnät. (2013, March 28). Elmarknadens aktörer. Retrieved April 22, 2013, from Svenska Kraftnät: http://www.svk.se/Energimarknaden/El/Elmarknadens-aktorer/
Tai, H., & hÓgáin, E. Ó. (2009). Behind the buzz [in my view]. IEEE Power and Energy Magazine, 7(2), 96-92.
The Danish Government. (2011). Energy Stratagy 2050 – from coal, oil and gas to green energy. Copenhagen: The .
The Norwegian Trade Portal. (2011, August 31). Norway And Sweden Establish Green Certificate Market. Retrieved April 20, 2013, from The Norwegian Trade Portal: http://www.nortrade.com/sectors/articles/norway-and-sweden-establish-green-certificate-market/
Thorstensson, M. (2012, July 4). Elmarknaden: Svensk Energi. Retrieved March 20, 2013, from Svensk Energi: http://www.svenskenergi.se/sv/Om-el/Fakta-om-elmarknaden/
Thorstensson, M. (2013). Konsumentprisets delar - halva kostnaden politiskt beslutad. Retrieved April 22, 2013, from Svensk energi: http://www.svenskenergi.se/Elfakta/Elmarknaden/Konsumentprisets-delar/
U.S. Department of Energy. (2008). The Smart Grid: An Introduction. Washington DC.
Umeå Energi. (2012). Företaget Umeå Energi. Retrieved April 25, 2013, from Umeå Energi: http://www.umeaenergi.se/Om-Umeaa-Energi/Foeretaget/Foeretaget-Umeaa-Energi.ept
Umeå Energi. (2013, March 12-13). (A. Christensson, N. Gerson, & E. Wallin, Interviewers) Umeå, Sweden.
Vaccaro, A., Velotto, G., & Zobaa, A. F. (2011, October). A Decentralized and Cooperative Architecture for Optimal Voltage Regulation in Smart Grids. IEEE Transactions on Industrial Electronics, 58(10), 4593-4602.

117
Wang, W., Xu, Y., & Khanna, M. (2011, October). A survey on the communication architectures in smart grid. Computer Networks, 55(15), 3604-3629.
Vasconcelos, J. (2008). Survey of Regulatory and Technological Developments Concerning Smart Metering in the European Union Electricity Market. San Dominico di Fiesole: Robert Schuman Centre for Advanced Studies, European University Institute.
Vattenfall. (2012, April 10). Vår verksamhet. Retrieved April 25, 2013, from Vattenfall: http://www.vattenfall.se/sv/var-verksamhet.htm
Vattenfall. (2013, March/April). (A. Christensson, N. Gerson, & E. Wallin, Interviewers) Stockholm, Sweden.
Yarali, A. (2008). Wireless Mesh Networking technology for commercial and industrial customers. (pp. 1-6). IEEE.