master of public policy recidivism in … accepting high-risk participants convicted of sexual and...
TRANSCRIPT

92
RECIDIVISM IN MONTGOMERY
COUNTY, MARYLAND
Pre‐Release and Reentry Services Division
Montgomery County Department of Correction and Rehabilitation
Sarah Berday‐Sacks Spring 2014 Master of Public Policy Capstone Project

1
Contents Executive Summary.......................................................................................................................................2
The Pre‐Release Center.................................................................................................................................2
Performance Indicators in Reentry Programs...............................................................................................6
Why Policymakers Care About Recidivism..................................................................................................11
Recidivism Predictors..................................................................................................................................14
Benchmarking Recidivism ...........................................................................................................................20
Building A Definition of Recidivism.............................................................................................................23
Recidivism Research in Montgomery County .............................................................................................31
Data Analysis: Methodology .......................................................................................................................32
Data Analysis: Recidivism by Sub‐Group.....................................................................................................34
Data Analysis: Further Recidivism Analysis.................................................................................................42
Conclusions .................................................................................................................................................44
Appendix A: Original and Created Variables...............................................................................................52
Appendix B: Descriptive Statistics...............................................................................................................61
Appendix C: T‐Tests.....................................................................................................................................66
Appendix D: Correlation Coefficients……………………………………………………………………………………………………..92
Appendix E: Regressions ............................................................................................................................94
Appendix F: Methodology for Adding Future Months to Analysis .............................................................95

2
Executive Summary
This capstone project examines recidivism as a correctional systems metric in Montgomery
County, Maryland. The first component serves as a resource and springboard for CountyStat’s
investigation into a recidivism measure. It explores the magnitude, causes and patterns of
recidivism, generally defined as the return of an ex-offender to the criminal justice system. It
explains the methodological and theoretical problems in regarding recidivism as an evaluative
measure of program performance and comparing recidivism rates across jurisdictions. After
identifying great diversity amongst jurisdictions in the various elements of a recidivism
definition - measure type, time period, triggering act, and informing databases – this paper
concludes that PRC should maintain its current definition of recidivism. The second component
of this paper consists of a quantitative analysis of a sample of Montgomery County Pre-Release
Center releases in 2010 and 2012. The highest rates appeared among males, young adults, those
without college education, higher LSIR, African-Americans, and Drug Court offenders.
Applying regression analysis reveals that the apparent differences by race and gender to be
attributable to correlation with the true predictors of recidivism: age and LSIR risk. Interventions
and resources should be targeted to these populations.
The Pre-Release Center
Pre-Release and Rentry Services (PRRS), a division of Montgomery County’s Department of
Correction and Rehabilitation, facilitates the transition between incarceration and release.
Eligible offenders may serve the final portion of their sentence at PRRS’ residential facility: the
Pre-Release Center (PRC). PRC offers controlled access to the community, holistic

3
programming, and case management in order to improve residents’ reintegration into the
community upon exiting the criminal justice system. In the long-term, it seeks to improve public
safety in Montgomery County (PRRS, 2014). Over 17,000 individuals completed PRC since its
establishment in the late 1960s (Riccigreene Associates & Alternative Solutions Associates, Inc.,
2014). The Center is nationally known, and often referenced as a model of pre-release services.
The County’s support for PRC reflects the larger political culture of a government committed to
social services. In an interview, the Special Assistant to the County Executive (and former
director of the County’s Department of Health and Human Services) described the jurisdiction’s
self-identification as a “compassionate county” as a culture enabled by its affluence and political
progressivity (C. Short, personal communication, March 26, 2014). The population of over one
million (U.S. Census Bureau, 2014) and economic prosperity1, sustained during the recent
recession, allow for a sufficient tax base to support extensive social service programs.
PRC limits eligibility to three categories: (1) local offenders with an original sentence of at most
18 months and release date of at most 12 months (2) offenders in the Federal Bureau of Prisons
(FBI) being released in MoCo’s vicinity within 6 months, and (3) members of Circuit Court’s
Adult Drug Court program (Riccigreene Associates & Alternative Solutions Associates, Inc.,
2014). Major pending legal matters (such as detainers or warrants), prior escape convictions, or
public safety concerns, render applicants ineligible. Otherwise, criminal history doesn’t
disqualify candidates. By accepting high-risk participants convicted of sexual and violent crimes,
PRC differs from most halfway houses (S. LoBuglio, personal communication, April 11, 2014 ).
PRC either rejected or found ineligible only 5% of screened applicants (10p12). Given the 1 The median family income, $94,800, exceeds that of Maryland by over $23,000 (U.S. Census Bureau, n.d.a).

4
overall decline in the correctional population in the County, PRC has developed new
relationships with other criminal justice programs to ensure that its resources are utilized. For
example, six years ago, PRRS began partnering with the Adult Drug Court (Riccigreene
Associates & Alternative Solutions Associates, Inc., 2014). Furthermore, in 2007, PRC received
support to revise county law to modify minimum and maximum remaining sentence policies
governing PRC eligibility (Riccigreene Associates & Alternative Solutions Associates, Inc.,
2014).
Built in 1978, PRC contains 4 residential units. The average daily population of 152 individuals
(Montgomery County Department of Correction and Rehabilitation, n.d) is near capacity level
but projected to remain fairly stable over the next two decades in the Master Facilities
Confinement Study (MFCS). A February 2014 snapshot located 4% of the DOCR population in
PRC and 1% in PRRS-supervised home confinement. A ten-minute walk takes residents to the
White Flint metro station and other public transportation.
PRC’s population is demographically representative of the jail population, suggesting that
minimal observable “creaming” occurs (S. LoBuglio, personal communication, April 11, 2014).
As an important caveat, the extent to which the voluntary nature of the program leads to
differentiation between PRC and other DOCR residents in non-tangible characteristics is
unknown. Because PRC requires more structured programs than the traditional jail, and
employment, residents presumably possess different attitudes on average than peers electing
against participation.

5
The facility is overwhelmingly male, with females comprising 8% of the admitted population in
2013 (PRRS, 2014). For both sexes, the average age is 33 (PRRS, 2014). The most common
PRC offense was violation of parole in the MFCS (2014). At 18% of the county population,
Hispanic/Latinos are under-represented in PRC (U.S. Census Bureau). African Americans are
over-represented, comprising 17% of the county but 56% of PRC2. 61% of residents in 2013 left
PRC with employment. The charts below provide further population statistics:
3 4
PRC requires employment within 28 days of entry, a facet of its emphatic work-first philosophy.
Work Release Coordinators help residents with applications and stress long-term career
2 Over the last few decades, Montgomery transformed from mostly upper‐middle class whites to a “minority‐majority” district). 3 Pre‐Release and Reentry Services, 2014 4 Riccigreene Associates & Alternative Solutions Associates, Inc., 2014

6
planning. Additionally, PRS provides mental health services, GED classes, Alcoholics
Anonymous, anger management, conflict resolution, and other programs (Riccigreene Associates
& Alternative Solutions Associates, Inc., 2014). Other government agencies and community
groups facilitate supplemental services such as mediation and mentoring. These programs, along
with regular Community Advisory meetings, exemplify the county-wide practice of inter-agency
collaboration and engagement of stakeholders, regarded as vital to addressing complex social
problems (C. Short, personal communication, March 26, 2014).
Indeed, the Master Facilities Confinement Study highlighted the “growing complexity” of
MoCo’s correctional population (2014). Trends include the increasing frequency of offenders
with substance abuse disorders, mental health needs, and limited English skills. On a more
positive note, crime in Montgomery County continues to decrease following national and state
trends. According to the Department of Police, reported crime dropped 9% between 2012 and
2013 (Montgomery County Department of Police, 2014). Other than forcible rapes, commercial
robbery and commercial burglary, crime dropped in every offense category. Crimes with at least
a 20% reduction included murder, arson, vandalism, and juvenile offenses.
Performance Indicators in Reentry Programs
While exact definitions of the term differ, recidivism is the return of an offender to the criminal
justice system. Return can be defined as a re-incarceration, but also can denote re-arrest, re-
conviction, or a violation of probation (as discussed as length in “Building A Definition of
Recidivism”). Policymakers liken recidivism to a revolving door, wherein an individual will

7
cycle repeatedly in and out of a criminal justice system. Recidivism is a popular performance
measure of programs targeting the incarcerated, yet no consensus exists on measurement of the
concept. Before delving into the technical variations of recidivism definitions, it is important to
understand its role amongst other performance measures.
Recidivism in isolation produces a dangerously limited view of a correctional system.
Conceptually, third-parties can't evaluate the effectiveness of reentry programs by recidivism
rates because they are inextricably shaped by factors external to the program (a challenge
covered in-depth in “Benchmarking Recidivism”). Given that most studies do not incorporate a
control group, the statistic reflects the functioning of the larger correctional system rather than
the success of the particular program. Similarly, recidivism rates offer limited practical
information to practitioners concerned with data-driven program improvement. Lastly, as a
unidimensional statistic, recidivism mischaracterizes a program because it ignores successes in
other domains.
For these reasons, shorter-term performance indicators must exist to fill in the “black box”
between a correctional facility’s programming and subsequent recidivism rates. Such indicators
reveal the functioning of the program and offer evaluation opportunities. Exemplifying this
process, The Center for What Works created a template organizing 25 proposed performance
indicators for reentry programs by their stage between the program and recidivism. In general,
performance indicators vary by domain measured, time period, and data source. The State of
Maryland’s Task Force on Prisoner Reentry, following the Council of State Governments’ Re-
Entry Policy Council, recommends the following typology: activities, outputs, short-term

8
outcomes, long-term outcomes, and impacts (Fieselmann, 2011). It further divides outputs and
outcome into domains identified as crucial to community reintegration: substance abuse; mental
health; housing; employment; education; family, relationships and pro-social responsibility; and
financial responsibility.
Activities indicators track the real-world implementation of the program. While relatively easy to
measure, they tend to offer more logistical information than performance evaluation. A basic
measure is participation in a particular program. PRC reports the number of residents enrolled in
substance abuse, mental health, and Montgomery College. Additionally, it produces monthly
averages for programs such as relapse-prevention and Welcome Home (PRRS, 2012). However,
there is no way for an analyst to identify the number or hours of activities attended on a per-
resident basis. Case managers’ files describe assigned treatments and actual attendance, but these
qualitative notes can't be easily extracted for quantitative analysis (S. Murphy, personal
communication, April 2, 2014). Higher attendance in a particular treatment isn’t a goal, as it
doesn’t necessarily indicate if treatments correspond to participants’ criminogenic needs. Ideally,
PRC could report the percentage receiving treatment for each assessed LSIR domain, such as
substance abuse and mental health.
Other activities measures assess behavior for which program staff can be considered responsible.
All three of PRRS’ CountyStat metrics fall into the category of outputs: (1) the number of
escapes from PRC; (2) the number of apprehensions; and, (3) the percentage of PRRS inmates
participating in “Self growth and development programs” (DOCR, n.d). Since FY 2008, the
earliest year for which data is readily available, PRRS scored 100% in Headline Measure 10

9
(DOCR, 2011), indicating that the measure is meaningless (DOCR, 2011). These measures
disregard the mission of PRC: to improve post-release transitions into society and reduce
recidivism.
Output measures track if the activities produced the desired effect, and are often assessed as a
snapshot of an individual’s status upon release. Did a resident attending resume workshops
obtain a job? Did a resident enrolled in Montgomery College earn a GED? Other proposed
outputs include: feeling prepared to avoid reoffending (Roman, Kane, Turner, & Frazier, 2006),
possessing a thirty-day supply of necessary medicine, holding a bank account, finding a mental
health provider, etc. The Bureau of Justice Administration (BJA) asks about another type of
output: the number completing treatment (S. Murphy, personal communication, April 2, 2014).
This figure is problematic for facilities like PRC serving residents with short stays, especially
regarding deep-rooted issues like substance abuse. Rather, PRC’s Deputy Chief of Program and
Services states that their “goal is to initiate treatment services they will continue post-release”
and to enable them to continue progressing on their own (ibid).
PRC tracks the following outputs regarding releases: the percentage holding employment, the
percentage with housing, and the percentage successfully completing PRC (PRRS, 2014).
Moreover, PRC calculates the annual gross income earned by residents, gross taxes paid, family
support paid, and fines/restitution paid. It reports this data to the public through Quarterly Chief
Reports (ibid). Providing this information as a per-resident basis would better reveal yearly
trends by accounting for changing population size.

10
Outcomes assess the situation of the ex-offender after a designated time following release.
Performance indicator typologies can disaggregate outcomes by length of time (Maryland Task
Force on Prisoner Reentry, 2011). For example, “does an ex-offender has stable housing at 30
days?” functions as a short-term outcome, and the same question functions as a long-term
outcome if assessed at 1 year. Alternatively, distinguishing them by conceptual order is possible.
In this case, whether an individual possesses insurance functions as a short-term outcome and the
health of that individual is a long-term outcome. In practice, conflating the two practices may not
be distinguishable, as the assessment should be done at a particular time after release for
consistency. Other conditions of interest are the sector (private versus public) in which the
individual is employed, wages as comparable to pre-incarceration, strength of relationships with
family, and receipt of food stamps? Other government agencies or community-based
organizations potentially hold answers. For example, 2009 report for Montgomery County
recommends linking criminal justice data to the jurisdiction’s unemployment insurance database
as a means of studying the ex-offender’s financial status. Barriers to such measures tend to be
technological and legal. Surveys of individuals would likely require an unfeasible amount of
administrative time to establish initial communication and to obtain a reasonable response rate.
PRC doesn’t track individuals after release, so it has no information on outcomes.
Impacts refer to the ultimate goals of the program for the individual and society. For reentry
programs, they consist of reduced recidivism and improved public welfare (Fieselmann, 2011).
Recidivism is the most common proxy for public safety in reentry studies (146p12) and the most
frequent dependent variable for prison-based education (Davis, Bozick, Steele, Saunders, &

11
Miles, 2013). PRC began computing 1 and 3-year recidivism rates in July of 2013. (“Recidivism
in Montgomery County” details the methodology”).
While activities, outputs, and outcomes can be worthwhile in their own right, practitioners
generally regard their achievement as valuable insomuch as they contribute to achieving the
desired impact. Establishing performance indicators from treatment to short-term effects to long-
term effects can exposes blockage points inhibiting recidivism reduction. As an hypothetical
illustration, comprehensive performance measurement would reveal if low attendance (an
activity) is inhibiting effectiveness of a soft-skills program, if residents attend but still struggle to
obtain employment (an output), if employment issues reduce child support payments (short-term
outcome), if their relationships with their families consequently suffer (long-term outcome) and
if they are prone to higher recidivism (impact). Evaluators of the national Serious and Violent
Offender Initiative put this approach into practice. After finding “modest” improvements in
intermediate outcomes yet no recidivism effects, the report concludes, “If the underlying model
that links services to improved intermediate outcomes that in turn improve recidivism is correct,
the level of improvement in these intermediate outcomes may have been insufficient to result in
observable reductions in recidivism” (Lattimore and Visher, 2009).
Why Policymakers Care About Recidivism
Reducing recidivism is a frequently cited policy goal and topic of extensive research. Interest in
tracking recidivism stems from the expanding conception of the role of corrections in the late
1990s (Fieselmann, 2011). Instead of just supervision of inmates, policymakers began to see

12
corrections as mechanisms to promote public safety and social welfare. In this sense, recidivism
indicates the failure of incarceration to accomplish key goals of deterrence and rehabilitation.
Beyond social responsibility, the magnitude and cost of recidivism at every level of government
earns the attention of policymakers. The Bureau of Justice Statistics (BJS) examined prisoners
released in 2005 from 30 states and found that 68% had been rearrested within 3 years (Cooper,
Durose & Synder, 2014). This percentage exactly corresponds to the recidivism of the preceding
BJS study of 1994 releases from 15 states (Langan & Levin, 2002). Further indicating the
stability of the national recidivism rate, Pew’s Center on the States published a landmark study
finding average recidivism for the 33 states with data for prisoners released in 1999 and 2004
dropped only 2 percentage points. However, this statistic conceals notable transformations in
recidivism at the state-level. Recidivism increased by at least 10% in nine states and decreased
by at least 10% in six states (The Pew Center on the States). On the local level, 9 million people
accounted for an estimated 12 million jail bookings between July 2004 and June 2005 (La Vigne,
Davies, Lachman, & Neusteter, 2013). In a typical case study, one out of every five releases each
year from the Philadelphia Prison System (PPS) between 1996 and 2003, had already been
through PPS at least once that same year (Roman et al., 2006). The half of the population that
had experienced multiple incarcerations contributed to over three-quarters of total releases.
Reducing recidivism appeals to governments as a means to reduce crime and ensuing
expenditures. Local governments are no exception, as they account for one-third of incarcerated
Americans (Glazer & Herberman, 2013). Counties spend $23.3 billion annually on correctional
facilities (Istrate & Nowakowski, 2013). The rise in jail inmates in the last decade further

13
increased pressure on budgets (Glazer & Herberman, 2013). By reducing recidivism,
jurisdictions produce savings in police agencies, courts and corrections facilities. In fact, budget
distress stemming from the Recession of 2008 helped fuel government interest reentry
programming, an obscure topic in the decade prior (Katel, 2009). According to Attorney General
Eric Holder, “Even a modest reduction in recidivism rates would prevent thousands of crimes
and save hundreds of millions of taxpayer dollars” nationwide (ibid). Local and state
governments cite cost savings from reducing recidivism as one justification for reentry and other
programing. Travis County, Texas, conducted a cost-benefit analysis of its Mental Health Public
Defender Office, calculating the cost savings from reduced jail beds, legal representation and
bookings (Jefferies & Calkins, 2012). Other analyses forecast meaningful cost savings from
incremental drops in re-offending rates due to the high per-capita cost of incarceration (Katel,
2009). For example, Pennsylvania calculated a $45 million savings would accrue from reducing
recidivism by 10% (Palazzolo, 2013). More dramatically, the Rand Corporation determined that
a correctional educational program would reach cost-effectiveness if it reduced the three-year re-
incarceration rate by two to three percentage points (Davis et al., 2013). New York City’s Center
for Employment Opportunities (CEO) decreased recidivism in clients by five percentage points,
with financial benefits outweighing costs by more than two to one (Redcross, Millenky, Rudd &
Levshin, 2012).
Even the process of measuring recidivism can be valuable to corrections and reentry programs.
By highlighting sub-populations at risk, disaggregated recidivism analyses assist agencies in
targeting interventions to produce the highest benefit. For example, Hampden identifies chronic
offenders, defined as those with at least two re-incarcerations within the first year of release,

14
through its recidivism analysis (Lyman & Lupo, 2014). A facility finding residents with original
offense A to recidivate at a higher rate than offense B might consider investing in programs
addressing motivations for offense A. However, facilities should be cautious in such decisions,
as characteristics may be simply correlated with the factors truly causative of recidivism.
Additionally, analyses of the timing of recidivism can assist pre-release programs in scheduling
delivery of after-care resources. Evaluators of New York City’s CEO found the program to be
effective in reducing recidivism for participants within three months of release from prison, but
not for those participating more than three months afterwards (Redcross et al., 2012).
While improving public safety and knowledge of correctional population flows are relevant
concerns for all levels of governments, Montgomery County is a rarity among localities in its
measurement accomplishments. Since 2013, the Pre-Release Center began reporting 1 and 3-year
recidivism rates. Following a CountyStat MoCo’s performance monitoring body) meeting with
DOCR in early 2014, CountyStat designated the development of a recidivism measure and a
benchmark methodology as formal follow-up tasks (94). While agency documents from 2008,
2009 and 2010 describe such measures as in-progress, PRC’s new recidivism collection marks
the actualization of these years of sustained interest to CountyStat. Furthermore, the Office of
Management and Budget expressed support for measuring recidivism, in keeping with the
county’s transition to a performance-based budget (K. Miller, personal communication, April 3,
2014).
Recidivism Predictors

15
Since contextual factors and heterogeneous populations make absolute recidivism rates of little
comparative value to Montgomery County, the literature review conducted for this project
focuses on recidivism variation by sub-groups. The jurisdictions discussed in this section also
informed the subsequent discussion of the different definitions of recidivism and the selection of
sub-groups for the MoCo data analysis. The chart below summarizes the primary studies
referenced in this paper. They were selected for convenience, variation, and/or analysis of a
particular sub-group. Therefore, they should not be interpreted as nationally representative. The
analysis references other jurisdictions and studies, but focuses on the following studies:
Study
Referenced As
BJS Montgomery Hampden Baltimore
Population Prison, 30
states
Jail, Montgomery
County (MD)
Jail, Hampden
County (MA)
Prison,
Maryland
Released 2005 2003-2004 2010 & 2012 2002 & 2003
(Note: In the following discussion, recidivism rates are 3 year figures if not specified. In order to
correspond with Montgomery County’s recidivism definition, the re-conviction definition is used
when possible.)
Gender: Recidivism is highest among males. An important factor in the recidivism differential
between men and women is the differences in the offenses for which they were incarcerated.
Compared to men, more drug and property crimes lead to women being incarcerated (Spjeldnes
& Goodkind, 2009). The percentage of women sent to jail for violent crime is slowly increasing,
but this is more due to stricter sentencing policies for women (especially prosecution of domestic

16
violence) and for the relatively lighter categories of crime in which their offenses tend to fall,
than to heightened frequency of criminal activity (Spjeldnes & Goodkind, 2009). BJS found men
18% more likely to be re-arrested than women (Cooper, Durose & Synder, 2014). Montgomery
found men to be 40% more likely to be reconvicted (Uchida, LoBuglio, Flower, Piehl & Still,
2009), nearly equivalent to Hampden’s differential of 37% (Lyman & Lupo, 2014). Baltimore
found men to be 52% more likely to be rearrested within six months. Gender was statistically
significant in predicting re-arrest, with an odds ratio of 1.89, meaning men were almost twice as
likely to be re-arrested as females holding other factors constant (Visher et al., 2004).
Age: Recidivism is higher for the young. BJS used five age categories and found a reduction in
recidivism rates for each subsequent age group, with one exception (Cooper, Durose & Synder,
2014). The oldest group (40 and older) had 26% greater likelihood of recidivism than the
youngest adult age group (24 and younger) (Cooper, Durose & Synder, 2014). Montgomery
divided the population into two groups: over and under age 30. It found higher recidivism in the
younger group, but didn’t report the recidivism rates of either group (Uchida et al., 2009).
Baltimore used exact age and found the average recidivator to be 2 years younger than a non-
recidivator (Visher, LaVigne & Travis, 2004). In multivariate analysis, a statistically significant
odds ratio of .96 means that younger age is associated with higher likelihood of re-arrest (Visher
et al., 2004). Age at first arrest is a common LSIR element and noted in several studies.
Race/Ethnicity: Generally, whites recidivate at a lower rate. BJS found blacks 12% more likely
to recidivate than whites and Hispanics/Latinos to be 7% more likely than whites (Cooper,
Durose & Synder, 2014). Montgomery found non-whites recidivate at a higher rate than whites,

17
but doesn’t report the recidivism rates by race (Uchida et al., 2009). One researcher notes the
interaction between race and a criminal history, describing a “double dose of employment
discrimination” for black ex-offenders (Bloom, 2006). Baltimore attributes a finding of no
recidivism differentiation by race to be due to the dominance of blacks in the sample (Visher et
al., 2004).
Criminal History: Predictably, offenders with longer criminal history have a higher recidivism
rate. BJS found individuals with at least 10 prior arrests recidivated at a 20% higher rate than
those with 5 to 9 arrests, and 59% higher rate than those with 0 to 4 arrests (Cooper, Durose &
Synder, 2014). Montgomery’s multivariate analysis found the number of prior arrests to predict
higher recidivism, a strongly statistically significant conclusion (Uchida et al., 2009). In
Baltimore’s multivariate regression, the number of prior arrests is the third of three statistically
significant recidivism predictors, with an odds ratio of 1.07 (Visher et al., 2004).
Type of Initial Offense: BJS property offenders to recidivate at the higher rates compared to
violent, drug-related, or public order offenses. Individuals serving property crimes recidivated at
the highest rates, exceeding violent offenders, the category with the lowest rate by 21% (Cooper,
Durose & Synder, 2014). Likewise in Montgomery, property offenders recidivated at the highest
rates for males (Uchida et al., 2009).
Mental Health/Substance Abuse: Baltimore recidivators were two and a half times as likely to
engage in post-release substance use (drug and alcohol) as non-recidivators (Visher et al., 2004).
Researchers found the higher rates of substance abuse - before and after prison - in recidiviators,

18
to be statistically significant. Supporting this finding, an Urban Institute study of Texas and Ohio
prisoners found statistically significant variation in recidivism by self-reported substance
abusers, with males 67% more likely to recidivate than their peers, and females almost three
times as likely. Meanwhile, the same study found no differences in 1-year re-incarceration for
those with and without mental illness despite higher self-reported crime (Mallik-Kane & Visher,
2008). On the other hand, other literature identifies correlations between mental health and
recidivism. PRC recognizes the high criminogenic risk of its population with mental health
issues. In a federal grant application, PRC cited anecdotal evidence that nearly all mentally ill
DOCR offenders with “serious and persistent” co-occurring behavioral health disorders
recidivate (n.d.).
Housing: Recidivism studies rarely explore homelessness. A study of individuals exiting New
York State prisons between 1995 and 1998 found a higher rate of recidivism among those
released without stable housing (Metraux & Culhane, 2004). Furthermore, ex-offenders with a
prior stay in a homeless shelter produced 31% higher rates of recidivism. Beyond homelessness,
a spatial perspective of recidivism considers the locations receiving ex-offenders. Individuals
returning to their pre-incarceration communities situate themselves in the same contexts that
potentially fueled their original crime (LoBulgio, 2007). Furthermore, these destinations tend to
lack the services and characteristics ex-offenders need to progress. “People leaving prison
disproportionately return to at-risk communities; that is, communities characterized by high rates
of unemployment, crime, drug use, and poverty…places where resources are already strained by
social problems and their social ties to these resources have been weakened by time

19
incarcerated.” (Draine & Wolff, 2009). PRC’s RAS observed that employed offenders often can't
afford to leave their old neighborhoods, inducing them to return to negative lifestyles.
Employment: Multiple studies find that post-incarceration employment and higher earnings
predict less recidivism (Brazzell, Crayton, Mukamal, Solomon, & Lindahl, 2009). Theoretically,
employment increases an offender’s sense of security, improves relationships with family, and
hinders a return to his negative, pre-incarceration lifestyle. In an interview, PRC’s Reentry
Assessment Specialist (RAS) emphasized the relationship between financial stability and
recidivism, based on his case management experience (T. Alexander, March 27, 2014). Other
personal challenges related to recidivism, notably maintaining consistency with medication and
stable housing, require financial security. In principle, steady employment reduces financial
motivation for crimes (Bloom, 2006). One review of the relevant literature describes the rarity of
experimental evaluations of work-placed reentry programs, an ideal methodology to pinpoint the
causal influence of employment on re-offending. Fewer still attempts to isolate the benefits of
employment assistance from other interventions (Duran, Plotkin, Potter, & Rosen, 2013,).
Nonetheless, some work release programs have been proven to reduce recidivism (ibid).
However, parsing the relationship of employment and recidivism presents difficulties for
researchers. Establishing the order of causality is a challenge; the personal characteristics
inclining ex-offenders to hold a job likely overlap with those deterring employment. Moreover,
researchers posit a vicious cycle; incarceration disrupts employment and earnings, in turn,
prompting recidivism (Bloom, 2006). Time spent incarcerated can erode connections to contacts
who might assist with job search afterwards (Solomon, Osborne, LoBuglio, Mellow, &

20
Mukamal, 2008). Moreover, many policies bar ex-offenders from holding certain licenses and
professions and render them ineligible for financial aid (Spjeldnes & Goodkind, 2009). Potential
employers can automatically reject applicants with a criminal record, fearing a relapse, such as
employee theft (Solomon et al., 2008). Alternatively, the offense can act as a “market signal”
that the ex-offender possess personality traits incompatible with the workforce, such as laziness
or quickness to anger.
Benchmarking Recidivism
There is no consensus regarding absolute standards for recidivism rates. Unlike student test
scores, experts haven’t established “acceptable” or “excellent” thresholds. Third parties
monitoring recidivism tend to hold an ipsative assessment rather than a criterion-referenced
assessment, meaning they focus on the changes compared to the starting point rather than their
proximity to a pre-established goal. A literature review yielded no efforts to define acceptable
recidivism nor any jurisdictions striving towards an absolute rate, such as “5% recidivism by
2015”. Instead, policymakers scrutinize the direction and magnitude of change compared to prior
years. For example, Pennsylvania Department of Correction will award a bonus to halfway house
contractors if the state recidivism rate drops by 1% or more (Palazzolo, 2013). A federal grant
asks states to submit plans to halve their recidivism rates (Bureau of Justice Assistance (BJA),
2013).
CountyStat utilizes two types of benchmarks: internal and external. Internal benchmarks (such as
agency website views and fire response time) mark a particular department’s progress towards a

21
specified objective, while external benchmarks track “quality-of-life” indicators (such as home
ownership and commute time) influenced by multiple departments and non-governmental factors
(CountyStat, 2014). Internal benchmarks compare data to prior years, while external benchmarks
compare Montgomery County to jurisdictions in the region and peer jurisdictions across the
nation. Should recidivism be internally or externally benchmarked?
There are limited opportunities to externally benchmark Montgomery County’s recidivism. A
policymaker seeking to compare the county to another jurisdiction might first look toward states.
In fact, the bulk of recidivism research, especially the large-scale studies, utilize state-level data.
A 2012 review by the Council of State Governments identified at least 34 states who published
annual recidivism statistics. However, two key differences between jails and state prisons inhibit
recidivism comparisons: population and sentence duration. State prisons hold offenders who, on
average, are committed for much more serious crimes. The average stay in a state prison is 2.5
years, while over four out of every five people entering jail each year will exit within a month
(Solomon et al., 2008). If states aren’t a fair benchmark, what about other local jurisdictions?
The primary challenge is finding data, as “very few” measure recidivism (La Vigne et al., 2013).
Jails, especially small ones, focus their resources towards control and safety rather than research.
Moreover, the short stays of most residents and diverse legal status upon exit add logistical
difficulties in recidivism calculation (Solomon et al., 2008).
Beyond these technical concerns, the great extent to which factors outside the DOCR’s control
shape recidivism suggests that external benchmarks aren’t appropriate. Returning to the language
of performance measurement, the characteristics of a jurisdiction – penal code, school quality,

22
economic opportunity, etc. – influence short and long-term outcomes and thus recidivism rates.
Actors and policies in the criminal justice system further impede the validity of inter-jurisdiction
comparisons by influencing the composition of the incarcerated population and their likelihood
of re-offending. Jurisdictions with higher police-to-population ratios or more energetic police
will produce more arrests for the same number of crimes committed. Speedier courts with
shorter time between a charge and sentence, result in higher recidivism for a given time period
after release. Jurisdictions with judges sentencing a higher share of offenders to parole or
probation (Lyman and Lobuglio, 2007), more aggressive compliance officers (i.e. in
administering more frequent drug tests) (The Pew Center on the States, 2011), or longer parole
periods (LoBuglio, 2007), will generate more ex-offenders charged with a technical violation and
higher recidivism. For these reasons, some recidivism studies warn readers against uninformed
inter-jurisdictional comparisons (The Pew Center on the States, 2011). In one apt analogy,
judging the performance of a corrections department by recidivism is equivalently misleading as
attributing the difference in Baltimore and Salt Lake City crimes to superior police in the latter
(Fieselmann, 2011).
In conclusion, the lack of comparable data prevents recidivism from being externally
benchmarked, while the major role of non-DOCR factors limits internally benchmarked data to a
trend indicator but not a performance measure. The recidivism rate is more meaningful as an
indicator of the combined efforts of government agencies (education, social service, workforce
development, correctional facilities) than of PRC alone. Montgomery County should concentrate
on changes in its recidivism rate, and between sub-groups, rather than engage in comparisons to
other jurisdictions. Moreover, an awareness of shifts in the county-wide characteristics discussed

23
above will promote a deeper comprehension of MoCo recidivism rates. The 2014 budget of
Prince George’s County, Maryland, exemplifies such an understanding. A note that shifts in
police strategy to greater arrests of repeat offenders contributed to a rising recidivism rate
follows the rate itself (County Office of Management and Budget, 2013).
Building A Definition of Recidivism
This section outlines the major components of a recidivism definition. While the recidivism rate
has “long been considered the leading statistical indicator of return on correctional investment”
(The Pew Center on the States, 2011), a literature review reveals numerous variations of
recidivism definitions used by governments and researchers. In selecting a recidivism measure,
policymakers weigh data desires against limited databases, and staff with little time for data
collection. More often than not, jurisdictions report data for multiple definitions of recidivism,
due to the lack of consensus on a definition and the greater ability to identify more trends with
more information (141). No indication of convergence exists, nor is there a visible federal push
to standardize the heterogeneity of recidivism measures. The Bureau of Justice Assistance (BJA)
Adult Recidivism Reduction Planning grants allows each state applicant to use any definition
meeting requirements of specifying a population, offering a baseline, and remaining feasible for
future data collection (BJA, 2013). On the same note, the Transition from Jail to Community
Initiative (a partnership of the National Institute of Corrections and Urban Institute) encouraged
sites to create recidivism definitions sensitive to local priorities (Willison, Jannetta, Dodd,
Neusteter, Warwick, Greer, & Matthews, 2012).

24
Binary Measure Versus Count Measure: As presented thus far, recidivism is a binary
measurement: either an ex-offender did or did not recidivate within a given time period. The
recidivism rate is the ratio of the number of individuals recidivating at least once to the total
number of individuals in the population. Several sites participating in the Transition from Jail to
Community Initiative (TJC) fault such a measure for failing to capture if a program reduced, but
did not eliminate, the recidivism of an offender (Willison et al., 2012). This critique is especially
applicable to the chronic users that disproportionately draw jail resources and are the target
population of many anti-recidivism programs. An alternative is supplementing the binary
measure with a count measure. The Social Impact Bond for Peterborough Prison defines success
as a 7.5% drop in reconviction events, a departure from the traditional outcome of recidivism
rate (Social Finance Limited, 2011). Another count measure is the number of days before an
individual’s first re-offense (Uchida et al., 2009).
Time Period: The duration of time during which recidivism is tracked begins upon release from
the correctional facility, not release from community supervision. The literature review produced
periods ranging from 6 months to 105 years. A meta-analysis of prison-based education and an
Urban Institute publication focused on local government (La Vigne et al., 2013) found both one
and three years to be popular for jail recidivism. Pew describes 3 years as “typical” (2011) and
Maryland’s Department of Legislative Services calls them “the most common” (Department of
Public Safety and Correctional Services, 2014).
Jurisdiction Maximum Time Period Reported
5 RAND Corporation referenced but didn’t cite this 10‐year study (Davis et al., 2013).

25
5 years BJS
3 years Council of State Governments publication; Pew; Maryland Department
of Public Safety and Correctional Services; Hampden; Maryland
Department of Juvenile Services; Virginia Department of Corrections;
Center of Employment Opportunity evaluation;
6 month Baltimore
Of course, the time period is an artificial deadline of data collection; nothing differentiates an
individual who recidivates a day before or a day after. However, the length is important for data
comparisons and trend analysis. Unresolved cases will drive recidivism downward for shorter
time selections. Consider an ex-offender who commits a crime in month 11 and is convicted in
month 13. He would be counted as a recidivist under a 3-year measure but not under a 1 year
measure. In fact, Hampden found open cases for 14% of 2012 releases at the one year mark
(Lyman & Lupo, 2014). The delay between arrest and sentencing justifies a 3-year period for
many jurisdictions (Fieselmann, 2011). On the other hand, shorter time periods mean less time
collecting data, an especial boon if the process isn’t automated. In Montgomery County,
doubling the data collection period doubles the hours of work. Jurisdictions using 3-year time
frequently report recidivism rates at 1 and/or 2 years as well. Producing rates for multiple time
periods provides a richer dataset and allows for survival rate analysis. The shorter time periods
inform elected official concerned with changes in recidivism under their short-terms, and more
broadly, for stakeholders interested in faster feedback on new programs or populations. Finally,
the time period chosen may influence the types of recidivism identified. One study found that

26
minor crimes account for a greater share of 1-year recidivism, whereas serious crimes are more
dispersed over the 3 year measure (Uchida et al., 2009).
Criminal Event. Studies vary regarding the contact point with the criminal justice system defined
as recidivism. Note that the criminal act chosen in the definition is not necessarily the cut-off for
the time period. In other words, a jurisdiction using three-year re-conviction could count as
recidivists those who are re-arrested within three years of release, provided those arrests
eventually led to a re-conviction.
• Arrest: An arrest is the legal deprivation of an individual’s liberty. It may lead to a charge,
the formal allegation that “a defendant has committed an offense, including a citation or
indictment” (Maryland Courts, 2014). The relationship of police policy to arrests makes this
measure especially difficult to compare across jurisdictions (Uchida et al., 2009). Moreover,
an arrest-based recidivism measure counts those eventually proven innocent, which results in
over-capturing recidivism. On the other hand, prosecutors sometimes drop minor charges or
those lacking sufficient evidence (La Vigne et al., 2013), so in that sense arrests recognize
recidivism that other measures omit. Additionally re-arrest excludes parole violators who are
incarcerated without a preceding arrest.
• Adjudication: An adjudication occurs when an arrest results in a referral to the courts for
possible sanctioning (Cooper, Durose & Synder, 2014). BJS’s adjudications definition
generates roughly three-quarters of the recidivism rate of arrests (ibid).
• Conviction: A conviction is “the determination of guilt based on a plea, a jury verdict, or a
finding of a judge” (Maryland Courts, 2014). This measure somewhat adjusts for more

27
aggressive police, but not judicial policy. It includes individuals found guilty and given a
sentence other than incarceration. However, re-convictions ignore ex-offenders arrested on
parole then incarcerated without a conviction (Visher et al., 2004). The literature can use
“reconviction” to refer only to those stemming from a prosecution of a new offense, or more
broadly to include technical violations (La Vigne et al., 2013). Peterborough chose re-
convictions as a recidivism measure, considering it a reasonable approximation of
government expenditures (Cave, Williams, Jolliffe, & Hedderman, 2012).
• Arraignment: An arraignment is the “procedure in which the accused is brought before the
court to plead to the criminal charge” (Maryland Courts, 2014). A study of Hampden
County’s reentry program used the arraignment definition and included parole and probation
violations resulting in incarceration (LoBuglio, 2007).
• Incarceration: Incarceration is the physical return to jail or prison (Langan and Levin, 2002).
This measure captures individuals who reoffended on parole and who were sent to prison
without prosecution, a population omitted by the re-conviction measure. However, it
excludes offenders found guilty but sentenced to a fine or other punishment besides
incarceration (Langan & Levin, 2002). A meta-analysis of prison-based education identified
re-conviction as the most common recidivism definition (Davis et al., 2013). Pew defines
recidivism as re-incarceration, as does Douglas County, Kansas, (Willison et al., 2012) and
two recent publications by the Council of State Governments. Denver, Colorado, uses re-
incarceration but limits recidivism to medium- and high-risk offenders resentenced for a new
offense (Willison et al., 2012). The Transition from Jail to Community Initiative selected
returns to jail as a Core Performance Measures. Montgomery chose to track reconvictions

28
rather than re-incarcerations because the later requires searching additional databases for
each release (S. Murphy, personal communication, April 2, 2014).
• Lastly, studies sometimes supplement bureaucratic data with self-reported crime (Mallik-
Kane & Visher, 2008). This is feasible with a representative sample rather than an entire
population.
The graph below illustrates the variance in 3-year recidivism rates for the three common
recidivism definitions. As included jurisdictions aren’t representative of all jurisdictions tracking
recidivism, (and differ in other recidivism definition elements), the graph is intended to suggest
the influence of the definition on the final rate rather than generalizable patterns.
The selection of a criminal event for the recidivism definition interacts with the time period to
influence the difference the final recidivism figure. Generally, the earlier the event falls in the
criminal justice system, the higher the recidivism rate. At 3 years, BJS recidivism is 50% if
defined by adjudication, 45% if defined by conviction and 22% if defined by imprisonment.
Interestingly, the differences between definitions vary widely between jurisdictions. Hampden’s

29
3-year re-conviction rate is about 70% of its re-conviction rate, while that of the CEO evaluation
was 30%. One reason for the drop is definitional; not every arrest will result in a conviction and
not every convicted criminal will serve time in prison. But a secondary driver of these statistics
is the time lag of the criminal justice system. The later in the system selected as a recidivism
definition, the more bureaucratic processing time and court delays are at play. Therefore, a
jurisdiction choosing a measure later in the system might consider using a longer time period of
analysis. PRRS’ recidivism researcher raised this point in light of her experience while employed
by the courts.
A brief analysis of the BJS cohort released 1994 suggests that the choice of measure sometimes
influences the magnitude of differences between sub-groups. For the five sub-group
classifications examined by this author – female/male, black/white, Hispanic/non-Hispanic, age
18 to 24 versus 45 and over, violent crime/property crime, the percent differences between the
sub-groups grew – by between .5 percentage points to 9 percentage points - when moving from
re-arrest to re-conviction as a definition (author’s analysis). This information wasn’t available to
be analyzed for the 2005 cohort.
Inclusion of Technical Violations: A technical violation of a parole or probation condition can be
failure to report to a probation officer or a positive drug test. Some recidivism analyses exclude
technical violations from their recidivism definition. Alternatively, analyses compare technical
violations and new offenses in order to disaggregate recidivism, as did Pew (2011). This
distillation can reveal the influence of community supervision policies on recidivism rates, which
can otherwise be interpreted as changes in crimes committed by ex-offenders. For example,
30
Michigan saw recidivism drop 18% between 1999 and 2004, driven by a large reduction in
incarceration of technical violations, but that number hides the 21% rise in re-incarceration for
new offenses (The Pew Center on the States, 2011). As another example, Hampden re-
incarcerate parolees at higher rates than non-parolees in total, but since parolees re-offend at
lower rates, technical violations drive the difference (Lyman & Lupo, 2014) Segregating
technical violations and new offenses is a way to “tell the story” of recidivism.
Database: Unsurprisingly, increasing the scope of crime data sources, raises the rate of
recidivism. Studies frequently exclude offenses outside the system of analysis. For example,
some states do not account for a released individual who re-offends in a neighboring state, while
counties often limit searches to databases within their jurisdiction and state (18p12). Maryland
ignores crimes managed by federal, out-of-state, or Maryland county judicial systems
(Fieselmann, 2011). BJS found that 14% of 5-year recidivators were re-arrested at least once in
states other than that of their original prison, suggesting the importance of expanding recidivism
research outside the jurisdiction in question (Cooper, Durose & Synder, 2014). For local
governments, the effect on recidivism rates from ignoring other jurisdictions may relate to its
location. Counties near their state’s border conceivably “lose” more recidivism as a result of
ignoring neighboring states than counties in the middle of a large state. Pragmatic and political
motivations discourage jurisdictions from expanding their recidivism searches to more available
criminal databases. If databases aren’t automated or combinable, it can be highly tedious and
time-consuming to incorporate them (Uchida et al., 2009), especially if each individual must be
searched individually. Furthermore, the certainty that each additional database will increase
recidivism is a political disincentive (ibid). The Montgomery study exposes the dramatic jump in

31
recidivism from expanding databases. Federal and local databases revealed 40% more
convictions than reliance on state records alone.
Population: Within a given jail, the population spans many complicated and dynamic legal
statuses (Lyman and Lobuglio 2007). Most are detained and awaiting trial, and other statuses
include sentenced awaiting transfer to a state prison, undocumented immigrant with a pending
deportation, serving a short sentence, in protective custody, or a juvenile with their own rules
(Solomon et al., 2008). Identifying which inmates are subject to the recidivism calculation upon
exit can be logistically tricky. Limiting recidivism to Pre-Release Center participants avoids this
problem, but it would need to be addressed if the analysis expands to include MCCF releases.
Another decision is whether to account for releases that cannot recidivate due to deportation,
death, or re-incarceration. Omitting this adjustment will bias the recidivism rate downwards
(Lyman and Lobuglio, 2007).
This exploration of the many dimensions of a recidivism measure relates to the earlier discussion
of benchmarking. A jurisdiction selecting a recidivism definition will begin by considering its
logistical feasibility and value to stakeholders. If it wishes to compare itself to a specific peer, it
might need to sacrifice its ideal definition for one that aligns with the peer’s methodology.
Equally important to consider in selecting a benchmark jurisdiction is establishing a common
definition of recidivism. Failure to account for differing methodologies leads to invalid inter-
jurisdictional comparisons.
Recidivism Research in Montgomery County

32
My data analysis builds off a 2009 study of recidivism that exhaustively examined the criminal
histories of 2,182 local sentenced MoCo offenders who exited DOCR from the beginning of July
2003 and the end of 2004 (Uchida et al., 2009). It utilized 9 data sources across local, state and
national levels. The analysis disaggregated recidivism by crime type, gender and seriousness of
offense. Supplementing regression analysis, it conducted hazards regression and survival curves,
varying with 9 dependent variables, 3 arrest-related definitions of recidivism and 6 conviction-
related ones. As a precursor to the current monthly recidivism research, the 2009 study informed
PRC’s selection of conviction as a recidivism definition. The amount of recidivism exposed by
supplementing the Maryland State Record of Arrest and Prosecution with federal and other state
criminal databases led PRC to include those databases in future research. The study concluded
with recommendations to improve further research: developing a cohesive system combining all
the criminal justice data sources and allowing linkages between government databases. While it
calculated recidivism for all incarcerated offenders, this analysis is limited to PRRS participants.
The 2009 study paved the way for PRC to begin regular recidivism research in 2013. Since July
2013, PRRS’s researcher has conducted monthly investigations of re-convictions and average
days until first conviction, reporting results publically in the Quarterly Chief’s Report. Every
month, she produces 1-year recidivism rates for PRC residents released in the same month
exactly one year prior, and 3-year recidivism rates for residents released exactly three years
prior.
Data Analysis: Methodology

33
This paper conducts in-depth analysis of PRC’s existing recidivism databases. A detailed
description of its methodology and sources, informed through interviews with the database
creator, precedes the data analysis.
PRC’s researcher begins with a list of all PRC residents released for a given month. The
population includes residents completing home confinement. To limit research to those released
into the community, residents revoked (sent back to MCCF due to an attempted escape) or
administered and removed (sent back to MCCF, likely for behavioral problems) are excluded.
These exceptions reduce the population by roughly 20%6. In order to identify the recidivism of
participants released exactly 12 months prior and 36 months prior, she searches two databases.
The Maryland Judiciary Case Search website provides traffic and criminal case records from the
Maryland District Court and criminal case records from the Maryland Circuit Court (65).
Secondly, the Federal Bureau of Investigations METERS database includes local, state and
national crimes. Next, the status, category, and outcome of a charge determine if it counts as
recidivism. Pending cases and probation before judgment are excluded, as are non-incarcerable
traffic offenses and civil charges. If a charge is nolle prosequi (decision against prosecution),
results dismissed, or results in a non-guilty verdict, it doesn’t count as recidivism (70).
The database obtained for this paper’s analysis consists of only the following variables: release
date, criminal system of origin, Maryland State Identification Number, FBI Identification
Number, date of birth, gender, offense served at PRC, inside worker status, release location, race,
LSIR, educational attainment, and employment status. The first six characteristics exist for every
6 The researcher provided 15% as an initial estimate. Random examination of three months led to a higher estimate: 24% of the original April 2012 data were excluded; 20% of April 2013; and 20% of January 2013.

34
month, but the last seven were omitted for July 2010 and July 2012. Appendix A outlines these
variables, and other created variables. This information must be located on the performance
system (PRRS’ internal client management system) for each individual release, making the
process time-consuming. Occasional typos and inconsistent data entry result from the manual
nature of the database creation and multiple employees entering the original information.
Descriptive statistics, bivariate analysis, correlational matrices, and regression modeling
informed the data analysis. First, descriptive statistics reveal the raw differences in recidivism
between sub-groups. Next, bivariate analyses (t-tests) assess the significance of these differences,
given the size of the sample and possibility of chance variation. Correlational matrices describe
the relationships between independent variables. Lastly, and most importantly, regression models
reveal the role of each independent variable in predicting recidivism when the other variables are
held constant. 1-year recidivism incorporates all 13 months of data, while 3-year recidivism is
limited to a 6 month sub-set (excluding 2012 and 2013). Therefore, 1 and 3-year recidivism rates
describe different populations and aren’t perfectly comparable. In the results below,
“recidivism” without a specified time period refers to trends consistent across 1 and 3-year
definitions.
Data Analysis: Recidivism by Sub-Group
Summary
After 1 year, 52 of the 403 releases recidivated, or 13%. This rate doubles to 28% for 3-year
recidivism, 59 out of the 209 person sample. Recidivators produced an average of 1.6

35
convictions within their first year of release and 2.1 by the end of their third year. Recidivism
was higher in males, young adults, those without college education, higher LSIR, African-
Americans, and Drug Court offenders. Re-offending spikes in the first six months after release
and the last half of the third year. While crimes comprise most recidivism, traffic accounts for
one-fifth of three-year offenses.
Recidivism By Release Date
Rates fluctuate wildly by release month. They range between 0% and 23% for one-year
recidivism and 20% to 40% for three-year recidivism. The sizable variation by month indicates
the importance of a long-term perspective on recidivism rates. By year of release, 2012’s rate of
9% is nearly half of 2010’s 17% rate. (Unlike 2011 and 2013, multiple months of data exist for
these years.) This difference achieves statistical significance7 under bivariate analysis. However,
a detailed examination of the characteristics of the populations in question must accompany even
tentative conclusions about changes in annual recidivism.
Age:
Confirming a common finding in the literature review, age is a strong predictor of recidivism in
the PRC sample. The age of the ex-offender is the second most highly correlated variable with
recidivism (tying with education for 1-year recidivism). A quarter of teenagers and ages 20 to 25
recidivate by 1 year. Rates then drop and stabilize to about one in every ten residents their mid-
40s. Only one release over age 50 recidivated, whether using the 1 or 3 year measure. Comparing
the young (under age 25) to ages 25 to 45, the stark 1-year recidivism differences somewhat
diminish under 3-year recidivism, in which the young are 23% more likely to recidivate. 7 This analysis uses the p‐value of .1 as a significance threshold.

36
However, the 3-year difference between the two age groups fails to achieve statistical
significance under bivariate analysis. A logit regression (see Appendix E) demonstrates that
holding gender, LSIR, criminal justice system of origin, and race constant, exact age is a
statistically significant predictor of recidivism. A one year increase in age results in a 0.038
reduction in the log odds of recidivism. Putting these statistics into practice, the average8 25-
year-old’s 1-year recidivism rate is 32% higher than that of the average 35-year old.
Specifically, a male, local, 35-year-old offender with average LSIR will recidivate at the rate of
12%, while a 25-year-old offender with these characteristics will recidivate at the rate of 16%,
39% higher. Meanwhile, a 45-year-old with these characteristics with recidivate at a rate of 8%,
41% higher. Note that the drop in recidivism is greater between age 25 to 35 than age 35 to 45,
despite the difference being ten years in each case.
Education
GED holders recidivate at the highest rates, reaching almost half by 3 years. Holding a GED is
correlated with recidivism to the same degree as age; each variable explains almost one-fifth of
8 “Average” means that each characteristic in the regression is set at the average of the population. As nobody is “65% black” or “8% female”, the average offender doesn’t exist. To enrich interpretation, the analysis also provides the recidivism rates of an individual with particular characteristics.

37
whether an ex-offender recidivates. Bivariate tests confirms the GED recidivism rate to be
significantly significant in comparison to those without high school diplomas, as well as to high
school graduates, for both 1 and 3-year recidivism. Contrary to expectations, high school
graduates recidivate at equivalent rates to those without high school diplomas after 1 year. The
former are actually 29% more likely to recidivate by three years than the latter, but this
difference doesn’t achieve statistical significance under a bivariate regression. Nobody with
college experience recidivates by 1 year, and only one recidivates by 3 years. The regression
does not account for educational attainment, due to complications in analysis. Accounting for
education in a future regression analysis would uncover the degree to which its correlation with
age (for the categories of no high school diploma and college experience, as indicated by their
correlational coefficients) explains its correlation with recidivism.
Employment
1-year recidivism is identical between those employed and unemployed at release. The
employment requirement at PRC explains this finding. PRC revokes residents who don’t find
employment (generally those with other unsuitable behaviors) after a given time. Additionally,
being an inside worker isn’t a statistically significant predictor, according to a bivariate test. This
is likely due to the many possible reasons for a resident working for PRC, rather than an external
employer. Explanations range from disabilities to a PRC stay whose short duration obstructs
employment (J. Henriquez, personal communication, March 13, 2014).
Gender: Recidivism sharply and significantly diverges by gender, with the male rate dwarfing
that of females by a factor of five after 1 year and seven after 3 years. Due to the small size of

38
the female population, over-sampling females would be recommended for future gender analysis.
(Exactly one female recidivated in the 1 and 3 year dataset.) However, bivariate tests confirmed
that gender differences are statistically significant for both 1 and 3-year recidivism.
Recidivism Rate
1 Year 3 Year
Male 14% 31%
Female 3% 5%
LSIR
The Level of Service Inventory-Revised (LSIR) is a 54-item questionnaire administered to
inmates in order to assess likelihood of re-offending. Topics cover ten domains with proven
correlation to recidivism, including peers, education, and employment. Most importantly, LSIR
accounts for previous criminal history, a predictor that the literature review found to be strongly
predicative of future re-offending. The responses generate a composite numerical score which is
classified into four categories. LSIR informs case managers’ development of reentry plans, but
doesn’t influence PRC eligibility or programming (134).
This analysis found LSIR to be the variable most highly correlated with 1 and 3-year recidivism.
Higher LSIR means higher recidivism. No one-year recidivism occurred among residents
evaluated at minimum risk. The recidivism rate steadily increases with LSIR score, reaching
two-thirds of maximum offenders after 3 years. Bivariate tests of both 1 and 3-year recidivism
found the differences between each of the four categories to be statistically significant for all but

39
the lowest two. In the regression analysis, LSIR achieves high statistical significance for 1 and 3-
year recidivism. Holding the other variables (age, gender, criminal justice system of origin, and
race) constant, a one-unit increase in the LSIR score increases the likelihood of 1-year recidivism
by log odds of .104. An average offender with an LSIR of 25 (the first score falling in the high-
medium category) is 3.3 times as likely to recidivate as an average offender with an LSIR of 13
(the first score falling in the low-medium category). An average offender with an LSIR score of
37 (the first score falling in the maximum category) is 2.9 times as likely to recidivate as an
average offender with an LSIR of 25. These ratios also hold true for a male, local offender of
average age (34).
Finding LSIR to be a statistically significant predictor is important for the Pre-Release Center, as
a data-based indication that LSIR is performing its intended purpose. Although LSIR is a
rigorously validated tool used nationally, it has not yet been tested for predictability for the PRC
population. This analysis supports its value for PRC case managers in developing individualized
plans for their residents.
Recidivism Rate
LSIR Category 1 Year 3 Year
Minimum (0-12) 0% 15%
Low-Medium (13-24) 7% 18%
High-Medium (25-36) 16% 35%
Maximum (37-40) 36% 67%
40
Race
At 16%, blacks experience much higher 1-year recidivism than Hispanics at 10%, Whites at 9%,
and Other at 17%. Blacks also hold the highest 3-year recidivism rate of 34%, exceeding
Hispanic at 30%, Other at 25%, and White at 24%. However, bivariate analysis demonstrates the
only statistically significant inter-race difference lies between blacks and whites for 1-year
recidivism, perhaps due to the low sample size of Hispanic and Other offenders. In the regression
modeling, neither Black nor Hispanic achieved statistical significance, with White as the base
case. However, Other race category is statistically significant for 1-year regression, with a log
odds of 1.475. This means that an average Other offender is 3.7 times as likely to recidivate as an
average White offender. For the specific case of a male, local offender of average age (34) and
LSIR (25), an Other racial identification makes the recidivism rate 3.6 times as likely to
recidivate as a White individual with those same characteristics. While these calculations are
mathematically valid, they present little value to PRC because individuals identifying as other
are a tiny minority of the population – only 4% of this paper’s sample.
System
The criminal justice system of origin produces strikingly different recidivism rates. A little over
one-fourth of Drug Court offenders recidivated by 1 year, twice the rate of local offenders and
five times the rate of federal offenders. This ranking remains for three-year recidivism, but the
percent differences between the sub-groups diminish. Considering that federal offenses tend to
be more serious crimes than those adjudicated by local, their low rates are unanticipated. Further
analysis suggests two explanations. First, the average federal offender is 39 years old, compared
to the average age of 32 and 33 for Drug Court and local offenders respectively. As evidenced in

41
the raw statistics and regression analysis, older individuals are less likely to re-offend. Secondly,
education acts as a confounding factor. One-third of federal offenders received some college
education, triple the rate of local offenders and quadruple the rate of Drug Court offenders.
Bivariate analysis of each category to the other two categories affirms that the differences are all
statistically significant, for both 1 and 3-year recidivism. However, using local as a base case,
neither Drug Court nor federal status achieves statistical significance for 1-year recidivism. On
the other hand, Drug Court offenders barely attain statistical significance in the 3-year recidivism
analysis. Holding age, gender, LSIR and race constant, being a Drug Court offender increases the
log odds of recidivating by 1.04. The average Drug Court offender’s probability of recidivating
is nearly twice that of the average local offender. Specifically, a male Drug Court offender with
average age and LSIR is 83% more likely to recidivate than a local offender with the same
characteristics.
Recidivism Rate
System 1 Year 3 Year
Drug Court 27% 56%
Federal 5% 14%
Local 14% 30%
Release Location
As the dataset contains only four releases labeled as homeless or ‘needs housing’, and two
classified as released to sober housing, their sample sizes are too small for recidivism analysis.
Geographical analysis of release location doesn’t yield any meaningful results for states or cities.

42
Of the 6 external states to which PRC released individuals, only DC and Virginia received more
than one release. The difference between their recidivism rates and that of Maryland doesn’t
reach statistical significance under bivariate testing. The three percentage point difference in
recidivism rates for Maryland and total out-of-state releases isn’t significant either. PRC releases
residents to 72 unique cities. One-fifth of those with a specified city of release go to Silver
Spring; one-seventh to Gaithersburg; and one-tenth to Rockville. No large and statistically
significant differences appear in comparing recidivism rates by release city.
Data Analysis: Further Recidivism Analysis
This section explores recidivism trends beyond sub-group differentiation.
Recidivism Over Time
Analyzing the cumulative recidivism rates reveals that almost one-quarter of those who will
eventually recidivate by 3 years re-offend during the first 6 months, and the same share in the
second 12 months. About 8% do so in each of the next 6 month time periods. However, one-third
of releases become recidivators in the last 6 months of the 3-year analysis.
Recidivist Event Type
Almost three quarters of 1-year recidivators were convicted for crimes only, while 15% limited
themselves to traffic offenses. (As a reminder, PRC decided against classifying non-incarcerable
traffic crimes as recidivist offenses). By 3 years, the percentage of just traffic rises slightly, while
just crime falls slightly. From another perspective, traffic violations prompted at least one

43
conviction for 27% of 1-year recidivators and 31% of 3-year recidivators. On the other hand,
crimes causes at least one conviction for 85% of 1-year recidivators and 80% of 3-year
recidivators. The similarity of the share of traffic and criminal convictions in 1 and 3-year
measures contradicts the hypothesis mentioned earlier, that the time period chosen might alter
the perception of the type of crime. Further disaggregating by age and education reveals
interesting 1-year recidivism trends (examined in lieu of 3-year because of larger sample sizes).
Of 3-year recidivators, 8% of under 25-year olds have committed only traffic offenses, a rate that
more than doubles for 25 to 45 year olds. 85% of under 25 year olds have committed only
crimes, compared to 68% for 25 to 45 year olds. The percentage of those convicted for only
crimes is highest for high school graduates, and lowest for those with college experience, while
the reverse is true for only traffic convictions.
Type of Recidivism of Individual
1 Year 3 Year
Recidivism: Just Criminal 73% 69%
Recidivism: Just Traffic 15% 20%
Recidivism: Mix 12% 10%
Other Observations
• Differences between sub-groups tend to increase with time. For ten population divisions
examined (release month, age group, education, employment, gender, inside worker, LSIR
category, system, race and release city), the percentage point difference between the
44
minimum and maximum is larger for 3-year recidivism than 1-year recidivism. This pattern
follows that of the BJS study discussed previously.
• The dataset indicates VOP caused at least one conviction for 3 (6%) of one-year recidivators
and 6 (14%) of three-year recidivators. However, 16% of convictions for the 1 and three-year
recidivism samples lacked VOP information.
Conclusions
First of all, the review of existing recidivism definitions reveals the vast heterogeneity regarding
the time period, criminal event, and population. There is no consensus among jurisdictions and
researchers on a definition of recidivism. PRC should maintain its current 1 and 3-year re-
conviction definition, in order to compare future data against the current baseline. The 3 year
time period allows greater recognition of cases progressing slowly through the criminal justice
system, while re-convictions are a more valid definition of crime than arrests in omitting those
arrested but not found guilty. Moreover, PRC’s incorporation of local, state and federal criminal
justice databases improves the validity of its recidivism rate, a worthwhile achievement despite
reducing generalizability to jurisdictions with more limited databases.
Second, the recidivism rate is not an appropriate performance indicator of a correctional facility,
due to the large and non-quantifiable influence of contextual factors. The role of politics,
demographics and criminal justice policy on recidivism rates makes inter-jurisdictional
comparisons of recidivism rates difficult. Therefore, PRC’s recidivism rate is meaningful as an

45
indicator of the combined efforts of government agencies (education, social service, workforce
development, correctional facilities), not as an indication of the facility’s performance. For these
reasons, I recommend against benchmarking PRC’s recidivism rates to another jurisdiction.
Instead, PRC should focus on changes in its recidivism rate over time and the differences
between sub-groups. A baseline recidivism rate of MCCF would be a highly valuable
comparison group to the Pre-Release Center, despite the intangible differences in population.
Another helpful aid to future recidivism research would be tracking the number of hours in
which residents participated in particular programs at PRC. This would allow researchers to
investigate the connection between program participation, recidivism magnitude and recidivism
type. Lastly, the complexity of categorizing initial and recidivist offenses prevented this
researcher from examining specialist recidivism, an important research question.
For the PRC, the most helpful takeaway from the data analysis component is the progression
beyond merely identifying sub-groups with the highest recidivism rates. The regression analysis
demonstrates that racial and gender differences fall away once criminal history and age are taken
into account. The quantitative work indicates the need to dedicate programmatic funding and
attention towards residents under age 25, and those with high LSIR. These two categories of
offenders should be prioritized as recipients of PRC resources, and development of additional
programs for their criminogenic needs. Lastly, this study supports PRC’s use of LSIR as a
predictive tool of re-offending. As LSIR has not been validated for the PRC population, this
study should give case managers greater confidence in the use of LSIR for their clients.

46

47
References Bloom, D. (2006, July). Employment-Focused Programs for Ex-Prisoners. mdrc. Retrieved from
http://www.mdrc.org/sites/default/files/full_87.pdf Brazzell, D., Crayton, A., Mukamal, D., Solomon, A. & Lindahl, N. (2009). From the Classroom to
the Community: Exploring the Role of Education during Incarceration and Reentry. The Urban Institute Justice Policy Center. Retrieved from http://www.urban.org/uploadedpdf/411963_classroom_community.pdf.
Bureau of Justice Assistance. (2013, April 30). Second Chance Act Comprehensive Statewide Adult Recidivism Reduction Planning Program FY 2013 Competitive Grant Announcement. OMB No. 1121-0329. Office of Justice Programs. U.S. Department of Justice. Retrieved from https://www.bja.gov/Funding/13SCARecidivismReductionSol.pdf
Cave, S., Williams, T., Jolliffe, D., & Hedderman, C. (2012, May). Peterborough Social Impact Bond: an independent assessment. Ministry of Justice Research Series. Retrieved from https://www.gov.uk/government/uploads/system/uploads/attachment_data/file/217392/peterborough-social-impact-bond-assessment.pdf
Cooper, A. D., Durose, M. R., & Synder, H.N. (2014, April 22). Recidivism of Prisoners Released in 30 States in 2005: Patterns from 2005 to 2010. Bureau of Justices Statistics. U.S. Department of Justice. Retrieved from http://www.bjs.gov/index.cfm?ty=pbse&sid=44
CountyStat. (2008, January 30). Department of Correction and Rehabilitation Performance Plan. Retrieved from http://www.montgomerycountymd.gov/countystat/Resources/Files/pdf/1_30_08_PPT.pdf.
CountyStat. (2009, March 24). Department of Correction and Rehabilitation Performance Review. Retrieved from http://www.montgomerycountymd.gov/countystat/Resources/Files/pdf/03_24_09_PPT.pdf
CountyStat. (2010, September 17). DOCR Inmate Programming Cost/Benefit Analysis. Retrieved from http://www.montgomerycountymd.gov/countystat/Resources/Files/pdf/09_17_2010_ppt.pdf
CountyStat. (2014). Benchmarks. Retrieved from http://www.montgomerycountymd.gov/countystat/benchmarks.html
Davis, L., Bozick, R., Steele, J., Saunders, J., and Miles, J. (2013). Evaluating the Effectiveness of Correctional Education: A Meta-Analysis of Programs That Provide Education to Incarcerated Adults. Rand Corporation. Retrieved from http://www.rand.org/content/dam/rand/pubs/research_reports/RR200/RR266/RAND_RR266.pdf
Department of Legislative Services. (January 2014). Department of Public Safety and Correctional Services Fiscal 2015 Budget Overview. Retrieved from http://mgaleg.maryland.gov/pubs/budgetfiscal/2015fy-budget-docs-operating-Q00-DPSCS-Overview.pdf
Draine, J. & Wolff, N. (2009, September). Social Capital and Reentry to the Community from Prison. Center for Behavioral Health Services and Criminal Justice Research. Retrieved from http://www.cbhs-cjr.rutgers.edu/pdfs/Research Brief_Social_Capital.pdf

48
Duran, L., Plotkin, M., Potter, P., & Rosen, H. (2013, September). Integrated Reentry and Employment Strategies: Reducing Recidivism and Promoting Job Readiness. The Council of State Governments Justice Center. Retrieved from http://csgjusticecenter.org/nrrc/
Fieselmann, Heidi. (2011, July 27). Determining What Works in Reentry: How to Measure the Success and Progress of Maryland’s Reentry Programs.
Glaze, L.E. & Herberman, E.J. (2013, December). Correctional Populations in the United States, 2012. Office of Justice Programs. U.S. Department of Justice. Retrieved from http://www.bjs.gov/content/pub/pdf/cpus12.pdf
Istrate, E. & Nowakowski, A. (2013, July). Five Things to Know About Counties. National Association of Counties. Retrieved from http://www.naco.org/Counties/countiesdo/Pages/Why-Counties-Matter2_4.aspx
Jefferies, R., & Calkins, E. (2012, July 2). Mental Health Public Defender Office Cost Benefit Analysis. Justice and Public Safety. Retrieved from http://www.co.travis.tx.us/commissioners_court/agendas/2012/09/backup/item_backup_20120927ws/ws120927_item_03.pdf
Katel, P. (2009, December 4). Prisoner Reentry. CQ Researcher. La Vigne, N.G., Davies, E., Lachman, P., & Neusteter, S.R. (2013). Justice Reinvestment at the
Local Level. Urban Institute Justice Policy Center. Langan, P.A. & Levin, D.J. (2002, June 2). Recidivism of Prisoners Released In 1994. Bureau of
Justices Statistics. U.S. Department of Justice. Retrieved from http://www.bjs.gov/index.cfm?ty=pbse&sid=44
Lattimore, P., & Visher, C. (2009, December). The Multi-site Evaluation of the Serious and Violent Offender Reentry Initiative: Summary and Synthesis. Retrieved from www.urban.org/uploadedpdf/412075_evaluation_svori.pdf
LoBuglio, S. (2007, March 20). Second Chance Act of 2007: Promoting Prison and Jail Reentry Programs Hearing before the Subcommittee on Crime, Terrorism and Homeland Security of the House of Representatives. 110th Cong.
LoBuglio, S. F. (2007). Gauging the Effectiveness of Jail Reentry Programs: Evidence from the Hampden County, Massachusetts Sheriff’s Department Transitional Program. The Graduate School of Education of Harvard University.
Lyman, M. & Lupo, M. (2014, March). House of Correction Recidivism Report: 2012 & 2010 Releases. Hampden County Sheriff’s Department. Retrieved from http://www.hcsdmass.org/20102012recidivismreport.pdf.
Mallik-Kane, K. & Visher, C. (2008, February). Health and Prisoner How Physical, Mental, and Substance Abuse Conditions Shape the Process of Reintegration. Urban Institute Justice Policy Center. Retrieved from http://www.urban.org/UploadedPDF/411617_health_prisoner_reentry.pdf
Maryland Courts. (2014). Glossary of Court Terms. Maryland Judiciary. Retrieved from http://www.courts.state.md.us/reference/glossary.html
Maryland Task Force on Prisoner Reentry. (2011). Final Report on Prisoner Reentry. Metraux, S. & Culhane, D. (2004, March). Homeless Shelter Use and Reincarceration Following
Prison Release. Criminology & Public Policy, 3 (2), 201-222. Retrieved from http://works.bepress.com/cgi/viewcontent.cgi?article=1008&context=metraux
Montgomery County Department of Correction and Rehabilitation (n.d.). Bureau of Justice Assistance Co-Occurring Narrative. BJA-2014-3773. Retrieved from http://www.montgomerycountymd.gov/COR/PRRS/Resourcesinformation.html

49
Montgomery County Department of Correction and Rehabilitation. (2011, October 11). Performance Plan.
Montgomery County Department of Correction and Rehabilitation. (n.d.) FY2013 Performance and Accountability Report.
Montgomery County Department of Police. (2014). Department of Police Year-End Report. http://www.mymcpnews.com/wordpress/wp-content/uploads/2013-Crime-Stats-Year-End.png
Montgomery County Pre-Release and Reentry Services (2012). Case Management Services Monthly Performance Measures. Retrieved from http://www6.montgomerycountymd.gov/content/docr/pdfs/cm-december-2013-performancemeasures.xls.
Montgomery County Pre-Release and Reentry Services (2014). Pre-Release and Reentry Services Division. Montgomery County Department of Correction and Rehabilitation.
Montgomery County Pre-Release and Reentry Services. (2014, March 6). PRRS Quarterly Chief’s Report. Retrieved from http://www.montgomerycountymd.gov/COR/Resources/Files/prrs/ChiefsReport3-6-14.pdf
Palazzolo, J. (2013, December 5). Curbing Inmate Round Trips. Wall Street Journal. Pre-Release and Reentry Services. (2014). Pre-Release and Reentry Services. Montgomery County
Department of Correction and Rehabilitation. Retrieved from http://www.montgomerycountymd.gov/cor/PRRS/index.html
Prince George’s County Office of Management and Budget. (2013, September). Approved Operating Budget FY 2014. Retrieved from http://www.princegeorgescountymd.gov/sites/OMB/Resources/Budget-2014/Pages/default.aspx.
Redcross, C., Millenky, M., Rudd, T., & Levshin, V. (2012, January). More Than a Job: Evaluation of the Center for Employment Opportunities (CEO) Transitional Jobs Program. OPRE Report 2011-18. Office of Planning, Research and Evaluation, Administration for Children and Families, U.S. Department of Health and Human Services.
Riccigreene Associates and Alternative Solutions Associates, Inc.,. (2014, January 15). Master Facilities Confinement Study.
Roman, J., Kane, M., Turner, E., & Frazier, B. (2006, June). Instituting Lasting Reforms for Prisoner Reentry in Philadelphia. Urban Institute Justice Policy Center. Retrieved from http://www.urban.org/uploadedpdf/411345_lastingreforms.pdf
Social Finance Limited. (2011). Peterborough Social Impact Bond. Retrieved from http://www.socialfinance.org.uk/sites/default/files/SF_Peterborough_SIB.pdf
Solomon, A., Osborne, J., LoBuglio, S., Mellow, J., & Mukamal, D. (2008, May). Life After Lockup: Improving Reentry from Jail to the Community. Urban Institute Justice Policy Center. Retrieved from http://www.urban.org/UploadedPDF/411660_life_after_lockup.pdf
Spjeldnes, S., & Goodkind, S. (2009). Gender Differences and Offender Reentry: A Review of the Literature. Journal of Offender Rehabilitation, 48, 314-335.
The Center for What Works. (n.d.) Candidate Outcome Indicators: Prisoner Re-Entry Program. The Urban Institute. Retrieved from http://www.urban.org/center/met/projects/upload/PrisonerRe-entry.pdf
The Council of State Governments Justice Center. (2012, September). States Report Reductions in Recidivism. Retrieved from

50
http://csgjusticecenter.org/documents/0000/1569/9.24.12_Recidivism_Reductions_9-24_lo_res.pdf
The Pew Center on the States. (2011, April). State of Recidivism: The Revolving Door of America’s Prisons. The Pew Charitable Trusts. Retrieved from http://www.pewstates.org/uploadedFiles/PCS_Assets/2011/Pew_State_of_Recidivism.pdf.
U.S. Census Bureau. (n.d.a). Selected Social Characteristics in the United States. 2010-2012 American Community Survey. Retrieved April 1, 2014, from http://factfinder2.census.gov
U.S. Census Bureau. (n.d.b). Selected Economic Characteristics in the United States. 2010-2012 American Community Survey. Retrieved April 1, 2014, from http://factfinder2.census.gov
Uchida, C., LoBuglio, S., Flower, S., Piehl, A., and Still, T. (2009, November). Measuring Jail Recidivism in Montgomery County, Maryland. Justice & Security Strategies, Inc. and the Montgomery County Pre-Release and Re-Entry Services Division, Department of Correction and Rehabilitation. Retrieved from http://www6.montgomerycountymd.gov/content/docr/pdfs/finalrecidivismreport-dec-16-2009.pdf
Visher, C., LaVigne, N., & Travis, J. (2004, January). Returning Home: Understanding the Challenges of Prisoner Reentry. Urban Institute Justice Policy Center. Retrieved from http://www.urban.org/uploadedPDF/410974_ReturningHome_MD.pdf
Willison, J. B., Jannetta, J., Dodd, H., Neusteter, S. R., Warwick, K., Greer, K., & Matthews, A. (2012, September). Process and Systems Change Evaluation Findings from the Transition from Jail to the Community Initiative. Urban Institute Justice Policy Center and National Institute of Corrections. Retrieved from http://static.nicic.gov/Library/026925.pdf.

51
APPENDICES

52
Appendix A: Original and Created Variables Neither the list of variables nor the value/notes are exhaustive depictions of the variables created in the Stata Do-Files. They offer a helpful starting point to the key variables and some of their characteristics. Stata
storage type Values/Note
(DOB) BirthDate int 1940 thru 1994
Age float 18 to 70 AgeSq float 324 to 4904 AgeCen float -16 to 36 AgeGroup_12Cat float 1 "Under 20"
2 "20-25" 3 "25-30" 4 "30-35" 5 "35-40" 6 "40-45" 7 "45-50" 8 "50-55" 9 "55-60" 10 "60-65" 11 "65-70" 12 "Over 70"
AgeGroup_3Cat float 1: <25 2: 25-45 3: >=45
Age_MiddleToYoung float . : >=45 0: <25 1: 25-45
Age_OldToYoung float .: 25-45 0: <25 1 : >=4
AgeCurrent float 19 to 73 Education str many categories

53
Education2 str fixes extra spaces, spelling and capitalization inconsistency in Highest Level of Education
Education_8Cat float .=Unknown,missing, N/A 1= No High School 2 = High School, No Degree 3 = GED 4 = High School, Degree 5 = College, No Degree 6 = College, Associate's Degree (AS,AA) 7 = College, Bachelor's Degree (BA/BS) 8 = Advanced Degree

54
Education_4Cat float .=Unknown,missing, N/A 1= No High School Diploma 2 = GED 3 = High School, Degree 4 = At Least Some College
Employed (EmployedWhenReleased) str uncleaned
Employed2 str no yes n/a
Employed3 long 1 = N/A 2= No 3= Yes
EmployedIndicator float . = missing or N/A 0 = No 1=Yes
Gender str male female
Gender2 long 0=male 1=female
Gender_Male float 0 = female 1 = male
InsideWorker str no yes n/a

55
InsideWorker2 long . = missing or N/A 0 = No 1=Yes
LSIRScore str ex. High-Medium(30)
LSIR2 str cleaned LSIRCategory str N/A
min: -12 low-medium: 13-24 high medium: 25-36 max: 37-40
LSIRCategory2 long . = missing or N/A 1= min 2=low-medium 3=high medium 4=max
LSIRNum str # LSIRNum2 byte 8 to 42 LSIRSq LSIRSq # OffenseServedatPRC str many, messy
Offense_VOP float 0 = no 1= yes (VOP in original offense)
(Type) System str uncleaned
System2 long Local Federal Drug State
System3 long Local Federal Drug State

56
System_Drug byte 0: No 1: Yes
OffenseType_Fed byte 0: No 1: Yes
OffenseType_Local byte 0: No 1: Yes
OffenseType_State byte 0: No 1: Yes
Race str white other black Asian Hispanic
Race 2 str white other/Asian black Hispanic
Race 3 long 1=black 2=Hispanic 3=Other 4=White
Race_Black byte 0: No 1: Yes
Race_Hispanic byte 0: No 1: Yes
Race_Other byte 0: No 1: Yes
Race_White byte 0: No 1: Yes
Race_NotWhite byte 0: No 1: Yes
Release Date int ex. 18nov2012
ReleaseMonth str ex. 2010-09
ReleaseLocation str city, state, zip code city state
ReleaseYear int #### ReleaseYear_2010 byte 0: not 2010
1: 2010 ReleaseYear_2011 byte 0: not 2011
1: 2011
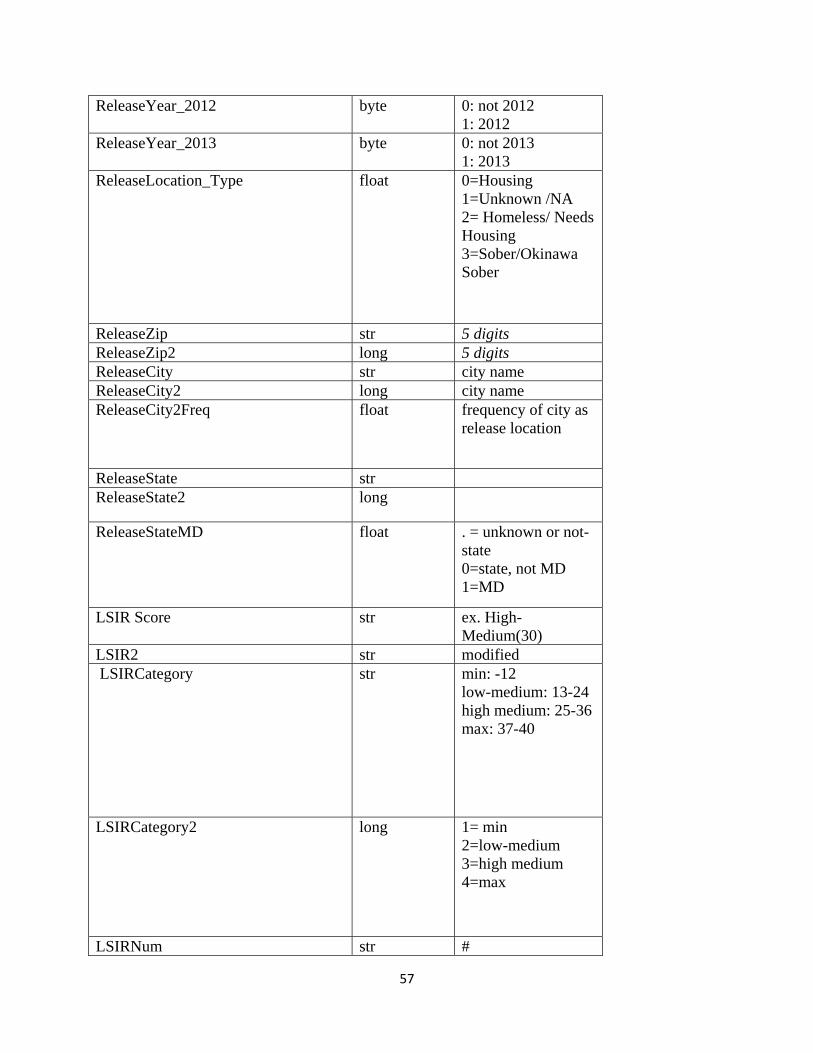
57
ReleaseYear_2012 byte 0: not 2012 1: 2012
ReleaseYear_2013 byte 0: not 2013 1: 2013
ReleaseLocation_Type float 0=Housing 1=Unknown /NA 2= Homeless/ Needs Housing 3=Sober/Okinawa Sober
ReleaseZip str 5 digits ReleaseZip2 long 5 digits ReleaseCity str city name ReleaseCity2 long city name ReleaseCity2Freq float frequency of city as
release location
ReleaseState str ReleaseState2 long
ReleaseStateMD float . = unknown or not-state 0=state, not MD 1=MD
LSIR Score str ex. High-Medium(30)
LSIR2 str modified LSIRCategory str min: -12
low-medium: 13-24 high medium: 25-36 max: 37-40
LSIRCategory2 long 1= min 2=low-medium 3=high medium 4=max
LSIRNum str #

58
LSIRNum2 byte # LSIRSq float # Charge[X]Conviction str missing
yes no
Charge[X]Conviction2 float 0 = no 1 = yes
Charge[X]VOPViolation str mi = no Charge, charge missing VOP info no = not VOP yes = VOP
Charge[X]VOPViolation2 float mi = no Charge, charge missing VOP info 0 = not VOP 1 = VOP
TotVOPRecidivism float 0 - 7 no mi allowed
Charge[X]TimefromReleasetoChar int #
(Charge[X]CaseType) (Charge[X]Type)
str uncleaned
Charge[X]Type2 str 1=serious traffic/traffic 2=criminal
Charge[X]DateIssued int
Charge[X]DateofConviction int
Charge[X]CaseNum str alphanumeric
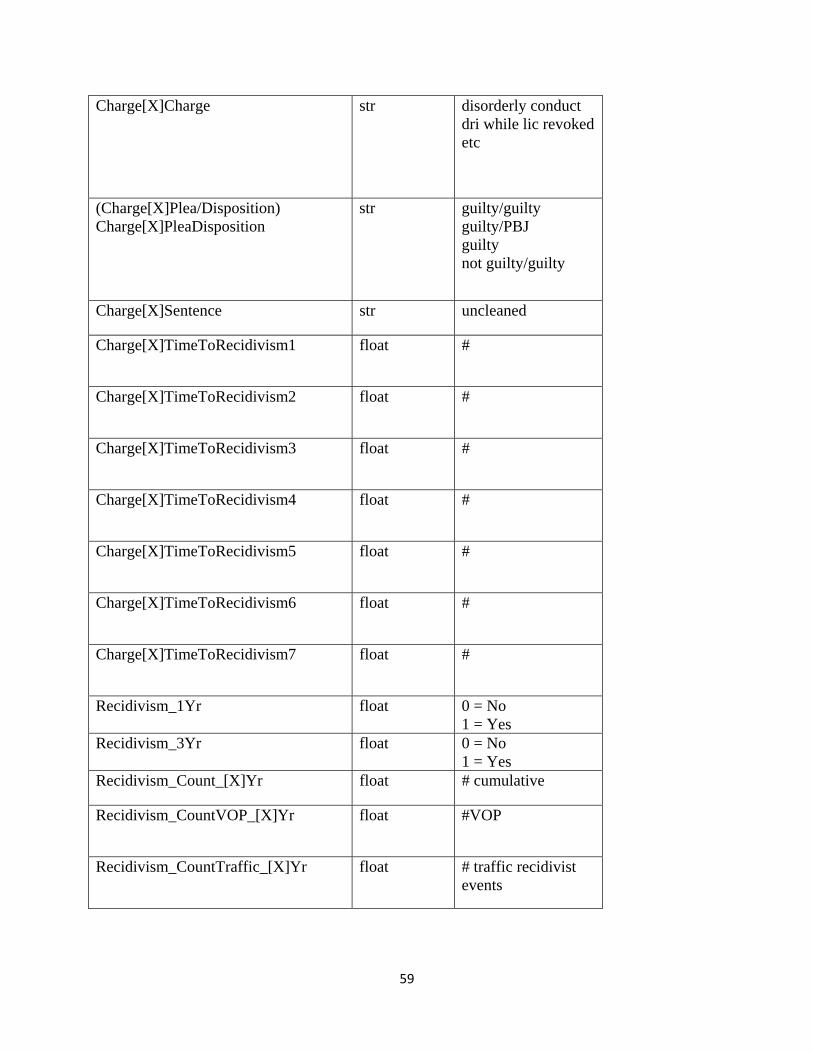
59
Charge[X]Charge str disorderly conduct dri while lic revoked etc
(Charge[X]Plea/Disposition) Charge[X]PleaDisposition
str guilty/guilty guilty/PBJ guilty not guilty/guilty
Charge[X]Sentence str uncleaned
Charge[X]TimeToRecidivism1 float #
Charge[X]TimeToRecidivism2 float #
Charge[X]TimeToRecidivism3 float #
Charge[X]TimeToRecidivism4 float #
Charge[X]TimeToRecidivism5 float #
Charge[X]TimeToRecidivism6 float #
Charge[X]TimeToRecidivism7 float #
Recidivism_1Yr float 0 = No 1 = Yes
Recidivism_3Yr float 0 = No 1 = Yes
Recidivism_Count_[X]Yr float # cumulative
Recidivism_CountVOP_[X]Yr float #VOP
Recidivism_CountTraffic_[X]Yr float # traffic recidivist events

60
Recidivism_CountCriminal_[X]Yr float # traffic criminal events
Recidivism_Type_[x]Yr float 0: no Recidivism 1: ecidivism: Just Traffic 2: Recidivism: Mix 3: Recidivism: Just Criminal
Recidivism_AtLeastOneTraffic_[X]Yr float . = non-recidivator 0 = No 1 = Yes
Recidivism_AtLeastOneCrim_[X]Yr float . = non-recidivator 0 = No 1 = Yes
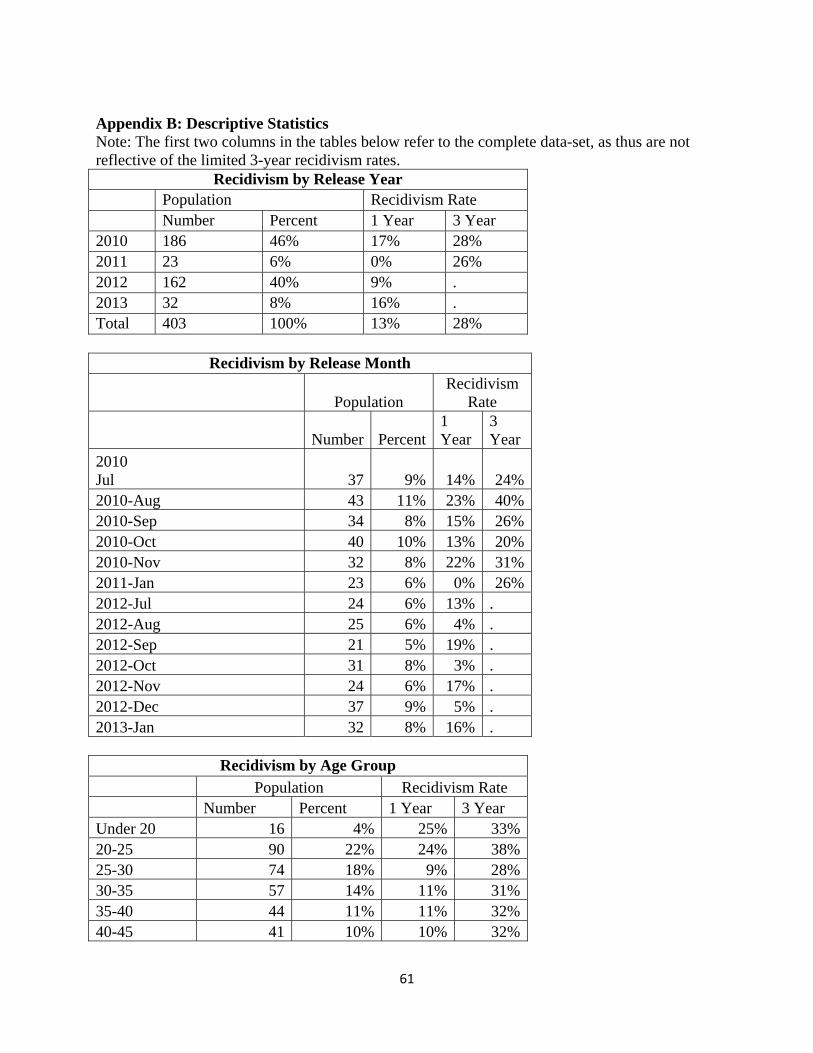
61
Appendix B: Descriptive Statistics Note: The first two columns in the tables below refer to the complete data-set, as thus are not reflective of the limited 3-year recidivism rates.
Recidivism by Release Year Population Recidivism Rate Number Percent 1 Year 3 Year 2010 186 46% 17% 28% 2011 23 6% 0% 26% 2012 162 40% 9% . 2013 32 8% 16% . Total 403 100% 13% 28%
Recidivism by Release Month
Population Recidivism
Rate
Number Percent1 Year
3 Year
2010 Jul 37 9% 14% 24%2010-Aug 43 11% 23% 40%2010-Sep 34 8% 15% 26%2010-Oct 40 10% 13% 20%2010-Nov 32 8% 22% 31%2011-Jan 23 6% 0% 26%2012-Jul 24 6% 13% . 2012-Aug 25 6% 4% . 2012-Sep 21 5% 19% . 2012-Oct 31 8% 3% . 2012-Nov 24 6% 17% . 2012-Dec 37 9% 5% . 2013-Jan 32 8% 16% .
Recidivism by Age Group Population Recidivism Rate Number Percent 1 Year 3 Year
Under 20 16 4% 25% 33%20-25 90 22% 24% 38%25-30 74 18% 9% 28%30-35 57 14% 11% 31%35-40 44 11% 11% 32%40-45 41 10% 10% 32%

62
45-50 34 8% 9% 16%50-55 24 6% 0% 0%55-60 13 3% 8% 13%60-65 3 1% 0% 0%65-70 4 1% 0% 0%Over 70 3 1% 0% 0%
Recidivism by Age Group Population Recidivism Rate Number Percent 1 Year 3 Year
Under 25 106 26% 25% 38%25-45 216 54% 10% 31%45 and Over 81 20% 5% 10%
Recidivism by Education
Population Recidivism
Rate
Number Percent 1 Year
3 Year
Unknown 66 16% 12% 24%No High School 11 3% 18% 36%High School, No Degree 81 20% 12% 18%GED 49 12% 29% 48%High School, Degree 140 35% 13% 30%College, No Degree 35 9% 0% 0%College, Associate's 2 1% 0% . College, Bachelor's 13 3% 0% 14%Advanced Degree 3 1% 0% 0%
Recidivism by Education
Population Recidivism
Rate
Number Percent1 Year
3 Year
No High School Degree 92.00 27.54 13% 23%GED 49.00 14.67 29% 48%High School Degree 140.00 41.92 13% 30%Least Some College 53.00 15.87 0% 5%

63
Recidivism by Employment At Release Population Recidivism Rate Number Percent 1 Year 3 Year
No 77 19% 13% 26%Yes 255 63% 13% 31%
Recidivism by Gender Population Recidivism Rate Number Percent 1 Year 3 Year
Male 363 90% 14% 31%Female 39 10% 3% 5%
Recidivism by Inside Worker Population Recidivism Rate Number Percent 1 Year 3 Year
No 308 76% 13% 30%Yes 24 6% 17% 13%
Recidivism by LSIR Population Recidivism Rate Number Percent 1 Year 3 Year
Minimum 19 5% 0% 15%Low-Medium 132 33% 7% 18%High-Medium 168 42% 16% 35%Maximum 22 5% 36% 67%
Recidivism by Race Population Recidivism Rate Number Percent 1 Year 3 Year
Black 180 45% 16% 34%Hispanic 30 7% 10% 30%White 114 28% 9% 24%Other 18 4% 17% 25%
Recidivism by Top Release Cities
Population Recidivism
Rate
Number Percent1 Year
3 Year
Gaithersburg 44 15% 16% 37%Germantown 20 7% 5% 14%Rockville 27 9% 19% 33%

64
Silver Spring 57 19% 16% 28%Remaining Cities (Under 10 Releases) 134 45% 12% 29%Washington 18 6% 17% 20%
Recidivism by Release State Population Recidivism Rate Number 1 Year 3 Year
DC 18 6% 17% 20%KS 1 0% 0% 100%MD 263 88% 13% 30%NY 1 0% 100% 100%OH 1 0% 0% . SC 1 0% 0% . VA 15 5% 13% 17%
Recidivism by System Population Recidivism Rate Number Percent 1 Year 3 Year
Drug Court 30 7% 27% 56%Federal 86 21% 5% 14%Local 285 71% 14% 30%State 1 0% 0% 0%
Type of Recidivism of Individual 1 Year 3 Year Recidivism: Just Criminal 73% 69% Recidivism: Just Traffic 15% 20% Recidivism: Mix 12% 10%
Type of Recidivism By Age
Total Recidivators
At Least One Criminal Conviction
At Least One Traffic Conviction
Only Criminal Convictions
Only Traffic Convictions
Under 25 26 57% 36% 85% 8%25 to 45 22 43% 64% 68% 18%
Recidivism Over Time Months After Release 0-6 6-12 12-18 18-24 24-30 30-36

65
Cumulative Recidivism 6% 13% 15% 18% 20% 0.28

66
Appendix C: T-Tests 1 Year Recidivism T-Test:Age_MiddleToYoung Two-sample t test with equal variances ------------------------------------------------------------------------------ Group | Obs Mean Std. Err. Std. Dev. [95% Conf. Interval] ---------+-------------------------------------------------------------------- Under 25 | 106 .245283 .0419886 .4322989 .1620274 .3285386 25-45 | 216 .1018519 .0206271 .303156 .0611945 .1425092 ---------+-------------------------------------------------------------------- combined | 322 .1490683 .0198787 .3567101 .1099594 .1881773 ---------+-------------------------------------------------------------------- diff | .1434312 .0416027 .0615818 .2252805 ------------------------------------------------------------------------------ diff = mean(Under 25) - mean(25-45) t = 3.4476 Ho: diff = 0 degrees of freedom = 320 Ha: diff < 0 Ha: diff != 0 Ha: diff > 0 Pr(T < t) = 0.9997 Pr(|T| > |t|) = 0.0006 Pr(T > t) = 0.0003 3 Year Recidivism T-Test:Age_MiddleToYoung Two-sample t test with equal variances ------------------------------------------------------------------------------ Group | Obs Mean Std. Err. Std. Dev. [95% Conf. Interval] ---------+-------------------------------------------------------------------- Under 25 | 53 .3773585 .0672194 .4893644 .242473 .512244 25-45 | 114 .3070175 .0433914 .4632932 .2210514 .3929837 ---------+-------------------------------------------------------------------- combined | 167 .3293413 .0364771 .4713875 .2573225 .4013601 ---------+-------------------------------------------------------------------- diff | .0703409 .0784154 -.0844861 .225168 ------------------------------------------------------------------------------ diff = mean(Under 25) - mean(25-45) t = 0.8970 Ho: diff = 0 degrees of freedom = 165 Ha: diff < 0 Ha: diff != 0 Ha: diff > 0 Pr(T < t) = 0.8145 Pr(|T| > |t|) = 0.3710 Pr(T > t) = 0.1855 1 Year Recidivism T-Test:Age_OldToMiddle Two-sample t test with equal variances ------------------------------------------------------------------------------ Group | Obs Mean Std. Err. Std. Dev. [95% Conf. Interval] ---------+-------------------------------------------------------------------- 25-45 | 216 .1018519 .0206271 .303156 .0611945 .1425092

67
45 and O | 81 .0493827 .024224 .2180157 .0011755 .09759 ---------+-------------------------------------------------------------------- combined | 297 .0875421 .0164274 .2831048 .0552128 .1198714 ---------+-------------------------------------------------------------------- diff | .0524691 .0368215 -.019997 .1249352 ------------------------------------------------------------------------------ diff = mean(25-45) - mean(45 and O) t = 1.4250 Ho: diff = 0 degrees of freedom = 295 Ha: diff < 0 Ha: diff != 0 Ha: diff > 0 Pr(T < t) = 0.9224 Pr(|T| > |t|) = 0.1552 Pr(T > t) = 0.0776 3 Year Recidivism T-Test:Age_OldToMiddle Two-sample t test with equal variances ------------------------------------------------------------------------------ Group | Obs Mean Std. Err. Std. Dev. [95% Conf. Interval] ---------+-------------------------------------------------------------------- 25-45 | 114 .3070175 .0433914 .4632932 .2210514 .3929837 45 and O | 42 .0952381 .0458438 .2971018 .0026547 .1878215 ---------+-------------------------------------------------------------------- combined | 156 .25 .0347804 .4344073 .1812952 .3187048 ---------+-------------------------------------------------------------------- diff | .2117794 .0767927 .0600763 .3634826 ------------------------------------------------------------------------------ diff = mean(25-45) - mean(45 and O) t = 2.7578 Ho: diff = 0 degrees of freedom = 154 Ha: diff < 0 Ha: diff != 0 Ha: diff > 0 Pr(T < t) = 0.9967 Pr(|T| > |t|) = 0.0065 Pr(T > t) = 0.0033 1 Year Recidivism T-Test:Age_OldToYoung Two-sample t test with equal variances ------------------------------------------------------------------------------ Group | Obs Mean Std. Err. Std. Dev. [95% Conf. Interval] ---------+-------------------------------------------------------------------- Under 25 | 106 .245283 .0419886 .4322989 .1620274 .3285386 45 and O | 81 .0493827 .024224 .2180157 .0011755 .09759 ---------+-------------------------------------------------------------------- combined | 187 .1604278 .0269099 .3679876 .1073399 .2135157 ---------+-------------------------------------------------------------------- diff | .1959003 .0525146 .0922958 .2995048 ------------------------------------------------------------------------------ diff = mean(Under 25) - mean(45 and O) t = 3.7304 Ho: diff = 0 degrees of freedom = 185 Ha: diff < 0 Ha: diff != 0 Ha: diff > 0

68
Pr(T < t) = 0.9999 Pr(|T| > |t|) = 0.0003 Pr(T > t) = 0.0001 3 Year Recidivism T-Test:Age_OldToYoung Two-sample t test with equal variances ------------------------------------------------------------------------------ Group | Obs Mean Std. Err. Std. Dev. [95% Conf. Interval] ---------+-------------------------------------------------------------------- Under 25 | 53 .3773585 .0672194 .4893644 .242473 .512244 45 and O | 42 .0952381 .0458438 .2971018 .0026547 .1878215 ---------+-------------------------------------------------------------------- combined | 95 .2526316 .0448175 .4368266 .1636455 .3416177 ---------+-------------------------------------------------------------------- diff | .2821204 .0858798 .1115801 .4526607 ------------------------------------------------------------------------------ diff = mean(Under 25) - mean(45 and O) t = 3.2851 Ho: diff = 0 degrees of freedom = 93 Ha: diff < 0 Ha: diff != 0 Ha: diff > 0 Pr(T < t) = 0.9993 Pr(|T| > |t|) = 0.0014 Pr(T > t) = 0.0007 1 Year Recidivism T-Test:Education_HSExpforTtest1 Two-sample t test with equal variances ------------------------------------------------------------------------------ Group | Obs Mean Std. Err. Std. Dev. [95% Conf. Interval] ---------+-------------------------------------------------------------------- NoHSD | 92 .1304348 .0353043 .3386266 .0603072 .2005624 HSD | 140 .1285714 .028391 .3359269 .0724374 .1847055 ---------+-------------------------------------------------------------------- combined | 232 .1293103 .0220771 .3362686 .0858121 .1728086 ---------+-------------------------------------------------------------------- diff | .0018634 .0452286 -.0872519 .0909786 ------------------------------------------------------------------------------ diff = mean(NoHSD) - mean(HSD) t = 0.0412 Ho: diff = 0 degrees of freedom = 230 Ha: diff < 0 Ha: diff != 0 Ha: diff > 0 Pr(T < t) = 0.5164 Pr(|T| > |t|) = 0.9672 Pr(T > t) = 0.4836 3 Year Recidivism T-Test:Education_HSExpforTtest1 Two-sample t test with equal variances ------------------------------------------------------------------------------ Group | Obs Mean Std. Err. Std. Dev. [95% Conf. Interval] ---------+-------------------------------------------------------------------- NoHSD | 39 .2307692 .0683479 .4268328 .092406 .3691324 HSD | 74 .2972973 .0534958 .4601885 .1906803 .4039143 ---------+--------------------------------------------------------------------
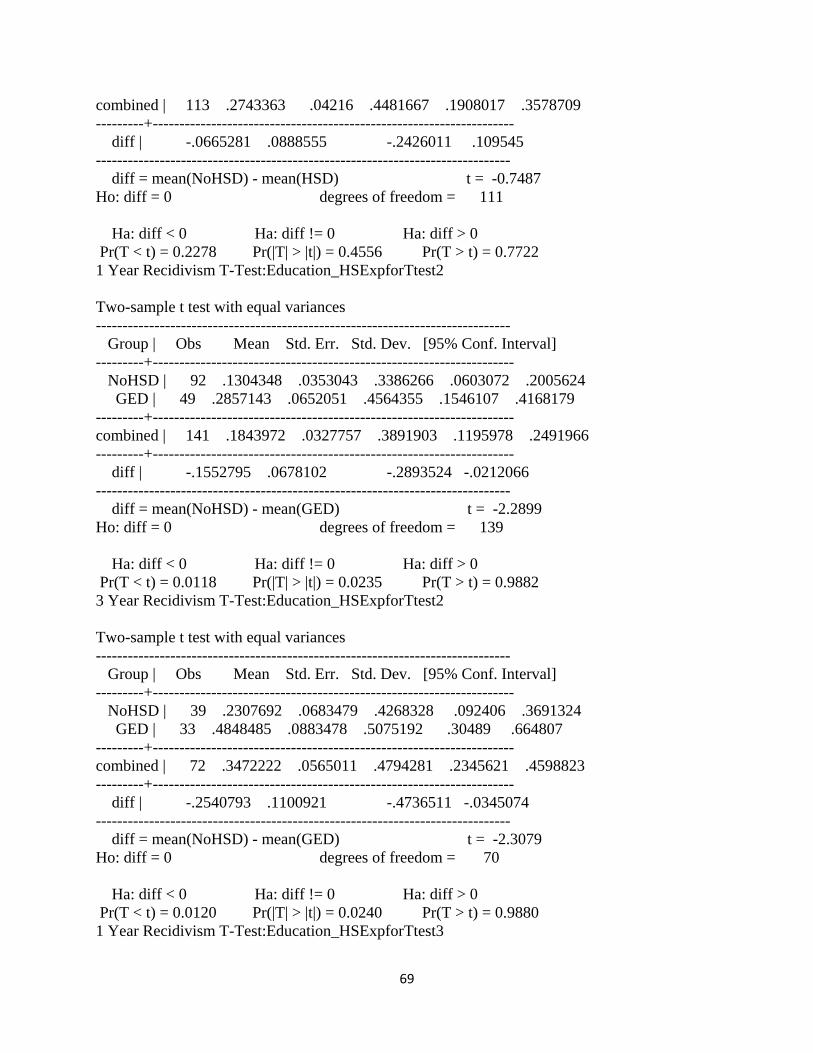
69
combined | 113 .2743363 .04216 .4481667 .1908017 .3578709 ---------+-------------------------------------------------------------------- diff | -.0665281 .0888555 -.2426011 .109545 ------------------------------------------------------------------------------ diff = mean(NoHSD) - mean(HSD) t = -0.7487 Ho: diff = 0 degrees of freedom = 111 Ha: diff < 0 Ha: diff != 0 Ha: diff > 0 Pr(T < t) = 0.2278 Pr(|T| > |t|) = 0.4556 Pr(T > t) = 0.7722 1 Year Recidivism T-Test:Education_HSExpforTtest2 Two-sample t test with equal variances ------------------------------------------------------------------------------ Group | Obs Mean Std. Err. Std. Dev. [95% Conf. Interval] ---------+-------------------------------------------------------------------- NoHSD | 92 .1304348 .0353043 .3386266 .0603072 .2005624 GED | 49 .2857143 .0652051 .4564355 .1546107 .4168179 ---------+-------------------------------------------------------------------- combined | 141 .1843972 .0327757 .3891903 .1195978 .2491966 ---------+-------------------------------------------------------------------- diff | -.1552795 .0678102 -.2893524 -.0212066 ------------------------------------------------------------------------------ diff = mean(NoHSD) - mean(GED) t = -2.2899 Ho: diff = 0 degrees of freedom = 139 Ha: diff < 0 Ha: diff != 0 Ha: diff > 0 Pr(T < t) = 0.0118 Pr(|T| > |t|) = 0.0235 Pr(T > t) = 0.9882 3 Year Recidivism T-Test:Education_HSExpforTtest2 Two-sample t test with equal variances ------------------------------------------------------------------------------ Group | Obs Mean Std. Err. Std. Dev. [95% Conf. Interval] ---------+-------------------------------------------------------------------- NoHSD | 39 .2307692 .0683479 .4268328 .092406 .3691324 GED | 33 .4848485 .0883478 .5075192 .30489 .664807 ---------+-------------------------------------------------------------------- combined | 72 .3472222 .0565011 .4794281 .2345621 .4598823 ---------+-------------------------------------------------------------------- diff | -.2540793 .1100921 -.4736511 -.0345074 ------------------------------------------------------------------------------ diff = mean(NoHSD) - mean(GED) t = -2.3079 Ho: diff = 0 degrees of freedom = 70 Ha: diff < 0 Ha: diff != 0 Ha: diff > 0 Pr(T < t) = 0.0120 Pr(|T| > |t|) = 0.0240 Pr(T > t) = 0.9880 1 Year Recidivism T-Test:Education_HSExpforTtest3
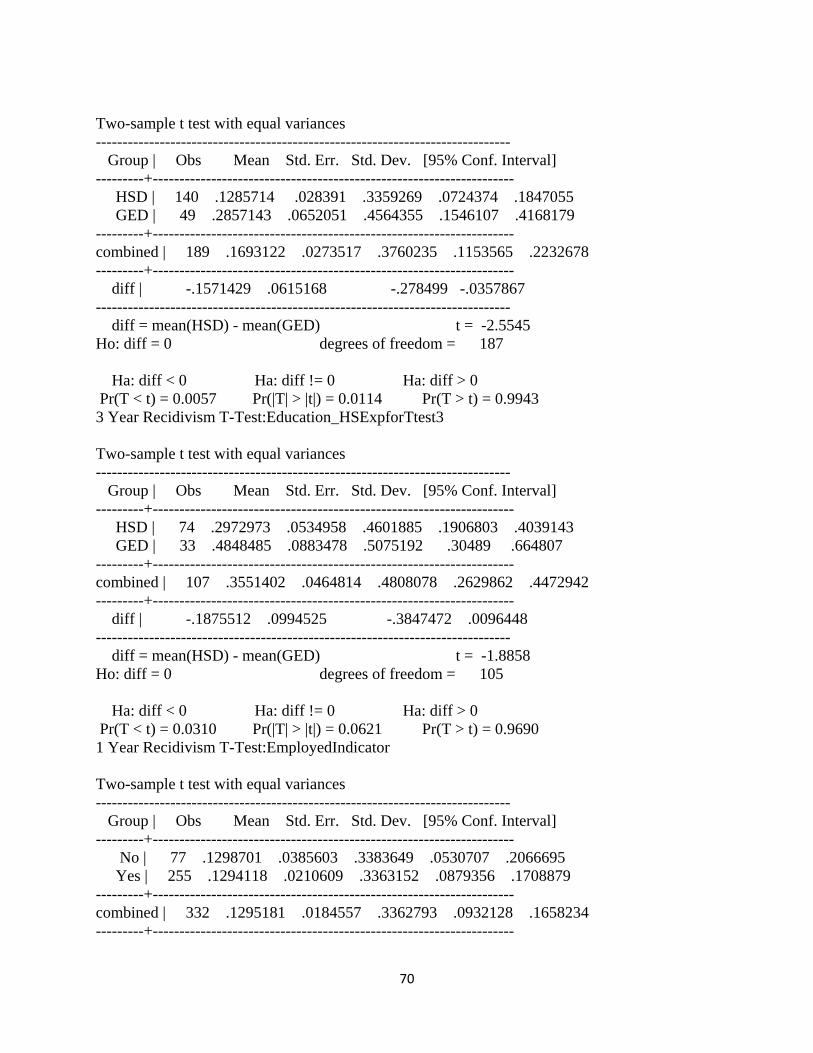
70
Two-sample t test with equal variances ------------------------------------------------------------------------------ Group | Obs Mean Std. Err. Std. Dev. [95% Conf. Interval] ---------+-------------------------------------------------------------------- HSD | 140 .1285714 .028391 .3359269 .0724374 .1847055 GED | 49 .2857143 .0652051 .4564355 .1546107 .4168179 ---------+-------------------------------------------------------------------- combined | 189 .1693122 .0273517 .3760235 .1153565 .2232678 ---------+-------------------------------------------------------------------- diff | -.1571429 .0615168 -.278499 -.0357867 ------------------------------------------------------------------------------ diff = mean(HSD) - mean(GED) t = -2.5545 Ho: diff = 0 degrees of freedom = 187 Ha: diff < 0 Ha: diff != 0 Ha: diff > 0 Pr(T < t) = 0.0057 Pr(|T| > |t|) = 0.0114 Pr(T > t) = 0.9943 3 Year Recidivism T-Test:Education_HSExpforTtest3 Two-sample t test with equal variances ------------------------------------------------------------------------------ Group | Obs Mean Std. Err. Std. Dev. [95% Conf. Interval] ---------+-------------------------------------------------------------------- HSD | 74 .2972973 .0534958 .4601885 .1906803 .4039143 GED | 33 .4848485 .0883478 .5075192 .30489 .664807 ---------+-------------------------------------------------------------------- combined | 107 .3551402 .0464814 .4808078 .2629862 .4472942 ---------+-------------------------------------------------------------------- diff | -.1875512 .0994525 -.3847472 .0096448 ------------------------------------------------------------------------------ diff = mean(HSD) - mean(GED) t = -1.8858 Ho: diff = 0 degrees of freedom = 105 Ha: diff < 0 Ha: diff != 0 Ha: diff > 0 Pr(T < t) = 0.0310 Pr(|T| > |t|) = 0.0621 Pr(T > t) = 0.9690 1 Year Recidivism T-Test:EmployedIndicator Two-sample t test with equal variances ------------------------------------------------------------------------------ Group | Obs Mean Std. Err. Std. Dev. [95% Conf. Interval] ---------+-------------------------------------------------------------------- No | 77 .1298701 .0385603 .3383649 .0530707 .2066695 Yes | 255 .1294118 .0210609 .3363152 .0879356 .1708879 ---------+-------------------------------------------------------------------- combined | 332 .1295181 .0184557 .3362793 .0932128 .1658234 ---------+--------------------------------------------------------------------
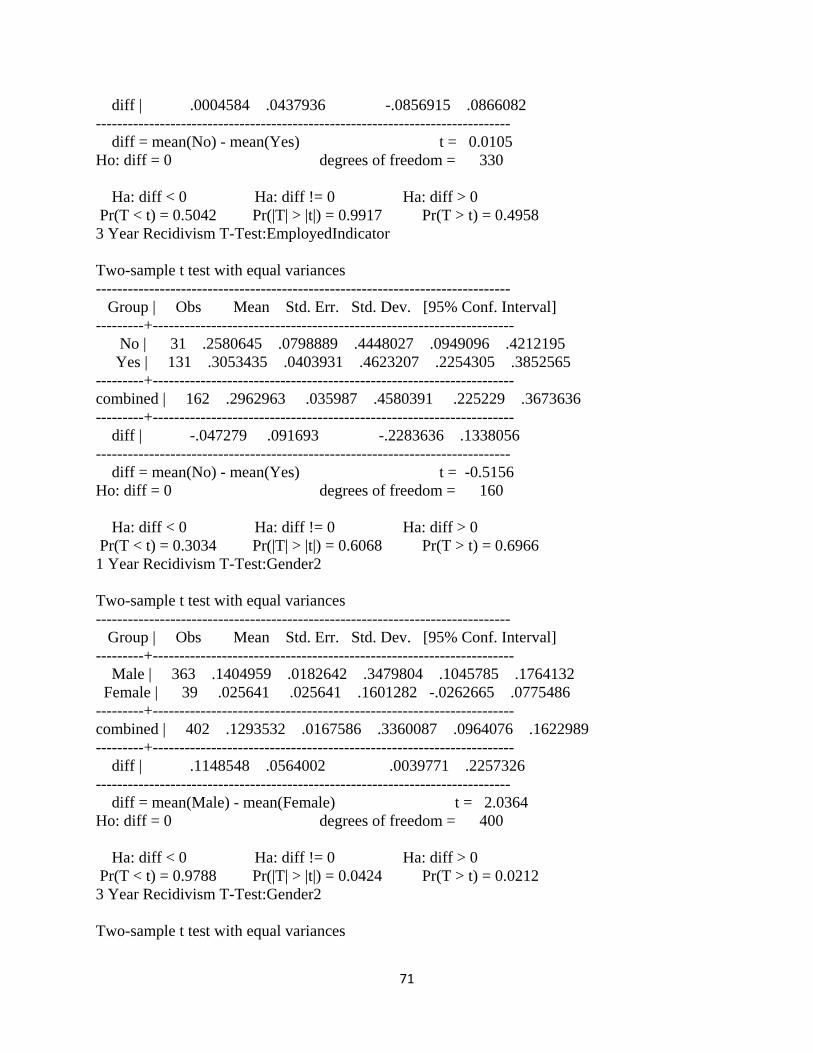
71
diff | .0004584 .0437936 -.0856915 .0866082 ------------------------------------------------------------------------------ diff = mean(No) - mean(Yes) t = 0.0105 Ho: diff = 0 degrees of freedom = 330 Ha: diff < 0 Ha: diff != 0 Ha: diff > 0 Pr(T < t) = 0.5042 Pr(|T| > |t|) = 0.9917 Pr(T > t) = 0.4958 3 Year Recidivism T-Test:EmployedIndicator Two-sample t test with equal variances ------------------------------------------------------------------------------ Group | Obs Mean Std. Err. Std. Dev. [95% Conf. Interval] ---------+-------------------------------------------------------------------- No | 31 .2580645 .0798889 .4448027 .0949096 .4212195 Yes | 131 .3053435 .0403931 .4623207 .2254305 .3852565 ---------+-------------------------------------------------------------------- combined | 162 .2962963 .035987 .4580391 .225229 .3673636 ---------+-------------------------------------------------------------------- diff | -.047279 .091693 -.2283636 .1338056 ------------------------------------------------------------------------------ diff = mean(No) - mean(Yes) t = -0.5156 Ho: diff = 0 degrees of freedom = 160 Ha: diff < 0 Ha: diff != 0 Ha: diff > 0 Pr(T < t) = 0.3034 Pr(|T| > |t|) = 0.6068 Pr(T > t) = 0.6966 1 Year Recidivism T-Test:Gender2 Two-sample t test with equal variances ------------------------------------------------------------------------------ Group | Obs Mean Std. Err. Std. Dev. [95% Conf. Interval] ---------+-------------------------------------------------------------------- Male | 363 .1404959 .0182642 .3479804 .1045785 .1764132 Female | 39 .025641 .025641 .1601282 -.0262665 .0775486 ---------+-------------------------------------------------------------------- combined | 402 .1293532 .0167586 .3360087 .0964076 .1622989 ---------+-------------------------------------------------------------------- diff | .1148548 .0564002 .0039771 .2257326 ------------------------------------------------------------------------------ diff = mean(Male) - mean(Female) t = 2.0364 Ho: diff = 0 degrees of freedom = 400 Ha: diff < 0 Ha: diff != 0 Ha: diff > 0 Pr(T < t) = 0.9788 Pr(|T| > |t|) = 0.0424 Pr(T > t) = 0.0212 3 Year Recidivism T-Test:Gender2 Two-sample t test with equal variances

72
------------------------------------------------------------------------------ Group | Obs Mean Std. Err. Std. Dev. [95% Conf. Interval] ---------+-------------------------------------------------------------------- Male | 186 .311828 .0340581 .4644903 .2446358 .3790201 Female | 22 .0454545 .0454545 .2132007 -.0490734 .1399824 ---------+-------------------------------------------------------------------- combined | 208 .2836538 .0313307 .4518583 .2218856 .3454221 ---------+-------------------------------------------------------------------- diff | .2663734 .100421 .0683886 .4643582 ------------------------------------------------------------------------------ diff = mean(Male) - mean(Female) t = 2.6526 Ho: diff = 0 degrees of freedom = 206 Ha: diff < 0 Ha: diff != 0 Ha: diff > 0 Pr(T < t) = 0.9957 Pr(|T| > |t|) = 0.0086 Pr(T > t) = 0.0043 1 Year Recidivism T-Test:InsideWorker2 Two-sample t test with equal variances ------------------------------------------------------------------------------ Group | Obs Mean Std. Err. Std. Dev. [95% Conf. Interval] ---------+-------------------------------------------------------------------- No | 308 .1266234 .0189797 .3330918 .0892767 .1639701 Yes | 24 .1666667 .0777087 .3806935 .0059139 .3274194 ---------+-------------------------------------------------------------------- combined | 332 .1295181 .0184557 .3362793 .0932128 .1658234 ---------+-------------------------------------------------------------------- diff | -.0400433 .0713408 -.1803834 .1002968 ------------------------------------------------------------------------------ diff = mean(No) - mean(Yes) t = -0.5613 Ho: diff = 0 degrees of freedom = 330 Ha: diff < 0 Ha: diff != 0 Ha: diff > 0 Pr(T < t) = 0.2875 Pr(|T| > |t|) = 0.5750 Pr(T > t) = 0.7125 3 Year Recidivism T-Test:InsideWorker2 Two-sample t test with equal variances ------------------------------------------------------------------------------ Group | Obs Mean Std. Err. Std. Dev. [95% Conf. Interval] ---------+-------------------------------------------------------------------- No | 155 .3032258 .0370398 .4611419 .2300541 .3763975 Yes | 8 .125 .125 .3535534 -.170578 .420578 ---------+-------------------------------------------------------------------- combined | 163 .2944785 .0358117 .4572126 .2237607 .3651964 ---------+-------------------------------------------------------------------- diff | .1782258 .1656879 -.148976 .5054276 ------------------------------------------------------------------------------

73
diff = mean(No) - mean(Yes) t = 1.0757 Ho: diff = 0 degrees of freedom = 161 Ha: diff < 0 Ha: diff != 0 Ha: diff > 0 Pr(T < t) = 0.8582 Pr(|T| > |t|) = 0.2837 Pr(T > t) = 0.1418 1 Year Recidivism T-Test:LSIRIndicator1v2 Two-sample t test with equal variances ------------------------------------------------------------------------------ Group | Obs Mean Std. Err. Std. Dev. [95% Conf. Interval] ---------+-------------------------------------------------------------------- 0 | 19 0 0 0 0 0 1 | 132 .0681818 .0220224 .2530179 .0246163 .1117473 ---------+-------------------------------------------------------------------- combined | 151 .0596026 .0193305 .237537 .0214074 .0977979 ---------+-------------------------------------------------------------------- diff | -.0681818 .0582128 -.1832111 .0468474 ------------------------------------------------------------------------------ diff = mean(0) - mean(1) t = -1.1713 Ho: diff = 0 degrees of freedom = 149 Ha: diff < 0 Ha: diff != 0 Ha: diff > 0 Pr(T < t) = 0.1217 Pr(|T| > |t|) = 0.2434 Pr(T > t) = 0.8783 3 Year Recidivism T-Test:LSIRIndicator1v2 Two-sample t test with equal variances ------------------------------------------------------------------------------ Group | Obs Mean Std. Err. Std. Dev. [95% Conf. Interval] ---------+-------------------------------------------------------------------- 0 | 13 .1538462 .1041543 .3755338 -.0730867 .380779 1 | 67 .1791045 .0471982 .3863337 .0848703 .2733387 ---------+-------------------------------------------------------------------- combined | 80 .175 .0427496 .3823644 .089909 .260091 ---------+-------------------------------------------------------------------- diff | -.0252583 .1165867 -.2573646 .2068479 ------------------------------------------------------------------------------ diff = mean(0) - mean(1) t = -0.2166 Ho: diff = 0 degrees of freedom = 78 Ha: diff < 0 Ha: diff != 0 Ha: diff > 0 Pr(T < t) = 0.4145 Pr(|T| > |t|) = 0.8290 Pr(T > t) = 0.5855 1 Year Recidivism T-Test:LSIRIndicator2v3 Two-sample t test with equal variances ------------------------------------------------------------------------------ Group | Obs Mean Std. Err. Std. Dev. [95% Conf. Interval]

74
---------+-------------------------------------------------------------------- 0 | 132 .0681818 .0220224 .2530179 .0246163 .1117473 1 | 168 .1607143 .02842 .3683652 .1046055 .216823 ---------+-------------------------------------------------------------------- combined | 300 .12 .018793 .3255045 .0830167 .1569833 ---------+-------------------------------------------------------------------- diff | -.0925325 .0375423 -.1664141 -.0186508 ------------------------------------------------------------------------------ diff = mean(0) - mean(1) t = -2.4648 Ho: diff = 0 degrees of freedom = 298 Ha: diff < 0 Ha: diff != 0 Ha: diff > 0 Pr(T < t) = 0.0071 Pr(|T| > |t|) = 0.0143 Pr(T > t) = 0.9929 3 Year Recidivism T-Test:LSIRIndicator2v3 Two-sample t test with equal variances ------------------------------------------------------------------------------ Group | Obs Mean Std. Err. Std. Dev. [95% Conf. Interval] ---------+-------------------------------------------------------------------- 0 | 67 .1791045 .0471982 .3863337 .0848703 .2733387 1 | 79 .3544304 .0541614 .4813969 .2466034 .4622574 ---------+-------------------------------------------------------------------- combined | 146 .2739726 .0370379 .4475304 .2007687 .3471765 ---------+-------------------------------------------------------------------- diff | -.1753259 .0731398 -.3198923 -.0307595 ------------------------------------------------------------------------------ diff = mean(0) - mean(1) t = -2.3971 Ho: diff = 0 degrees of freedom = 144 Ha: diff < 0 Ha: diff != 0 Ha: diff > 0 Pr(T < t) = 0.0089 Pr(|T| > |t|) = 0.0178 Pr(T > t) = 0.9911 1 Year Recidivism T-Test:LSIRIndicator3v4 Two-sample t test with equal variances ------------------------------------------------------------------------------ Group | Obs Mean Std. Err. Std. Dev. [95% Conf. Interval] ---------+-------------------------------------------------------------------- 0 | 168 .1607143 .02842 .3683652 .1046055 .216823 1 | 22 .3636364 .1049728 .492366 .1453335 .5819392 ---------+-------------------------------------------------------------------- combined | 190 .1842105 .0281978 .38868 .1285877 .2398334 ---------+-------------------------------------------------------------------- diff | -.2029221 .0871116 -.3747639 -.0310802 ------------------------------------------------------------------------------ diff = mean(0) - mean(1) t = -2.3294 Ho: diff = 0 degrees of freedom = 188

75
Ha: diff < 0 Ha: diff != 0 Ha: diff > 0 Pr(T < t) = 0.0104 Pr(|T| > |t|) = 0.0209 Pr(T > t) = 0.9896 3 Year Recidivism T-Test:LSIRIndicator3v4 Two-sample t test with equal variances ------------------------------------------------------------------------------ Group | Obs Mean Std. Err. Std. Dev. [95% Conf. Interval] ---------+-------------------------------------------------------------------- 0 | 79 .3544304 .0541614 .4813969 .2466034 .4622574 1 | 12 .6666667 .1421338 .492366 .3538323 .9795011 ---------+-------------------------------------------------------------------- combined | 91 .3956044 .051543 .4916892 .2932052 .4980036 ---------+-------------------------------------------------------------------- diff | -.3122363 .149573 -.6094347 -.0150379 ------------------------------------------------------------------------------ diff = mean(0) - mean(1) t = -2.0875 Ho: diff = 0 degrees of freedom = 89 Ha: diff < 0 Ha: diff != 0 Ha: diff > 0 Pr(T < t) = 0.0198 Pr(|T| > |t|) = 0.0397 Pr(T > t) = 0.9802 1 Year Recidivism T-Test:Race_BlackToHisp Two-sample t test with equal variances ------------------------------------------------------------------------------ Group | Obs Mean Std. Err. Std. Dev. [95% Conf. Interval] ---------+-------------------------------------------------------------------- Hispanic | 30 .1 .0557086 .3051286 -.0139369 .2139369 Black | 180 .1555556 .0270895 .3634445 .1020996 .2090115 ---------+-------------------------------------------------------------------- combined | 210 .147619 .0245366 .3555696 .099248 .1959901 ---------+-------------------------------------------------------------------- diff | -.0555556 .070182 -.1939147 .0828036 ------------------------------------------------------------------------------ diff = mean(Hispanic) - mean(Black) t = -0.7916 Ho: diff = 0 degrees of freedom = 208 Ha: diff < 0 Ha: diff != 0 Ha: diff > 0 Pr(T < t) = 0.2147 Pr(|T| > |t|) = 0.4295 Pr(T > t) = 0.7853 3 Year Recidivism T-Test:Race_BlackToHisp Two-sample t test with equal variances ------------------------------------------------------------------------------ Group | Obs Mean Std. Err. Std. Dev. [95% Conf. Interval] ---------+-------------------------------------------------------------------- Hispanic | 10 .3 .1527525 .4830459 -.0455502 .6455502

76
Black | 82 .3414634 .0526889 .4771187 .2366289 .4462979 ---------+-------------------------------------------------------------------- combined | 92 .3369565 .0495493 .4752599 .238533 .4353801 ---------+-------------------------------------------------------------------- diff | -.0414634 .1600131 -.3593574 .2764306 ------------------------------------------------------------------------------ diff = mean(Hispanic) - mean(Black) t = -0.2591 Ho: diff = 0 degrees of freedom = 90 Ha: diff < 0 Ha: diff != 0 Ha: diff > 0 Pr(T < t) = 0.3981 Pr(|T| > |t|) = 0.7961 Pr(T > t) = 0.6019 1 Year Recidivism T-Test:Race_BlackToWhite Two-sample t test with equal variances ------------------------------------------------------------------------------ Group | Obs Mean Std. Err. Std. Dev. [95% Conf. Interval] ---------+-------------------------------------------------------------------- White | 114 .0877193 .0266117 .2841352 .0349967 .1404419 Black | 180 .1555556 .0270895 .3634445 .1020996 .2090115 ---------+-------------------------------------------------------------------- combined | 294 .1292517 .0195989 .3360503 .0906793 .1678241 ---------+-------------------------------------------------------------------- diff | -.0678363 .0400972 -.1467523 .0110798 ------------------------------------------------------------------------------ diff = mean(White) - mean(Black) t = -1.6918 Ho: diff = 0 degrees of freedom = 292 Ha: diff < 0 Ha: diff != 0 Ha: diff > 0 Pr(T < t) = 0.0459 Pr(|T| > |t|) = 0.0918 Pr(T > t) = 0.9541 3 Year Recidivism T-Test:Race_BlackToWhite Two-sample t test with equal variances ------------------------------------------------------------------------------ Group | Obs Mean Std. Err. Std. Dev. [95% Conf. Interval] ---------+-------------------------------------------------------------------- White | 68 .2352941 .0518221 .4273363 .1318567 .3387315 Black | 82 .3414634 .0526889 .4771187 .2366289 .4462979 ---------+-------------------------------------------------------------------- combined | 150 .2933333 .0372988 .4568152 .2196304 .3670363 ---------+-------------------------------------------------------------------- diff | -.1061693 .0746691 -.2537246 .041386 ------------------------------------------------------------------------------ diff = mean(White) - mean(Black) t = -1.4219 Ho: diff = 0 degrees of freedom = 148 Ha: diff < 0 Ha: diff != 0 Ha: diff > 0
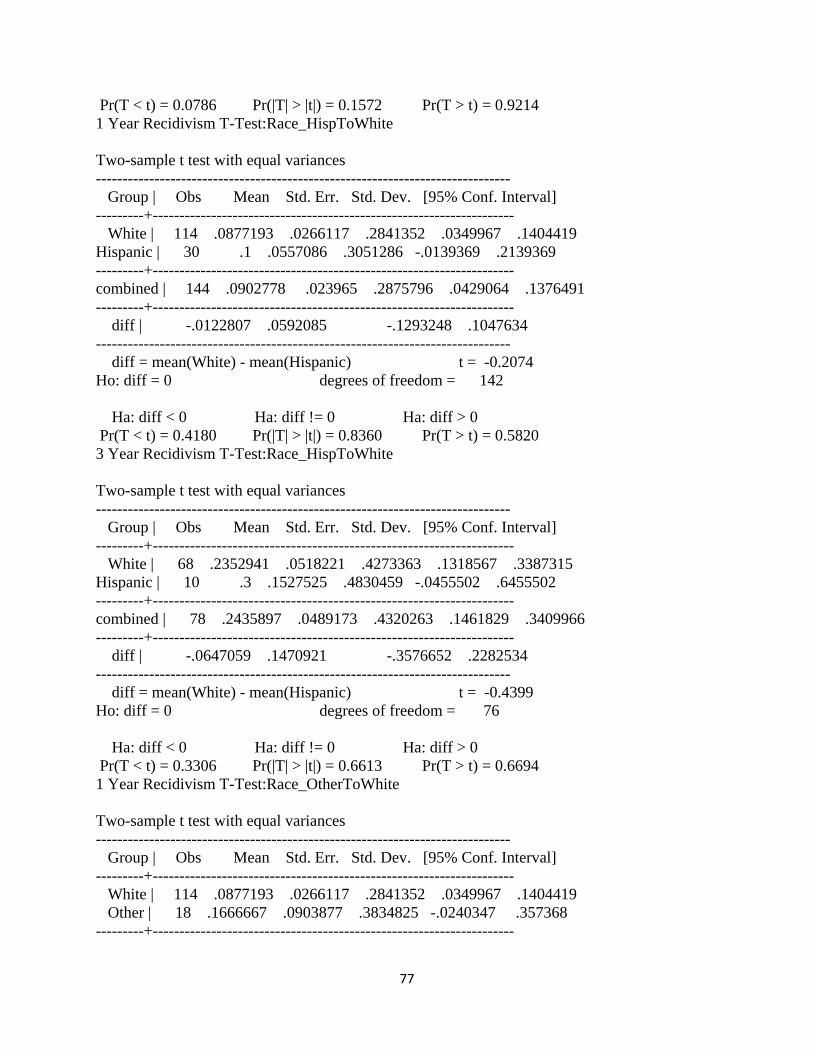
77
Pr(T < t) = 0.0786 Pr(|T| > |t|) = 0.1572 Pr(T > t) = 0.9214 1 Year Recidivism T-Test:Race_HispToWhite Two-sample t test with equal variances ------------------------------------------------------------------------------ Group | Obs Mean Std. Err. Std. Dev. [95% Conf. Interval] ---------+-------------------------------------------------------------------- White | 114 .0877193 .0266117 .2841352 .0349967 .1404419 Hispanic | 30 .1 .0557086 .3051286 -.0139369 .2139369 ---------+-------------------------------------------------------------------- combined | 144 .0902778 .023965 .2875796 .0429064 .1376491 ---------+-------------------------------------------------------------------- diff | -.0122807 .0592085 -.1293248 .1047634 ------------------------------------------------------------------------------ diff = mean(White) - mean(Hispanic) t = -0.2074 Ho: diff = 0 degrees of freedom = 142 Ha: diff < 0 Ha: diff != 0 Ha: diff > 0 Pr(T < t) = 0.4180 Pr(|T| > |t|) = 0.8360 Pr(T > t) = 0.5820 3 Year Recidivism T-Test:Race_HispToWhite Two-sample t test with equal variances ------------------------------------------------------------------------------ Group | Obs Mean Std. Err. Std. Dev. [95% Conf. Interval] ---------+-------------------------------------------------------------------- White | 68 .2352941 .0518221 .4273363 .1318567 .3387315 Hispanic | 10 .3 .1527525 .4830459 -.0455502 .6455502 ---------+-------------------------------------------------------------------- combined | 78 .2435897 .0489173 .4320263 .1461829 .3409966 ---------+-------------------------------------------------------------------- diff | -.0647059 .1470921 -.3576652 .2282534 ------------------------------------------------------------------------------ diff = mean(White) - mean(Hispanic) t = -0.4399 Ho: diff = 0 degrees of freedom = 76 Ha: diff < 0 Ha: diff != 0 Ha: diff > 0 Pr(T < t) = 0.3306 Pr(|T| > |t|) = 0.6613 Pr(T > t) = 0.6694 1 Year Recidivism T-Test:Race_OtherToWhite Two-sample t test with equal variances ------------------------------------------------------------------------------ Group | Obs Mean Std. Err. Std. Dev. [95% Conf. Interval] ---------+-------------------------------------------------------------------- White | 114 .0877193 .0266117 .2841352 .0349967 .1404419 Other | 18 .1666667 .0903877 .3834825 -.0240347 .357368 ---------+--------------------------------------------------------------------

78
combined | 132 .0984848 .0260337 .2991042 .046984 .1499857 ---------+-------------------------------------------------------------------- diff | -.0789474 .0758372 -.2289821 .0710874 ------------------------------------------------------------------------------ diff = mean(White) - mean(Other) t = -1.0410 Ho: diff = 0 degrees of freedom = 130 Ha: diff < 0 Ha: diff != 0 Ha: diff > 0 Pr(T < t) = 0.1499 Pr(|T| > |t|) = 0.2998 Pr(T > t) = 0.8501 3 Year Recidivism T-Test:Race_OtherToWhite Two-sample t test with equal variances ------------------------------------------------------------------------------ Group | Obs Mean Std. Err. Std. Dev. [95% Conf. Interval] ---------+-------------------------------------------------------------------- White | 68 .2352941 .0518221 .4273363 .1318567 .3387315 Other | 12 .25 .1305582 .452267 -.0373568 .5373568 ---------+-------------------------------------------------------------------- combined | 80 .2375 .0478782 .428236 .1422007 .3327993 ---------+-------------------------------------------------------------------- diff | -.0147059 .1349324 -.2833357 .2539239 ------------------------------------------------------------------------------ diff = mean(White) - mean(Other) t = -0.1090 Ho: diff = 0 degrees of freedom = 78 Ha: diff < 0 Ha: diff != 0 Ha: diff > 0 Pr(T < t) = 0.4567 Pr(|T| > |t|) = 0.9135 Pr(T > t) = 0.5433 1 Year Recidivism T-Test:Race_OtherToBlack Two-sample t test with equal variances ------------------------------------------------------------------------------ Group | Obs Mean Std. Err. Std. Dev. [95% Conf. Interval] ---------+-------------------------------------------------------------------- Black | 180 .1555556 .0270895 .3634445 .1020996 .2090115 Other | 18 .1666667 .0903877 .3834825 -.0240347 .357368 ---------+-------------------------------------------------------------------- combined | 198 .1565657 .0258905 .3643119 .1055075 .2076238 ---------+-------------------------------------------------------------------- diff | -.0111111 .0902863 -.1891684 .1669462 ------------------------------------------------------------------------------ diff = mean(Black) - mean(Other) t = -0.1231 Ho: diff = 0 degrees of freedom = 196 Ha: diff < 0 Ha: diff != 0 Ha: diff > 0 Pr(T < t) = 0.4511 Pr(|T| > |t|) = 0.9022 Pr(T > t) = 0.5489 3 Year Recidivism T-Test:Race_OtherToBlack

79
Two-sample t test with equal variances ------------------------------------------------------------------------------ Group | Obs Mean Std. Err. Std. Dev. [95% Conf. Interval] ---------+-------------------------------------------------------------------- Black | 82 .3414634 .0526889 .4771187 .2366289 .4462979 Other | 12 .25 .1305582 .452267 -.0373568 .5373568 ---------+-------------------------------------------------------------------- combined | 94 .3297872 .0487508 .4726566 .2329778 .4265967 ---------+-------------------------------------------------------------------- diff | .0914634 .1465691 -.1996355 .3825623 ------------------------------------------------------------------------------ diff = mean(Black) - mean(Other) t = 0.6240 Ho: diff = 0 degrees of freedom = 92 Ha: diff < 0 Ha: diff != 0 Ha: diff > 0 Pr(T < t) = 0.7329 Pr(|T| > |t|) = 0.5342 Pr(T > t) = 0.2671 1 Year Recidivism T-Test:Race_OtherToHisp Two-sample t test with equal variances ------------------------------------------------------------------------------ Group | Obs Mean Std. Err. Std. Dev. [95% Conf. Interval] ---------+-------------------------------------------------------------------- Hispanic | 30 .1 .0557086 .3051286 -.0139369 .2139369 Other | 18 .1666667 .0903877 .3834825 -.0240347 .357368 ---------+-------------------------------------------------------------------- combined | 48 .125 .0482403 .3342187 .027953 .222047 ---------+-------------------------------------------------------------------- diff | -.0666667 .1002413 -.2684418 .1351085 ------------------------------------------------------------------------------ diff = mean(Hispanic) - mean(Other) t = -0.6651 Ho: diff = 0 degrees of freedom = 46 Ha: diff < 0 Ha: diff != 0 Ha: diff > 0 Pr(T < t) = 0.2547 Pr(|T| > |t|) = 0.5093 Pr(T > t) = 0.7453 3 Year Recidivism T-Test:Race_OtherToHisp Two-sample t test with equal variances ------------------------------------------------------------------------------ Group | Obs Mean Std. Err. Std. Dev. [95% Conf. Interval] ---------+-------------------------------------------------------------------- Hispanic | 10 .3 .1527525 .4830459 -.0455502 .6455502 Other | 12 .25 .1305582 .452267 -.0373568 .5373568 ---------+-------------------------------------------------------------------- combined | 22 .2727273 .0971859 .4558423 .0706181 .4748364 ---------+--------------------------------------------------------------------

80
diff | .05 .1996873 -.3665403 .4665403 ------------------------------------------------------------------------------ diff = mean(Hispanic) - mean(Other) t = 0.2504 Ho: diff = 0 degrees of freedom = 20 Ha: diff < 0 Ha: diff != 0 Ha: diff > 0 Pr(T < t) = 0.5976 Pr(|T| > |t|) = 0.8048 Pr(T > t) = 0.4024 1 Year Recidivism T-Test:ReleaseLocation_NoHsng Two-sample t test with equal variances ------------------------------------------------------------------------------ Group | Obs Mean Std. Err. Std. Dev. [95% Conf. Interval] ---------+-------------------------------------------------------------------- Housing | 300 .1366667 .0198648 .344069 .0975741 .1757593 No Housi | 4 0 0 0 0 0 ---------+-------------------------------------------------------------------- combined | 304 .1348684 .0196234 .3421462 .096253 .1734839 ---------+-------------------------------------------------------------------- diff | .1366667 .1723153 -.2024241 .4757574 ------------------------------------------------------------------------------ diff = mean(Housing) - mean(No Housi) t = 0.7931 Ho: diff = 0 degrees of freedom = 302 Ha: diff < 0 Ha: diff != 0 Ha: diff > 0 Pr(T < t) = 0.7858 Pr(|T| > |t|) = 0.4283 Pr(T > t) = 0.2142 3 Year Recidivism T-Test:ReleaseLocation_NoHsng Two-sample t test with equal variances ------------------------------------------------------------------------------ Group | Obs Mean Std. Err. Std. Dev. [95% Conf. Interval] ---------+-------------------------------------------------------------------- Housing | 137 .2919708 .0389875 .4563375 .2148706 .369071 No Housi | 1 0 . . . . ---------+-------------------------------------------------------------------- combined | 138 .2898551 . . . . ---------+-------------------------------------------------------------------- diff | .2919708 . . . ------------------------------------------------------------------------------ diff = mean(Housing) - mean(No Housi) t = . Ho: diff = 0 degrees of freedom = 136 Ha: diff < 0 Ha: diff != 0 Ha: diff > 0 Pr(T < t) = . Pr(|T| > |t|) = . Pr(T > t) = . 1 Year Recidivism T-Test:ReleaseState_MDnotMD Two-sample t test with equal variances

81
------------------------------------------------------------------------------ Group | Obs Mean Std. Err. Std. Dev. [95% Conf. Interval] ---------+-------------------------------------------------------------------- not MD | 140 .1214286 .0277039 .3277975 .066653 .1762042 MD | 263 .1330798 .0209843 .3403086 .0917605 .1743992 ---------+-------------------------------------------------------------------- combined | 403 .1290323 .01672 .3356523 .0961626 .1619019 ---------+-------------------------------------------------------------------- diff | -.0116513 .0351546 -.0807615 .057459 ------------------------------------------------------------------------------ diff = mean(not MD) - mean(MD) t = -0.3314 Ho: diff = 0 degrees of freedom = 401 Ha: diff < 0 Ha: diff != 0 Ha: diff > 0 Pr(T < t) = 0.3702 Pr(|T| > |t|) = 0.7405 Pr(T > t) = 0.6298 3 Year Recidivism T-Test:ReleaseState_MDnotMD Two-sample t test with equal variances ------------------------------------------------------------------------------ Group | Obs Mean Std. Err. Std. Dev. [95% Conf. Interval] ---------+-------------------------------------------------------------------- not MD | 91 .2637363 .0464494 .4430993 .1714564 .3560162 MD | 118 .2966102 .0422278 .458711 .2129803 .3802401 ---------+-------------------------------------------------------------------- combined | 209 .2822967 .03121 .4511976 .2207682 .3438251 ---------+-------------------------------------------------------------------- diff | -.0328739 .0630579 -.157192 .0914442 ------------------------------------------------------------------------------ diff = mean(not MD) - mean(MD) t = -0.5213 Ho: diff = 0 degrees of freedom = 207 Ha: diff < 0 Ha: diff != 0 Ha: diff > 0 Pr(T < t) = 0.3013 Pr(|T| > |t|) = 0.6027 Pr(T > t) = 0.6987 1 Year Recidivism T-Test:ReleaseState_DCnotMD Two-sample t test with equal variances ------------------------------------------------------------------------------ Group | Obs Mean Std. Err. Std. Dev. [95% Conf. Interval] ---------+-------------------------------------------------------------------- MD | 263 .1330798 .0209843 .3403086 .0917605 .1743992 DC | 18 .1666667 .0903877 .3834825 -.0240347 .357368 ---------+-------------------------------------------------------------------- combined | 281 .1352313 .0204366 .3425806 .0950023 .1754603 ---------+-------------------------------------------------------------------- diff | -.0335868 .0835898 -.1981335 .1309599 ------------------------------------------------------------------------------

82
diff = mean(MD) - mean(DC) t = -0.4018 Ho: diff = 0 degrees of freedom = 279 Ha: diff < 0 Ha: diff != 0 Ha: diff > 0 Pr(T < t) = 0.3441 Pr(|T| > |t|) = 0.6881 Pr(T > t) = 0.6559 3 Year Recidivism T-Test:ReleaseState_DCnotMD Two-sample t test with equal variances ------------------------------------------------------------------------------ Group | Obs Mean Std. Err. Std. Dev. [95% Conf. Interval] ---------+-------------------------------------------------------------------- MD | 118 .2966102 .0422278 .458711 .2129803 .3802401 DC | 5 .2 .2 .4472136 -.355289 .755289 ---------+-------------------------------------------------------------------- combined | 123 .2926829 .0411932 .456855 .2111368 .374229 ---------+-------------------------------------------------------------------- diff | .0966102 .2092715 -.3176979 .5109183 ------------------------------------------------------------------------------ diff = mean(MD) - mean(DC) t = 0.4616 Ho: diff = 0 degrees of freedom = 121 Ha: diff < 0 Ha: diff != 0 Ha: diff > 0 Pr(T < t) = 0.6774 Pr(|T| > |t|) = 0.6452 Pr(T > t) = 0.3226 1 Year Recidivism T-Test:ReleaseState_VAnotMD Two-sample t test with equal variances ------------------------------------------------------------------------------ Group | Obs Mean Std. Err. Std. Dev. [95% Conf. Interval] ---------+-------------------------------------------------------------------- MD | 263 .1330798 .0209843 .3403086 .0917605 .1743992 VA | 15 .1333333 .0908514 .3518658 -.0615234 .3281901 ---------+-------------------------------------------------------------------- combined | 278 .1330935 .0204091 .3402884 .0929168 .1732702 ---------+-------------------------------------------------------------------- diff | -.0002535 .0904964 -.1784044 .1778974 ------------------------------------------------------------------------------ diff = mean(MD) - mean(VA) t = -0.0028 Ho: diff = 0 degrees of freedom = 276 Ha: diff < 0 Ha: diff != 0 Ha: diff > 0 Pr(T < t) = 0.4989 Pr(|T| > |t|) = 0.9978 Pr(T > t) = 0.5011 3 Year Recidivism T-Test:ReleaseState_VAnotMD Two-sample t test with equal variances ------------------------------------------------------------------------------ Group | Obs Mean Std. Err. Std. Dev. [95% Conf. Interval]

83
---------+-------------------------------------------------------------------- MD | 118 .2966102 .0422278 .458711 .2129803 .3802401 VA | 12 .1666667 .1123666 .3892495 -.0806506 .413984 ---------+-------------------------------------------------------------------- combined | 130 .2846154 .0397287 .4529766 .2060112 .3632195 ---------+-------------------------------------------------------------------- diff | .1299435 .1373067 -.1417412 .4016282 ------------------------------------------------------------------------------ diff = mean(MD) - mean(VA) t = 0.9464 Ho: diff = 0 degrees of freedom = 128 Ha: diff < 0 Ha: diff != 0 Ha: diff > 0 Pr(T < t) = 0.8271 Pr(|T| > |t|) = 0.3457 Pr(T > t) = 0.1729 1 Year Recidivism T-Test:GBnotSS Two-sample t test with equal variances ------------------------------------------------------------------------------ Group | Obs Mean Std. Err. Std. Dev. [95% Conf. Interval] ---------+-------------------------------------------------------------------- 0 | 57 .1578947 .0487274 .3678836 .0602821 .2555074 1 | 44 .1590909 .055778 .3699894 .0466038 .271578 ---------+-------------------------------------------------------------------- combined | 101 .1584158 .036513 .3669516 .085975 .2308567 ---------+-------------------------------------------------------------------- diff | -.0011962 .0740095 -.1480471 .1456547 ------------------------------------------------------------------------------ diff = mean(0) - mean(1) t = -0.0162 Ho: diff = 0 degrees of freedom = 99 Ha: diff < 0 Ha: diff != 0 Ha: diff > 0 Pr(T < t) = 0.4936 Pr(|T| > |t|) = 0.9871 Pr(T > t) = 0.5064 3 Year Recidivism T-Test:GBnotSS Two-sample t test with equal variances ------------------------------------------------------------------------------ Group | Obs Mean Std. Err. Std. Dev. [95% Conf. Interval] ---------+-------------------------------------------------------------------- 0 | 25 .28 .0916515 .4582576 .0908406 .4691594 1 | 19 .3684211 .1136972 .4955946 .1295521 .60729 ---------+-------------------------------------------------------------------- combined | 44 .3181818 .0710293 .4711553 .1749375 .4614261 ---------+-------------------------------------------------------------------- diff | -.0884211 .1444524 -.3799377 .2030956 ------------------------------------------------------------------------------ diff = mean(0) - mean(1) t = -0.6121 Ho: diff = 0 degrees of freedom = 42

84
Ha: diff < 0 Ha: diff != 0 Ha: diff > 0 Pr(T < t) = 0.2719 Pr(|T| > |t|) = 0.5438 Pr(T > t) = 0.7281 1 Year Recidivism T-Test:GTnotSS Two-sample t test with equal variances ------------------------------------------------------------------------------ Group | Obs Mean Std. Err. Std. Dev. [95% Conf. Interval] ---------+-------------------------------------------------------------------- 0 | 57 .1578947 .0487274 .3678836 .0602821 .2555074 1 | 20 .05 .05 .2236068 -.0546512 .1546512 ---------+-------------------------------------------------------------------- combined | 77 .1298701 .0385603 .3383649 .0530707 .2066695 ---------+-------------------------------------------------------------------- diff | .1078947 .0876415 -.0666962 .2824856 ------------------------------------------------------------------------------ diff = mean(0) - mean(1) t = 1.2311 Ho: diff = 0 degrees of freedom = 75 Ha: diff < 0 Ha: diff != 0 Ha: diff > 0 Pr(T < t) = 0.8889 Pr(|T| > |t|) = 0.2221 Pr(T > t) = 0.1111 3 Year Recidivism T-Test:GTnotSS Two-sample t test with equal variances ------------------------------------------------------------------------------ Group | Obs Mean Std. Err. Std. Dev. [95% Conf. Interval] ---------+-------------------------------------------------------------------- 0 | 25 .28 .0916515 .4582576 .0908406 .4691594 1 | 7 .1428571 .1428571 .3779645 -.2067017 .492416 ---------+-------------------------------------------------------------------- combined | 32 .25 .0777714 .4399413 .0913842 .4086158 ---------+-------------------------------------------------------------------- diff | .1371429 .1895903 -.2500522 .5243379 ------------------------------------------------------------------------------ diff = mean(0) - mean(1) t = 0.7234 Ho: diff = 0 degrees of freedom = 30 Ha: diff < 0 Ha: diff != 0 Ha: diff > 0 Pr(T < t) = 0.7625 Pr(|T| > |t|) = 0.4751 Pr(T > t) = 0.2375 1 Year Recidivism T-Test:System_FedToLocal Two-sample t test with equal variances ------------------------------------------------------------------------------ Group | Obs Mean Std. Err. Std. Dev. [95% Conf. Interval] ---------+-------------------------------------------------------------------- Local | 285 .1403509 .0206115 .3479617 .0997802 .1809215

85
Fed | 86 .0465116 .0228417 .2118255 .0010961 .0919271 ---------+-------------------------------------------------------------------- combined | 371 .1185984 .0168084 .323752 .0855465 .1516503 ---------+-------------------------------------------------------------------- diff | .0938392 .0395852 .0159983 .1716802 ------------------------------------------------------------------------------ diff = mean(Local) - mean(Fed) t = 2.3706 Ho: diff = 0 degrees of freedom = 369 Ha: diff < 0 Ha: diff != 0 Ha: diff > 0 Pr(T < t) = 0.9909 Pr(|T| > |t|) = 0.0183 Pr(T > t) = 0.0091 3 Year Recidivism T-Test:System_FedToLocal Two-sample t test with equal variances ------------------------------------------------------------------------------ Group | Obs Mean Std. Err. Std. Dev. [95% Conf. Interval] ---------+-------------------------------------------------------------------- Local | 139 .3021583 .0390891 .4608542 .2248672 .3794494 Fed | 50 .14 .0495696 .3505098 .0403862 .2396138 ---------+-------------------------------------------------------------------- combined | 189 .2592593 .0319611 .4393921 .1962108 .3223077 ---------+-------------------------------------------------------------------- diff | .1621583 .0716779 .020757 .3035596 ------------------------------------------------------------------------------ diff = mean(Local) - mean(Fed) t = 2.2623 Ho: diff = 0 degrees of freedom = 187 Ha: diff < 0 Ha: diff != 0 Ha: diff > 0 Pr(T < t) = 0.9876 Pr(|T| > |t|) = 0.0248 Pr(T > t) = 0.0124 1 Year Recidivism T-Test:System_DrugToLocal Two-sample t test with equal variances ------------------------------------------------------------------------------ Group | Obs Mean Std. Err. Std. Dev. [95% Conf. Interval] ---------+-------------------------------------------------------------------- Local | 285 .1403509 .0206115 .3479617 .0997802 .1809215 Drug | 30 .2666667 .0821176 .4497764 .0987174 .434616 ---------+-------------------------------------------------------------------- combined | 315 .152381 .0202815 .3599616 .1124761 .1922858 ---------+-------------------------------------------------------------------- diff | -.1263158 .0688331 -.2617498 .0091182 ------------------------------------------------------------------------------ diff = mean(Local) - mean(Drug) t = -1.8351 Ho: diff = 0 degrees of freedom = 313 Ha: diff < 0 Ha: diff != 0 Ha: diff > 0
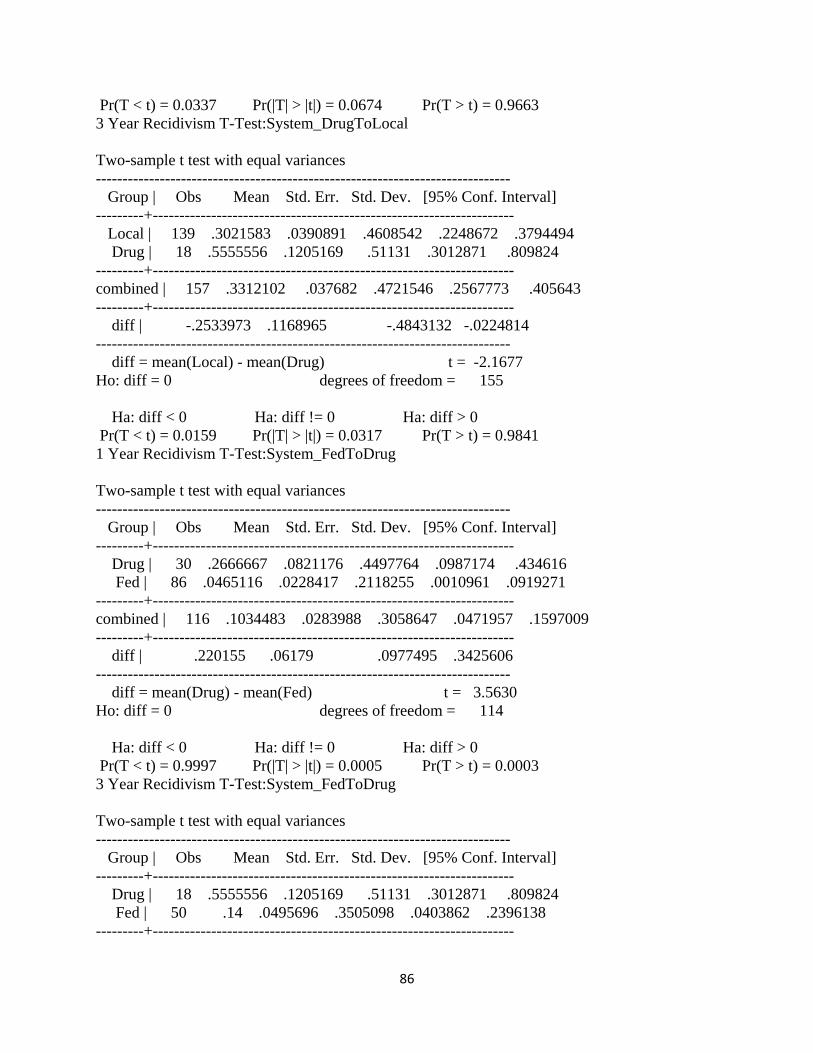
86
Pr(T < t) = 0.0337 Pr(|T| > |t|) = 0.0674 Pr(T > t) = 0.9663 3 Year Recidivism T-Test:System_DrugToLocal Two-sample t test with equal variances ------------------------------------------------------------------------------ Group | Obs Mean Std. Err. Std. Dev. [95% Conf. Interval] ---------+-------------------------------------------------------------------- Local | 139 .3021583 .0390891 .4608542 .2248672 .3794494 Drug | 18 .5555556 .1205169 .51131 .3012871 .809824 ---------+-------------------------------------------------------------------- combined | 157 .3312102 .037682 .4721546 .2567773 .405643 ---------+-------------------------------------------------------------------- diff | -.2533973 .1168965 -.4843132 -.0224814 ------------------------------------------------------------------------------ diff = mean(Local) - mean(Drug) t = -2.1677 Ho: diff = 0 degrees of freedom = 155 Ha: diff < 0 Ha: diff != 0 Ha: diff > 0 Pr(T < t) = 0.0159 Pr(|T| > |t|) = 0.0317 Pr(T > t) = 0.9841 1 Year Recidivism T-Test:System_FedToDrug Two-sample t test with equal variances ------------------------------------------------------------------------------ Group | Obs Mean Std. Err. Std. Dev. [95% Conf. Interval] ---------+-------------------------------------------------------------------- Drug | 30 .2666667 .0821176 .4497764 .0987174 .434616 Fed | 86 .0465116 .0228417 .2118255 .0010961 .0919271 ---------+-------------------------------------------------------------------- combined | 116 .1034483 .0283988 .3058647 .0471957 .1597009 ---------+-------------------------------------------------------------------- diff | .220155 .06179 .0977495 .3425606 ------------------------------------------------------------------------------ diff = mean(Drug) - mean(Fed) t = 3.5630 Ho: diff = 0 degrees of freedom = 114 Ha: diff < 0 Ha: diff != 0 Ha: diff > 0 Pr(T < t) = 0.9997 Pr(|T| > |t|) = 0.0005 Pr(T > t) = 0.0003 3 Year Recidivism T-Test:System_FedToDrug Two-sample t test with equal variances ------------------------------------------------------------------------------ Group | Obs Mean Std. Err. Std. Dev. [95% Conf. Interval] ---------+-------------------------------------------------------------------- Drug | 18 .5555556 .1205169 .51131 .3012871 .809824 Fed | 50 .14 .0495696 .3505098 .0403862 .2396138 ---------+--------------------------------------------------------------------

87
combined | 68 .25 .0529009 .4362322 .1444093 .3555907 ---------+-------------------------------------------------------------------- diff | .4155556 .1094509 .1970298 .6340813 ------------------------------------------------------------------------------ diff = mean(Drug) - mean(Fed) t = 3.7967 Ho: diff = 0 degrees of freedom = 66 Ha: diff < 0 Ha: diff != 0 Ha: diff > 0 Pr(T < t) = 0.9998 Pr(|T| > |t|) = 0.0003 Pr(T > t) = 0.0002 . . ttest Recidivism_1Yr, by (ReleaseYear_2012v2010) Two-sample t test with equal variances ------------------------------------------------------------------------------ Group | Obs Mean Std. Err. Std. Dev. [95% Conf. Interval] ---------+-------------------------------------------------------------------- 2010 | 186 .172043 .0277483 .3784365 .1172992 .2267868 2012 | 162 .0925926 .0228442 .2907595 .0474796 .1377055 ---------+-------------------------------------------------------------------- combined | 348 .1350575 .018348 .3422771 .0989702 .1711447 ---------+-------------------------------------------------------------------- diff | .0794504 .0365882 .0074872 .1514137 ------------------------------------------------------------------------------ diff = mean(2010) - mean(2012) t = 2.1715 Ho: diff = 0 degrees of freedom = 346 Ha: diff < 0 Ha: diff != 0 Ha: diff > 0 Pr(T < t) = 0.9847 Pr(|T| > |t|) = 0.0306 Pr(T > t) = 0.0153

88
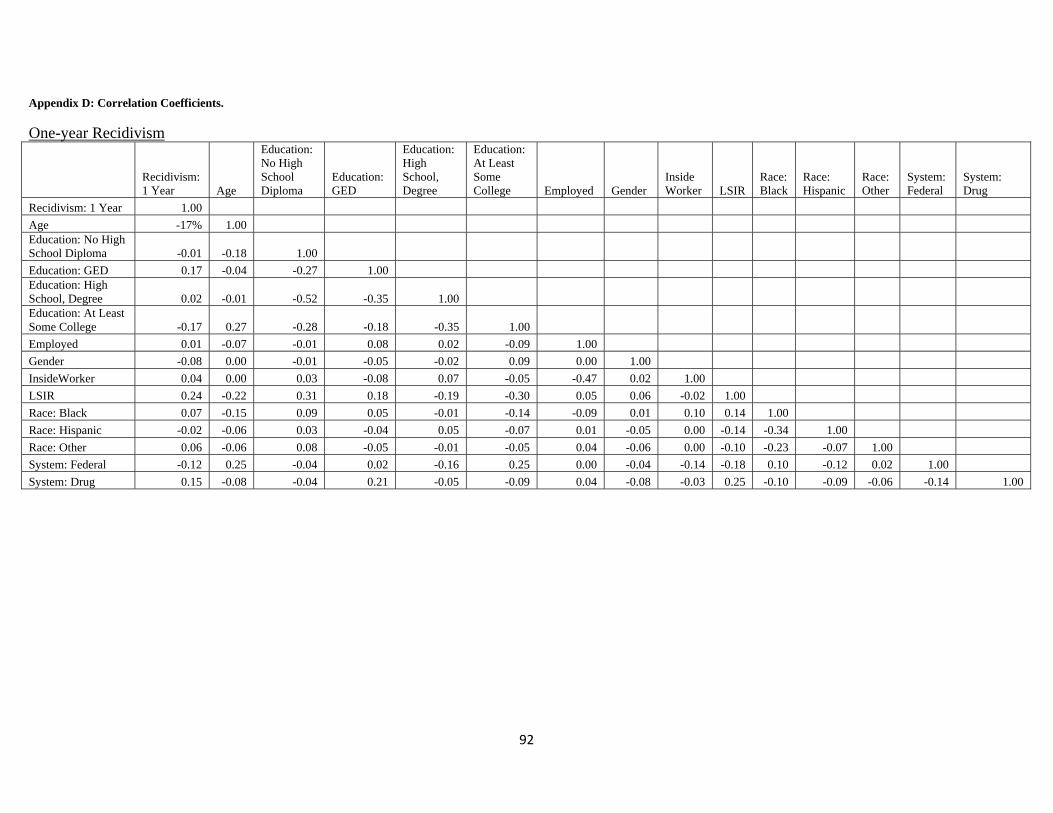
92
Appendix D: Correlation Coefficients. One-year Recidivism
Recidivism: 1 Year Age
Education: No High School Diploma
Education: GED
Education: High School, Degree
Education: At Least Some College Employed Gender
Inside Worker LSIR
Race: Black
Race: Hispanic
Race: Other
System: Federal
System: Drug
Recidivism: 1 Year 1.00 Age -17% 1.00 Education: No High School Diploma -0.01 -0.18 1.00 Education: GED 0.17 -0.04 -0.27 1.00 Education: High School, Degree 0.02 -0.01 -0.52 -0.35 1.00 Education: At Least Some College -0.17 0.27 -0.28 -0.18 -0.35 1.00 Employed 0.01 -0.07 -0.01 0.08 0.02 -0.09 1.00 Gender -0.08 0.00 -0.01 -0.05 -0.02 0.09 0.00 1.00 InsideWorker 0.04 0.00 0.03 -0.08 0.07 -0.05 -0.47 0.02 1.00 LSIR 0.24 -0.22 0.31 0.18 -0.19 -0.30 0.05 0.06 -0.02 1.00 Race: Black 0.07 -0.15 0.09 0.05 -0.01 -0.14 -0.09 0.01 0.10 0.14 1.00 Race: Hispanic -0.02 -0.06 0.03 -0.04 0.05 -0.07 0.01 -0.05 0.00 -0.14 -0.34 1.00 Race: Other 0.06 -0.06 0.08 -0.05 -0.01 -0.05 0.04 -0.06 0.00 -0.10 -0.23 -0.07 1.00 System: Federal -0.12 0.25 -0.04 0.02 -0.16 0.25 0.00 -0.04 -0.14 -0.18 0.10 -0.12 0.02 1.00 System: Drug 0.15 -0.08 -0.04 0.21 -0.05 -0.09 0.04 -0.08 -0.03 0.25 -0.10 -0.09 -0.06 -0.14 1.00

93
Three-year Recidivism
Recidivism: 3 Year Age
Education: No High School Diploma
Education: GED
Education: High School, Degree
Education: At Least Some College Employed Gender InsideWorker LSIR
Race: Black
Race: Hispanic
Race: Other
System: Federal
System: Drug
Recidivism: 3 Year 1.00
Age -0.26 1.00 Education: No High School Diploma -0.04 -0.21 1.00
Education: GED 0.22 0.00 -0.32 1.00 Education: High School, Degree 0.01 -0.07 -0.49 -0.44 1.00 Education: At Least Some College -0.24 0.38 -0.22 -0.19 -0.30 1.00
Employed 0.09 -0.13 0.00 0.10 0.01 -0.14 1.00 Gender -0.12 0.02 -0.16 -0.07 0.09 0.18 0.05 1.00
InsideWorker -0.13 0.07 0.06 -0.01 0.00 -0.07 -0.33 -0.06 1.00
LSIR 0.36 -0.25 0.22 0.27 -0.22 -0.32 0.16 -0.05 -0.04 1.00
Race: Black 0.10 -0.11 0.10 0.08 -0.02 -0.19 0.03 -0.07 0.06 0.14 1.00
Race: Hispanic -0.03 -0.11 -0.08 -0.06 0.12 0.01 0.04 0.05 -0.05 -0.17 -0.24 1.00
Race: Other 0.02 -0.18 0.26 -0.07 -0.10 -0.10 0.05 -0.08 0.10 -0.11 -0.26 -0.07 1.00
System: Federal -0.21 0.32 0.01 0.01 -0.22 0.30 -0.07 0.01 -0.10 -0.25 0.23 -0.13 -0.06 1.00
System: Drug 0.23 -0.05 -0.08 0.13 -0.01 -0.04 0.02 -0.09 -0.07 0.28 -0.16 -0.09 -0.09 -0.17 1.00

92
Appendix E: Regressions One-year Recidivism
Recidivism_1Yr Coefficient Std. Err. z P>z [95% Conf. Interval]
Age -0.0381354 0.0189129 -2.02 0.044 -0.0752041 -0.0010667Gender -1.522081 1.046447 -1.45 0.146 -3.57308 0.5289172LSIR 0.1035948 0.0282595 3.67 0 0.0482072 0.1589824Drug Court 0.7005991 0.5289864 1.32 0.185 -0.3361952 1.737393Federal -0.5974953 0.5825391 -1.03 0.305 -1.739251 0.5442604Black 0.6525801 0.4364426 1.5 0.135 -0.2028317 1.507992Hispanic 0.2830359 0.7508433 0.38 0.706 -1.18859 1.754662Other Race 1.474726 0.8025698 1.84 0.066 -0.0982816 3.047734Constant -3.962628 1.086859 -3.65 0 -6.092832 -1.832423 Three-year Recidivism
Recidivism_1Yr Coefficient Std. Err. z P>z
[95% Conf. Interval]
Age -0.0365328 0.0204224 -1.79 0.074 -0.0765599 0.0034943 0.003494Gender -1.655654 1.089707 -1.52 0.129 -3.791441 0.4801315 0.480132LSIR 0.089063 0.0299596 2.97 0.003 0.0303434 0.1477827 0.147783Drug Court 1.040991 0.6306208 1.65 0.099 -0.1950032 2.276985 2.276985Federal -0.3615462 0.5569054 -0.65 0.516 -1.453061 0.7299684 0.729968Black 0.4496594 0.4524963 0.99 0.320 -0.4372172 1.336536 1.336536Hispanic 0.5510136 0.8542834 0.65 0.519 -1.123351 2.225378 2.225378Other Race 0.4186349 0.833271 0.5 0.615 -1.214546 2.051816 2.051816Constant -2.265379 1.14091 -1.99 0.047 -4.501522 -0.0292354 -0.02924 Appendix F: Methodology for Adding Future Months to Analysis Follow these same steps for each new month of recidivism information:
1. Add the worksheet for the new month to my modified Excel workbook.

95
2. Change worksheet names to the year followed by the two-digit month without a space between. For example, “July 2010” becomes “2010-06”. This naming convention makes sorting by release month easier.
3. Insert a new row C to be identical to row B (original variable names) with the following exceptions: Rename each variable that is attached to a specific charge X as “ChargeX[Variable]. For example, “Conviction” for Charge 2 should be renamed “Charge2Conviction”. Remove the spaces between words for “Charge X Time From Release to Char”. Rename “Release Location (City, State, Zip Code)” “ReleaseLocation”.
4. Modify data entries causing import problems. Highlight the following changes in red. These changes were already made:
Variable Changed this To this Month
Charge 1Case # 9/6/2013 blank 2012-10Charge 1Date of Conviction 0D00296590 blank 2012-10charge 1 date issued N/A blank 2010-09 Charge 1Time from Release to Charge N/A blank 2010-09 Charge 2Time from Release to Charge N/A blank 2010-09
charge 2 date issued N/A blank 2010-082010-092010-10
charge 2 date issued Plea 10/1/2013 10/1/2013 2012-11
Charge 2 Time from Release to Charge N/A blank
2010-08 2010-09 2010-10 2010-11
Charge 2 Time from Release to Charge ` blank 2010-11
Charge2DateofConviction N/A blank 2010-09 2010-11
Charge 3Date Issued N/A blank 2010-08
Charge 3Time from Release to Charge N/A blank 2010-08
2010-09
Charge 4 Time from Release to Charge N/A blank 2010-08 2010-10 2010-09
Charge 4 Date Issued N/A blank 2010-10 2010-09
5. In the DataCombination Do-File, replace all references to “"C:\Users\Sarah BS\Dropbox\_Project Course\Data\” with the pathway to the folder in which you saved the Excel workbook.
6. Add the new month of data by using the following code. The underlined portions should be modified for the month in question.

96
import excel "C:\Users\Sarah BS\Dropbox\_Project course\data\OriginalData_recd3.13.xls", sheet("2010-09") cellrange(A3:CF37) firstrow gen ReleaseMonth="2010-09" foreach var of varlist _all { capture assert missing(`var') if !_rc { drop `var' } }
7. Run the DataCombination file 8. Run the DataAnalysis Do-Files.