masscot a methodology to modernize irrigation … a methodology to modernize irrigation services and...
TRANSCRIPT
MASSCOT: a methodology to modernize irrigation services and operation in canal systemsApplications to two systems in Nepal Terai: Sunsari Morang Irrigation System and Narayani Irrigation System
MASSCOT: a methodology to modernize irrigation services and operation in canal systemsApplications to two systems in Nepal Terai: Sunsari Morang Irrigation System and Narayani Irrigation System
by
Daniel Renault FAO Land and Water Development Division
and
Robina WahajFAO Consultant
FOOD AND AGRICULTURE ORGANIZATION OF THE UNITED NATIONSRome, 2006

The designations employed and the presentation of material in this information product do not imply the expression of any opinion whatsoever on the part of the Food and Agriculture Organization of the United Nations concerning the legal or development status of any country, territory, city or area or of its authorities, or concerning the delimitation of its frontiers or boundaries.
All rights reserved. Reproduction and dissemination of material in this information product for educational or other non-commercial purposes are authorized without any prior written permission from the copyright holders provided the source is fullyacknowledged. Reproduction of material in this information product for resale or other commercial purposes is prohibited without written permission of the copyright holders. Applications for such permission should be addressed to: Chief Publishing Management ServiceInformation Division FAO Viale delle Terme di Caracalla, 00100 Rome, Italy or by e-mail to: [email protected]
© FAO 2006

iii
Contents
Preface vii
List of acronyms viii
1. Introduction to MASSCOT 1
2. MASSCOT, RAP and benchmarking 3
3. The ten steps of the MASSCOT procedure 5
4. MASSCOT in the Sunsari Morang Irrigation Project 7Project description 7
MASSCOT steps in the SMIS 8
5. MASSCOT in the Narayani Irrigation System 31Project description 31
MASSCOT steps in the NIS 33
6. Concluding remarks 49
References 51
Annex1. Proposed interventions along the CMC for controlled discharge 53

iv
List of figures
1. MASSCOT, RAP and benchmarking in a tridimensional space of impact, process and solution 3
2. Layout of the SMIS 9
3. Layout of SMIS Stage I (a) and Stages II and III (b) 13
4. Measured sensitivity indicators along CMC 14
5. Hydraulic flexibility (proportionality indicator) along the CMC of the SMIS 14
6. Variation in water level at CR4 – Jhumka Minor, monsoon season 16
7. Variation in water level at CR4 – Jhumka Minor, winter season 17
8. Identification of the demand for canal operation with recycling facilities 24
9. Management setup in the SMIS 25
10. Proposed partition of the SMIS into seven second-level units 26
11. General layout of the Narayani Irrigation System 32
12. Stage I – Canal layout in the NIS 36
13. Daily flows into the Nepal Eastern Canal at the intake regulator, 2002 38
14. Block boundaries and streams/rivers in the NIS 40
15. NIS management units, levels 1 and 2 43
16. Dividing the NIS into practical management units 44

v
List of tables
1. The ten steps of the MASSCOT procedure 5
2. Internal indicators: variation from RAP in the SMIS 10
3. Variation in discharge experienced at the offtake along the CMC for a water-level change of 0.1 m in the main canal 15
4. Operation rules: tolerance and frequency of adjustment as a function of sensitivity at the cross-regulators of the SMIS 15
5. Recorded precision of control along the CMC and related discharge variation 17
6. Indicators of services in the SMIS, as ranked during the RAP 19
7. Variation in supply recorded per unit area for the whole SMIS and for two secondaries 19
8. Variation in supply recorded for tertiary unit areas (head-middle and tail) for three secondaries 20
9. Crop-oriented service considerations 21
10. Demand for canal operation as a function of tolerance on H 23
11. Existing institutional management setup 25
12. Example of list of parameters that define the procedures to be carried out by operators at regulators 27
13. Internal performance indicators for the Narayani Irrigation System, Nepal 33
14. Crop-oriented service considerations in the NIS 41
15. Current cost of operation and maintenance of the NIS 42
16. MASSCOT steps completed, not done or incomplete in the SMIS, and time required for their completion 49
17. MASSCOT steps completed, not done or incomplete in the NIS, and time required for their completion 50
vi
List of Plates
1. Example of a divider equipped with a tinkered gate. 13
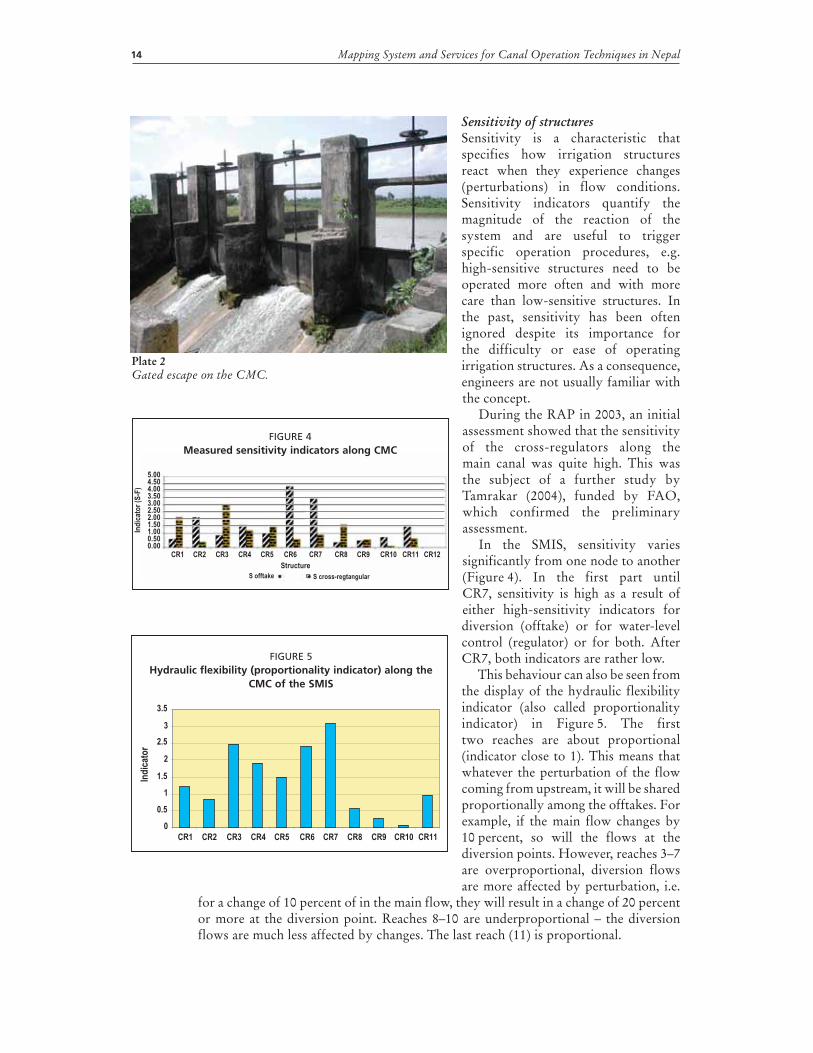
2. Gated escape on the CMC. 14
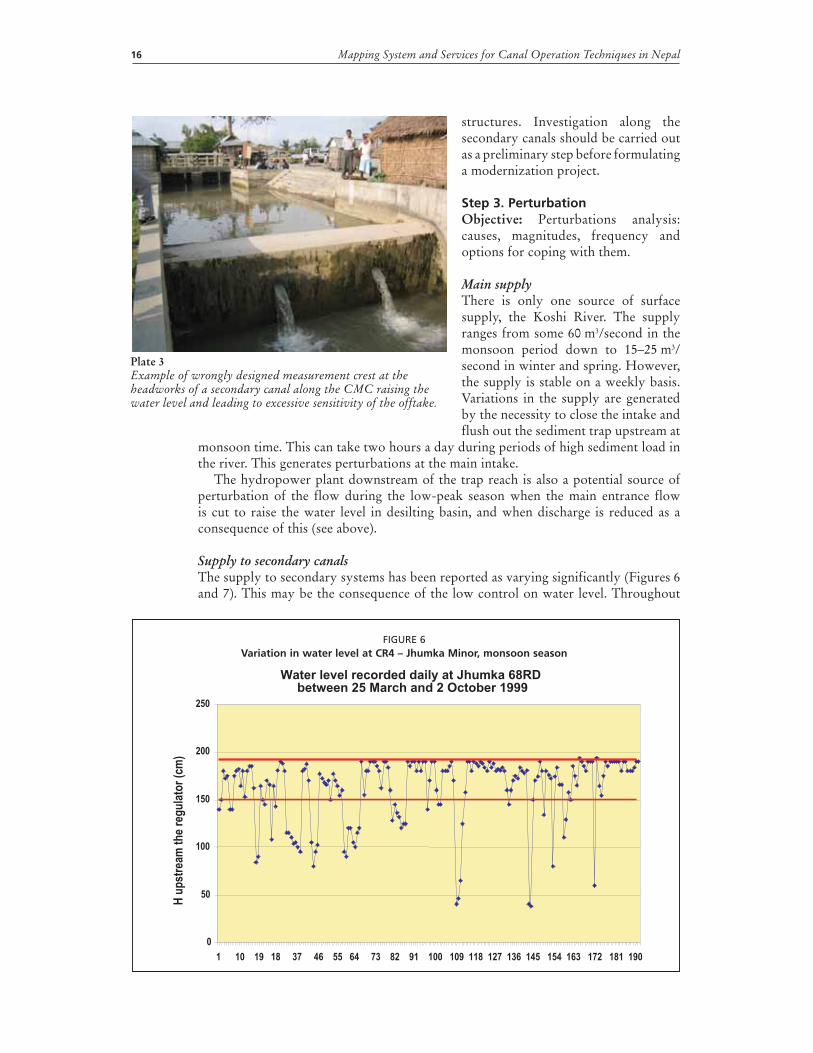
3. Example of wrongly designed measurement crest at the headworks of a secondary canal along the CMC raising the water level and leading to excessive sensitivity of the offtake. 16
4. Chanda Mona recycling facility downstream of secondary canals 1 and 2 along the Sunsari River, serving two minors (right-bank one shown in Plate 4.B). 19
5. Example of a farmer in the SMIS, poorly supplied by canal water, using groundwater exclusively to irrigate. 23
6. Offtake at CR7 head of the Biratnagar secondary canal (left) and at CR6 head of Ramgunj Disty (right). 28
7. Example of leaks at the Bhudi aqueduct. 28
8. A few of the remaining original tertiary canal control gates in the NIS. 36
9. Ungated reduced diameter pipe outlet in the NIS. 36
10. Reduced diameter gated outlet in the NIS. 37
11. Abandoned Parshall Flume (A) and flashboard slots built into the centre of an existing Parshall flume as part of Stage III rehabilitation (B). 37
12. Farmers pumping out of the NEC to areas outside the project. 39
13. Farmers use shallow and deep tubewells in many areas not served effectively by the canal system. 41

vii
Preface
The methodology called Mapping System and Services for Canal Operation Techniques (MASSCOT) has been developed by the Land and Water Division (AGLW) of FAO on the basis of its experience in modernizing irrigation management in Asia. MASSCOT complements tools such as the rapid appraisal procedure (RAP) and benchmarking to enable a complete sequence of diagnosis of external and internal performance indicators and the design of practical solutions for improved management and operation of the system.
The case studies presented here have been developed through a set of training workshops in Nepal with engineers and managers from the Department of Irrigation (DOI) and the Department of Agriculture (DOA) in 2003 and 2006.
The contributions of the working group sessions at these workshops (RAP–MASSCOT) have been largely included in this report, together with the outcomes of the benchmarking exercise organized by the World Bank in the Sunsari Morang Irrigation System in 2004). However, the conclusions and proposals have been further developed and refined by Daniel Renault and Robina Wahaj (FAO AGLW). Thus, although largely inspired by the outcomes of these workshops, the report does not strictly reflect them.
This report has several purposes:produce food for thought for decision-makers in Nepal before engaging in investment plans, particularly on how to ensure that diagnosis and solutions are investigated properly in modernization projects;suggest some specific strategies to managers of the two systems investigated on how they should undertake modernization of the management;introduce the MASSCOT exercise to a large audience through real-case application.

viii
List of acronyms
BSC Branch secondary canal
CMC Chatra Main Canal
DCA Developed command area
DOA Department of Agriculture
DOI Department of Irrigation
GCA Gross command area
IWRM Integrated water resources management
M&E Monitoring and evaluation
MASSCOT Mapping System and Services for Canal Operation Techniques
MSC Main secondary canal
NDCA Non-developed command area
NEC Narayani Eastern Canal
NIS Narayani Irrigation System
O&M Operation and maintenance
RAP Rapid appraisal procedure
SMIS Sunsari Morang Irrigation System
WUA Water users association
WUC Water Users Committee
WUCC Water Users Coordination Committee
WUCCC Water Users Central Coordination Committee
WUG Water users group
WUO Water users organization
Exchange rate used in this report: US$1 = Nr72
1
Chapter 1
Introduction to MASSCOT
The methodology called Mapping System and Services for Canal Operation Techniques (MASSCOT) is a methodology to evaluate current processes and performance and develop a project for modernizing canal operation.
Canal operation is a complex task involving key activities of irrigation management, which implies numerous aspects that have to be combined in a consistent manner. These aspects are:
services to users;cost of providing the services;performance monitoring and evaluation (M&E);constraints and opportunities in water resources management;constraints and opportunities of the physical systems.
MASSCOT is a methodology developed by FAO to aggregate all the pieces into a consistent framework aiming at improving canal operation procedures on the basis of its own experience in modernization programmes in Asia between 1998 and 2006.
MASSCOT aims to organize project development into a stepwise revolving frame including:
mapping the system characteristics, the water context and all factors affecting management;delimiting manageable subunits;defining the strategy for service and operation for each unit;aggregating and consolidating the canal operation strategy at the main system level.
MASSCOT is an iterative process based on ten successive steps, but more than one round is required in order to determine a consistent plan. Some steps need to be rediscussed and refined several times before achieving a satisfactory level of consistency.

3
Chapter 2
MASSCOT, RAP and benchmarking
How does MASSCOT position itself with regard to tools and methodologies developed in the last decade on irrigation management modernization, i.e. the rapid appraisal procedure (RAP) and benchmarking (FAO/World Bank, 2002; IPTRID/World Bank, 2000)?
The generic response is that MASSCOT, while integrating RAP and to a lesser extent benchmarking, complements these two by focusing on improving the process of canal operation for a service-oriented management.
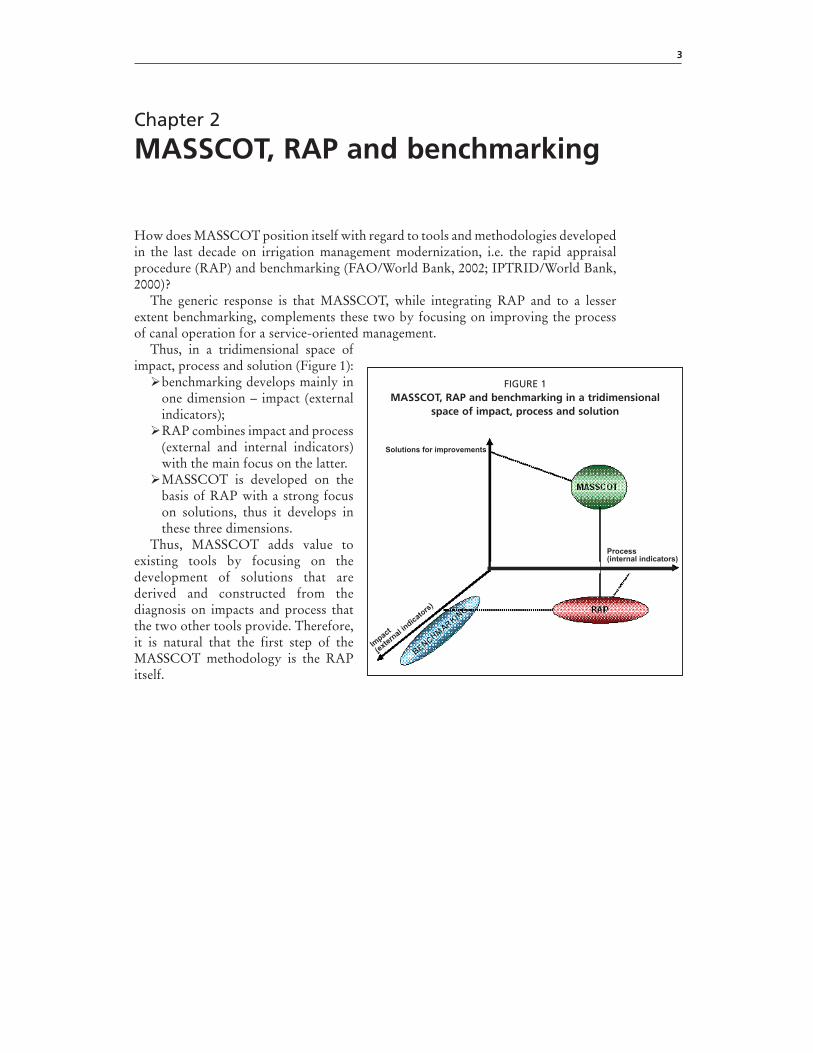
Thus, in a tridimensional space of impact, process and solution (Figure 1):
benchmarking develops mainly in one dimension – impact (external indicators);RAP combines impact and process (external and internal indicators) with the main focus on the latter.MASSCOT is developed on the basis of RAP with a strong focus on solutions, thus it develops in these three dimensions.
Thus, MASSCOT adds value to existing tools by focusing on the development of solutions that are derived and constructed from the diagnosis on impacts and process that the two other tools provide. Therefore, it is natural that the first step of the MASSCOT methodology is the RAP itself.
Solutions for improvements
Process(internal indicators)
Impact
(exte
rnal i
ndicato
rs)
FIGURE 1MASSCOT, RAP and benchmarking in a tridimensional
space of impact, process and solution


5
Chapter 3
The ten steps of the MASSCOT procedure
The first steps of MASSCOT (Table 1) are conducted for the entire command area with the goal of identifying homogeneous managerial units for which specific options for canal operation are further sought by running the various steps of MASSCOT for each unit taken separately. Then, aggregation and consolidation is carried out at the main system level. Thus, the methodology uses a back-and-forth or up-and-down approach for the different nested levels of management.
TABLE 1The ten steps of the MASSCOT procedure
Step 1. Initial assessment
1. Rapid diagnosis Initial rapid diagnosis and assessment through RAP or others: the primary objective of the rapid diagnosis is to obtain an initial sense of what and where the problems are, how they should be prioritized, etc. The second objective is to start mobilizing the energy of the actors (managers and users) for modernization. The third is to generate a baseline assessment, against which progresses will have to be measured.
2. Mapping the system characteristics
2. System capacity and sensitivity The assessment of the physical capacity of irrigation structures to perform their function of transport, control, measurement, etc.
Assessing the sensitivity of irrigation structures (offtakes and regulators), identification of singular points. Mapping the sensitivity.
3. Perturbation Perturbations analysis: causes, magnitudes, frequency and options for coping with them.
4. Mapping water networks & water balance / accounting
This entails assessing the hierarchical structure and the main features of the irrigation and drainage networks, on the basis of which partition of the system into subsystems will be made. Water accounting should be undertaken, considering both surface water and groundwater, and mapping the opportunities and constraints related to them.
3. Mapping the service, the cost for operation and the demand per subcommand area
5. Service to users Mapping options for services to users: farmers and crops – other users
6. Mapping the cost of operation Mapping the cost for current operation techniques and services, disaggregating the elements, entering into the cost, and costing options for various level of services with current techniques and with improved techniques.
7. Mapping the demand for canal operation
Assessing means, opportunity and demand for canal operation.
A spatial analysis of the entire command area, with preliminary identification of subcommand areas (management, service, etc.).
4. Design subunits for service & operation
8. Partitioning in management units The irrigation system and the command area should be divided into subunits (subsystems and/or subcommand areas) that are held homogeneous and/or separate from one another by a singular point or a particular borderline.
9. Canal operation improvements Identifying improvement options for each management unit for: (i) water management; (ii) water control; and (iii) canal operation (service and cost-effectiveness).
5. Aggregating and consolidating
10. Aggregating and consolidating management
Aggregation of options at the system level, and consistency check.
Consolidating and designing an overall cost-effective information system for supporting operation and service-oriented management.
A plan for modernization, and M&E Modernization strategy and progressive capacity development.
Select/choose/decide/phase options for improvements.
Plan for M&E of the project inputs and outcomes.


7
Chapter 4
MASSCOT in the Sunsari Morang Irrigation Project
The followings is the result of two training workshops undertaken by the DOI together with the technical and some financial support of FAO-AGLW: a RAP in May 2003 (FAO, 2003a); and the MASSCOT exercise in April 2006 (FAO, 2006).
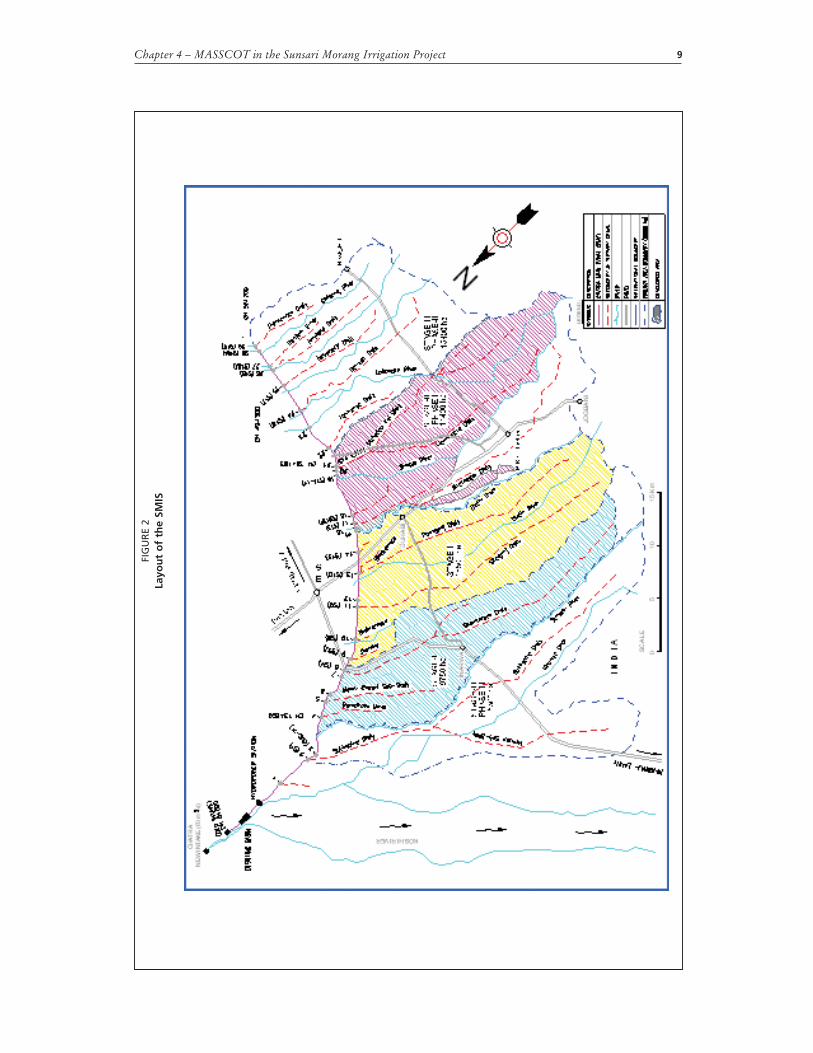
PROJECT DESCRIPTIONThe Sunsari Morang Irrigation System (SMIS) is the largest irrigation system in Nepal. It is located in the southeast Terai, a continuation of the Gangetic Plain. Figure 2 shows the layout map of the SMIS project. The gross command area is larger than 100 000 ha with an irrigated area of about 64 000 ha. The SMIS is served by the Chatra Main Canal (CMC), which extends 53 km from the left bank of the Koshi River in a general west to east direction, with a maximum capacity of 60 m3/second. A series of secondary, subsecondary and tertiary canals run in a southerly direction nearly 20 km to the Indian border.
The system was originally designed for supplementary irrigation of paddy rice during the monsoon (kharif) season based on 80-percent rainfall. Thus, the capacity of the system is not sufficient by itself to supply the full crop water requirement to the entire command area. Similar to large irrigation projects in India, the SMIS was intended to provide drought protection and deliver irrigation water to as many farmers as possible. However, demand for irrigation water on a year-round basis has increased steadily. After construction of the system in the mid-1970s, farmers began to utilize the system for a winter wheat crop in the rabi season (November–March). Later, spring season (April–July) crops were introduced in portions of the system.
The main physical constraint identified by the project authorities is that the flow of the Koshi River in winter and spring can only provide 15–20 m3/second (as low as 5 m3/second). In low flow conditions with the present control strategy and infrastructure, it is very difficult to supply irrigation water equitably to different areas of the project. Tail-enders have historically suffered the most from water shortages, with many receiving no irrigation water from the canal system. As a result, there is rising conjunctive use of groundwater and low-lift pumping of drainage water, particularly towards the tail-end of the system. There is also evidence of a lack of coordination between farmers and project engineers, indicated by the planting of rainfed crops adjacent to the canals while spring paddy may be at the end of watercourses.
The major crops grown in the command area include paddy rice in the summer; wheat, pulses (lentil, soybean, other local varieties), oilseed crops (mustard, linseed), and vegetables (cauliflower, cabbage, eggplant, onion, tomato, etc.) in the winter; and jute, mung bean, maize, vegetables and spring paddy in the spring. The average landholding per household is 0.5–1 ha, which is significantly less than when the project was initially designed and constructed. The mean annual rainfall is 1 840 mm, most of which occurs between May and September.
Since the completion of the original project, consisting of service down to 200-ha blocks in the mid-1970s, the SMIS has evolved through three phased implementations of command area development initiatives and construction activities (Stages I, II and III – described below). Phase 1 of Stage III has just been completed. Phases 2 and 3 of Stage III are planned for the areas in the project that are now termed “undeveloped”.

Mapping System and Services for Canal Operation Techniques in Nepal8
About 60 percent (40 000 ha) of the total command area has already been rehabilitated through the construction of unlined canals down to the watercourse level as part of Stages I, II and III. The major innovation in Stages II and III was the introduction of proportional flow dividers at the tertiary canal level and below.
MASSCOT STEPS IN THE SMIS
Step 1. Rapid diagnosisObjective: Initial rapid diagnosis and assessment through RAP or others: the primary objective of the rapid diagnosis is to obtain an initial sense of what and where the problems are, how they should be prioritized, etc. The second objective is to start mobilizing the energy of the actors (managers and users) for modernization. The third is to generate a baseline assessment, against which progresses will have to be measured.
The RAP was conducted in May 2003 (FAO, 2003a). the following sections are from the executive summary.
The SMIS has received substantial technical and financial assistance from various donor agencies for infrastructure rehabilitation and institutional development. It is an unlined, manually operated canal system served by the Koshi River located in the eastern Terai region. The main crops are paddy rice in the monsoon/summer season and wheat in the winter season. The system is characterized by:
seasonally variable water supplies, which may reduce by 50–70 percent in the winter and spring (15–60 m3/second);lack of accurate flow control into secondary and tertiary canals associated with severe water-level fluctuations in the CMC; rotation schedules that are not enforced rigorously; institutionally weak water users associations (WUAs) with responsibility for (operation and maintenance) O&M of substantial portions of the project, but that only have minimal budgets; severe inequity (tail-ender problems); low collection rates for an irrigation service fee that is set well below actual costs; phased implementation rehabilitation efforts, which have resulted in a mixture of different water control strategies and hardware (fully gated vs proportional flow division).
An RAP diagnostic evaluation was performed in different parts of the SMIS in two and a half days of intensive fieldwork. The results of the RAP quantified the performance of the SMIS in terms of the quality of water delivery service at each canal level in the system (Table 2). Internal indicators showed that only marginal improvements have been made in the most recent command area development (Stage III – Phase 1), but demonstrated clearly that the design concept of proportional flow division does not provide the operational flexibility required for meeting demand variations (owing to rainfall, crop diversification, etc.). In addition, a major deficiency of this design is the inequity that results from less than the full design capacity being achieved as a consequence of either low flow conditions in the main canal or changes in the hydraulic characteristics of various canals caused by siltation, weed growth, etc. Although the new system has been in operation for one year, operators have already reacted by installing steel gates at proportional structures in order to regulate the flow in some tertiary canals, examples of which are provided in this report.
Some key points from the RAP conducted at the SMIS include:The phased implementation of construction activities and institutional development in different stages of the SMIS has caused there to be relatively better service in some parts of the project, but also resulted indirectly in not enough attention being paid to overall issues such as how water is controlled in the main canal. One
Chapter 4 – MASSCOT in the Sunsari Morang Irrigation Project 9
FIG
UR
E 2
Layo
ut
of
the
SMIS

Mapping System and Services for Canal Operation Techniques in Nepal10
lesson of the SMIS RAP is that it is critical to ensure that the technical/engineering details are correct before expecting any success in participatory management schemes.The present operation of the CMC results in severe inequities in the “undeveloped” areas of the project. The design of the main canal cross-regulators (manually operated, vertical steel gates with no side weirs) makes it difficult to maintain constant upstream water levels, which is compounded by the operation of the secondary canal offtakes.Water delivery service is relatively poor at all levels of the SMIS but worsens at the tertiary canal level, which is the interface where water users groups (WUGs) are supposed to take over O&M from DOI staff. Part of the reason for the inadequate quality of service is related to the hydraulic characteristics of the cross-regulators (manual undershot gates) in secondary and subsecondary canals. In addition, in low flow conditions, which occur regularly in winter and spring, the structured design (proportional flow division) in the tertiary canal system in Stage III – Phase 1 is not compatible with providing good service.There was only a marginal improvement in the service provided by the tertiary canals in the most recent command area development (Stage III – Phase 1), even though substantial investment was made in training farmers and promoting the use of proportional flow dividers. The future planning for the next phases of Stage III must address the constraints associated with the structured design at low flow conditions.Most of the water measurement structures in the project are relatively inaccurate, and the current monitoring activities have not been integrated into an effective
TABLE 2Internal indicators: variation from RAP in the SMISSunsari Morang Irrigation System Value
Actual water delivery service to individual ownership units (e.g. field or farm) 1.1
Stated water delivery service to individual ownership units (e.g. field or farm) 1.8
Actual water delivery service at the most downstream point in the system operated by a paid employee 0.7
Stated water delivery service at the most downstream point in the system operated by a paid employee 1.5
Actual water delivery service by the main canals to the second-level canals 1.7
Stated water delivery service by the main canals to the second-level canals 2.0
Social “order” in the canal system operated by paid employees 1.0
Main canal
Cross-regulator hardware (main canal) 1.2
Turnouts from the main canal 2.0
Regulating reservoirs in the main canal 0.0
Communications for the main canal 1.3
General conditions for the main canal 1.6
Operation of the main canal 2.4
Second-level canals
Cross-regulator hardware (second-level canals) 1.5
Turnouts from the second-level canals 1.7
Regulating reservoirs in the second-level canals 0.0
Communications for the second-level canals 1.1
General conditions for the second-level canals 1.6
Operation of the second-level canals 2.1
Third-level canals
Cross-regulator hardware (third-level canals) 1.7
Turnouts from the third-level canals 0.7
Regulating reservoirs in the third-level canals 0.0
Communications for the third-level canals 0.9
General conditions for the third-level canals 1.4
Operation of the third-level canals 1.8
Note: Maximum possible value = 4.0;, minimum possible value = 0.0.

Chapter 4 – MASSCOT in the Sunsari Morang Irrigation Project 11
operations plan. For example, operators in some areas are recording measurements for rated cross-regulators even though they should be concerned only about maintaining constant water levels.
A final set of modernization recommendations was generated by the participants for implementation in 2003–04. The new water management strategies in the SMIS involve paying more attention to the technical/engineering details of water control, primarily in the CMC and secondary canals. The recommendations include the adoption of new operating rules for maintaining constant water levels in the main canal and improving control of the flows into the secondary canals. Other priority actions deal with the need for better communications and an integrated decision-making process. In Nepal, future sustainable advancements in agricultural productivity, including increased rice yields and crop diversification, are only achievable with modernization of poor-performing irrigation projects, along with the support of national-level water resources policies that promote modernization.
Step 2. System capacity and sensitivityObjective: The assessment of the physical capacity of irrigation structures to perform their function of transport, control, measurement, etc.
Assessing the sensitivity of irrigation structures (offtakes and regulators), identification of singular points. Mapping the sensitivity.
Main intakeIncrease in inflowInitially, the SMIS was designed and constructed in the 1970s for a maximum intake of 45 m3/second. However, the intake on the Koshi River was modified in the 1990s to achieve a maximum flow of 60 m3/second.
The increase in discharge inflow has not been accompanied by changes along the main canal and at cross-regulators. It seems that this increase has generated some problems at some regulators. However, the question as to whether the canal is capable of accommodating this quite significant increase without spilling has not yet received a firm answer. Whatever the case may be, the main inflow from the Koshi River is not known with sufficient accuracy.
The issue of low peakDuring winter and spring, the diversion capacity from the Koshi River is restricted by the sill-level elevation at the main gate entrance. SMIS managers have proposed decreasing the sill level by 0.5 m or more in order to allow the diverting of more discharge than current capacity during low peaks of the river, which is about 15 m3/second whereas needs are about 30 m3/second during low-peak season.
Hydropower plant: cutoff and discharge reductionImmediately downstream of the desilting basin implemented below the diversion from the Koshi River, there is a hydropower plant. Its turbines are located between the desilting plant and the entrance of the CMC.
For optimal performance, this power plant needs to be run with a sufficient head for the turbine, which means under the maximum water level in the desilting plant. This is no problem during the monsoon, when discharge in the river is high. However, in the low-peak season, raising the water level in the basin reduces the flow diverted from the river. SMIS engineers have reported that the backwater curve generated by raising the water level upstream of the power plant is reducing the flow entering the system. If this point were further confirmed by additional investigations, it would mean that there is clear competition between power generation and irrigation supply during these periods.

Mapping System and Services for Canal Operation Techniques in Nepal12
Another issue is that, for the purpose of raising the water level in the desilting basin, the main inflow is cut for 8 hours, which generates a flow problem in the CMC.
Illegal outletsIn the first reach of the CMC, there are many illicit outlets, hence, de facto the “entrance” of the SMIS irrigation system is what is really reaching CR1. It would probably be wise to have a measurement point at the first regulator.
Conveyance capacityThe transport capacity in the SMIS has not been identified as a major constraint either along the main canal or along the secondary ones and below. Despite acute problems of sedimentation in the system, the transport capacity has been maintained at a reasonable level.
However, as mentioned above, the increase in discharge from 45 to 60 m3/second at the headworks has created problems at some individual structures (siphons and aqueducts). These problems have been partially solved.
Control capacity along the main canalThe control capacity along the CMC is considered good. The physical state of structures is generally good. The only problem mentioned is that, at maximum discharge, the capacity of the regulators is stretched to the limit. Downstream of the regulators, turbulences and high velocity are creating erosion problems. Therefore, the protection of the downstream part of the regulators should be reinforced.
Secondary headworksThe headworks of each secondary canal consist of vertical, screw-driven, manually operated steel gates. The water level along the CMC is controlled by cross-regulators with vertical, screw-driven, manually operated steel gates. There are a total of 12 cross-regulators, most adjacent to the outlets of secondary canals, and some located several kilometres downstream of outlets to secondary canals. A single operator is in charge of each cross-regulator and usually lives nearby. The gates are generally in good shape. It takes about one hour to make a significant gate adjustment.
The secondary system differs between the developed command area (DCA) and the non-developed command area (NDCA).
Distribution capacityOn a limited part of the command area (9 750 ha, 15 percent of the gross command area [GCA]) corresponding to the Stage I project (1978), the system is gated all the way down to the watercourse level. In the other parts corresponding to Stage II and III (1985 and 1994) of the command area, i.e. 85 percent of the total GCA (70 000 ha), the design is based on gated outlets from the secondary canals and proportional flow division for subsecondary/tertiary canals (Figure 3).
With respect to flexible services, the Stage I system is, by design, capable of responding to the demand for diversified services. However, this covers only 15 percent of the area. Moreover, many gates have been broken, and the system no longer operates as the gated system it was designed to be.
Partition/diversion structuresThe design proposed during the recent projects for the command area development does not suits the needs of the water users. Many newly installed dividers are now equipped with tinkered gates that aim to isolate one branch while the other is flowing (Plate 1). These gates are often not well sealed to the concrete structure and do not eliminate water leaks. This tinkering with gates needs to be replaced by a more professional

Chapter 4 – MASSCOT in the Sunsari Morang Irrigation Project 13
intervention on the structures that need to be physically modified in order to enable flexible distribution.
Measurement capacityMost of the secondary and subsecondary canals in Stages I and II have a broad crest weir (flat horizontal crest) with a painted staff gauge reading in centimetres. The DOI engineer in charge of a certain block instructs the operator what gauge reading to maintain at the weir, and also what water level to maintain at a particular cross-regulator. However, the target water level at a cross-regulator is often variable as the operators adjust both the secondary gates and cross-regulator gates in order to maximize the flow through the outlet. The measurement accuracy of the weirs is usually poor owing to their close proximity to the outlets causing excessive turbulence at the gauge location, in addition to the relatively small measurement head. Record-keepers keep track of the gauge readings (flow rates) at secondary canals and communicate them to the subdivisional office on a weekly basis.
SafetyThe system has some gated escapes (Plate 2). These escapes are used primarily to evacuate the surplus in the event of a sudden gap between the availability and the downstream demand. This capacity can be used to run the system partially on a downstream mode control, block per block, between two escapes when water is abundant, e.g. monsoon time. The main canal is then run at full discharge and the operators regulate the escape to meet the downstream demand.
At present, it has been reported that two of the eight existing escapes are no longer operated because of some activities (sand mining) or settlement (squatters) in the drainage stream below the escape.
FIGURE 3Layout of SMIS Stage I (a) and Stages II and III (b)
Chatra main canal
Secondarycanal
Sub secondary canal
Tertiary canal
Watercourse10 ha
gatedgated
gated
Chatra main canal
Secondarycanal
Sub secondary canal
Tertiary canal
Watercourse4 ha
Proportional divider
Proportional divider
gated
gated
A
B
Plate 1Example of a divider equipped with a tinkered gate.
Mapping System and Services for Canal Operation Techniques in Nepal14
Sensitivity of structuresSensitivity is a characteristic that specifies how irrigation structures react when they experience changes (perturbations) in flow conditions. Sensitivity indicators quantify the magnitude of the reaction of the system and are useful to trigger specific operation procedures, e.g. high-sensitive structures need to be operated more often and with more care than low-sensitive structures. In the past, sensitivity has been often ignored despite its importance for the difficulty or ease of operating irrigation structures. As a consequence, engineers are not usually familiar with the concept.
During the RAP in 2003, an initial assessment showed that the sensitivity of the cross-regulators along the main canal was quite high. This was the subject of a further study by Tamrakar (2004), funded by FAO, which confirmed the preliminary assessment.
In the SMIS, sensitivity varies significantly from one node to another (Figure 4). In the first part until CR7, sensitivity is high as a result of either high-sensitivity indicators for diversion (offtake) or for water-level control (regulator) or for both. After CR7, both indicators are rather low.
This behaviour can also be seen from the display of the hydraulic flexibility indicator (also called proportionality indicator) in Figure 5. The first two reaches are about proportional (indicator close to 1). This means that whatever the perturbation of the flow coming from upstream, it will be shared proportionally among the offtakes. For example, if the main flow changes by 10 percent, so will the flows at the diversion points. However, reaches 3–7 are overproportional, diversion flows are more affected by perturbation, i.e.
for a change of 10 percent of in the main flow, they will result in a change of 20 percent or more at the diversion point. Reaches 8–10 are underproportional – the diversion flows are much less affected by changes. The last reach (11) is proportional.
Plate 2Gated escape on the CMC.
CR1 CR2 CR3 CR4 CR5 CR6 CR7 CR8 CR9 CR10 CR11 CR12
S offtake S cross-regtangular
5.004.504.003.503.002.502.001.501.000.500.00
Ind
icat
or
(S-F
)
Structure
FIGURE 4Measured sensitivity indicators along CMC
0
0.5
1
1.5
2
2.5
3
3.5
CR1 CR2 CR3 CR4 CR5 CR6 CR7 CR8 CR9 CR10 CR11
Ind
icat
or
FIGURE 5Hydraulic flexibility (proportionality indicator) along the
CMC of the SMIS

Chapter 4 – MASSCOT in the Sunsari Morang Irrigation Project 15
Considerations for operationIf the control exercised on the cross-regulators is uniform and equal to 0.1 m (±10 cm), then the water diversion at each offtake (head of secondary canal) may experience variations in discharge as indicated in Table 3.
The range of discharge variation at the offtake is wide, from 3.5 percent (very precise) to 43 percent (very low precision). This should then trigger different rules for operating the main system.
At the very least, regulators 6 and 7 should be operated with a different tolerance on water level than the others. However, even with a reduced tolerance of ±5 cm, which is already a difficult target to achieve, the discharge variation at the nearby offtakes would still be 21.5 and 17 percent, respectively. Therefore, it is recommended that the offtakes be desensitized.
CR1 and CR3 exhibit sensitivity indicators at 2 and 3, respectively (Table 4). Thus, they should also be monitored more carefully.
Compromising measurement and sensitivityMeasurement of flows along irrigation canals requires some head on the measurement device (weir) in order to enable the converting of water level into discharge. When placed directly below an offtake, this can lead to a reduction in the water head at the offtake as the water level below the offtake is raised. This depends on the measurement device design. Recent designs for water flow measurement are less head-consuming than old designs such as broad crested weirs.
Plate 3 shows an example of a significant reduction in water head on the offtake. The recently constructed crest has reduced head availability at the offtake, thus increasing significantly the sensitivity of the structure. The design of flow flumes should be revised in this case and changed for more effective ones, such as RBC flumes.
Sensitivity along secondary canalsThe secondary canals are equipped with gated structures to control water level and feed subsecondary canals. No information is available as yet on the sensitivity of these
TABLE 3Variation in discharge experienced at the offtake along the CMC for a water-level change of 0.1 m in the main canalDiversion point at CR CR1 CR2 CR3 CR4 CR5 CR6 CR7 CR8 CR9 CR10 CR11
S offtake 0.6 2.0 0.8 1.6 1 4.3 3.4 0.35 0.5 0.7 1.5
Variation in discharge (plus or minus initial setting value)
6% 20% 8% 16% 10% 43% 34% 3.5% 5% 7% 15%
TABLE 4Operation rules: tolerance and frequency of adjustment as a function of sensitivity at the cross-regulators of the SMISControl point Features Tolerance on water-level control Frequency of adjustment of
the CR
CR1 S regulator high (2) S offtake low
Tolerance 0.1 acceptable More frequent adjustment
CR2 S regulator low (0.4) S offtake high (2)
Reduced tolerance should be sought (±5 cm) Low frequency enough
CR3 S regulator very high (3) S offtake low (0.8)
Tolerance 0.1 acceptable More frequent adjustment
CR4 & CR5 S regulator average (< 1.5) S offtake average (< 1.5)
Tolerance 0.1 acceptable Average frequency adjustment
CR6 & CR7 S regulator low (< 1) S offtake high (> 3.5)
Reduced tolerance should be sought (below 5 cm), which might be difficult to achieve. Reducing the sensitivity of offtakes should be considered.
Average frequency adjustment
CR8 to CR11 S regulator is average or below S offtake is average or below
Tolerance 0.1 acceptable Average frequency adjustment
Mapping System and Services for Canal Operation Techniques in Nepal16
structures. Investigation along the secondary canals should be carried out as a preliminary step before formulating a modernization project.
Step 3. PerturbationObjective: Perturbations analysis: causes, magnitudes, frequency and options for coping with them.
Main supplyThere is only one source of surface supply, the Koshi River. The supply ranges from some 60 m3/second in the monsoon period down to 15–25 m3/second in winter and spring. However, the supply is stable on a weekly basis. Variations in the supply are generated by the necessity to close the intake and flush out the sediment trap upstream at
monsoon time. This can take two hours a day during periods of high sediment load in the river. This generates perturbations at the main intake.
The hydropower plant downstream of the trap reach is also a potential source of perturbation of the flow during the low-peak season when the main entrance flow is cut to raise the water level in desilting basin, and when discharge is reduced as a consequence of this (see above).
Supply to secondary canalsThe supply to secondary systems has been reported as varying significantly (Figures 6 and 7). This may be the consequence of the low control on water level. Throughout
Plate 3Example of wrongly designed measurement crest at the headworks of a secondary canal along the CMC raising the water level and leading to excessive sensitivity of the offtake.
0
50
100
150
200
250
1 10 19 18 37 46 55 64 73 82 91 100 109 118 127 136 145 154 163 172 181 190
Water level recorded daily at Jhumka 68RD between 25 March and 2 October 1999
H u
pst
ream
th
e re
gu
lato
r (c
m)
FIGURE 6Variation in water level at CR4 – Jhumka Minor, monsoon season
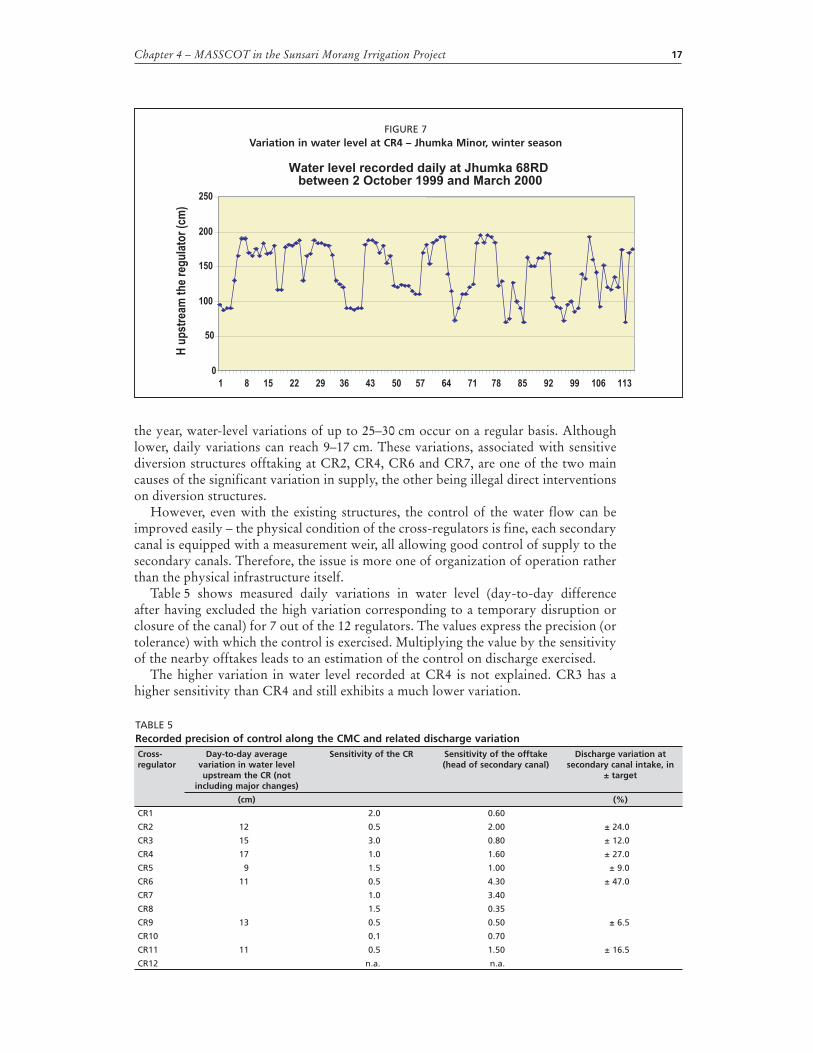
Chapter 4 – MASSCOT in the Sunsari Morang Irrigation Project 17
the year, water-level variations of up to 25–30 cm occur on a regular basis. Although lower, daily variations can reach 9–17 cm. These variations, associated with sensitive diversion structures offtaking at CR2, CR4, CR6 and CR7, are one of the two main causes of the significant variation in supply, the other being illegal direct interventions on diversion structures.
However, even with the existing structures, the control of the water flow can be improved easily – the physical condition of the cross-regulators is fine, each secondary canal is equipped with a measurement weir, all allowing good control of supply to the secondary canals. Therefore, the issue is more one of organization of operation rather than the physical infrastructure itself.
Table 5 shows measured daily variations in water level (day-to-day difference after having excluded the high variation corresponding to a temporary disruption or closure of the canal) for 7 out of the 12 regulators. The values express the precision (or tolerance) with which the control is exercised. Multiplying the value by the sensitivity of the nearby offtakes leads to an estimation of the control on discharge exercised.
The higher variation in water level recorded at CR4 is not explained. CR3 has a higher sensitivity than CR4 and still exhibits a much lower variation.
Water level recorded daily at Jhumka 68RD
between 2 October 1999 and March 2000
0
50
100
150
200
250
H u
pst
ream
th
e re
gu
lato
r (c
m)
1 8 15 22 29 36 43 50 57 64 71 78 85 92 99 106 113
FIGURE 7Variation in water level at CR4 – Jhumka Minor, winter season
TABLE 5Recorded precision of control along the CMC and related discharge variationCross-regulator
Day-to-day average variation in water level upstream the CR (not
including major changes)
Sensitivity of the CR Sensitivity of the offtake (head of secondary canal)
Discharge variation at secondary canal intake, in
± target
(cm) (%)
CR1 2.0 0.60
CR2 12 0.5 2.00 ± 24.0
CR3 15 3.0 0.80 ± 12.0
CR4 17 1.0 1.60 ± 27.0
CR5 9 1.5 1.00 ± 9.0
CR6 11 0.5 4.30 ± 47.0
CR7 1.0 3.40
CR8 1.5 0.35
CR9 13 0.5 0.50 ± 6.5
CR10 0.1 0.70
CR11 11 0.5 1.50 ± 16.5
CR12 n.a. n.a.

Mapping System and Services for Canal Operation Techniques in Nepal18
The high variation at CR11, having a low sensitivity indicator (0.5), must certainly result from high variation in discharge reaching the end of the system.
The records on water-level variation do not show any particular trend. This means that there is no increase in perturbations along the CMC.
Three of the six secondary canals evaluated have discharge variations greater than 20 percent as a consequence of the variation in water level.
Step 4. Mapping water networks and water balance/accountingObjective: The objective here is to map the nature and structure of all the streams and flows that affect and are influenced by the command area. It includes assessing the hierarchical structure and the main features of the irrigation and drainage networks, natural surface streams and groundwater, and the mapping of the opportunities and constraints, including drainage and recycling facilities.
Surface streamsThe GCA is crossed by nine rivers flowing from north to south. The flow associated with these streams has been estimated at 1 740 million m3 (WECS 1989 approach – Tamrakar [2004]), which is more than double the irrigation diversion from the Koshi River (730 million m3). SMIS engineers have mentioned the presence of four rivers that are partly entering the subsecondary system in the eastern area.
GroundwaterThe groundwater source in the system area is a part of the Indo-Gangetic Basin, which can be considered as one of the largest groundwater basins in the world. In the Terai, groundwater is used for domestic and industrial purposes and also for supplementary irrigation.
The water table in the SMIS shows a large depression around Jhumka (northwest part of system area), where it is 7 m below the surface. This is probably related to the proximity of the Koshi River, which possibly acts as a drain of the groundwater. In many other parts, the water table is about 2–3 m below the surface.
It is estimated that the annual recharge is about 200 million m3 in the west part (the system is divided into east and west parts by the Budhi River which flows from north to south) and 160 million m3 in the east part, which can be abstracted by either shallow or deep tubewells. Deep tubewells are possible in all western parts of the system area. Except in limited parts of Jhumka, the system area is good for shallow tubewell development.
The groundwater situation splits the command area into two parts: the northwest part, for which groundwater might be costly for use for agriculture; and the rest of the command area, which mostly enjoys ready access to groundwater (the water table being about 2–3 m deep).
Water recycling facilityDownstream of the Sunsari River, a dam collects the drainage flows coming from the SMIS command areas and serves two minors (Plate 4).
Other identified recycling facilities are:Mirchiniya River,Hurhuriya Disty,Bariati Disty,Sankarpur Disty.
There is also a project under consideration on the Sunsari River, upstream of the Chanda Mona facility, that aims to irrigate areas not covered by the SMIS. Once built, this project would incorporate the downstream part of the two secondary canals adjacent to the river. The total command area would then be 10 000 ha.

Chapter 4 – MASSCOT in the Sunsari Morang Irrigation Project 19
Farmer-managed embedded small-scale irrigation systemsThere are five small-scale irrigation systems of 500 ha inside the GCA that are not part of the SMIS command area. They receive their water from canals diverting rivers upstream of the main canal. However, these systems are drained into the SMIS command area.
Water balanceThe water-balance accounting for supply, natural streams and groundwater shows that water resources are not an issue in the area. The annual total water availability (about 4 000 million m3) far exceeds the net water requirements for irrigation with the present cropping pattern (360 million m3), and could even cope with a doubling in irrigation use.
The issue is more an issue of cost-effective mobilization, transport and distribution of water services to farmers.
Step 5. Service to usersObjective: Mapping existing and possible options for services to users with consideration to farmers and crops as well as to other users of water.
Current servicesService to secondary canalsThe services in the SMIS command area were ranked during the RAP exercise (FAO, 2003a). The estimated indicators given in Table 6 show that the quality of service declines from the main canal to lower canals.
The service from the main canal to secondary canals along the CMC is considered quite reliable but poor in terms of flexibility, equity and adequacy.
The inequity in the services is confirmed by a study undertaken by the World Bank / BNWPP (2005), analysing the irrigation campaign 2002/03. The service to secondary canals is significantly variable.
Table 7 shows the value of annual irrigation supply per unit command
Plate 4Chanda Mona recycling facility downstream of secondary canals 1 and 2 along the Sunsari River, serving two minors (right-bank one shown in Plate 4.B).
B
A
TABLE 6Indicators of services in the SMIS, as ranked during the RAPIndicator Main to
secondarySecondary to
tertiaryTertiary to farm level
Field level
Flexibility 1 2 2 1
Reliability 3 2.5 2 1.5
Equity 2 2 1 1
Adequacy 1 1 0 -Source: FAO, 2003a.
TABLE 7Variation in supply recorded per unit area for the whole SMIS and for two secondaries
SMIS S9 Sitagunj S13 Biratnagar
(m3/ha)
Annual irrigation supply per unit command area
12 800 12 800 19 500
Annual irrigation supply per unit irrigated area
5 600 5 300 9 750
Mapping System and Services for Canal Operation Techniques in Nepal20
area and per unit of irrigated area (several crops per year are irrigated) for the SMIS as a whole and for two secondary canals. It shows that there are significant variations in supply, with Sitagunj being close to the average whereas Biratnagar shows a supply of 75 percent more than average.
There is no objective reason from soil conditions or cropping patterns that can justify this difference. However, Biratnagar is the main city of the command areas, centralizing all economic activities and power.
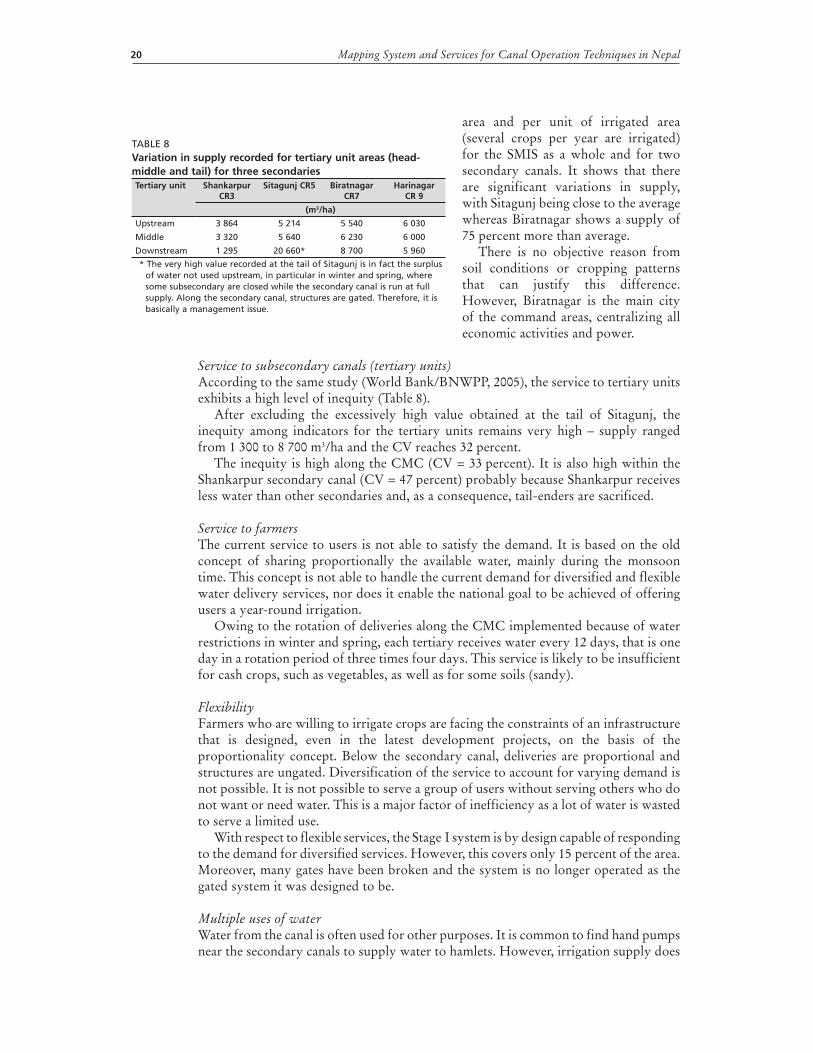
Service to subsecondary canals (tertiary units)According to the same study (World Bank/BNWPP, 2005), the service to tertiary units exhibits a high level of inequity (Table 8).
After excluding the excessively high value obtained at the tail of Sitagunj, the inequity among indicators for the tertiary units remains very high – supply ranged from 1 300 to 8 700 m3/ha and the CV reaches 32 percent.
The inequity is high along the CMC (CV = 33 percent). It is also high within the Shankarpur secondary canal (CV = 47 percent) probably because Shankarpur receives less water than other secondaries and, as a consequence, tail-enders are sacrificed.
Service to farmersThe current service to users is not able to satisfy the demand. It is based on the old concept of sharing proportionally the available water, mainly during the monsoon time. This concept is not able to handle the current demand for diversified and flexible water delivery services, nor does it enable the national goal to be achieved of offering users a year-round irrigation.
Owing to the rotation of deliveries along the CMC implemented because of water restrictions in winter and spring, each tertiary receives water every 12 days, that is one day in a rotation period of three times four days. This service is likely to be insufficient for cash crops, such as vegetables, as well as for some soils (sandy).
FlexibilityFarmers who are willing to irrigate crops are facing the constraints of an infrastructure that is designed, even in the latest development projects, on the basis of the proportionality concept. Below the secondary canal, deliveries are proportional and structures are ungated. Diversification of the service to account for varying demand is not possible. It is not possible to serve a group of users without serving others who do not want or need water. This is a major factor of inefficiency as a lot of water is wasted to serve a limited use.
With respect to flexible services, the Stage I system is by design capable of responding to the demand for diversified services. However, this covers only 15 percent of the area. Moreover, many gates have been broken and the system is no longer operated as the gated system it was designed to be.
Multiple uses of waterWater from the canal is often used for other purposes. It is common to find hand pumps near the secondary canals to supply water to hamlets. However, irrigation supply does
* The very high value recorded at the tail of Sitagunj is in fact the surplus of water not used upstream, in particular in winter and spring, where some subsecondary are closed while the secondary canal is run at full supply. Along the secondary canal, structures are gated. Therefore, it is basically a management issue.
TABLE 8Variation in supply recorded for tertiary unit areas (head-middle and tail) for three secondariesTertiary unit Shankarpur
CR3Sitagunj CR5 Biratnagar
CR7Harinagar
CR 9
(m3/ha)
Upstream 3 864 5 214 5 540 6 030
Middle 3 320 5 640 6 230 6 000
Downstream 1 295 20 660* 8 700 5 960
Chapter 4 – MASSCOT in the Sunsari Morang Irrigation Project 21
not have a major role in other uses of water. Groundwater is generally abundant and sufficiently accessible to match local needs for domestic water.
Considering a total water use of 340 million m3, 97 percent is used by agriculture while 2.7 percent is used for domestic water supply and 0.3 percent for industrial uses.
Other service providedAs identified by managers, other services provided are:
irrigation to three crops (rice–rice–wheat) with a current cropping intensity of 215 percent;developed area covers up to 4–10 ha;road networks – easy access from farm to market;water for domestic, industrial uses (landless reside along the canal banks);enhancement to agri-extension activities in coordination with the DOA;training to strengthen capability of WUAs and other users.
Service to environmentManagers have not reported any specific water service from the CMC for the environment.
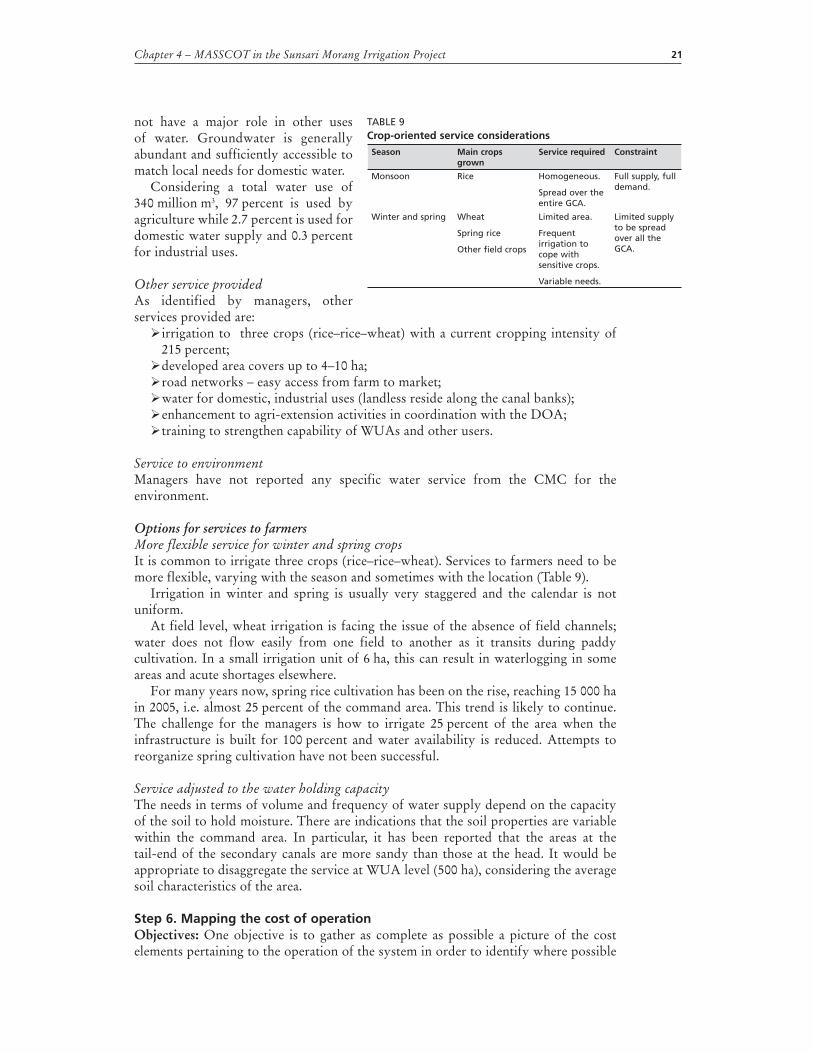
Options for services to farmersMore flexible service for winter and spring cropsIt is common to irrigate three crops (rice–rice–wheat). Services to farmers need to be more flexible, varying with the season and sometimes with the location (Table 9).
Irrigation in winter and spring is usually very staggered and the calendar is not uniform.
At field level, wheat irrigation is facing the issue of the absence of field channels; water does not flow easily from one field to another as it transits during paddy cultivation. In a small irrigation unit of 6 ha, this can result in waterlogging in some areas and acute shortages elsewhere.
For many years now, spring rice cultivation has been on the rise, reaching 15 000 ha in 2005, i.e. almost 25 percent of the command area. This trend is likely to continue. The challenge for the managers is how to irrigate 25 percent of the area when the infrastructure is built for 100 percent and water availability is reduced. Attempts to reorganize spring cultivation have not been successful.
Service adjusted to the water holding capacityThe needs in terms of volume and frequency of water supply depend on the capacity of the soil to hold moisture. There are indications that the soil properties are variable within the command area. In particular, it has been reported that the areas at the tail-end of the secondary canals are more sandy than those at the head. It would be appropriate to disaggregate the service at WUA level (500 ha), considering the average soil characteristics of the area.
Step 6. Mapping the cost of operationObjectives: One objective is to gather as complete as possible a picture of the cost elements pertaining to the operation of the system in order to identify where possible
TABLE 9Crop-oriented service considerations
Season Main crops grown
Service required Constraint
Monsoon Rice Homogeneous.
Spread over the entire GCA.
Full supply, full demand.
Winter and spring Wheat
Spring rice
Other field crops
Limited area.
Frequent irrigation to cope with sensitive crops.
Variable needs.
Limited supply to be spread over all the GCA.
Mapping System and Services for Canal Operation Techniques in Nepal22
gains should be sought with the current service and operational setup, and what the cost of implementing improved services would be. Another objective is to map the costs of current operation techniques and services, disaggregating the elements entering into the cost, and costing options for various level of services with current techniques and with improved techniques.
Information and knowledge about the costs of management, operation and maintenance are fragmentary. Further analysis should be made in order to produce reliable figures on what should be considered a reasonable cost for a given service, and what the maintenance should be consist of.
Cost of operation and maintenanceIn the 1990s, it was estimated that the annual O&M cost for most large projects in Terai was more than Nr400/ha (US$1 = Nr72). The project operation plan in the SMIS assumed an annual maintenance budget of Nr770/ha (DOI, 2001). These figures have decreased since canals serving less than 1 000 ha were transferred to users. In the project operation plan for the Narayani Zone Irrigation Development Project, the annual incremental O&M cost for surface irrigation schemes is Nr950/ha (Pradhan et al., 1998).
According to the current managers, the O&M in SMIS should be Nr1 500/ha, with Nr500 for operation and Nr1 000 for maintenance. This amount would correspond to about 3.3 percent of the gross product in the command area for 2005. According to Pradhan et al. (1998), it would correspond to about 10 percent of the net income per hectare provided.
Part of the differences in the figures about O&M costs can be explained by inflation and by the increase in cropping intensity from one irrigated crop per year (rice) to more than two on average (the cropping intensity is currently 215 percent). With year-round irrigation, the service is provided for a much longer period of time and the cost of O&M increases. Therefore, a figure of Nr1 500/year for irrigation should be considered for O&M.
This figure should be compared with the cost to individual farmers of pumping groundwater. The RAP estimated this cost at Nr2 000–3 000 per crop/season, meaning that two crops per year would cost Nr4 000–6 000 with this type of supply (even more expensive where the farmer has to rent the equipment).
This O&M cost corresponds to the current service, which in many regards is not able to satisfy demand in winter and spring. Responding to the users demand with more flexible service, assuming that water availability from the Koshi River has been secured, would increase the inputs again and, as a consequence, the cost per year.
Therefore, it seems reasonable to consider a cost for an upgraded service from surface supply allowing three crops at about Nr1 800/ha/year (the increase being mainly due to operation). This cost should be acceptable to users provided that the service really improves.
StaffWith the current operational mode, a single operator is in charge of each cross-regulator (12) and usually lives nearby.
The annual cost of staff amounts to US$671.
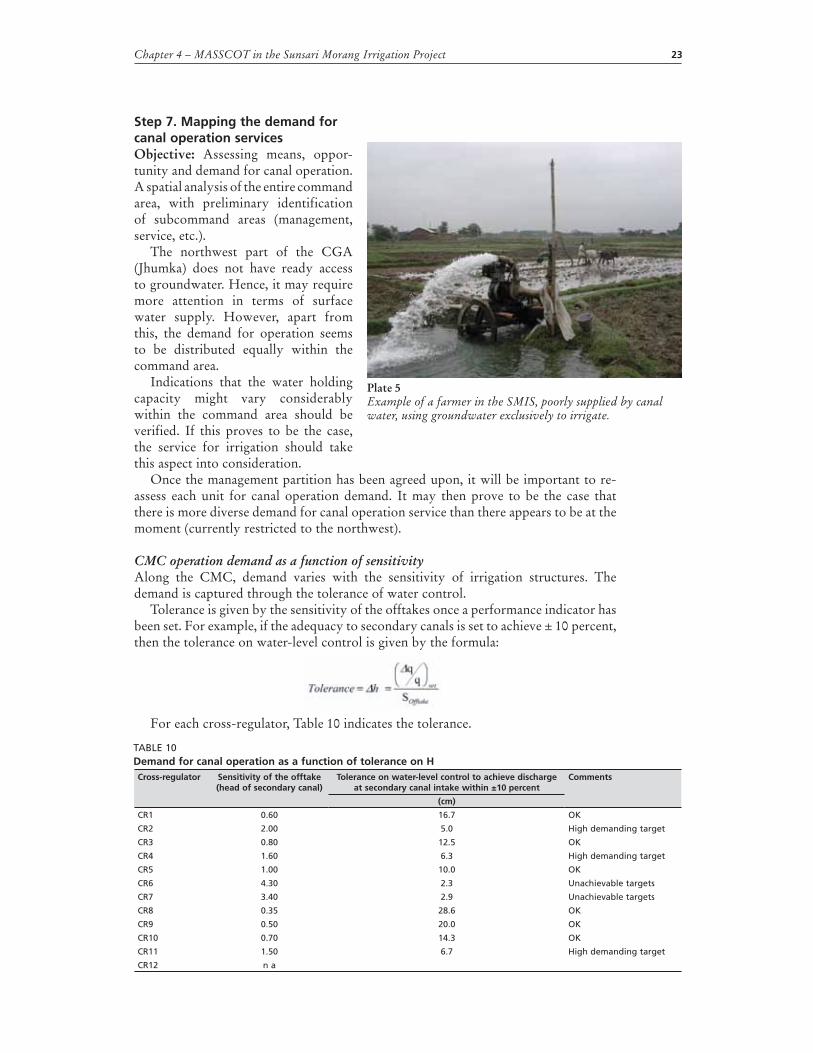
Willingness to pay for good service Farmers who are not well served by the surface canal and who have turned to groundwater use spend an estimated Nr3 000 per crop season to irrigate their paddy-fields (Plate 5). This sets the top threshold for the best service (highly reliable, flexible and adequate).
Chapter 4 – MASSCOT in the Sunsari Morang Irrigation Project 23
Step 7. Mapping the demand for canal operation servicesObjective: Assessing means, oppor-tunity and demand for canal operation. A spatial analysis of the entire command area, with preliminary identification of subcommand areas (management, service, etc.).
The northwest part of the CGA (Jhumka) does not have ready access to groundwater. Hence, it may require more attention in terms of surface water supply. However, apart from this, the demand for operation seems to be distributed equally within the command area.
Indications that the water holding capacity might vary considerably within the command area should be verified. If this proves to be the case, the service for irrigation should take this aspect into consideration.
Once the management partition has been agreed upon, it will be important to re-assess each unit for canal operation demand. It may then prove to be the case that there is more diverse demand for canal operation service than there appears to be at the moment (currently restricted to the northwest).
CMC operation demand as a function of sensitivityAlong the CMC, demand varies with the sensitivity of irrigation structures. The demand is captured through the tolerance of water control.
Tolerance is given by the sensitivity of the offtakes once a performance indicator has been set. For example, if the adequacy to secondary canals is set to achieve ± 10 percent, then the tolerance on water-level control is given by the formula:
For each cross-regulator, Table 10 indicates the tolerance.
Plate 5Example of a farmer in the SMIS, poorly supplied by canal water, using groundwater exclusively to irrigate.
TABLE 10Demand for canal operation as a function of tolerance on HCross-regulator Sensitivity of the offtake
(head of secondary canal)Tolerance on water-level control to achieve discharge
at secondary canal intake within ±10 percentComments
(cm)
CR1 0.60 16.7 OK
CR2 2.00 5.0 High demanding target
CR3 0.80 12.5 OK
CR4 1.60 6.3 High demanding target
CR5 1.00 10.0 OK
CR6 4.30 2.3 Unachievable targets
CR7 3.40 2.9 Unachievable targets
CR8 0.35 28.6 OK
CR9 0.50 20.0 OK
CR10 0.70 14.3 OK
CR11 1.50 6.7 High demanding target
CR12 n a

Mapping System and Services for Canal Operation Techniques in Nepal24
The targets for CR6 and CR7 are unrealistic (2.3 and 2.9 cm, respectively). The performance in controlling discharge should be achieved first by reducing the sensitivity of the offtakes.
Regarding the frequency of checking results from the tolerance that need to be achieved and the sensitivity of the cross-regulator, the frequency of checking should increase when the tolerance decreases and when the sensitivity of the regulator increases.
Demand with respect to serviceSMIS managers do not see any variation in the demand with respect to the service. However, it might be possible that some slight variations in water needs and irrigation frequency occur between the head and the tail of secondary canals (some 30 km apart).
Demand linked to recycling opportunitiesSeveral opportunities for water recycling have already been mentioned (see section on Step 4). Some are located along the Sunsari River (the existing Chanda Mona facility and the projected Sunsari River system [Figure 8]). The command areas that are connected to a recycling facility can be served from a secondary canal with less care than others. If they experience a shortage, they should be compensated the next turn; and if they have a surplus, this surplus is recycled.
Step 8. Partitioning in management unitsObjective: The irrigation system and the command area should be divided into subunits (subsystems and/or subcommand areas) that are held homogeneous, and/or separated from one another by a singular point or a particular borderline.
1
23
4
5
7
6
Recycling facilities along the Sunsari RiverLeft bank of Sukhsaina Disty - Right bank of Shankharpur Disty - CA ofRamdhuni Minor and Manik Chauri Sub-Disty are recycled downstreamthus operation demand for these CAs is low as spill is acceptableSukhsaina Disty
Shankharpur Disty
Projected Sunsari River recycling system
Chanda Mona recycling system
FIGURE 8Identification of the demand for canal operation with recycling facilities

Chapter 4 – MASSCOT in the Sunsari Morang Irrigation Project 25
The current management is split into five levels (Table 11). It is believed that too many levels are leading to inefficient management. In fact, it would be best to reduce the number of levels to three.
As far as management and operation are concerned, it seems that there is room for two professional levels for the management units. This is what the DOI has adopted in the SMIS with the Water Users Central Coordination Committee (WUCCC) as the professional agency responsible for the CMC supply and for serving the large lower professional agency Water Users Coordination Committee (WUCC), one for each secondary canal (Figure 9). In this setup, the WUCCs covering an area of several thousands hectares, they are responsible for serve smaller units, Water Users Committees (WUCs), of about 300 ha and they should assume integrated water resources management (IWRM).
An important issue: the number of second-level agencies (WUCCs)The partition of the command area into practical management units should be made considering the secondary canals. However, this does not mean that there have to be as many as units as there are large or small secondary canals. Other criteria need to be considered, e.g. the size and compactness of the command area.
For the moment, the SMIS managers are considering the partition on the basis of all secondary canals, including the small ones. Therefore, there would be 20 WUCCs. For the service interface, it is quite reasonable as each WUCC would then have only one offtake point on the main canal. However, FAO believes that this option is likely to create some small units that would not be viable, while others would have a critical mass (area) that would allow the recruiting of professional staff.
Option for seven WUCCsThe suggestion by FAO is to consider having only seven WUCCs, with several of them having several offtake points on the main canal, but with each of them being large enough to allow strengthened management. Figure 10 maps out what could be the command areas of the second-level units if the entire system were split in seven units, each averaging 10 000 ha.
When considering a partition with seven units, the downstream unit (WUCC-7) would have four medium-sized secondary canals diverting from the CMC. For the purpose of clarity in management, the proposal is to end the CMC upstream of CR11 and to make the WUCC responsible for, and the operator of, the final sections of the CMC. This option would be accompanied by the construction of a measurement weir upstream of CR11 in order to allow the discharge reaching WUCC-7 to be measured. Operation of the four intakes on the CMC should be the responsibility of WUCC-7.
At the tail-end of the system, it is likely that discharge perturbations will affect the delivery at the entry point of WUCC-7. Therefore, the suggestion is to use the main canal as buffer storage in order to compensate for hourly fluctuations.
TABLE 11Existing institutional management setup
Canal level
Water Users Group Watercourse
Water Users Committee or Water Users Subcommittee
Tertiary canal
Water Users Committee Subsecondary canal
Water Users Coordination Committee Secondary canal
Water Users Central Coordination Committee System level
Chatra main canal = WUCCC main agency
Main drainage WUCC second agency
FIGURE 9 Management setup in the SMIS

Mapping System and Services for Canal Operation Techniques in Nepal26
Step 9. Canal operation improvementsObjective: Identify improvement options for each management unit contemplated, focusing on: (i) water management; (ii) water control; and (iii) canal operation (service and cost-effectiveness).
Only the main canal has been assessed comprehensively so far. Therefore, the recommendations will focus mainly on the CMC level.
It is highly recommended that the MASSCOT approach be run for each secondary system.
Improving canal operation may serve four purposes:improved performance in achieving the service (no change);better service to users;improved water management;reduced cost of operation.
This can be contemplated with or without a significant change in the service targeted to users. Without changing the service, the operation would focus on improving the process to ensure the best achievement in terms of actual performance compared with targets (adequacy, flexibility, reliability and equity).
With changes to the service targeted, the operation would consist in making the new service a reality by organizing differently the water and the information flows within the system.
Therefore, in order to design and plan for improvements, it is critical to specify clearly the situation being referred to.
Major change in service in winter and springThe following contemplates a major change in the service to allow more flexibility in deliveries at secondary canals in the period of low flow. At present, the secondary canals
End of CMC and entry point of WUCC-7
Entry point of CMC
FIGURE 10Proposed partition of the SMIS into seven second-level units
Chapter 4 – MASSCOT in the Sunsari Morang Irrigation Project 27
are run full under a rotation mode with three blocks with water for four consecutive days for each block. The WUCC should have the possibility to decide on:
a strict and planned rotation of four days at full supply;a reduced supply for a longer period of time, e.g. 50-percent discharge in two rotations out of four;a continuous reduced flow (one-third).
Management setupThe DOI has adopted the following management setup. The CMC is the upper level of management. The WUCCC is the agency that runs the CMC, the agency can be within the DOI or completely separate. The WUCCC serves the lower-level WUCCs through secondary headworks. Normally, it is the CMC staff only who operate the offtakes, while both the WUCCC and the WUCC staff ensure the measurements and records of the flow below the offtake in order to evaluate the service.
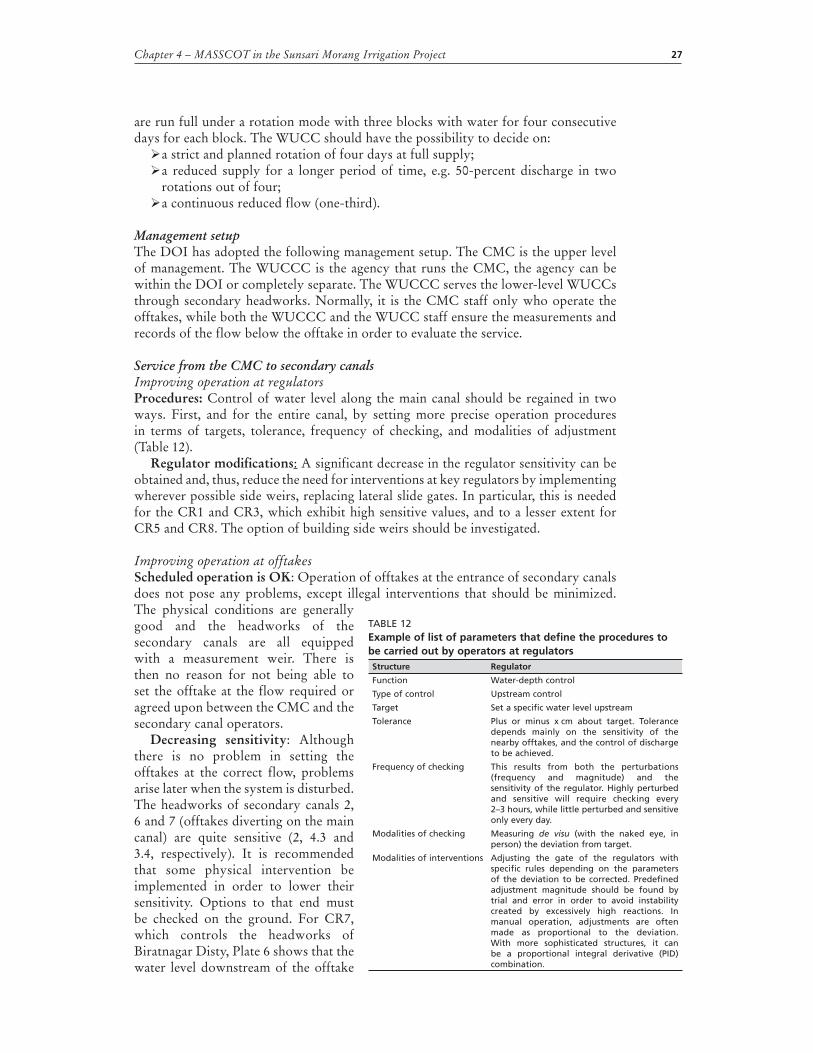
Service from the CMC to secondary canalsImproving operation at regulatorsProcedures: Control of water level along the main canal should be regained in two ways. First, and for the entire canal, by setting more precise operation procedures in terms of targets, tolerance, frequency of checking, and modalities of adjustment (Table 12).
Regulator modifications: A significant decrease in the regulator sensitivity can be obtained and, thus, reduce the need for interventions at key regulators by implementing wherever possible side weirs, replacing lateral slide gates. In particular, this is needed for the CR1 and CR3, which exhibit high sensitive values, and to a lesser extent for CR5 and CR8. The option of building side weirs should be investigated.
Improving operation at offtakesScheduled operation is OK: Operation of offtakes at the entrance of secondary canals does not pose any problems, except illegal interventions that should be minimized. The physical conditions are generally good and the headworks of the secondary canals are all equipped with a measurement weir. There is then no reason for not being able to set the offtake at the flow required or agreed upon between the CMC and the secondary canal operators.
Decreasing sensitivity: Although there is no problem in setting the offtakes at the correct flow, problems arise later when the system is disturbed. The headworks of secondary canals 2, 6 and 7 (offtakes diverting on the main canal) are quite sensitive (2, 4.3 and 3.4, respectively). It is recommended that some physical intervention be implemented in order to lower their sensitivity. Options to that end must be checked on the ground. For CR7, which controls the headworks of Biratnagar Disty, Plate 6 shows that the water level downstream of the offtake
TABLE 12Example of list of parameters that define the procedures to be carried out by operators at regulatorsStructure Regulator
Function Water-depth control
Type of control Upstream control
Target Set a specific water level upstream
Tolerance Plus or minus x cm about target. Tolerance depends mainly on the sensitivity of the nearby offtakes, and the control of discharge to be achieved.
Frequency of checking This results from both the perturbations (frequency and magnitude) and the sensitivity of the regulator. Highly perturbed and sensitive will require checking every 2–3 hours, while little perturbed and sensitive only every day.
Modalities of checking Measuring de visu (with the naked eye, in person) the deviation from target.
Modalities of interventions Adjusting the gate of the regulators with specific rules depending on the parameters of the deviation to be corrected. Predefined adjustment magnitude should be found by trial and error in order to avoid instability created by excessively high reactions. In manual operation, adjustments are often made as proportional to the deviation. With more sophisticated structures, it can be a proportional integral derivative (PID) combination.

Mapping System and Services for Canal Operation Techniques in Nepal28
Solution: lower the crest level ofthe measurement weir
Water leveltoo high
Plate 6Offtake at CR7 head of the Biratnagar secondary canal (left) and at CR6 head of Ramgunj Disty (right).
Plate 7Example of leaks at the Bhudi aqueduct.
at the entrance of the secondary canal has been set too high (almost certainly in order to build the measurement weir). The crest level of the weir should be lowered significantly in order to reduce sensitivity while maintaining the measurement function.
Improving water efficiency: reduce leakagesAt some particular points, the canal is leaking and repairs should be made (Plate 7).
Improving the organization of the operation along the main canalThe organization of operation along the CMC could be improved by considering the following:
Use the reach upstream CR1 as a storage capacity to smooth the variation of discharge generated at the desilting plant. Offtake at CR1 is low sensitive (0.6) and should accept high variations in water level. A rough estimate of the storage capacity upstream of CR1 is 120 000 m3 (20 m wide, 1 m height variation, 6 km long), which represents little more that one hour of supply in winter (30 m3/second).Combine the demand from the units with the prospects for supply in order to develop a water distribution plan.Develop a procedure that deals with perturbations (positive and negative).
Annex 1 summarizes the proposed interventions.
Further investigation needed for the secondary-level operationThe investigations at secondary level have been fragmented and too rapid. It is necessary to realize that MASSCOT should now be applied for each of the WUCCs at

Chapter 4 – MASSCOT in the Sunsari Morang Irrigation Project 29
each of the 12 secondary canals, examining all the steps of the MASSCOT procedure. More information is needed in order to formulate a proposal of service to the tertiary level (subsecondary), and a proposal for improving the operation along the secondary and below.
For example, along secondary canals, no information is available on sensitivity. The first step in the modernization plan should be to commission further studies to check the sensitivity of the gated structures supplying the subsecondary.
Similarly, opportunities for water recycling, groundwater access, spatial variation of the cropping pattern, soil mapping, etc. should be investigated for each management unit.
Step 10. Aggregating and consolidating managementObjective: Aggregation of options at the system level, and consistency check. Consolidating and designing an overall cost-effective information system for supporting operation and service-oriented management.
This step cannot be addressed at this stage when the previous ones have not been completed.
MASSCOT is an iterative process that proceeds step by step and turn by turn. With the limited investigation made, it is not possible to conclude what the management setup should be, what service the units created would consider, and what operation techniques should be implemented to match this objective.
The next critical stage for the SMIS would be to run the MASSCOT methodology for each subunit identified, each WUCC being considered as unique. Only then will it be possible to consider aggregating and consolidating the whole modernization of irrigation management and operation in the SMIS.

31
Chapter 5
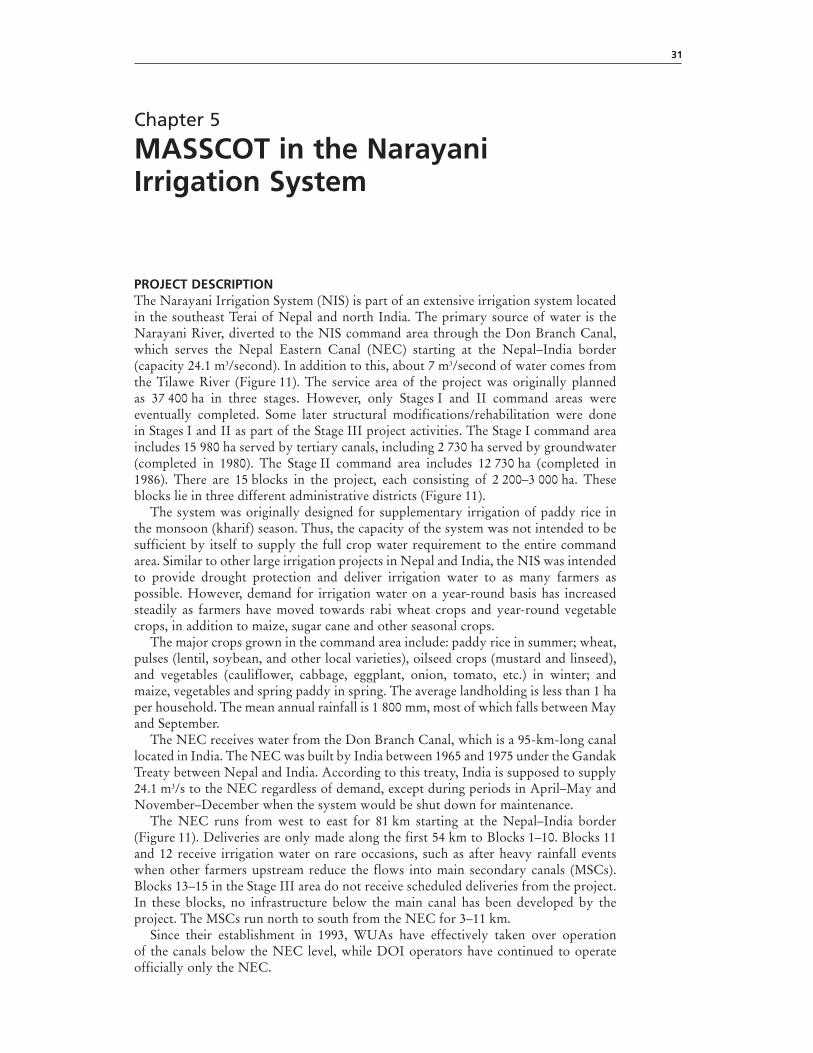
MASSCOT in the Narayani Irrigation System
PROJECT DESCRIPTIONThe Narayani Irrigation System (NIS) is part of an extensive irrigation system located in the southeast Terai of Nepal and north India. The primary source of water is the Narayani River, diverted to the NIS command area through the Don Branch Canal, which serves the Nepal Eastern Canal (NEC) starting at the Nepal–India border (capacity 24.1 m3/second). In addition to this, about 7 m3/second of water comes from the Tilawe River (Figure 11). The service area of the project was originally planned as 37 400 ha in three stages. However, only Stages I and II command areas were eventually completed. Some later structural modifications/rehabilitation were done in Stages I and II as part of the Stage III project activities. The Stage I command area includes 15 980 ha served by tertiary canals, including 2 730 ha served by groundwater (completed in 1980). The Stage II command area includes 12 730 ha (completed in 1986). There are 15 blocks in the project, each consisting of 2 200–3 000 ha. These blocks lie in three different administrative districts (Figure 11).
The system was originally designed for supplementary irrigation of paddy rice in the monsoon (kharif) season. Thus, the capacity of the system was not intended to be sufficient by itself to supply the full crop water requirement to the entire command area. Similar to other large irrigation projects in Nepal and India, the NIS was intended to provide drought protection and deliver irrigation water to as many farmers as possible. However, demand for irrigation water on a year-round basis has increased steadily as farmers have moved towards rabi wheat crops and year-round vegetable crops, in addition to maize, sugar cane and other seasonal crops.
The major crops grown in the command area include: paddy rice in summer; wheat, pulses (lentil, soybean, and other local varieties), oilseed crops (mustard and linseed), and vegetables (cauliflower, cabbage, eggplant, onion, tomato, etc.) in winter; and maize, vegetables and spring paddy in spring. The average landholding is less than 1 ha per household. The mean annual rainfall is 1 800 mm, most of which falls between May and September.
The NEC receives water from the Don Branch Canal, which is a 95-km-long canal located in India. The NEC was built by India between 1965 and 1975 under the Gandak Treaty between Nepal and India. According to this treaty, India is supposed to supply 24.1 m3/s to the NEC regardless of demand, except during periods in April–May and November–December when the system would be shut down for maintenance.
The NEC runs from west to east for 81 km starting at the Nepal–India border (Figure 11). Deliveries are only made along the first 54 km to Blocks 1–10. Blocks 11 and 12 receive irrigation water on rare occasions, such as after heavy rainfall events when other farmers upstream reduce the flows into main secondary canals (MSCs). Blocks 13–15 in the Stage III area do not receive scheduled deliveries from the project. In these blocks, no infrastructure below the main canal has been developed by the project. The MSCs run north to south from the NEC for 3–11 km.
Since their establishment in 1993, WUAs have effectively taken over operation of the canals below the NEC level, while DOI operators have continued to operate officially only the NEC.

Mapping System and Services for Canal Operation Techniques in Nepal32
Blo
cks
13
–15
Blo
ck
11
–12
Tila
we
can
al
Par
sa D
istr
ict:
Blo
cks
1−6
CC
A =
16
000
ha
Bar
a D
istr
ict:
Blo
cks
7−12
CC
A =
12
700
ha
Rau
tah
at D
istr
ict:
Blo
cks
13−1
5
CC
A =
8 7
00 h
a
NE
C
inta
ke
FIG
UR
E 11
Gen
eral
layo
ut
of
the
Nar
ayan
i Irr
igat
ion
Sys
tem

Chapter 5 – MASSCOT in the Narayani Irrigation System 33
The NIS has suffered from having to operate underbudget. Almost no funding has been allocated for preventative maintenance in the project except for repairs to flood-related damage. At many points, siltation severely limits the carrying capacity of the canals. In several areas, tertiary canals have been abandoned. As a result of a proposal from NIS managers and RAP results, the DOI has recently (2005–06) allocated about Nr525.5 million (about US$7.3 million) for rehabilitation of the system. Rehabilitation work will include desilting of canals and repair of damaged structures.
MASSCOT STEPS IN THE NISStep 1. Rapid appraisal procedure (RAP)Objective: Initial rapid diagnosis and assessment through RAP or others. The primary objective of the rapid diagnosis is to obtain an initial sense of what and where the problems are, how they should be prioritized, etc. The second objective is to start mobilizing the energy of the actors (managers and users) for modernization. The third is to generate a baseline assessment, against which progress will have to be measured.
An RAP diagnostic evaluation was performed in different parts of the NIS in three days of intensive fieldwork in November 2003 (FAO, 2003b). The results of the RAP quantified the performance of the NIS in terms of the quality of water delivery service at each canal level in the system. Table 13 summarizes the internal indicators. These indicators show considerable potential for improvement, particularly in terms of the operation of the NEC and secondary canals. Operational aspects for improvement include both the organization and sharing of information, and also the installation of
TABLE 13Internal performance indicators for the Narayani Irrigation System, Nepal
Note: Maximum possible value = 4.0, minimum possible value = 0.0.
Narayani Irrigation Scheme Value
Actual water delivery service to individual ownership units (e.g. field or farm) 0.5
Stated water delivery service to individual ownership units (e.g. field or farm) 1.6
Actual water delivery service at the most downstream point in the system operated by a paid employee 0.4
Stated water delivery service at the most downstream point in the system operated by a paid employee 1.2
Actual water delivery service by the main canals to the second-level canals 0.4
Stated water delivery service by the main canals to the second-level canals 1.6
Social “order” in the canal system operated by paid employees 1.5
Main canal
Cross-regulator hardware (main canal) 1.7
Turnouts from the main canal 1.8
Regulating reservoirs in the main canal 0.0
Communications for the main canal 1.7
General conditions for the main canal 1.0
Operation of the main canal 0.5
Second-level canals (main secondary canal)
Cross-regulator hardware (second-level canals) 1.6
Turnouts from the second-level canals 1.0
Regulating reservoirs in the second-level canals 0.0
Communications for the second-level canals 1.4
General conditions for the second-level canals 1.0
Operation of the second-level canals 0.3
Third-level canals (branch secondary canal)
Cross-regulator hardware (third-level canals) 2.0
Turnouts from the third-level canals 0.7
Regulating reservoirs in the third-level canals 0.0
Communications for the third-level canals 0.6
General conditions for the third-level canals 1.0
Operation of the third-level canals 0.0
Mapping System and Services for Canal Operation Techniques in Nepal34
proper control structures to allow operators to control water distribution effectively under a wide range of flows. The main findings of the RAP were:
The present operation of the NEC results in severe inequities in large parts of the project including the service areas of Blocks 10–12 in Stage II. The design of the main canal cross-regulators (manually operated, vertical steel gates with no side weirs) makes it difficult to maintain constant upstream water levels, this is further compounded by the poor operation of the MSC offtakes.The water delivery service is relatively poor at all levels of the NIS. Part of the reason for the less than adequate quality of service is related to the hydraulic characteristics and condition of the cross-regulators in the MSCs and branch secondary canals (BSCs).The actual level of service provided by the NEC was worse than at the individual field level (0.4 vs 0.5). This was partly because of the extreme unreliability of the flows from the NEC, which was judged to occur more than half the time. The same unreliability would similarly affect deliveries at the field level. However, because many farmers at these lower levels had no expectation of irrigation water from the canal system, they did not consider it unusual when deliveries were irregular or infrequent.The internal performance indicators associated with operation of the system were very low mainly because of the almost complete lack of a meaningful operations programme. In addition, the types of control structures in the project make it difficult to control water simply under different and constantly varying flow rates. Thus, even if there were an operations plan, the existing cross-regulator and offtake design in many places would not be adequate for effective control of water distribution and deliveries. Therefore, the modernization recommendations include both management and structural changes that are needed as part of the new water management strategies.The MSC and BSC control structures are not adequate for providing good service.The general condition of the NEC and MSCs was poor throughout the project except in Block 1, where maintenance and desilting was carried out in 2002. There were extensive problems with the maintenance of the canal banks and floor, and deterioration of various structures owing to a lack of preventative maintenance. Many of the canals had not been maintained or desilted in the last ten years.Most of the water measurement structures in the project (Parshall flumes) are inaccurate, and the monitoring activities have not been integrated into an effective operations plan. Flows are only measured at the NEC intake regulator.Past rehabilitation efforts have had little positive impact on the service provided to water users, even though some modifications were made with substantial investment.While the project managers were generally aware of the poor conditions in the system, the actual performance of the project was found to be considerably worse in several respects.There are large uncertainties in the water-balance and production-related datasets analysed as part of the RAP that should be refined as part of an enhanced monitoring programme.There is potential for expanding groundwater use in certain areas of the project, but further testing is necessary in order to ensure that arsenic is not present in any new wells.The adoption of modern on-farm water management practices and crop diversification at Narayani will only be possible after the successful implementation of a modernization programme that addresses existing operational constraints with effective water control and monitoring throughout the system.

Chapter 5 – MASSCOT in the Narayani Irrigation System 35
Step 2. System capacity and sensitivityObjectives: One objective is to assess the physical capacity of irrigation structures to perform their function of transport, control, measurement, etc. A second objective is to assess the sensitivity of irrigation structures (offtakes and regulators), identification of singular points. A third objective is to map the sensitivity.
Intake capacityThe design capacity of the NEC is 24.1 m3/second. However, previous consultant reports have indicated that the actual intake (head regulator) capacity may be somewhat less owing to the available head at the intake structure, which is further worsened by siltation in the first reach of the canal. A major source of concern is the lack of communication and trust between managers of the NEC and their Indian counterparts, who supply water to the NEC. There is disagreement on the discharge coefficient used and the method of calibration of the head regulator of the NEC canal. This problem needs to be resolved and an effective monitoring of the daily discharges is required for better management. One option for efficient and transparent discharge monitoring is the installation of automatic sensors at the NEC intake.
An additional water supply of about 7 m3/second (design discharge) is diverted from the Tilawe River through the Tilawe canals. The Tilawe barrage has also suffered from lack of maintenance; its sluice gates are in need of repair. Daily discharges and water level are not recorded. However, variation in daily discharges is a common phenomenon. The Tilawe canal system is designed in such a way that, if and when needed, the canals can discharge into the NEC and vice versa.
Considering the criterion that has recently been set by the DOI of allocating 1 litre/second/ha, not all the command area can be supplied, particularly in the dry season, with the existing available water of about 31.1 m3/second (24.1 m3/second from the NEC + 7 m3/second from the Tilawe River). To achieve the DOI allocation criteria would require a total discharge of 37.4 m3/second. Thus, at present, there is a deficit of more than 6.3 m3/second. Augmenting water from natural streams and rivers flowing through the command area seems a viable option that should be explored.
Conveyance capacityThe conveyance capacity of the NEC is relatively better in the head reach (canal running through Parsa District, about 25 km), it deteriorates in the middle (canal running through Bara District, about 35 km) and tail sections (canal running through Rautahat District, about 21 km).
According to NIS managers, the canal capacity of the NEC is:Parsa: 75 percent;Bara: 45 percent;Rautahat: 10 percent.
The reason for such a low carrying canal capacity in Rautahat District (Blocks 13–15) is that the canal is almost never used to transport water.
The conveyance capacity of second- and third-level canals is not a major problem in Blocks 1–6, but it has been reduced significantly (by about 50 percent) in Blocks 7–12. There are no second- or third-level canals in Blocks 13–15.
Control capacityThe NEC cross-regulators are vertical, screw-driven, manually operated, steel gates. There are a total of 13 cross-regulators, most adjacent to the outlets of the MSCs. Water-level fluctuations of up to 25–30 cm occur on a regular basis at some structures. None of the cross-regulators has side overflow weirs, which would improve water-level control. During the RAP exercise, gate operators reported that they attempt to maintain a target water level using the staff gauge. In the Stage II area, the target water

Mapping System and Services for Canal Operation Techniques in Nepal36
levels are being maintained well below the design full-supply level.
A single operator may be in charge of several cross-regulators. The gates are generally in good condition, with a combination of the original hand-wheel lifting mechanisms and newer gearboxes installed in Stage I. It can take up to one hour to make a significant gate adjustment. Operators do not record any information about flows or staff-gauge readings.
Uncontrolled water-level fluctuations are also common in the second- and third-level canals. However, because many of the secondary cross-regulator gates have been replaced with small concrete weirs, they are easy to operate physically even if they do require some adjustments with a flashboard. A better analysis of control capacity at the second and third level of canals is required for meaningful recommendations.
Distribution capacityThe system consists of the main canal (the NEC), MSCs, BSCs, tertiary canals, and field canals (Figure 12). The system was constructed in three stages:
Stage I: The system was constructed from Blocks 1–6 with main canals equipped with control (cross-regulators) and gated diversion structures. Figure 12 presents a typical layout of the system constructed in the Stage I of the project.Stage II: Blocks 7–12 constructed. The design was similar to that of Stage I but no tertiary canals were installed.Stage III: Only the main canal constructed for Blocks 12–15. No further infrastructure has been installed. Therefore, this part of the system has never been effectively under the command area of the irrigation scheme.The headworks of each MSC consist
of vertical, screw-driven, manually operated, steel gates similar to the main
Nepal eastern canal
Mainsecondary
canal
Branch secondary canal
Tertiary canal30-40 ha
Field canal7.5 ha
gated
Divisionbox
gated
gated
FIGURE 12Stage I – Canal layout in the NIS
Plate 8A few of the remaining original tertiary canal control gates in the NIS.
Plate 9Ungated reduced diameter pipe outlet in the NIS.
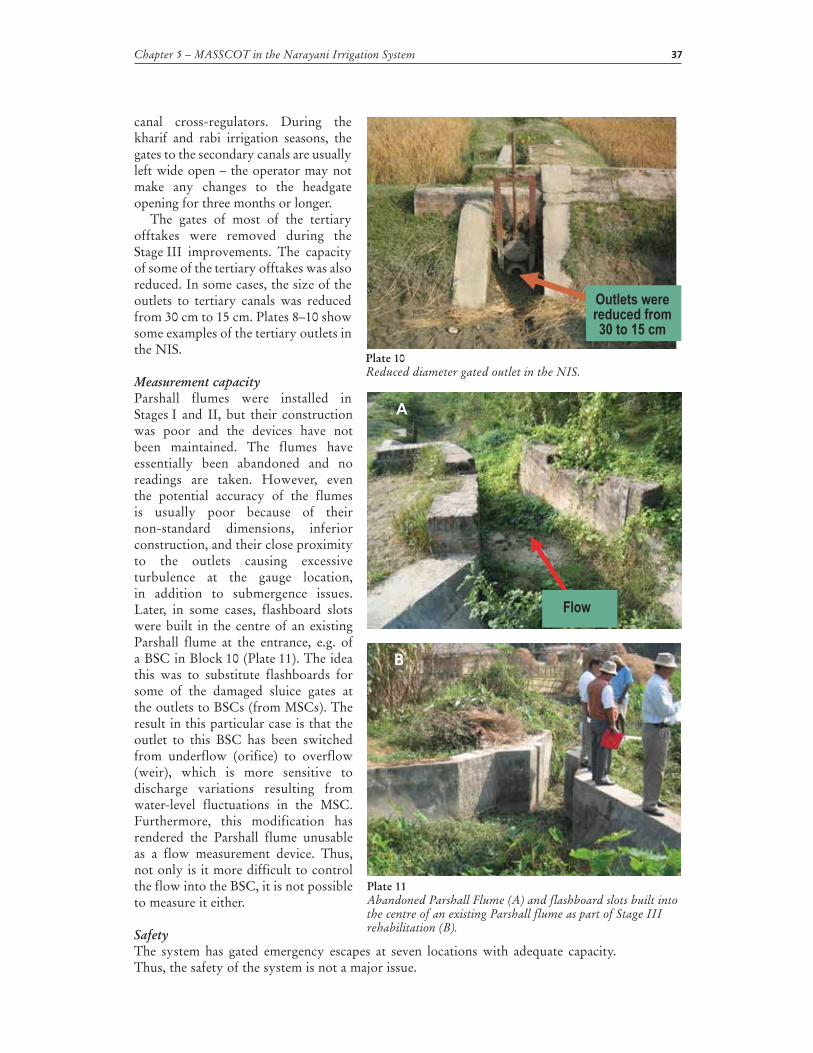
Chapter 5 – MASSCOT in the Narayani Irrigation System 37
canal cross-regulators. During the kharif and rabi irrigation seasons, the gates to the secondary canals are usually left wide open – the operator may not make any changes to the headgate opening for three months or longer.
The gates of most of the tertiary offtakes were removed during the Stage III improvements. The capacity of some of the tertiary offtakes was also reduced. In some cases, the size of the outlets to tertiary canals was reduced from 30 cm to 15 cm. Plates 8–10 show some examples of the tertiary outlets in the NIS.
Measurement capacityParshall flumes were installed in Stages I and II, but their construction was poor and the devices have not been maintained. The flumes have essentially been abandoned and no readings are taken. However, even the potential accuracy of the flumes is usually poor because of their non-standard dimensions, inferior construction, and their close proximity to the outlets causing excessive turbulence at the gauge location, in addition to submergence issues. Later, in some cases, flashboard slots were built in the centre of an existing Parshall flume at the entrance, e.g. of a BSC in Block 10 (Plate 11). The idea this was to substitute flashboards for some of the damaged sluice gates at the outlets to BSCs (from MSCs). The result in this particular case is that the outlet to this BSC has been switched from underflow (orifice) to overflow (weir), which is more sensitive to discharge variations resulting from water-level fluctuations in the MSC. Furthermore, this modification has rendered the Parshall flume unusable as a flow measurement device. Thus, not only is it more difficult to control the flow into the BSC, it is not possible to measure it either.
SafetyThe system has gated emergency escapes at seven locations with adequate capacity. Thus, the safety of the system is not a major issue.
Outlets werereduced from30 to 15 cm
Plate 10Reduced diameter gated outlet in the NIS.
Flow
Plate 11Abandoned Parshall Flume (A) and flashboard slots built into the centre of an existing Parshall flume as part of Stage III rehabilitation (B).
A
B
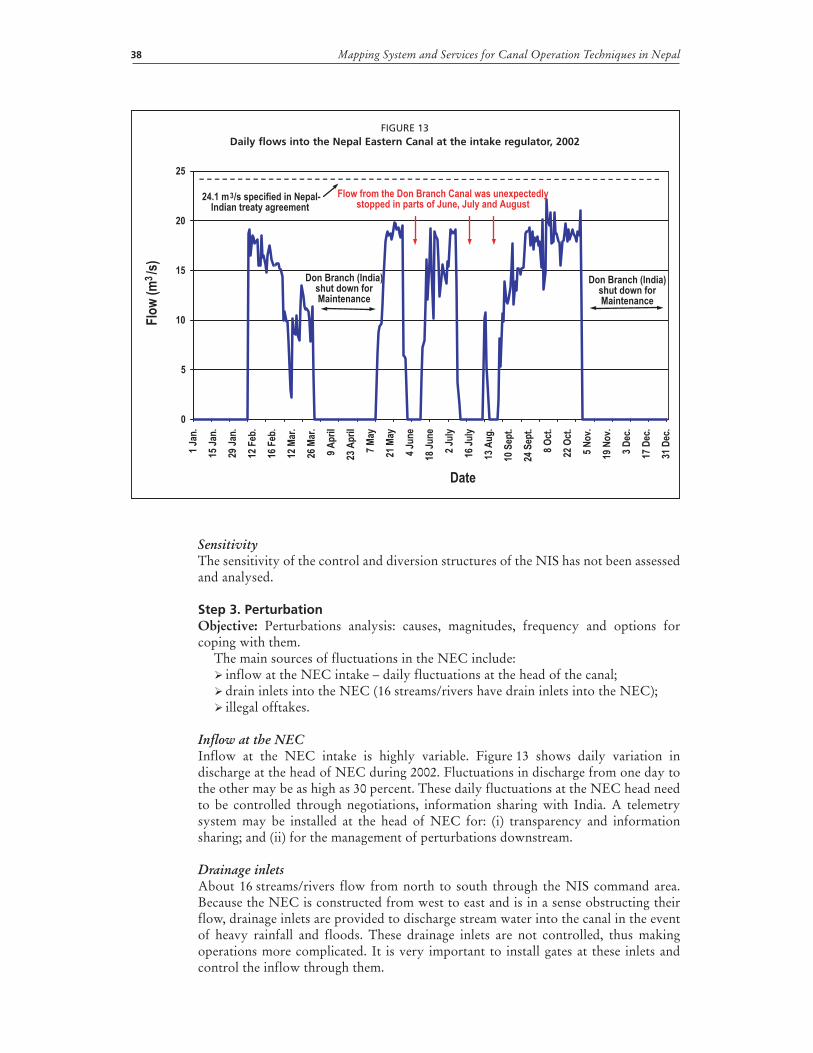
Mapping System and Services for Canal Operation Techniques in Nepal38
SensitivityThe sensitivity of the control and diversion structures of the NIS has not been assessed and analysed.
Step 3. PerturbationObjective: Perturbations analysis: causes, magnitudes, frequency and options for coping with them.
The main sources of fluctuations in the NEC include:inflow at the NEC intake – daily fluctuations at the head of the canal;drain inlets into the NEC (16 streams/rivers have drain inlets into the NEC);illegal offtakes.
Inflow at the NECInflow at the NEC intake is highly variable. Figure 13 shows daily variation in discharge at the head of NEC during 2002. Fluctuations in discharge from one day to the other may be as high as 30 percent. These daily fluctuations at the NEC head need to be controlled through negotiations, information sharing with India. A telemetry system may be installed at the head of NEC for: (i) transparency and information sharing; and (ii) for the management of perturbations downstream.
Drainage inletsAbout 16 streams/rivers flow from north to south through the NIS command area. Because the NEC is constructed from west to east and is in a sense obstructing their flow, drainage inlets are provided to discharge stream water into the canal in the event of heavy rainfall and floods. These drainage inlets are not controlled, thus making operations more complicated. It is very important to install gates at these inlets and control the inflow through them.
0
5
10
15
20
25
3
24.1 m /s specified in Nepal-Indian treaty agreement
Don Branch (India)shut down forMaintenance
Don Branch (India)shut down forMaintenance
Flow from the Don Branch Canal was unexpectedlystopped in parts of June, July and August
1 Ja
n.
15 J
an.
29 J
an.
12 F
eb.
16 F
eb.
12 M
ar.
26 M
ar.
9 A
pri
l
23 A
pri
l
7 M
ay
21 M
ay
4 Ju
ne
18 J
un
e
2 Ju
ly
16 J
uly
13 A
ug
.
10 S
ept.
24 S
ept.
8 O
ct.
22 O
ct.
5 N
ov.
19 N
ov.
3 D
ec.
17 D
ec.
31 D
ec.
Flo
w (
m /
s)
3
Date
FIGURE 13Daily flows into the Nepal Eastern Canal at the intake regulator, 2002

Chapter 5 – MASSCOT in the Narayani Irrigation System 39
Illegal water use outside the NIS command area Another source of perturbation in the NEC is the illegal pumping of water. Farmers from outside the command area on the north side of the canal are pumping water illegally to irrigate their fields. Although the magnitude of the water pumped is not known, numerous pumps are located along the NEC (Plate 12).
Perturbations at secondary and tertiary levelThe extent of fluctuations in the secondary and tertiary canal systems is not known because no data have been recorded at this level.
Perturbations at the Tilawe canalFluctuations at the Tilawe canal are unknown as no water-level or discharge data is available.
ConclusionThe main feature of the NIS regarding perturbations is the high fluctuations at several intakes along the main canal.
Step 4. Mapping water networks and water balance/accountingObjective: The objective is to map the nature and structure of all the streams and flows that affect and are influenced by the command area. It includes assessing the hierarchical structure and the main features of the irrigation and drainage networks, natural surface streams and groundwater, and the mapping of the opportunities and constraints, including drainage and recycling facilities.
Surface waterMost of above-mentioned 16 streams have drain outlets in the NEC. This exacerbates perturbations in the canal during the rainy season. The present management units below the main canal are based on the division of command areas among these streams/rives (Figure 14). Water from the Tilawe River is already used to irrigate part of the command area of the NEC.
These streams are a valuable source of water that should be utilized to supply water to the downstream part of the system. However, information on the discharges of these streams is not available. According to DOI staff, the dry discharge of these streams has been measured and is enough to supply water to the tail parts of the system.
NIS managers have already proposed taking water from the Jamuni River. The Jamuni River can supply an estimated 4 m3/second. However, this discharge alone is not enough to provide 1 litre/second/ha to the last three blocks of the command area, which are currently not receiving any surface water supply.
There is great potential to augment the water supply with water from the streams/rivers flowing through the command area of the NIS. Priority must be given to identifying the most suitable ones, particularly in the middle and tail reaches of the canal command areas.
Fiels north of theNEC outside thecommand area
Numerous pumpsare located along
the NEC
Plate 12Farmers pumping out of the NEC to areas outside the project.

Mapping System and Services for Canal Operation Techniques in Nepal40
Blo
ck 1
Blo
ck 2
Blo
ck 3
Blo
ck 4
Blo
ck 5
Blo
ck 6
Blo
ck 7
Blo
ck 8
Blo
ck 9
Blo
ck 1
0
Blo
ck 1
1
Blo
ck 1
3B
lock
14
Blo
ck 1
5
Blo
ck 1
2
Tila
we
Riv
erS
trea
ms/
rive
rs
Jam
un
i Riv
er
FIG
UR
E 14
Blo
ck b
ou
nd
arie
s an
d s
trea
ms/
rive
rs in
th
e N
IS

Chapter 5 – MASSCOT in the Narayani Irrigation System 41
GroundwaterFarmers use shallow tubewells for irrigation and domestic use in the tail reaches of the canal command from Block 10 to 15 (Plate 13). Recent studies (FAO, 2004) have shown that there is a major problem of arsenic contamination in the districts (Bara and Rautahat) containing Blocks 10–15. This situation is alarming and efforts are needed to improve surface water supply to these areas in order to decrease water users’ dependency on groundwater.
Water balanceAccording to a rough estimate, the total water requirement of the command area (Blocks 1–12) for 2002 was 277 million m3, whereas total water availability was 328 million m3 (plus the rainfall that usually falls between May and September). Although these figures are not based on accurate numbers, they still show that the available water exceeds the current actual crop water need. Improved operation and management will lead to increased cropping intensity in the command area. However, more water, better infrastructure and stronger management and operation are required in order to supply water to the tail reach of the canal, especially if the target of three crops per year is to be realized in the whole command area and not only in the head reach.
Step 5. Service to usersObjective: Mapping existing and possible options for services to users with consideration to farmers and crops as well as to other users of water.
Generally, in the NIS command area, canal water supply is used only for irrigation (crop production).
The current service to users is highly inequitable, unreliable, inflexible and, in many cases, inadequate (Table 13). There are major differences in water service to the users/farmers at the head reach of the canal system and the rest of the command area. Blocks 1–9 receive a reasonable water supply (although there are differences in the water supply within these blocks). Blocks 10–12 receive water only in the rainy season, while Blocks 12–15 never receive any water.
The current service is not adequate to achieve the national goal of providing the users with a possibility of year-round irrigation. Table 14 outlines the service to
Plate 13Farmers use shallow and deep tubewells in many areas not served effectively by the canal system.
TABLE 14Crop-oriented service considerations in the NISSeason Main crops grown Service required Constraint
Monsoon Rice Homogeneous.
Spread over the entire GCA.
Full supply, full demand
Winter and spring Wheat,
spring rice,
maize,
vegetables,
other field crops (lentils, oilseeds)
Limited area.
Frequent irrigation to cope with sensitive crops.
Variable needs.
Limited supply to be spread all over the GCA
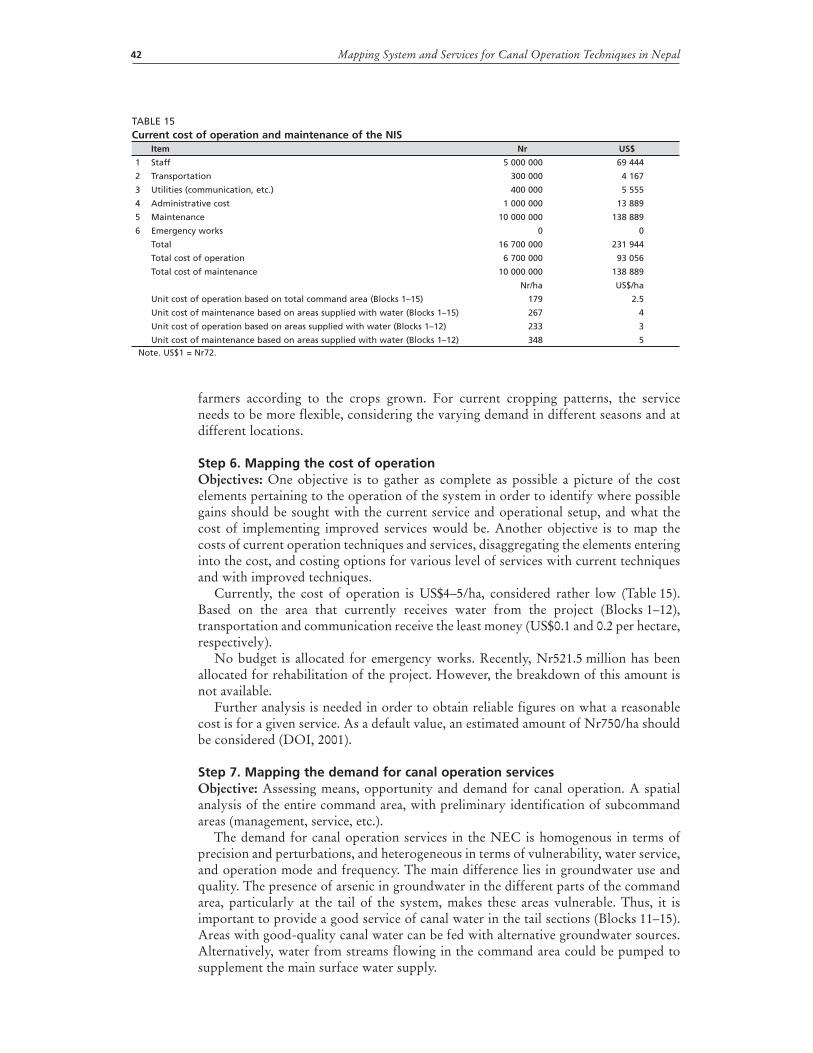
Mapping System and Services for Canal Operation Techniques in Nepal42
farmers according to the crops grown. For current cropping patterns, the service needs to be more flexible, considering the varying demand in different seasons and at different locations.
Step 6. Mapping the cost of operationObjectives: One objective is to gather as complete as possible a picture of the cost elements pertaining to the operation of the system in order to identify where possible gains should be sought with the current service and operational setup, and what the cost of implementing improved services would be. Another objective is to map the costs of current operation techniques and services, disaggregating the elements entering into the cost, and costing options for various level of services with current techniques and with improved techniques.
Currently, the cost of operation is US$4–5/ha, considered rather low (Table 15). Based on the area that currently receives water from the project (Blocks 1–12), transportation and communication receive the least money (US$0.1 and 0.2 per hectare, respectively).
No budget is allocated for emergency works. Recently, Nr521.5 million has been allocated for rehabilitation of the project. However, the breakdown of this amount is not available.
Further analysis is needed in order to obtain reliable figures on what a reasonable cost is for a given service. As a default value, an estimated amount of Nr750/ha should be considered (DOI, 2001).
Step 7. Mapping the demand for canal operation servicesObjective: Assessing means, opportunity and demand for canal operation. A spatial analysis of the entire command area, with preliminary identification of subcommand areas (management, service, etc.).
The demand for canal operation services in the NEC is homogenous in terms of precision and perturbations, and heterogeneous in terms of vulnerability, water service, and operation mode and frequency. The main difference lies in groundwater use and quality. The presence of arsenic in groundwater in the different parts of the command area, particularly at the tail of the system, makes these areas vulnerable. Thus, it is important to provide a good service of canal water in the tail sections (Blocks 11–15). Areas with good-quality canal water can be fed with alternative groundwater sources. Alternatively, water from streams flowing in the command area could be pumped to supplement the main surface water supply.
TABLE 15Current cost of operation and maintenance of the NIS
Item Nr US$
1 Staff 5 000 000 69 444
2 Transportation 300 000 4 167
3 Utilities (communication, etc.) 400 000 5 555
4 Administrative cost 1 000 000 13 889
5 Maintenance 10 000 000 138 889
6 Emergency works 0 0
Total 16 700 000 231 944
Total cost of operation 6 700 000 93 056
Total cost of maintenance 10 000 000 138 889
Nr/ha US$/ha
Unit cost of operation based on total command area (Blocks 1–15) 179 2.5
Unit cost of maintenance based on areas supplied with water (Blocks 1–15) 267 4
Unit cost of operation based on areas supplied with water (Blocks 1–12) 233 3
Unit cost of maintenance based on areas supplied with water (Blocks 1–12) 348 5Note. US$1 = Nr72.

Chapter 5 – MASSCOT in the Narayani Irrigation System 43
Step 8. Partitioning in management unitsObjective: The irrigation system and the command area should be divided into subunits (subsystems and/or subcommand areas) that are held homogeneous, and/or separated from one another by a singular point or a particular borderline.
The existing management units (Figures 14 and 15) are:
agency managed and operated main canal (NEC);water-user managed and operated second- and third-level canals (MSCs and BSCs) in 15 blocks – at two levels (WUG and WUC).
The main canal is further subdivided into three units in line with the district boundaries (Parsa, Bara and Rautahat). The NIS command area in Rautahat District is never supplied with irrigation water, thus it is not included in the management and operation.
The paid employees of the DOI only operate the NEC, while farmers and remnants of WUAs operate everything below the NEC including the MSCs and BSCs. In fact, during the RAP (November 2003), it was determined that DOI operators really only enforced some level of control for brief periods when the NEC was near capacity at the peak of the season. The rest of time, it is not unusual for farmers to adjust cross-regulators in the NEC in order to maintain or increase diverted flows to the MSCs in the upper blocks when the NEC inflow from the Don Branch Canal drops (as was often apparently the case in 2002).
In the present management setup below the main canal, the management units are divided on the basis of the natural streams flowing through the command area. These units are of varying sizes, with some units below the NEC being small (1 000–2 000 ha), e.g. Blocks 4, 9 and 12, which result in too many management units in the system. Moreover, NIS managers have to deal with too many WUAs.
Proposed management unitsMain canal / DOI operationsAs the demand for operation and water delivery service is more or less homogenous in the command areas of MSCs offtaking from the NEC in Parsa and Bara Districts, and based on the proposed development of water resources from the Jamuni, Thalhi and Tier Rivers, the proposal is to:
Reduce the total length of the main canal (the NEC) from 81 km to about 60 km. The NEC stops where the last block (see below for proposed division into blocks) starts, i.e. at the Arwa River (Figure 16). The main canal (the current NEC) downstream of the Arwa River will become part of the management unit below the NEC and will be managed and operated by the water users organization (WUO) or their paid employee.Divide the NEC canal management into two units instead of three (in Figure 16, the thick blue line indicates the NEC and yellow dot shows the point of change from Unit 1 to Unit 2): from the head to the end of Block 3, i.e. Bangari Nadi; from the Bangari River to the Arwa River.
Nepal eastern canal
Mainsecondary
canal
Branch secondary canal
Tertiary canal30-40 ha
Management Unit Level 2 −Farmer managed
Management Unit Level 1 −Agency managed
Field canal7.5 ha
gated
Divisionbox
(500−700 ha)
(2 000−3 000 ha)
gated
gated
FIGURE 15NIS management units, levels 1 and 2
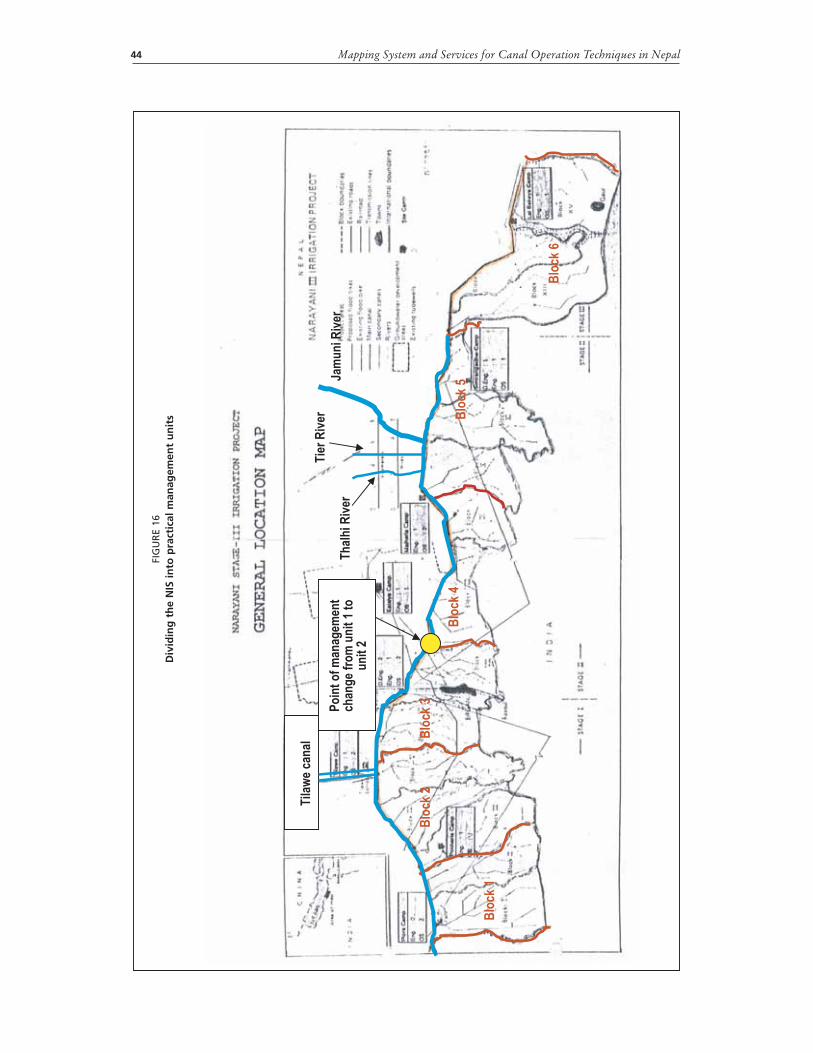
Mapping System and Services for Canal Operation Techniques in Nepal44
Blo
ck 1
Blo
ck 2
B
lock
3
Blo
ck 4
Blo
ck 5
Blo
ck 6
Th
alh
i Riv
er
Tila
we
can
al
Po
int
of
man
agem
ent
chan
ge
fro
m u
nit
1 t
ou
nit
2
Tie
r R
iver
Jam
un
i Riv
er
FIG
UR
E 16
Div
idin
g t
he
NIS
into
pra
ctic
al m
anag
emen
t u
nit
s
Chapter 5 – MASSCOT in the Narayani Irrigation System 45
Each of the proposed units is about 30 km long and has about 12 delivery points and will deliver water to 3 WUOs (see below for details on blocks and WUOs).
The manager of Unit 1 will manage and operate the infrastructure of the NEC and Tilawe canal system, where as the manager of Unit 2 will manage and operate the infrastructure of the NEC and the new facilities at the Jamuni and other rivers.
Where managers have to practise rotation among the canals, it should be done within the management units of the NEC. For example, the NEC management of Unit 1 will enforce rotation among the WUOs within Unit 1. This will imply that water is always flowing down to the second part of the main canal (second NEC unit) and could reach proposed Blocks 5 and 6.
For effective management of these units it is very important that the managers of both the units know exactly how much water is entering into their management units. In particular the manager of the unit 2 needs to know how much water is delivered to him by the unit 1 upstream and also from the new proposed facilities.
Below the main canalIn order to enable effective management and viable and strong WUAs, the proposal is to merge some of the management units and have a total of 6 blocks (instead of 15). Figure 16 shows the proposed blocks.
In the proposed setup, each management unit (or block) should be about 5 000–6000 ha with multiple MSCs and one strong WUO, having representatives from all the MSCs, at the block level dealing and negotiating with the management of the NEC (NIS managers). NEC managers will provide water to multiple MSCs on the basis of allocations made by the WUO and communicated to them. For example, if a WUO with more than one MSC wants to divert all the water to only one MSC, it should be possible to do so. The WUO can then hire an engineer or a technician to operate the MSCs and BSCs.
Step 9. Canal operation improvementsObjective: Identify improvement options for each management unit contemplated, focusing on: (i) water management; (ii) water control; and (iii) canal operation (service and cost-effectiveness).
Only the main canal has been comprehensively assessed so far, so the recommendations will focus mainly on the NEC level.
It is highly recommended that the MASSCOT approach be run for each secondary system.
Management setupManagement and operation of the NEC should remain with the DOI. With the proposal to shorten the length of the main canal to about 60 km, the main canal should stop at the starting point of the last block.
It is best to divide the NEC into two units (see above for details) with one engineer and one or more assistants responsible for the management and operation of each unit. Communication and information sharing between the two managers is a must for effective and efficient management.
In the proposed management set-up the management unit 1 will a) manage and operate the irrigation facilities in unit 1; and b) deliver agreed upon water to the unit 2 at the point of management change from unit 1 to unit 2 (see figure 16). The management unit 2 will manage and operate the existing as well as new proposed facilities in management unit 2. In this case it is important to have a measurement device at the point of management change.
The system below the main canal will be divided into six management units (see above) with a WUO in each block. The decisions regarding water allocation to
Mapping System and Services for Canal Operation Techniques in Nepal46
different MSCs within a block will be made by the WUO. However, water delivery to these MSCs will be made by NEC managers.
Canal operationsOperation of the NEC needs to be improved significantly. There is a need to develop specific regulations and enforcement mechanisms for the operation of structures in the NEC. Similarly, a set of indicators as well as tolerance limits needs to be established for each cross-regulator and the offtake structures of NEC. This requires that the sensitivity of these structures be assessed.
Management and canal operations for additional water resourcesAdditional water resources need to be developed to serve the entire command area, in particular the tail portion. It is recommended here to develop these additional water resources in the management unit 2 by diverting water from existing natural streams crossing the main canal. Thus the proposed additional water resources will be managed by NIS staff, of the proposed management Unit 2. Water developed through these new facilities will be in addition to the water delivered by Unit 1. Thus, the manager of Unit 2 will not be only dependent on water coming from upstream in the NEC but will have flexibility in organizing water delivery to the two blocks downstream of the additional sources.
The easiest and the cheapest way to transport and distribute this additional water is to use the existing NEC canal, which should also be repaired and rehabilitated where necessary. Two options, with different infrastructure and budget requirement and implications on operation and management of the facilities could be considered for the development of the water resources and related operations of the new facilities:
Option A: If the topography of the area allows, diversion weir and gravity canals are constructed on each of the three proposed streams, that deliver water to the main canal of NEC, the one similar to the Tilawe canal system, but without their own independent distribution network. The infrastructure should be such that the inflow into NEC could be controlled properly. However, the maximum intake will be limited to the capacity of the new facilities and existing canal, i.e. NEC. The design capacity of the new facilities will depend on 1) the available water source and 2) budget required for the development of these facilities in relation to the benefits gained from them.
Water management strategy with this option is to feed as much water into the system as possible without jeopardizing the safety of the canal and then flush the surplus over the distributaries needs through drains and escapes. This will not put too much pressure on the manager for matching the actual and agreed-upon water delivery to the WUOs.
Option B: Water from the proposed streams is pumped directly into the NEC and then delivered to different blocks. The cost of pumping, the capacity of existing NEC, and budget to develop and operate the pumping facilities need to be carefully considered. Because of the high pumping cost, the amount of water pumped needs to be minimised and therefore measured and monitored carefully. This requires investments in water measurement devices or technologies, such as telemetry at each new facility or at a nearby point downstream of these facilities. The manager should know exactly how much water is to be pumped to keep the cost of pumping at a reasonable level.
The water management strategy here is to pump only that amount of water which is required to deliver agreed upon service to different WUO/Blocks.
TelemetryInstallation of automatic sensors (or a telemetry system) at the head of the NEC will help avoid any misunderstandings and build trust with Indian counterparts. It will also help in: transparency; perturbation management; water allocation and distribution;
Chapter 5 – MASSCOT in the Narayani Irrigation System 47
and water accounting at the system level. It is also recommended that these sensors be installed at the Tilawe canal intake and other intakes if additional water supply is drawn from streams/rivers.
Additional water resourcesAdditional water for irrigation is required in order to achieve: (i) allocation of 1 litre/second/ha; and (ii) availability of water for year-round irrigation. According to a rough estimate, 37.4 m3/second is required in order to provide 1 litre/second/ha to entire command area, of which 31.1 m3/second is currently available. The remaining 6.3 m3/second needs to be acquired from other sources. One option is to tap water from three streams: Jamuni River, Thalhi River, and Tier River (see Figures 14 and 15). These rivers were identified as potential streams for augmenting surface water during the RAP workshop in November 2003. The dry discharge of the Jamuni River is about 4 m3/second, whereas the dry discharge of the other needs to be measured.
Infrastructure development and rehabilitationPart of the system is in serious need of rehabilitation and infrastructure development. For example, second- and third-level canals need to be installed in Blocks 12–15 of the existing management setup.
Measurement devicesParshall flumes need to be repaired and recalibrated.
Sensitivity analysisSensitivity analysis of the cross-regulators and offtakes should be done in order to: (i) check the capacity of the structures to control and divert a wide range of discharges; and (ii) devise an appropriate plan for these structures.
Step 10. Aggregating and consolidatingMore data and analysis are required. Therefore, Step 10 cannot be performed at this time.


49
Chapter 6
Concluding remarks
This document highlights the value of RAP, benchmarking and MASSCOT in defining reliable and practical options for modernization.
It also shows that only a systematic approach can bring about consistent improvements for the anticipated new management units. To date, only the RAP has been comprehensive. The World Bank benchmarking exercise examined only the SMIS and a limited part of the command area, and the MASSCOT approach examined only on the main canal in the SMIS and the NIS.
Therefore, the main conclusion of this report is that more analysis is needed, particularly at the subsystem level, and that this should be a prerequisite for modernization projects.
In order to help formulate a comprehensive improvement plan for the two systems, Tables 16 and 17 present what has been done, what has not been done and what remains incomplete. In general, both systems would require about three months more work each in order to conduct a comprehensive analysis and formulate an improvement
TABLE 16MASSCOT steps completed, not done or incomplete in the SMIS, and time required for their completion
MASSCOT steps/ components Management units in SMIS
Main-canal level
Main canal: CMC Second-level canal Third-level canal
1 RAP done done done
2 Capacity analysis done done done
Sensitivity analysis done not done not done
3 Perturbations done done incomplete
4 Water networks – water balance
CMC (discharge/volume)
rainfall
streams (discharge/volume)
recycling facilities
groundwater (use, quality)
water balance done
5 Services to users done done done
Multiple uses of water done done done
6 Cost of operation incomplete incomplete incomplete
7 Demand for operation done incomplete incomplete
8 Management units done done incomplete
9 Improvements in different units done incomplete incomplete
10 Aggregating incomplete incomplete incomplete
Special step
Systematic benchmarking done incomplete incomplete
Overall time required to complete the analysis and improvement plan for MASSCOT
about 5 working days = 1 week (not enough if measurements are to be done for discharges)
about 5 working days for each unit =
5 × 7 = 35 days = 7 weeks
+ 1 week for report writing
Time required for systematic benchmarking
if data available
if data is unavailable2 weeks
?
Total time required for completing MASSCOT, report writing and completing systematic benchmarking
completing MASSCOT + report writing + systematic benchmarking =
1 + 7 + 1 + 2 = 11 weeks (2.75 months)
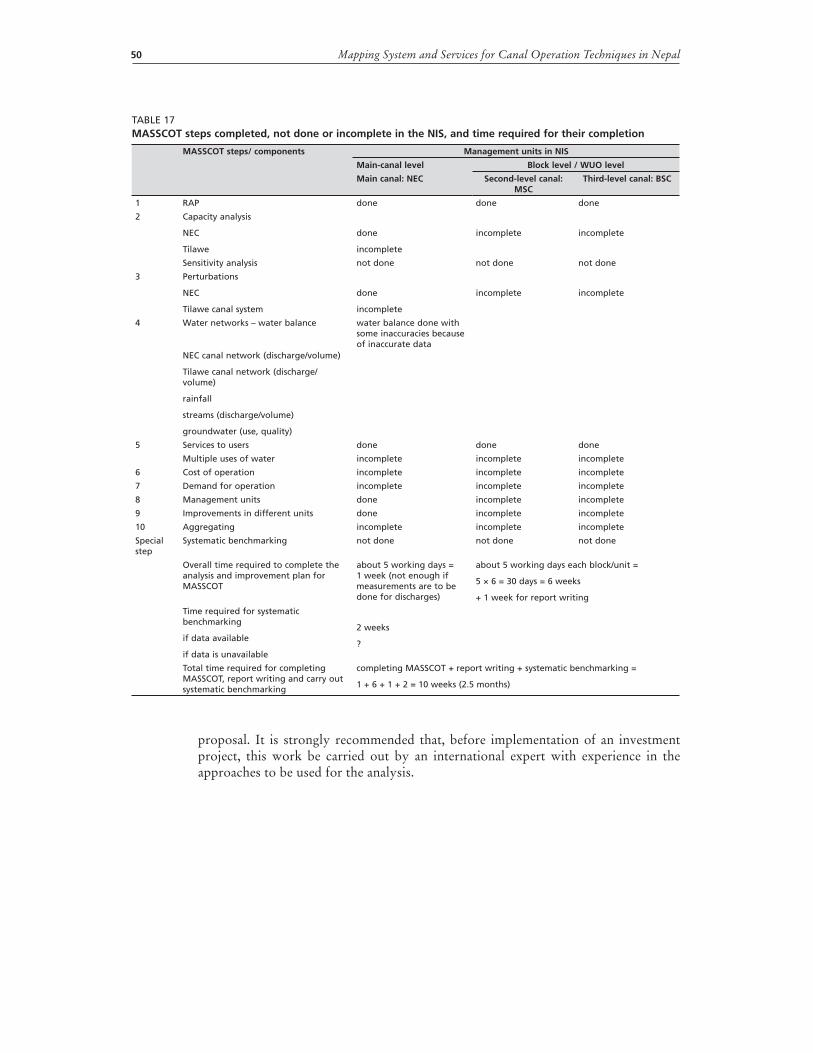
Mapping System and Services for Canal Operation Techniques in Nepal50
proposal. It is strongly recommended that, before implementation of an investment project, this work be carried out by an international expert with experience in the approaches to be used for the analysis.
TABLE 17MASSCOT steps completed, not done or incomplete in the NIS, and time required for their completion
MASSCOT steps/ components Management units in NIS
Main-canal level Block level / WUO level
Main canal: NEC Second-level canal: MSC
Third-level canal: BSC
1 RAP done done done
2 Capacity analysis
NEC
Tilawe
done
incomplete
incomplete incomplete
Sensitivity analysis not done not done not done
3 Perturbations
NEC
Tilawe canal system
done
incomplete
incomplete incomplete
4 Water networks – water balance
NEC canal network (discharge/volume)
Tilawe canal network (discharge/volume)
rainfall
streams (discharge/volume)
groundwater (use, quality)
water balance done with some inaccuracies because of inaccurate data
5 Services to users done done done
Multiple uses of water incomplete incomplete incomplete
6 Cost of operation incomplete incomplete incomplete
7 Demand for operation incomplete incomplete incomplete
8 Management units done incomplete incomplete
9 Improvements in different units done incomplete incomplete
10 Aggregating incomplete incomplete incomplete
Special step
Systematic benchmarking not done not done not done
Overall time required to complete the analysis and improvement plan for MASSCOT
about 5 working days = 1 week (not enough if measurements are to be done for discharges)
about 5 working days each block/unit =
5 × 6 = 30 days = 6 weeks
+ 1 week for report writing
Time required for systematic benchmarking
if data available
if data is unavailable
2 weeks
?
Total time required for completing MASSCOT, report writing and carry out systematic benchmarking
completing MASSCOT + report writing + systematic benchmarking =
1 + 6 + 1 + 2 = 10 weeks (2.5 months)
51
References
Department of Irrigation (DOI). 2001. Irrigation operation and maintenance (O&M)
cost and water charge recovery study. Nepal Irrigation Sector Project. Phase II main report.
FAO. 2003a. Report on training workshop on irrigation modernization, management
improvement, and benchmarking: Sunsari Morang Irrigation Project, by B. Freeman (ITRC). Nepal Irrigation Sector Project On-Farm Water Management Programme DOI/DOA/FAO Biratnagar, Nepal, May 2003.
FAO. 2003b. Report on training workshop on irrigation modernization of irrigation
management for integrated water resources management, women’s participation, and
vulnerable groups development in Narayani Irrigation Project, by B. Freeman (ITRC). DOI/ FAO Birganj, Nepal, November 2003.
FAO. 2004. Arsenic threat and irrigation management in Nepal: preliminary findings from
the Narayani Irrigation Command Area, by S. Sijapati, B. Pradhan & U. Parajuli.FAO. 2006. Report on workshop on Irrigation Modernization, Mapping System and Service
for Canal Operation Technique (MASSCOT); Sunsari Morang Irrigation Project and
Narayani Irrigation System, Nepal.FAO/World Bank. 2002. Rapid appraisal process and benchmarking, explanation and tools,
by C. Burt (ITRC).International Programme for Technology and Research in Irrigation and Drainage
(IPTRID) / World Bank. 2000. Benchmarking performance in the irrigation and
drainage sector, by H. Milano & M. Burton.Pradhan, P., Sijapati, S., Ridell, N. & Prasad, K.C. 1998. Evaluation of management
transfer performance and process: irrigation service fee in Nepal.Tamrakar, S. 2004. Modernizing water service for IWRM: Sunsari Morang Irrigation
Project. Delft, Netherlands, IHE. (MSc thesis)World Bank / Bank Netherlands Water Partnership Program (BNWPP). 2005. Irrigation
benchmarking – proceedings of training workshop on Sunsari Morang Irrigation System, by A.M. Singh & B.R. Adhikari, eds. Department of Irrigation of the World Bank / BNWPP.

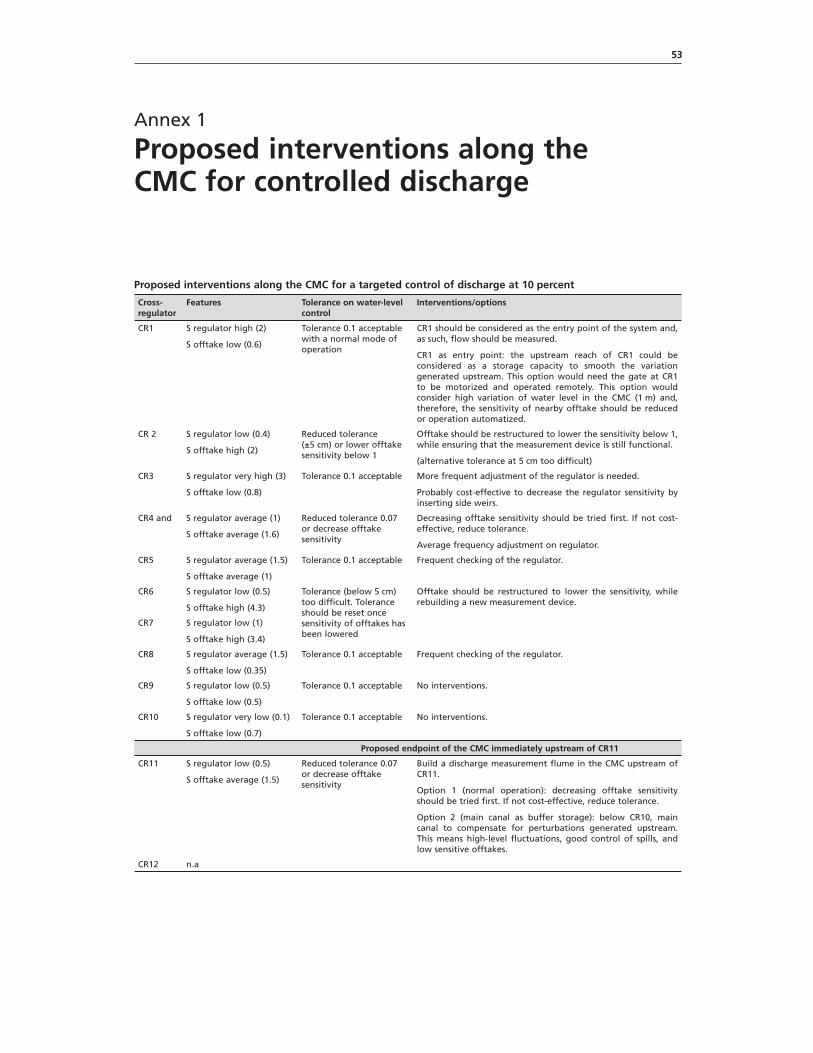
53
Annex 1
Proposed interventions along the CMC for controlled discharge
Proposed interventions along the CMC for a targeted control of discharge at 10 percent
Cross-regulator
Features Tolerance on water-level control
Interventions/options
CR1 S regulator high (2)
S offtake low (0.6)
Tolerance 0.1 acceptable with a normal mode of operation
CR1 should be considered as the entry point of the system and, as such, flow should be measured.
CR1 as entry point: the upstream reach of CR1 could be considered as a storage capacity to smooth the variation generated upstream. This option would need the gate at CR1 to be motorized and operated remotely. This option would consider high variation of water level in the CMC (1 m) and, therefore, the sensitivity of nearby offtake should be reduced or operation automatized.
CR 2 S regulator low (0.4)
S offtake high (2)
Reduced tolerance (±5 cm) or lower offtake sensitivity below 1
Offtake should be restructured to lower the sensitivity below 1, while ensuring that the measurement device is still functional.
(alternative tolerance at 5 cm too difficult)
CR3 S regulator very high (3)
S offtake low (0.8)
Tolerance 0.1 acceptable More frequent adjustment of the regulator is needed.
Probably cost-effective to decrease the regulator sensitivity by inserting side weirs.
CR4 and S regulator average (1)
S offtake average (1.6)
Reduced tolerance 0.07 or decrease offtake sensitivity
Decreasing offtake sensitivity should be tried first. If not cost-effective, reduce tolerance.
Average frequency adjustment on regulator.
CR5 S regulator average (1.5)
S offtake average (1)
Tolerance 0.1 acceptable Frequent checking of the regulator.
CR6 S regulator low (0.5)
S offtake high (4.3)
Tolerance (below 5 cm) too difficult. Tolerance should be reset once sensitivity of offtakes has been lowered
Offtake should be restructured to lower the sensitivity, while rebuilding a new measurement device.
CR7 S regulator low (1)
S offtake high (3.4)
CR8 S regulator average (1.5)
S offtake low (0.35)
Tolerance 0.1 acceptable
Frequent checking of the regulator.
CR9 S regulator low (0.5)
S offtake low (0.5)
Tolerance 0.1 acceptable No interventions.
CR10 S regulator very low (0.1)
S offtake low (0.7)
Tolerance 0.1 acceptable No interventions.
Proposed endpoint of the CMC immediately upstream of CR11
CR11 S regulator low (0.5)
S offtake average (1.5)
Reduced tolerance 0.07 or decrease offtake sensitivity
Build a discharge measurement flume in the CMC upstream of CR11.
Option 1 (normal operation): decreasing offtake sensitivity should be tried first. If not cost-effective, reduce tolerance.
Option 2 (main canal as buffer storage): below CR10, main canal to compensate for perturbations generated upstream. This means high-level fluctuations, good control of spills, and low sensitive offtakes.
CR12 n.a
