massachusetts alternative standard for heat power … chp 061913...massachusetts alternative ... rps...
TRANSCRIPT

Creating A Greener Energy Future For the Commonwealth
Massachusetts Alternative Portfolio Standard for
Combined Heat & Power (CHP)An Effective Program for Clean, Efficient Energy:
John Ballam, P.E.Manager, CHP Program
MA Department of Energy Resources

Creating A Greener Energy Future For the Commonwealth
Overview of MA Portfolio Standard ProgramsRenewable Energy Portfolio Standard (RPS)Alternative Energy Portfolio Standard (APS)
Policy Purpose• Creates obligation of all retail electricity suppliers to acquire Renewable Energy Certificates (RECs)
and Alternate Energy Credits (AECs) equal to a set percentage (Minimum Standard) of load served. Purchase of RECs and AECs from qualified generators provides additional revenue.
• Strategy is to “green up” the ISO‐NE grid. Generation from throughout New England and adjacent control areas are eligible (except for solar and CHP).
RPS/APS Standards• Renewable Energy Portfolio Standard – RPS Class I
New (post‐1997) renewable energy generation – original program (began 2002) RPS Solar Carve Out – begins in 2010 to grow solar PV sector to 400 MW
• Renewable Energy Portfolio Standard – RPS Class II Supports MA share of existing (pre‐1998) RE generation Subclass supports existing Waste‐to‐Energy Plants in MA and dedicates at least 50% of
revenues to recycling programs
• Alternative Energy Portfolio Standard (APS) Supports non‐RE technologies (flywheels, gasification, CHP) CHP of key importance – provides credits for efficiency gains in
electric and thermal production
2

Creating A Greener Energy Future For the Commonwealth
Alternative Energy Portfolio Standard• Established under Green Communities Act 2008. Provides
for RPS‐type program for alternative (non‐renewable) technologies.
• Program compliance obligation began in 2009.
• Eligible technologies include flywheels, CHP, gasification with carbon capture/sequestration, paper derived fuels.
• Key technology of interest is CHP. Provides credit for electric generation and useful thermal load.
• Qualified units produce Alternative Energy Credits (AECs).
• Alternative Compliance Payment (ACP) Rate is $21/MWh(2012) and increases with CPI.
3
Creating A Greener Energy Future For the Commonwealth
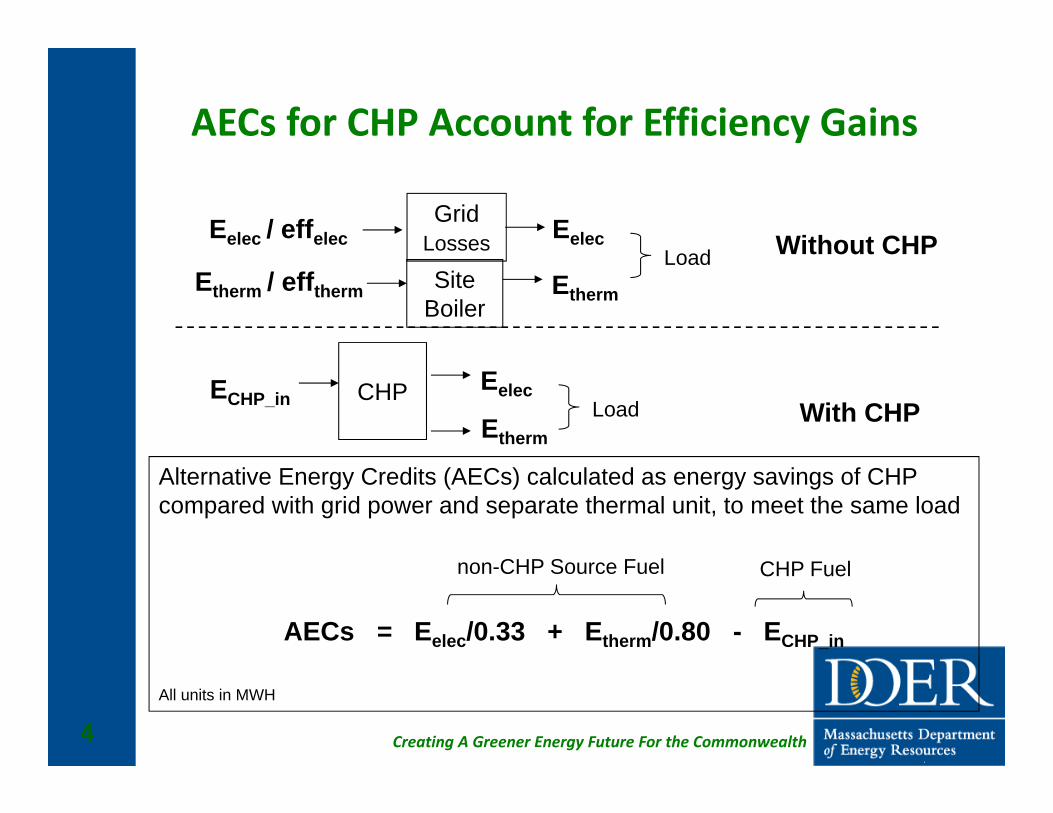
AECs for CHP Account for Efficiency Gains
4
GridLosses
SiteBoiler
CHPECHP_in
Eelec
Alternative Energy Credits (AECs) calculated as energy savings of CHP compared with grid power and separate thermal unit, to meet the same load
AECs = Eelec/0.33 + Etherm/0.80 - ECHP_in
All units in MWH
Etherm
Eelec / effelec
Etherm / efftherm
Eelec
Etherm
Without CHP
With CHP
non-CHP Source Fuel
Load
Load
CHP Fuel

Creating A Greener Energy Future For the Commonwealth
CHP BenefitsFacility / End‐User• Cost Savings from avoided utility electric charges, including avoided
demand charges for large users.• Greater control over facility energy costs • Increased reliability: CHP can be designed to supply power, heat and
cooling during a grid outage.Grid Operator• Load and demand reduction on existing grid.Rate‐payers: • CHP generated electricity avoids energy, capacity and other
significant grid‐related costs which are drivers for the retail cost of grid supplied power.
Climate Change and Societal• Source GHG reduction (typically 17% for natural gas CHP)• Enhanced competitiveness for MA
energy intensive industries by reducing cost of energy.5

Creating A Greener Energy Future For the Commonwealth
MA Alternative Portfolio Standard –Minimum Standard andCumulative CHP Demand
Year APS Minimum Standard
Est. MW of Installed CHP
2009 1.00%2010 1.50% 642011 2.00% 922012 2.50% 1212013 3.00% 1482014 3.50% 1772015 3.75% 2052016 4.00% 2152017 4.25% 2262018 4.50% 2372019 4.75% 2492020 5.00% 261
Estimate based upon APS being met only by CHP
Approximately 27 MW of new CHP installations required each year through 2014, and half this amount in years following.

Creating A Greener Energy Future For the Commonwealth
Guidelines for APS Eligible CHP Systems
• New systems: Have to have started operation after Jan. 1, 2008.
• Pre‐2008 Systems: Program supports incremental CHP – Provides incentive for existing electric‐only power plants to
add useful thermal load, or for thermal‐only plants to add electrical generation.
– Also Provides incentive for modifications to meet incremental thermal and/or electrical loads
• EXAMPLE: 2009 Addition of a heat driven chiller to a 2005 CHP system to supply a new process cooling load.
7
Creating A Greener Energy Future For the Commonwealth
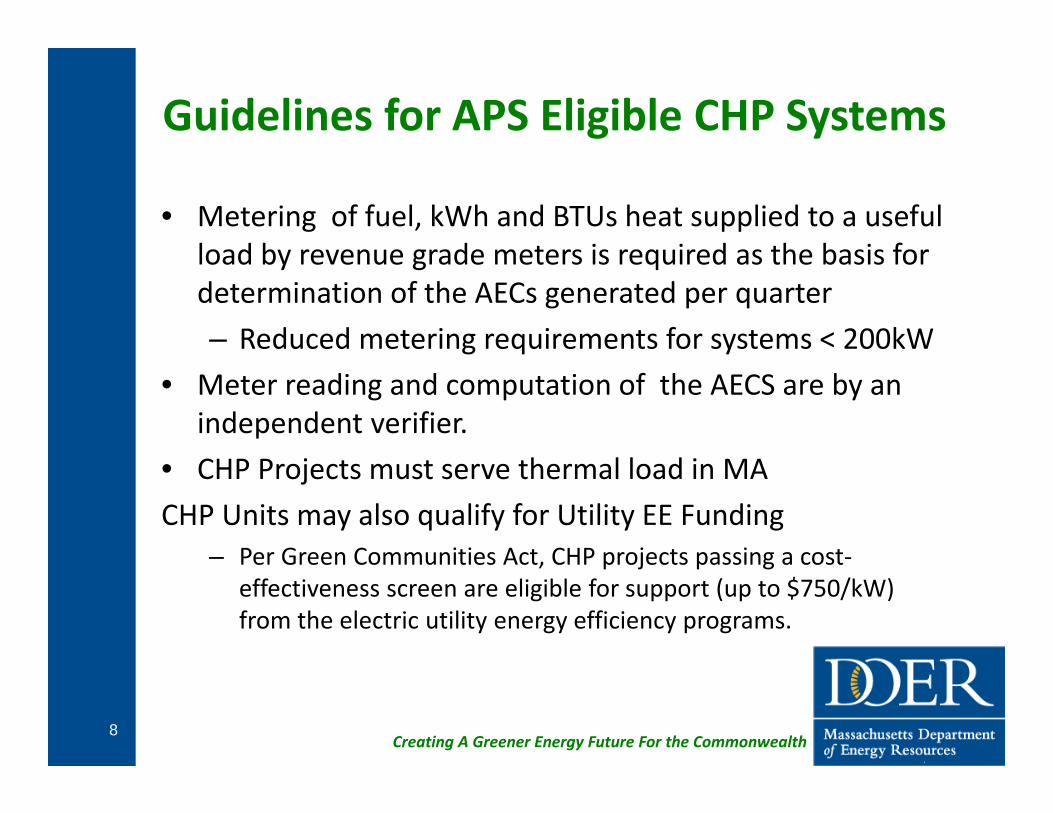
Guidelines for APS Eligible CHP Systems
• Metering of fuel, kWh and BTUs heat supplied to a useful load by revenue grade meters is required as the basis for determination of the AECs generated per quarter– Reduced metering requirements for systems < 200kW
• Meter reading and computation of the AECS are by an independent verifier.
• CHP Projects must serve thermal load in MACHP Units may also qualify for Utility EE Funding
– Per Green Communities Act, CHP projects passing a cost‐effectiveness screen are eligible for support (up to $750/kW) from the electric utility energy efficiency programs.
8

Creating A Greener Energy Future For the Commonwealth
Guidelines for RPS Eligible CHP Systems
• CHP systems using woody biomass fuel can also qualify for the RPS and generate Class I RECs.
• Location: within the ISO‐NE Control Area or within an adjacent Control Area.
• RECs per MWH output are a based on overall efficiency For efficiencies between 40 and 50%; ¼ REC per MWH For efficiencies between 50 and 60%; ½ REC per MWH For efficiencies of 60% or greater; 1 full REC per MWH
• Meet required wood source documentation (see regulations as posted on the MA DOER website)
9
Creating A Greener Energy Future For the Commonwealth
CHP and RPS
• If a CHP system has a DOER‐approved Statement of Qualification for both the APS and RPS, it can earn both AECs and RECs.
10
Creating A Greener Energy Future For the Commonwealth
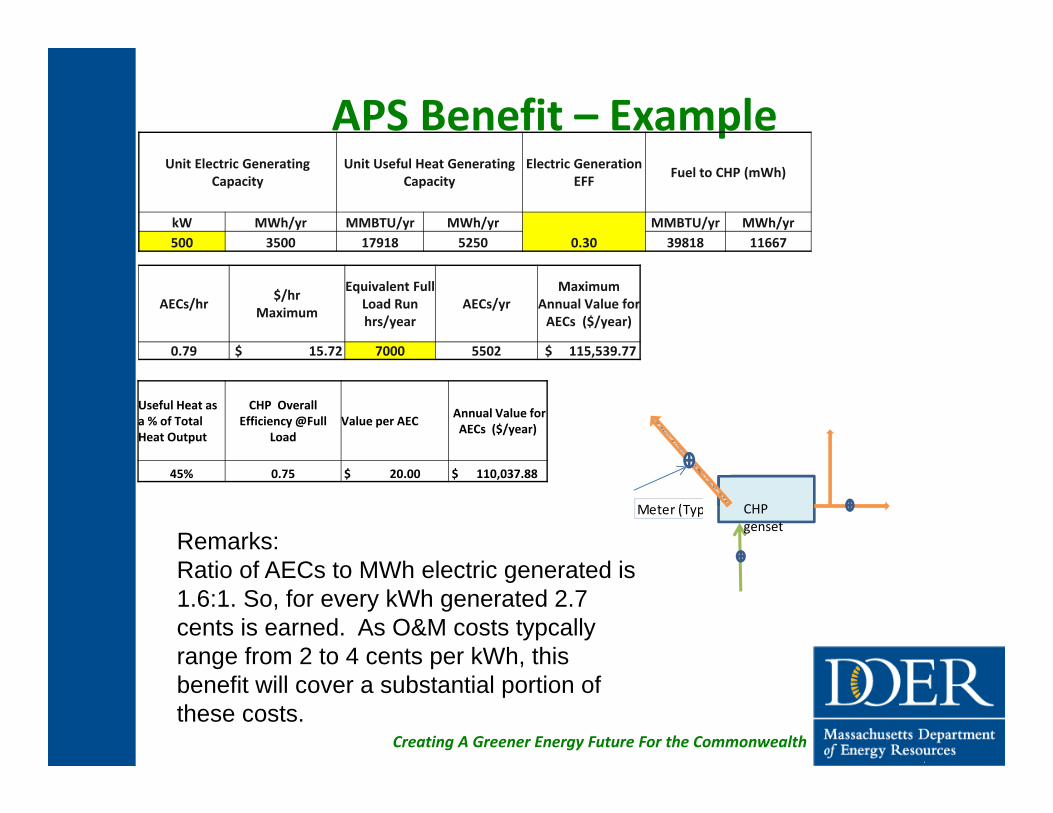
APS Benefit – Example
Meter (Typ
Remarks: Ratio of AECs to MWh electric generated is 1.6:1. So, for every kWh generated 2.7 cents is earned. As O&M costs typcallyrange from 2 to 4 cents per kWh, this benefit will cover a substantial portion of these costs.
CHP genset
Useful Heat as a % of Total Heat Output
CHP Overall Efficiency @Full
LoadValue per AEC Annual Value for
AECs ($/year)
45% 0.75 $ 20.00 $ 110,037.88
Unit Electric Generating Capacity
Unit Useful Heat Generating Capacity
Electric Generation EFF Fuel to CHP (mWh)
kW MWh/yr MMBTU/yr MWh/yr0.30
MMBTU/yr MWh/yr500 3500 17918 5250 39818 11667
AECs/hr $/hrMaximum
Equivalent Full Load Run hrs/year
AECs/yrMaximum
Annual Value for AECs ($/year)
0.79 $ 15.72 7000 5502 $ 115,539.77

Creating A Greener Energy Future For the Commonwealth
Examples of Projected APS Benefit by Size and Application
• Based on the system inputs and $20 /AEC as used in the previous example
12
Size (kW) APS $/yr Common End User Typical System Types
10 $1,900.00 Residential, Small Commercial
IC Genset with heat recovery
250 $47,330.00 Small Industrial, institutional, health care, commercial, mixed use and
district energy.
IC genset with heat recovery; IC genset + HRSG; Microturbine;Small CGT + HRSG; absorption
chiller option Power boiler with steam turbine
500 $94,659.09 1,000 $189,318.18
5,000 $946,590.91 Mid‐sized to large
Industrial, institutional, health care, commercial, mixed use and district
energy.
IC genset + HRSGCGT + HRSG;
CGT based combied cycle Power boiler with steam turbine
Absortpion Chiller Option
10,000 $1,893,181.82 15,000 $2,839,772.73

Creating A Greener Energy Future For the Commonwealth
EE/APS Project Support – Case Study 1UMass Medical Center Campus
Project DescriptionNew 7.5 MW combustion gas turbine and HRSG integrated with
existing 9 MW power boiler steam turbines.Total gross generating capacity is 16.5 MW.
Campus LoadsElectric, Steam (Heating , Chilled water with steam and electric motor
driven compressors)Projected PerformanceMost of incremental energy will be electrical which will allow the Campus
to operate with virtually no requirement for supplemental grid power.No incremental heating load and related steam production. Largest benefit is the increase in overall efficiency of the new 16.5 MW
system, which is 86% compared with the previous 9 MW system efficiency of 71%.
13

Creating A Greener Energy Future For the Commonwealth
EE/APS Project Support – Case Study 1UMass Medical Center Campus
Projected Performance (per annum)Total Net Electricity: 123,566 MWhIncremental Net Electricity: 85,404 MWhTotal Steam: 823,339 MMBTUIncremental Steam: NoneIncremental Net Fuel Use: ‐33,785 MMBTUIncremental Net GHG Emission Reduction: 18,571 TPY (19%) IncentivesEE MassSave
Award $5.6 millionAlternative Portfolio Standard
Projected annual AECs = 135,488Value at present market value of $20/AEC = $ 2,709,768 per annumValue per incremental kWh = 3.7 cents
14

Creating A Greener Energy Future For the Commonwealth
EE/APS Project Support – Case Study 1Simonds International
Project DescriptionSaw Blade manufacturer; Fitchburg, MA; ~160 employeesNew 1.8 MW (3 x 600 kW) natural gas fired diesel gensets, with 400
ton absorption chiller.
Plant LoadsElectric motors and drives; Space heating and DHW; Chilled water for
space and process cooling.
15

Creating A Greener Energy Future For the Commonwealth
EE/APS Project Support – Case Study 1Simonds International
Projected Performance (per annum)Electric Generation: 15,019 MWhUseful Thermal Energy: 63,735 MMBTUFuel Use: 135,550 MMBTUNet GHG Emission Reduction: 2,956 TPY (27%)
IncentivesEE MassSave
Award $470,000Alternative Portfolio Standard
Projected annual AECs = 29,768Value at present market value of $20/AEC = $ 595,360 per annumValue per incremental kWh = 4 cents
16

Creating A Greener Energy Future For the Commonwealth
Capacity (MW) of Operating APS CHP by End Use(Approved and Under Review)
17
28
18
18
4
Academic ManufacturingHealthcare Other
Total Capacity = 67 MW

Creating A Greener Energy Future For the Commonwealth
Numbers of Operating APS Systems by End Use
6
10
1239
No. of Sites (Total = 67) Healthcare Manufacturing Academic Other
18

Creating A Greener Energy Future For the Commonwealth
Performance (2009‐12)
Net Source Fuel Savings, 1,033,152 MWH (3,525,1215 MMBTU)
Equivalent to 462,960 fifty‐five gallon barrels of heating oil.
Approx. Net Source CO2 Source Emission Reduction 121,600 (short tons)
• Equivalent to displacing the source GHG generated per year by 17 million square feet of new office buildings.
• Equivalent to the removal of 23,000 cars from Mass roads for one year.
19

Creating A Greener Energy Future For the Commonwealth
Performance
• APS CHP AECs Generation to date
• Cumulative Total (2009 – present): 1,033,152
20
0
50,000
100,000
150,000
200,000
250,000
300,000
350,000
400,000
2009 2010 2011 2012
AECS

Creating A Greener Energy Future For the Commonwealth
Performance
• Approx Cumulative Value: $ 19,950,000
21
$‐
$1,000,000
$2,000,000
$3,000,000
$4,000,000
$5,000,000
$6,000,000
$7,000,000
$8,000,000
2009 2010 2011 2012
Approx Market Value of AECs Generated

Creating A Greener Energy Future For the Commonwealth
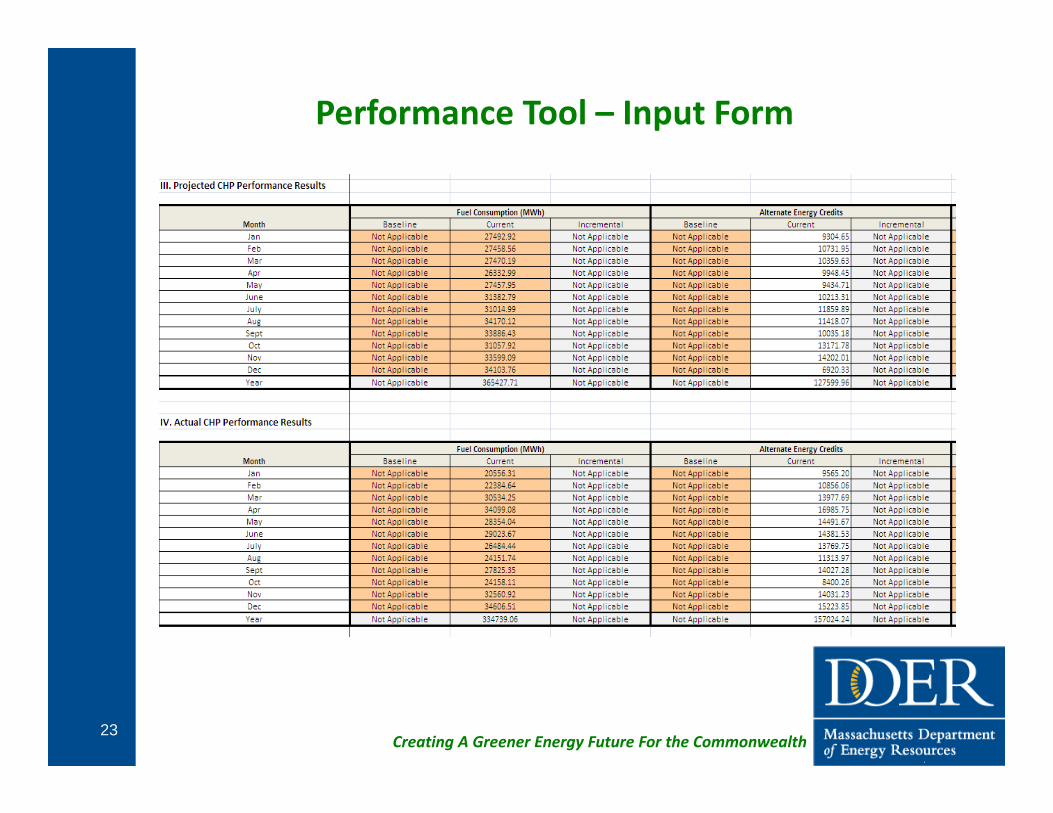
Performance Tool
Data from APS meters represents a potentially valuable resource for evaluating GHG performance.
DOER is well along with the development of an excel based tool which will: Compare actual .vs. projected performance metrics ( e.g. efficiency
or reduction of source GHG) either by quarter or by year Allow for the evaluation of any of these metrics for any single or
aggregated system data based on a user‐selected query (e.g. size, end use, type, or location)
Automatically generate graphic and tabulated display of results.
Input data same as for AECs formula so can be populated by the owner’s IV as a part of the computation of the quarterly AECs.
22
Creating A Greener Energy Future For the Commonwealth
Performance Tool – Input Form
23

Creating A Greener Energy Future For the Commonwealth
Performance Tool – Principal Result Summary
24
Creating A Greener Energy Future For the Commonwealth
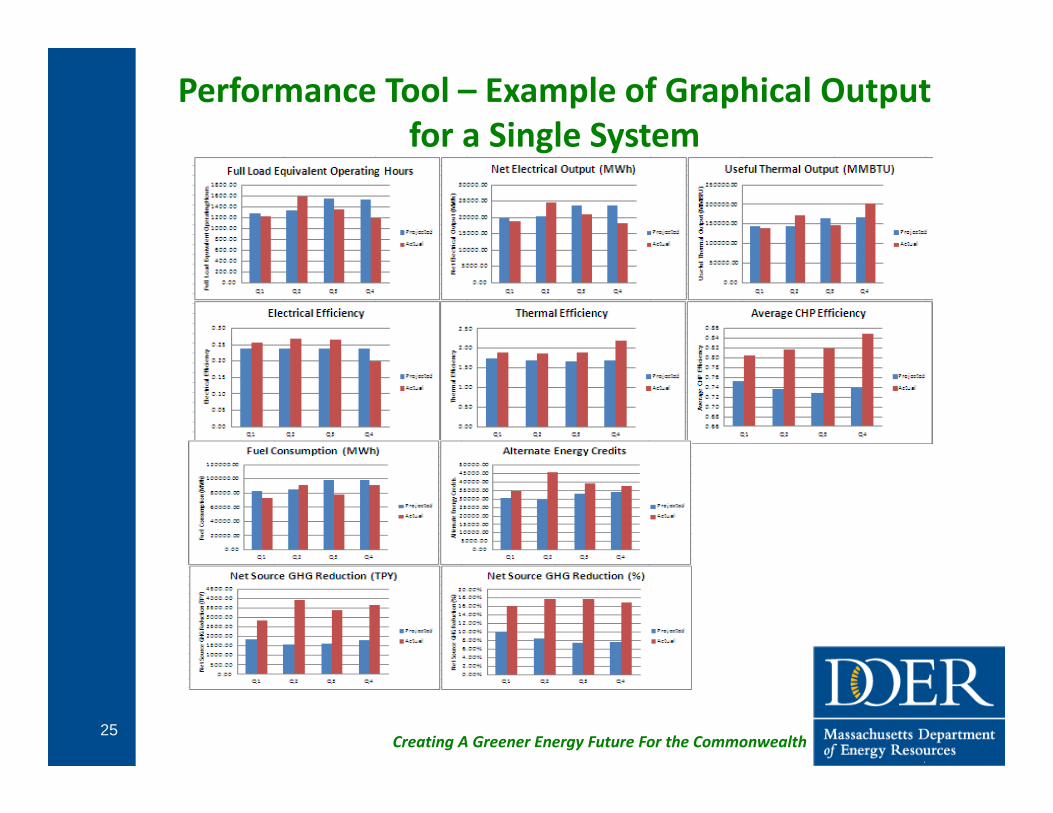
Performance Tool – Example of Graphical Output for a Single System
25

Creating A Greener Energy Future For the Commonwealth
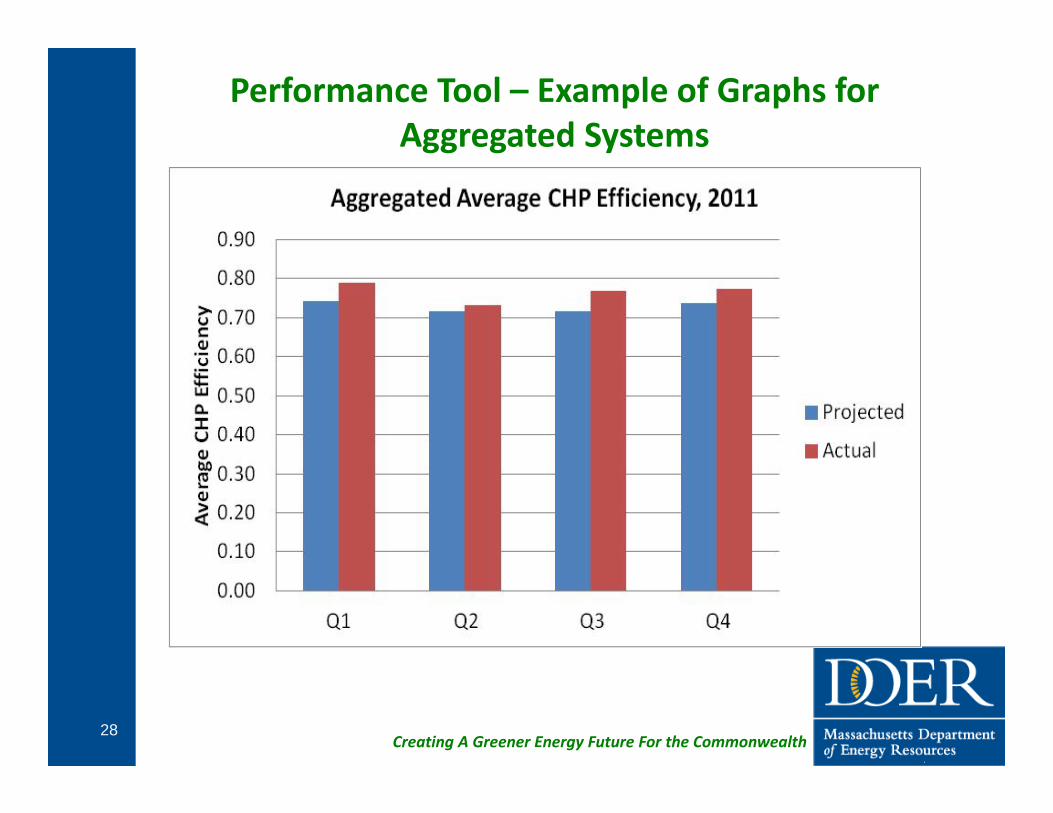
Performance Tool – Example of Graphs for Aggregated Systems
26

Creating A Greener Energy Future For the Commonwealth
Performance Tool – Example of Graphs for Aggregated Systems
27
Creating A Greener Energy Future For the Commonwealth
Performance Tool – Example of Graphs for Aggregated Systems
28

Creating A Greener Energy Future For the Commonwealth
Performance Tool – Example of User Query to Show Actual .vs. Projected Efficiency by End Use
29
Creating A Greener Energy Future For the Commonwealth
NSTAR Standby Tariffs The DPU has ordered (Docket 12‐87) that until the next rate case is heard, both new and existing CHP partial service customers are free to choose between the existing standby tariff or the existing applicable business general service tariff. Comments submitted by the DOER and others as a part of the standby tariff hearing have proposed that inequalities in the tariff and rate structures of all Mass utilities that affect the economics of customers operating CHP be reviewed with the view to ensuring that the system benefits and costs related to CHP are being accurately and completely reflected in the rates and tariffs.
Creating A Greener Energy Future For the Commonwealth
Look Ahead What does the APS CHP Program “pipeline” look like? – 75 to 200 kW: Modest interest and participation by developers and owners in forming aggregations of systems in this size range.
– 500 kW to 3 MW: Expect steady growth, primarily in industrial, commercial and healthcare applications.
– 5MW to 15 MW : Two large industrial projects under final evaluation by owners.
31

Creating A Greener Energy Future For the Commonwealth
Look AheadSome events or scenarios which separately or in combination could produce a significant increase in the rate of AECs being generated. – New or incremental use of by‐product heat generated by utility scale power plants.
• A steam based plant supplies warm condenser return water for heating commercial green houses
• Supply of heat to a nearby host or distributed energy system by changing operating mode and/or increasing the steam production capacity of the station.
32
Creating A Greener Energy Future For the Commonwealth
Look Ahead
• Solution of the technical barriers to the interconnection of CHP systems with end users served by area and/or spot distribution networks (much of Boston).
• Growth of partnerships between investors, lenders, developers and end users which will allow the benefits and costs of CHP to be distributed over a wide base.
33

Creating A Greener Energy Future For the Commonwealth
Resources at the MA DOER APS Website
www.mass.gov/energy/apsStatement of Qualification ApplicationStandards for APS metersTools for estimating AECs generated for your project
DOER CONTACT INFO
34
John Ballam CHP Program Manager 617‐626‐1070 [email protected]
Dwayne BregerDirector,
Renewables Division
617‐626‐7327 [email protected]
Howard Bernstein
APS/RPS Program Manager 617‐626‐7355 [email protected]