mass spectrometry analysis of small molecules - uab 02-12-08.pdf · mass spectrometry analysis of...
TRANSCRIPT
1
Mass Spectrometry Analysis of Small Molecules
Metabolomics- A realm of small molecules (<1000 Da)
Coined in the 1990s:Oliver, S. G., Winson, M. K., Kell, D. B. & Baganz, F. (1998).
Jeevan Prasain, PhD
What is metabolomics?• Identification and quantification of the complete set
of metabolites in a biological system
• Quantitative measurement of the dynamic metabolite response of living systems to pathophysiologicalstimuli or genetic modification
• provides important insights into physiological and disease states and facilitate in depth understanding of underlying biochemical pathways. Metabolomicshas the potential to provide valuable information on various patho-physiological conditions such as cancer, Alzheimer’s and cardiovascular diseases.

2
Key applications
• Toxicity assessment/toxicology• Functional genomics• Nutrigenomics• Herbal formulation, quality control and
clinical trial.
Metabonomics-NMR as analytical plateform
• Prior to LC-MS based metabolomics, the small molecule -ome was analyzed by 1H-and a lesser extent 13C-NMR (Metabonomics)
• NMR is carried out on urine and plasma– Does not require chromatography, but sample has
to carefully dried and redissolved in 2H2O– Compounds analyzed by their chemical shifts– Assisted by very high magnetic fields to obtain
resolution– Not very sensitive, but microliter probes now in
use

3
Genome Transcriptome Proteome Metabolome Phenotype
What might be happening in a cellSnapshot of the entirephysiology
Amino acidsFatty acidsPhenolics
ProstaglandinsSteroids
Organic acidsOrganic amines
NucleosidesNucleosidesPolyamines
Organic acidsLipids
• Profiling involves finding of all metabolites detectable to a selected analytical technique with statistically significant variations in abundance within a set of experimental and control groups.•Identification of chemical structures of metabolites of interest after profiling•Quantification and validation•Interpretation of data making connections between the metabolites discovered and the biological conditions
Steps involved in metabolomic analysisPossible metabolites
Metabolomics in the context of other omics
Metabolomics is complementary to the other -omics and the combinationof these three may provide important information about the status of a cell
Workflow for metabolome analysis
Sample collection
Treatment orDiseased group
Control group
Urine, plasma, tissueetc.
Sample preparation Internal standard spiking for quantitative analysis Extraction (liquid-liquid, ppt with or without hydrolysis)
Sample analysisLC-MS and LC-MS/MS analysis• Q1 scan using HPLC or UPLC/-TOFMS• +ve/-ve ion mode- accurate mass measurement• MS/MS experiments using a hybrid instrument Q-Trap
Data analysisMultivariate analysis, e.g. PCA
Data export
Marker identification

4
Points to be considered in LC-MS analysis
• Choice of ionization mode - ESI vs. APCI +ve/-ve modes
• Choice of eluting solvent - methanol vs. acetonitrile
• Evaluation of spectral quality - what to look for in a good quality spectra
• Molecular ion recognition
Sample preparation
Sample collection
Quenching by liquid Nitrogen or cold methanol(stops metabolism)
Extraction of intracellular metabolites(methanol, methanol-water for polar)(chloroform or hexane for less polar) (protein precipitation, supercritical fluid extraction)
Concentration(evaporation under vacuum, lyophilization, SPE)

5
MS acquisition strategy
Full scan (Q1 scanning) for total profiling of metabolites(+ve and –ve ion mode) ESI/APCI
ESI- Effluent is charged and nebulized, for more polar compounds, e.g., conjugated metabolites.
APCI- Effluent is heated, but not charged- a corona discharge is needed.Good for less polar compound.
ESI is the most common ionization method
Advantage: non-selective and most ionizable ions are detectedDisadvantage: low sensitivity and detection of minor metabolites is compromised.
Increasing metabolite coverage using +ve and –ve ion mode
Source: Nordstrom et al. Analytical Chemistry, 2007
No arachidonicAcid in +ve ion mode
Representative Q1 scans of a methanolic extract of human blood serum

6
Time, min
1 3 5 7 90.01.0e8
3.0e8
5.0e8
7.0e8
9.0e8
1.1e9
1.3e9
1.5e9
Intensity, cps
7.948.657.61
8.412.03 9.66
7.23
6.485.59
2.685.271.52 4.33 4.56
0.5 1.5 2.5 3.5 4.5 5.5 6.5 7.5 8.5 9.50.0
2.0e8
4.0e8
6.0e8
8.0e8
1.0e9
1.2e9
1.4e9
1.6e9
1.8e9
Intensity, cps
8.65
9.158.022.02 7.35
1.56 6.365.882.67
5.114.59
[A]
[B]
Does ionization mode affect the metabolite detection?TIC obtained from grape seed extract treated urine operated in -ve Q1
[A] and +ve Q1 [B] modes
Visual inspection of the two TIC plots show that the two modes of ionization will generate different metabolomic information based on their ionization difference
Profiling of grape seed extract metabolites in ESI-MS Q-TOF –ve ion mode
300 500 700 900 1100 1300 1500 1700 m/z0
100
%
577.229
289.097
245.095
425.148
333.091
865.383
729.287675.239
796.319
1153.5441017.455
963.3911084.991
1305.5941441.710 1730
catechins
Dimer-
Trimer-
Tetra-
Penta- Hexa-
-gallate
-gallate
O
OH
OH
OH
OH
HO
(+)-Catechin

7
Metabolite ID software LightSight™ showing peak list and LC-MS/MS chromatograms of catechin glucuronide m/z 467
Source: Jose Castro-Perez, Rapid Communications in Mass SpectrometryVolume 19, Issue 6, Pages 843-848
HPLC Vs. UPLC?Full-scan ToF mass spectra for (a) the HPLC approach and
(b) the UPLC approach for metabolites of dextromethorphan.
Demonstrates a 5-fold increase in the performance of the UPLC system over conventional HPLC

8
Metabolomics for herbal quality controlMetabolite profiling of ginseng in different herbal
formulations based on metabolomic approach
Source: Chan et al. Rapid Commun. Mass Spectrom. 2007, 21, 519-528
[A] UPLC/TOF-MS total ion current chromatogram (TIC) and HPLC-UV Chromatogram of steamed P. notoginseng
Metabolomics of raw and steamed Panax notoginseng

9
[A] Steamed ginseng
[B] raw ginseng
More than 200 metabolites were detected in both raw and steamed ginsengs. The concentration of Rg1, Re, Rb1, Rc and Rd in steamed
ginseng was less than that of raw ginseng
TIC of UPLC/TOF-MS analysis of [A] steamed ginseng and [B] raw ginseng
* marker ions
* marker ions
[A] Score plot of raw and steamed groups and [B] loadings Plot obtained using pareto scaling with mean centering
Conclusion- MS based metabolomic study is able to discriminate differentially processed herbs such as raw and streamed P. notoginseng
Greater Variationof marker ions
SmallVariationof markerions
Small variation of marker ions in steamed samples indicates that the steamingprocess might result in consistency of the levels of ginsenosides

10
Profiling taxoids metabolites in
the Yew plant T. Wallichiana
extract based on tandem mass spectrometry
Prasain et al. Anal Chem, 2001
ESI-MS/MS spectra of taxoids (1-3). Peaks m/z 194 and 210 represent the intact alkaloid side chain.

11
MS/MS precursor-scan spectra of typical alkaloid side chains to identify the basic taxoids compounds in an ethyl acetate
extract of T. wallichiana.
Prasain et al. Anal Chem, 2001
600 620 640 660 680 700 720 740 760 780 800 820 840 860 880
605622
714
742
758 800
612 628 668 710
742
806.2 848 862
668684
726
744
758770 786
686 710
728
744770 786
800
A
B
C
D
Scaffold (m/z 309)
Side chain (m/z 210)
Side chain (m/z 252)
Side chain (m/z 194)
m/z
Inte
nsity
Comparison of precursor scan spectra obtained from thescaffold m/z 309 and side chain m/z 194, 210 and 252
Taxoids with scaffold m/z 309 and alkaloid side chains are shown by dashed lines

12
Prasain et al. Anal Chem, 2001
Precursor-scan analysis of selected product ions allowed for the detection of 57 basic taxoids from the
ethyl acetate extract of T. wallichiana, 45 of which have not been reported
Next experiments
• Collect different species of Yew plants and profile all taxoids
• Identify the marker ions
• Perform PCA for pattern recognition

13
Conclusions• LC-MS has been a powerful tool to provide
useful means of generating metabolite profiles.• LC-MS-based metabolomic approach is
promising for the quality control of dietary supplements and discovery of novel markers in biomedical research.
• Identification of metabolites, data standardization, export and finding a biomarker is a real challenge
300 500 700 900 1100 1300 1500 1700 m/z0
100
%
Mass Spectrometry in quantitative analysis of small molecules
Jeevan Prasain, Ph.D.Department of Pharmacology &
Toxicology, UAB

14
Class Overview
• Introduction to bioanalysis
• Quantitative analysis of puerarin, EGCG and isoflavones in biological samples by LC-MS/MS
Sample preparation
Chromatographic separation
MS ionization
MS analysis
Bioanalysis Flow Chart

15
Sample preparation
The method of choice will be determined by the sample matrix and the concentration of compounds In samples
Liquid-liquid Extraction
LLE
Solid phase Extraction
SPEProteinPrecipitation
PP
Sample preparation is a crucial step in removing the interfering compounds from biological matrix
Properties of Good Internal Properties of Good Internal StandardsStandards
•• Should not be found in the original sampleShould not be found in the original sample•• The structure of the internal standard The structure of the internal standard
needs to be similar to the analyte.needs to be similar to the analyte.•• Provides data about your extraction Provides data about your extraction
process: process: –– Hydrolysis of Hydrolysis of Methylumbelliferyl Methylumbelliferyl sulfatesulfate–– Hydrolysis of Phenolphthalein Hydrolysis of Phenolphthalein glucuronideglucuronide–– Extraction Efficiency (Apigenin)Extraction Efficiency (Apigenin)

16
Muller et al. J. Chrom B (2002)
Severe ion suppression effect for codeine and glafenin was observed with PPT and SPE-PPT
King et al. J. Am Soc Mass Spectrom 2000
APCI is less prone to than ESI to the effects of ion suppression

17
Analytical method validation
Should demonstrate specificity, linearity, accuracy, precision
• EEstablish lower limit of quantification• SStability (freeze/thaw)• eEstablish robustness
LC/MS/MS Method for PuerarinLC/MS/MS Method for Puerarin
Column: Waters X-Terra C18 with guard, 2.1 x 100 mm, 3.5 micron
Mobile Phase A: 10% MeCN + 10 mM NH4OAcMobile Phase B: 70% MeCN + 10mM NH4OAcGradient: 0 minutes = 100% A
6 minutes = 100% B7 minutes = 100% A10 minutes = Stop
Injection Volume: 20 ulFlow Rate: 0.2 ml/min split flowMass Spectrometer: Negative ElectrosprayMass Transitions: 415/267 (Puerarin)
415/295 (Puerarin)269/149 (apigenin, IS)

18
What is calibration/standard curve?
A calibration curve is the relationship between instrument response and knownconcentration of the analyte.
Lower limit of quantification (LLOQ) - the lowest standard on calibration curvethat should be at least 5 times the response compared to blank with precisionof 20% and accuracy of 80-120%.
Prasain et al. Biomedical chromatography, 2007
Standard curve non-linearity is possible due to detector saturation, dimer/multimer formation, andor ESI droplet saturation at higher concentration
Non-linear due to detector saturation
Source: Bakhtiar & Majumdar. Journal of Pharmacological and Toxicological Methods, 2007

19
What are accuracy and precision?
Accuracy describes the closeness of mean test results obtained by the methodto the true value (concentration of the analyte)Precision - the closeness of individual measure of an analyte when the procedure is applied to multiple aliquotes, expressed in %CV = Std deviation/mean x 100
0 1.0 2.0 3.0 4.0 5.0 6.0 7.0 8.0 9.0 10.0Time (min)
100
50
Rel
ativ
e In
tens
ity (%
)
Spiked with0.01 μM
Blank
Ion chromatograms of a rat serum spiked sample (0.01 μM of puerarin) vs. blank serum
Specificity is the ability of an analytical method to differentiate and quantify the analyte in the presence of other components in the sample
20
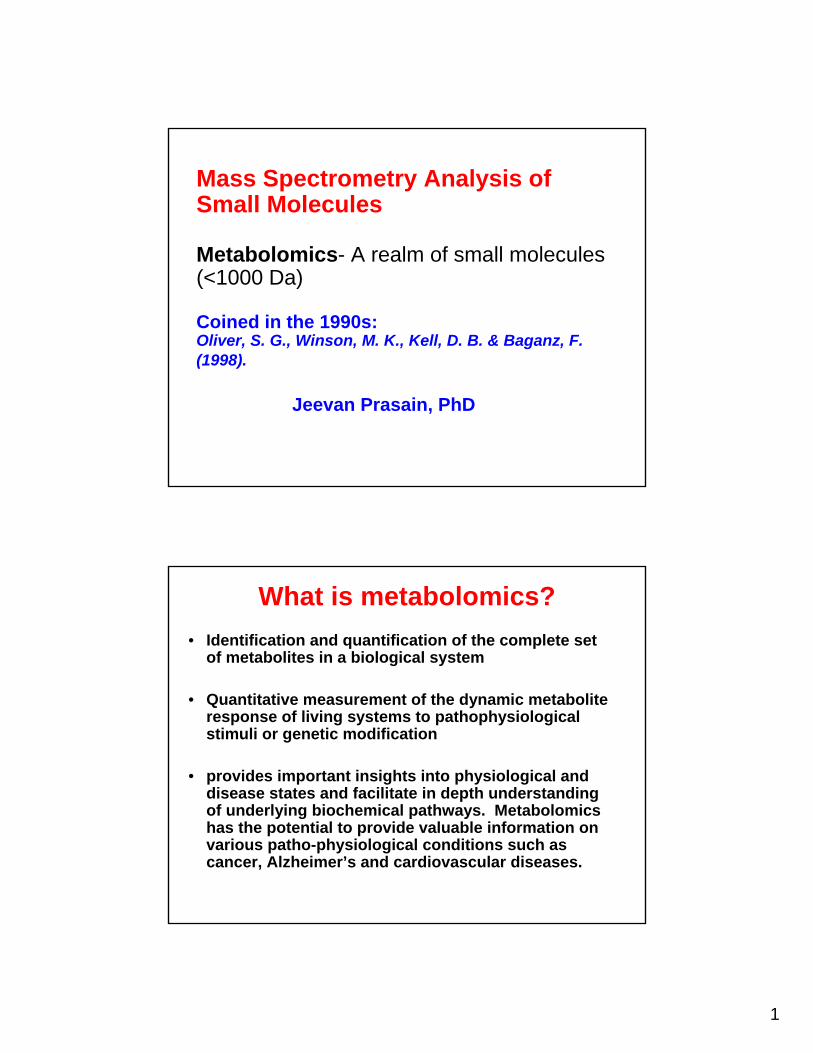
0.00
0.50
1.00
1.50
2.00
2.50
3.00
3.50
4.00
4.50
0 30 60 90 120 150 180 210 240 270
Time points (min)
Average serum concentration of puerarin versus time afteroral administration of 50 mg/kg puerarin
Prasain et al. (unpublished results)
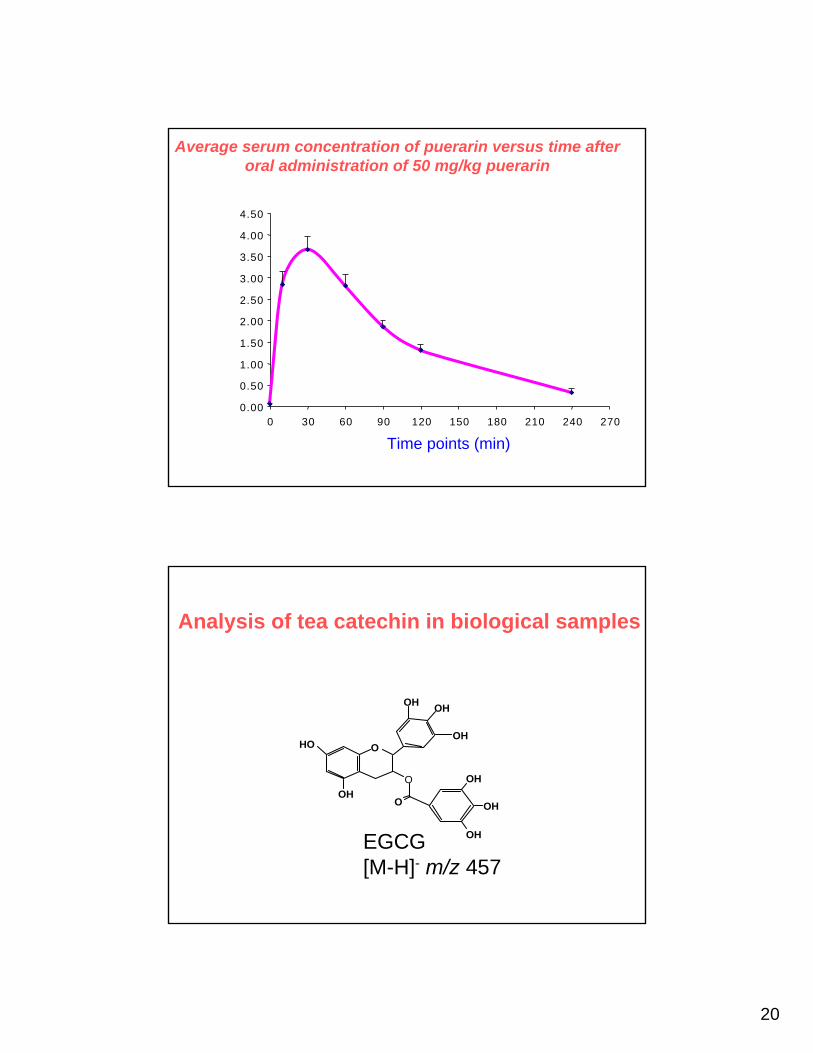
O
OH
HO
OHO
O
OH
OH
OH
OH
OH
Analysis of tea catechin in biological samples
EGCG[M-H]- m/z 457

21
Product ion spectrum of the ion m/z 457
O
OH
HO
OHO
O
OH
OH
OH
OH
OH
m/z 125m
m/z 169
44
Typical chromatogram of a serum sample spiked with 5 nM after protein precipitation
Internal Standard(Apigenin)
EGCG

22
Calibration curve for EGCG (1Calibration curve for EGCG (1--10,000 nM) 10,000 nM) after extracting from rat serumafter extracting from rat serum
Simultaneous Quantification of 10 Isoflavones in one run
EquolDaidzein
Dihydrodaidzein
O-DMAGenistein
Glycitein
Formononetin
Coumestrol
Biochanin A
6-OH O-DMA
Chrysin

23
Equol Standard Curve (duplicate)Theoretical Calculated Conc. (nM) Conc. (nM) % Accuracy
10,000 9790 9810,000 9790 98 5,000 5840 117 5,000 4860 97 1,000 966 971,000 859 86
500 507 101500 436 87100 116 116100 88.8 89
50 54.9 11050 50.6 101 10 9.79 9810 10.7 107
5 5.24 1055 4.58 91.7