masculinity audit 2016 - thecalmzone.net€¦ · p8 masculinity audit 2016 masculinity audit 2016...
TRANSCRIPT

MASCULINITY AUDIT 2016UNDERSTANDING MODERN MASCULINITY
AND THE CAUSES OF MALE SUICIDE

MASCULINITY AUDIT 2016 P3
Public KnowledgeThe Mill, Hexham Business Park
Burn Lane, HexhamNorthumberland
NE46 3RU 01434 [email protected]
T: @PKresearchNE46
Report prepared by Sophie Brannigan (Research Manager) and Emily Ballantyne (Research Executive).
Huffington Post UK020 7092 2000
[email protected]: @HuffPostUK
Facebook.com/HuffPostUK
The Huffington Post UK is provided by AOL (UK) Limited.
Campaign Against Living Miserably (CALM)PO Box 68766
London SE1P 4JZ0203 697 9331
[email protected]: @thecalmzone
CALM is a charity registered in England and Wales (1110621) and in Scotland (SC044347).
November 2016 © Campaign Against Living MiserablyThis report can be found at http://bit.ly/masculinity2016 MASCULINITY AUDIT 2016
EXECUTIVE SUMMARY 4Rationale 4
Methodology 5
1. WELLBEING 6Frustration 6
Behaviuors 7
2. WORKING LIFE 12Motivations and barriers 12
Being the breadwinner 14
Losing a job 15
High-risk jobs 17
3. FAMILY & RELATIONSHIPS 18Responsibilities 18
Personal qualities 19
4. ROLE MODELS & MEDIA 26Role Models 26
Media and Stereotypes 27
APPENDICES 30Data Processing and Analysis 30
Primary Demographics 30
Secondary Demographics 32

P4 MASCULINITY AUDIT 2016 MASCULINITY AUDIT 2016 P5
RATIONALETo mark The Year of the Male in 2014, the Campaign Against Living Miserably (CALM) released a ‘State of the Nation’ report of modern masculinity1, exploring the expec-tations and pressures felt by men in the UK. The intention was to understand the societal and cultural context in which 12 men a day were taking their own lives. That num-ber persists, and suicide remains the single biggest killer of men aged under 45 in the UK.
Whilst the actual number of male suicides decreased slightly in 2015, 75% of all UK suicides were men (NISRA, GRO, ONS 2015). Men have been three times more likely than women to take their own lives since the early nineties. However, suicidality is not fixed. Figure 1 shows that the female suicide rate halved in 30 years. If the male suicide rate were to do the same, it would mean 35,000 fewer men dying at their own hands. We need to better understand this gender bias in suicide. It is a fight worth fighting, and research is a vital weapon.
In 2016, CALM joined forces with The Huffington Post UK to commission a repeat, in-depth report of modern mascu-linity. This ‘Masculinity Audit 2016’ is published as part of HuffPost UK’s ‘Building Modern Men’ project, and released to mark International Men’s Day 2016. Once more, the intention is to contextualise the gender imbalance in sui-cide by understanding more about the specific challenges faced by men today.
Not only are men over-represented in suicide figures, they’re more likely than women to be imprisoned or home-less, to abuse alcohol or drugs, and to live shorter lives. As such, this report explores attitudes towards masculinity, our emotional lives, our working lives, and what we expect of ourselves and others, as partners and parents.
1 Titled ‘A Crisis in Modern Masculinity: Understanding the Causes of Male Suicide’, published November 2014
The findings show that many men feel they lack the qual-ities and abilities partners look for in a man, and believe women have unrealistic expectations of them. Men feel pressure to be the breadwinner, and put expectations on themselves to be emotionally strong and financially respon-sible.
Furthermore, the way in which men face such pressures also differs from women, and little has changed since 2014. Men are still less likely than women to talk to anyone about being depressed, more likely to exhibit risky be-haviour, and less likely to open up to friends. However, the picture is shifting: for instance, a slightly higher proportion of men in 2016 said they would talk about being depressed than in 2014.
As awareness of the pressures men encounter is growing, the state of modern masculinity continues to change. Its ongoing scrutiny - through research like this - is crucial to understanding the male bias in suicide in the UK, building better support, and keeping men and boys alive.
EXECUTIVE SUMMARY
EXECUTIVE SUMMARYFIGURE 1 UK SUICIDE RATES, 1981-2015
Source: Office for National Statistics, National Records of Scotland, and Northern Ireland Statistics and Research Agency
METHODOLOGYIn order to conduct the 2016 Masculinity Audit, a robust quantitative survey was undertaken with data collected via an online methodology. The questionnaire used within the project was designed by Public Knowledge in collabora-tion with CALM, HuffPost UK, and representatives from other key stakeholder groups. The questionnaire and was approximately 10 minutes in length and themed to address six core areas:
• Wellbeing• Family and relationships• Working life• Role models and the media
Questions were kept as comparable as possible between 2014 and 2016, so that any changes in the data would be identifiable.
The survey ran from 3rd to 7th October 2016 and generat-ed a total of 1,017 responses. Online data was collected via Public Knowledge’s in-house online panel, panelbase.net, which has over 240,000 registered members. Quotas were imposed on the data to ensure a representative sam-ple was collected in terms of age, gender and region, and weighting was applied to adjust for minor variations, and to ensure that the 2016 sample matched the 2014 sample as closely as possible. The sample is nationally representative with regards to age, gender, social economic group, and geographical location. It has a margin of error of +/-3.1% at the 95% confidence level. Further information can be found in the Appendix to this report.
Thanks are also due to those who supported the design of the 2014 report: Damien Ridge (University of Westminster), Steve Robertson (Leeds Metropolitan Uni), Martin Todd (Men’s Health Forum), Martin Seager (Consultant Clinical Psychologist), John Barry (Chartered Psychologist), activist Glen Poole (Editor at insideMAN magazine), and the Young Foundation.
EXECUTIVE SUMMARY

P6 MASCULINITY AUDIT 2016 MASCULINITY AUDIT 2016 P7
FRUSTRATIONThe first question in this section asked how often all respondents have felt frustration with their life. As in 2014, more than a quarter (28%) of all respondents said they had felt frustration with life very often or often. In 2016 females said they felt frustration with life very often or often more than males (30% females compared to 25% males). This is similar to 2014 figures.
FIGURE 2 FRUSTRATION WITH LIFE
F1ii. How often do you feel frustrated with your life?Base: All respondents - 2016 - 1,017; 2014 - 1,002
Single people felt frustration with their life very often or often significantly more than respondents in relationships (42%), as did lesbian and gay women (87%) and respon-dents living with their parents (43%). The geographical region where respondents were most likely to feel frustra-tion with life very often or often was the North East (34%). Respondents who were looking for work (53%) or disabled/too ill to work (62%) also over indexed on feeling frustra-tions more often.
Those who said they were very often or often frustrated with their life were then asked what has frustrated them the most. Responses are shown in Figure 3.
WELLBEING
1. WELLBEINGSUMMARYIn this section of the survey, participants were asked specific questions about their life, frustrations, depres-sion and things that make them feel ashamed personally.
The findings tell us that men and women both expe-rience frustrations in life, about commonly frustrating things: money worries, health, work. However, men were more likely (19%) than women (12%) to cite their career or job as something that frustrates them in life, which relates to findings in the following section, Working Life.
The survey revealed significant gender differences in dealing with life’s frustrations and specifically mental health problems. Of the males that said they had felt de-pressed, only 55% said they talked to someone about it compared to 67% of females. Men were more likely than women to cite feeling embarrassed as the reason they did not speak up, and less likely to reach out to friends, family or counsellors.
In general, men were more likely than women to report risk-taking behaviours, such as getting drunk, driving too fast, taking drugs, gambling excessively, getting into a physical fight, and driving under the influence of alcohol. Women were more likely than men to report losing their temper, suggesting they are more likely to use emotions to express frustration.
As in 2014, the results suggested a connection between depression and risk-taking behaviour, with more respon-dents who experienced depression reporting getting drunk, driving too fast and taking drugs in the past three months.
As in 2014 the aspect of their life that had frustrated female respondents most was financial difficulties (30%, com-pared to 201% for males). Males felt the aspect which frustrated them most was their health (21%), followed by their career or job (19%).
BEHAVIOURSAll respondents were asked if they had undertaken certain behaviours relating to frustration in the three months prior to the research. Just over half (55%) reported such be-haviours, with males (56%) reporting slightly more overall than females (53%). This was a drop from 2014 where 73% of males and 58% of females reported such behaviour.
WELLBEING
FIGURE 3 MOST FRUSTRATING
F2i. On a personal level what has frustrated you most?Base: All who felt very often or often frustrated with life - 278
FIGURE 4A RECENT BEHAVIOUR - 2014
F2ii. Which of the following have you done within the last 3 months?Base: All respondents 2014 - 1,002

P8 MASCULINITY AUDIT 2016 MASCULINITY AUDIT 2016 P9
The difference between genders was more strongly seen in the type of behaviour reported. Females were more likely to have used their emotions to express frustrations: 39% had lost their temper compared to 31% of males. Males on the other hand were more likely to report impulsive or risk-tak-ing behaviour to express their frustration: 30% of males had got drunk compared to 22% of females, and 18% had driven too fast, compared to 11% of females.
The data suggests that there is a connection between depression and risk-taking behaviour. As shown in Table 5, respondents who have experienced depression are sig-nificantly more likely than those who have not to have got drunk in the past three months, driven over the speed limit and taken drugs.
TABLE 1 LINK BETWEEN DEPRESSION AND RISK-TAKING BEHAVIOUR
A - people who reported feeling very depressed B - no depression
BEHAVIOUR A BLost your temper 45% 25%
Got drunk 30% 21%
Driven too fast 15% 14%
Gambled excessively 4% 3%
Taken drugs 4% 2%
Got into a physical fight 3% 2%
Driven under the influence of alcohol 1% 1%
None of the above 36% 55%
DEPRESSIONParticipants within the total sample were asked to think back to a low point in their lives and to consider what emo-tions they felt at that low point (Figure 5). Most respondents had felt a low point in their lives (89% of males and 94% of females). Females were more likely than males to have felt most of the emotions they were prompted by, with the exception of frustration, which males were more likely to have felt (48% compared to 45% of females).
Participants who reported they had felt a low point in their lives were asked whether they had suffered from any peri-ods of depression (Figure 6). As in 2014, exactly half of the
WELLBEING WELLBEING
FIGURE 4B RECENT BEHAVIOUR - 2016
F2ii. Which of the following have you done within the last 3 months?Base: All respondents 2016 - 1017
male respondents who had experienced a low point in their lives said they had felt very depressed. Females were more likely to have ever been very depressed (58%). Those aged
25-34 (66%), those separated from their partner (85%), lesbian/gay women (85%), and C2DE respondents were the groups more likely to have felt very depressed.
FIGURE 5 FEELINGS AT A LOW POINT
F3. Thinking back to a low point in your life,did you feel any of the following?
Base: All respondents - 1017
FIGURE 6 FEELING DEPRESSED
F3i. Have you ever been very depressed(e.g. experienced dark/black periods, felt totally worthless)?
Base: All respondents, 2016 - 1017
Yes No

P10 MASCULINITY AUDIT 2016 MASCULINITY AUDIT 2016 P11
The main reasons males felt depressed (Figure 7) were mental health (30%), financial difficulty (30%), followed by ‘a problem I could not solve’ (23%), family or relationship breakdown (22%), and bereavement (22%). However females felt all of these reasons more than males. Physical health and body issues or appearance were factors more likely to make females feel depressed than males (22% of females for both compared to 19% and 11% respectively for males).
Females who have experienced depression are significant-ly more likely to talk to someone about it than males (67% compared to 55%). Males in 2016 are slightly more open to talking to someone about feeling depressed (55%) than they were in 2014 (53%).
FIGURE 8 TALKING ABOUT DEPRESSION
F3i: Did you talk to anyone about being depressed?Base: All respondents who answered ‘Yes’ at F3 - 533
Respondents who said they did not talk to anyone about feeling depressed were then asked why (Figure 9). Half of all respondents said they did not talk to someone about their feelings of depression because they preferred to deal with problems themselves and this was felt more strongly by females than males (52% vs 48%). The second most common response was ‘I didn’t want to burden people/waste others time’, again felt more strongly by females
WELLBEING WELLBEING
FIGURE 7 MAIN REASONS FOR FEELING DEPRESSED
F3ii. What was the main reason you felt this way?Base: Respondents reporting they had felt very depressed
than males (45% vs 32%). However, men were more likely to feel too embarrassed to talk to people about their feelings (30% vs 21% of females). Respondents who had talked to someone about feeling depressed were asked to choose from a list who they had spoken to. More than half
of this sample said they spoke to their GP (52%). A similar proportion of males and females spoke to their partner (17% and 18% respectively), but more females than males reached out to family (23% compared to 17%) and friends (19% compared to 14%). Females were also more likely than males to talk to a counsellor (19% vs. 14%).
FIGURE 10 PEOPLE RESPONDENTS TALKED TO ABOUT DEPRESSION
F3v. Who did you talk to?Base: All respondents who talked to anyone about being depressed - 307
FIGURE 9 MAIN REASONS FOR NOT TALKING ABOUT DEPRESSION
F3iv. Which of the following best describes why you didn’t speak to anyone?
Base: All respondents who did not talk to anyone aboutbeing depressed - 191
P12 MASCULINITY AUDIT 2016 MASCULINITY AUDIT 2016 P13
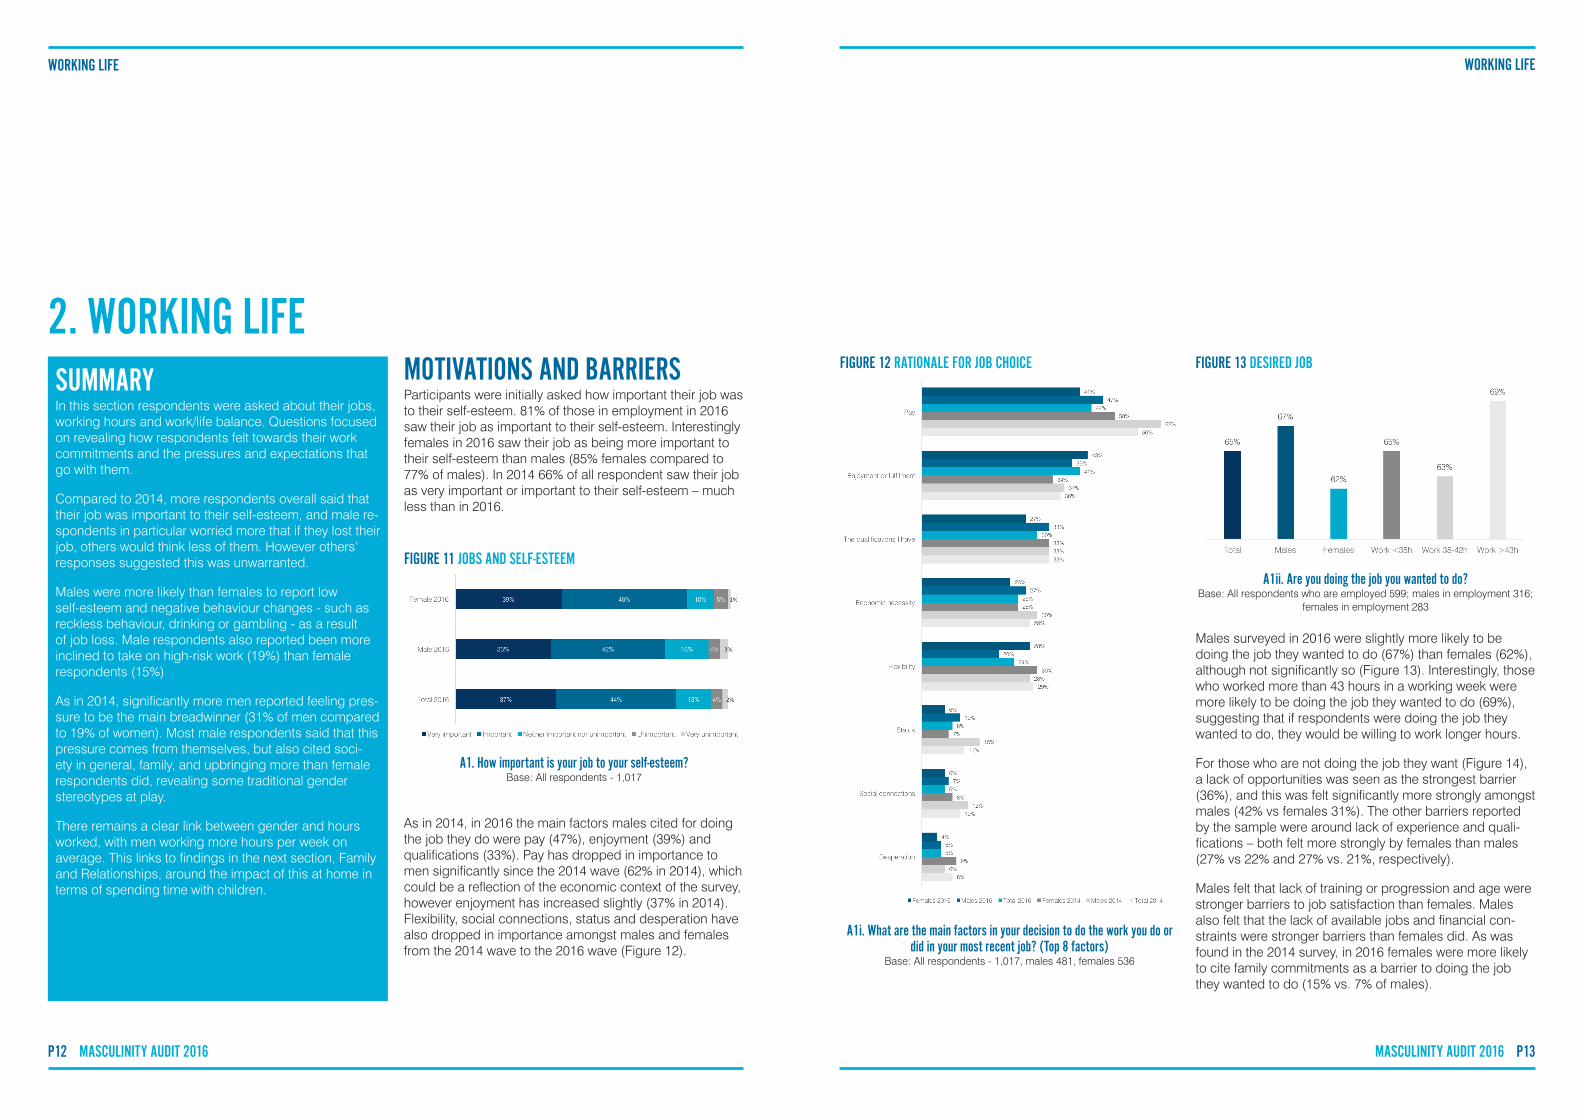
MOTIVATIONS AND BARRIERSParticipants were initially asked how important their job was to their self-esteem. 81% of those in employment in 2016 saw their job as important to their self-esteem. Interestingly females in 2016 saw their job as being more important to their self-esteem than males (85% females compared to 77% of males). In 2014 66% of all respondent saw their job as very important or important to their self-esteem – much less than in 2016.
As in 2014, in 2016 the main factors males cited for doing the job they do were pay (47%), enjoyment (39%) and qualifications (33%). Pay has dropped in importance to men significantly since the 2014 wave (62% in 2014), which could be a reflection of the economic context of the survey, however enjoyment has increased slightly (37% in 2014). Flexibility, social connections, status and desperation have also dropped in importance amongst males and females from the 2014 wave to the 2016 wave (Figure 12).
WORKING LIFE
2. WORKING LIFESUMMARYIn this section respondents were asked about their jobs, working hours and work/life balance. Questions focused on revealing how respondents felt towards their work commitments and the pressures and expectations that go with them.
Compared to 2014, more respondents overall said that their job was important to their self-esteem, and male re-spondents in particular worried more that if they lost their job, others would think less of them. However others’ responses suggested this was unwarranted.
Males were more likely than females to report low self-esteem and negative behaviour changes - such as reckless behaviour, drinking or gambling - as a result of job loss. Male respondents also reported been more inclined to take on high-risk work (19%) than female respondents (15%)
As in 2014, significantly more men reported feeling pres-sure to be the main breadwinner (31% of men compared to 19% of women). Most male respondents said that this pressure comes from themselves, but also cited soci-ety in general, family, and upbringing more than female respondents did, revealing some traditional gender stereotypes at play.
There remains a clear link between gender and hours worked, with men working more hours per week on average. This links to findings in the next section, Family and Relationships, around the impact of this at home in terms of spending time with children.
Males surveyed in 2016 were slightly more likely to be doing the job they wanted to do (67%) than females (62%), although not significantly so (Figure 13). Interestingly, those who worked more than 43 hours in a working week were more likely to be doing the job they wanted to do (69%), suggesting that if respondents were doing the job they wanted to do, they would be willing to work longer hours.
For those who are not doing the job they want (Figure 14), a lack of opportunities was seen as the strongest barrier (36%), and this was felt significantly more strongly amongst males (42% vs females 31%). The other barriers reported by the sample were around lack of experience and quali-fications – both felt more strongly by females than males (27% vs 22% and 27% vs. 21%, respectively).
Males felt that lack of training or progression and age were stronger barriers to job satisfaction than females. Males also felt that the lack of available jobs and financial con-straints were stronger barriers than females did. As was found in the 2014 survey, in 2016 females were more likely to cite family commitments as a barrier to doing the job they wanted to do (15% vs. 7% of males).
WORKING LIFE
FIGURE 11 JOBS AND SELF-ESTEEM
A1. How important is your job to your self-esteem?Base: All respondents - 1,017
FIGURE 12 RATIONALE FOR JOB CHOICE
A1i. What are the main factors in your decision to do the work you do or did in your most recent job? (Top 8 factors)
Base: All respondents - 1,017, males 481, females 536
FIGURE 13 DESIRED JOB
A1ii. Are you doing the job you wanted to do? Base: All respondents who are employed 599; males in employment 316;
females in employment 283

P14 MASCULINITY AUDIT 2016 MASCULINITY AUDIT 2016 P15
BEING THE BREADWINNERAlmost a quarter of the total sample surveyed in 2016 felt pressure to be the main breadwinner (Figure 15), a com-parable number to 2014 (24% strongly agree/agree in 2016 vs 26% strongly agree/agree in 2014). In 2014 males felt the pressure to be the main bread winner significantly more than females (42% males strongly agree/agree vs 13% females strongly agree/agree). In 2016 males still felt the pressure to be the main bread winner more than females, (31% males strongly agree/agree vs 19% females strongly agree/agree), however the difference was not as significant as in 2014.
The age group which felt the pressure the strongest in 2016 was the 25-34 year olds (32%), which would com-monly correspond to the age group who were more likely to be starting out in the career path and buying their first home.
NB Differences in responses from 2014 to 2016 may have arisen due to the way the question was worded, and to whom it was asked: in 2014 it was asked to respondents who were ‘Married/civil partnership’ or ‘In a relationship’, and worded ‘I feel pressure to be the main breadwinner in
WORKING LIFE WORKING LIFE
my household’. In 2016 it was asked to all respondents, and worded ‘I feel pressure to be the breadwinner’.
Those who said they felt pressure to be the main breadwin-ner were asked to select from a prompted list where they feel this pressure comes from (Figure 16). Almost two-thirds of respondents said the pressure to be the breadwin-ner came from themselves (65%). A third felt this pressure came from society in general (34%) and almost a quarter of respondents said pressure came from their family. Society, family and upbringing were cited more commonly amongst males as the source of pressure to be the breadwinner.
LOSING A JOBMales felt losing their job would cause others to think less of them moreso than females, with just over a quarter feel-ing that way (26% of males, compared to 17% of females, agreed or strongly agreed with the statement). This was a slight drop from the 2014 figures where 29% of males felt the loss of a job would make their spouse/partner see them as less of a man.
NB Differences in responses from 2014 to 2016 may have arisen due to the way the question was worded, and to whom it was asked. In 2014 this question was asked to respondents who are ‘Married/civil partnership’ or ‘In a relationship’ and worded ‘If I lost my job I would worry that my spouse/partner would see me as less of a man/wom-an’. In 2016 this question was asked to all respondents at 2016, and worded ‘If I lost my job I would be seen as less of a man/woman’.
Males clearly worry more than females that if they lost their job they would be seen as less of a man, however when respondents were asked if they would see their partner as less of a man/women, only 7% of females agreed or
FIGURE 14 JOB BARRIERS
A1iii. Why do you feel you are not doing the job you want to do?Base: All respondents who are not doing the job they want to - 211;
males 103, females 108
FIGURE 15 PRESSURE TO BE THE BREADWINNER
A2. To what extent do you agree or disagree with the following statement?“I feel pressure to be the breadwinner”
Base: All respondents - 1,017, males 481, females 536
FIGURE 16 SOURCE OF PRESSURE TO BE BREADWINNER
A3. You said you feel pressure to be the main breadwinner within your household, where does this pressure come from?
Base: All respondents who said they feel pressure to be the main bread winner - 246, males 145, females 101
FIGURE 17 LOSS OF JOB
A2. To what extent do you agree or disagree with the following statement?“If I lost my job I would be seen as less of a man/woman”
Base: All respondents - 1,017, males 481, females 536

P16 MASCULINITY AUDIT 2016 MASCULINITY AUDIT 2016 P17
strongly agreed with the statement, suggesting that males fears were unsupported.
Almost half of all males (47%) had ever lost their job or business, significantly more than females (28%) - see Figure 19. Only 13% of the 16-24 age group had ever lost their job, 48% of both the 35-44 and 45-54 age group had ever lost their job. These figures would be as expected, based on the assumption that the older age groups would have spent longer in employable years, and had more time to lose or change jobs.
Job loss in all respondents also appears to be closely connected to frustration with life. Those who have ever
lost their job are likely to feel frustration with their lives very often (53%) or often (42%).
44% of those respondents in the 2016 survey who had previously lost their job had lost it more than 10 years ago, an increase of 6% since the 2014 survey (Figure 20). Re-spondents who had lost their job in the past year and the previous one to two years had dropped by 2% from 2014 to 2016, suggesting that in 2016 respondents are experi-encing slightly more job security than they were two years ago. 13% of females and only 4% of males report having lost their job in the last year.
As to be expected, job loss amongst respondents (Figure 21) was most likely to result in financial issues (45%). This was felt most strongly amongst females (48% vs 43% of males), which is an inversion of the 2014 survey, when males felt job loss would most likely result in financial issues more so than females. In 2016 more than a third (35%) of males felt low self-esteem from job loss; females felt this less strongly (28%). Males also reported job loss might lead to negative behaviours – such as increased drinking or smoking, drug taking, gambling etc. – more strongly than females (13% amongst males compared to 5% of females). Females felt that job loss would lead to ill health more strongly than males; both mental health issues (16% vs 12%) and physical health issues (12% vs 7%).
WORKING LIFE WORKING LIFE
Over half (54%) of the 16-24 age group reported the impact of job loss to be low self-esteem, and over a quarter (27%) of this age group said mental health issues were a con-sequence of their job loss. This age group did, however,
report that job loss resulted in positive behaviour changes, such as being less stressed, doing more exercise, spend-ing time with family etc.
HIGH RISK JOBSThere appears to be a connection between men and high risk jobs (Figure 22). 17% of the total sample said they would not be put off doing a job if it was high risk. Males are more likely to say they would not be put off doing high risk jobs (19% compared to 15% of females). Divorced people (29%) or widowed people (29%) are least likely to say they would be put off doing a high risk job. This trend suggests that a spouse or partner’s views factor in the decision to take risky jobs amongst males. In support of this finding, those who are married or in a civil partnership surveyed in 2016 are the most likely to be put off taking a high risk job (43%) following a trend from the 2014 survey (where this figure was 46%).
The main reasons cited for respondents not being put off taking risky jobs were enjoyment of the job (16%), being willing to take the risk (11%), the need to work to support a family or themselves (10%), uncertainty about the future (9%), and if the position was financially worth the risk (9%).
FIGURE 21 IMPACT OF JOB LOSS
A4ii. Did losing your job result in any of the following consequences?Base: All respondents who have previously lost a job - 369;
males 222, females 149
FIGURE 22 RISKY JOBS
A5. If there was a risk your job could seriously endanger your health and safety, would that put you off doing it?
Base: All respondents - 1,017
FIGURE 18 PARTNER LOSS OF JOB
A2. To what extent do you agree or disagree with the following statement? “If my spouse/partner lost their job I would consider
them less of a man/woman”Base: All respondents - 1,017, males 481, females 536
FIGURE 19 JOB LOSS
A4. Have you ever lost your job/business? Base: All respondents - 1,017, males 489, females 511
TOTAL MALES FEMALES
FIGURE 20 WHEN LAST JOB LOST
A4i. When did you lose your job (or business if self-employed)?Base: All respondents who have previously lost a job
2014 - 445, 2016 - 369

P18 MASCULINITY AUDIT 2016 MASCULINITY AUDIT 2016 P19
FAMILY & RELATIONSHIPS FAMILY & RELATIONSHIPS
RESPONSIBILITIESA significantly higher proportion of men feel that they ought to be more responsible than their partner for taking charge of key financial and legal matters (31% vs. 14% amongst females), being emotionally strong when there is a crisis (24% vs. 11% amongst females), and taking practical charge when there is a crisis (31% vs. 10% amongst females).
3. FAMILY & RELATIONSHIPSFIGURE 23 SHARING RESPONSIBILITIES
SUMMARYThis section focused on life at home. Just as in 2014, males feel they should be more responsible than their partner for legal and financial matters, being emotionally strong, and taking practical charge in a crisis. Females are more likely to think that partners should be equally responsible. Four out of 10 men agreed that ‘women have unrealistic expectations of men’.
The findings showed some inconsistencies between what expectations men believed others to have of them and others’ actual expectations. For instance, financial dependability is desired by only 30% of respondents looking for a male partner, but 41% of men assume part-ners look for this quality.
Relating back to the previous section, 87% of male respondents agreed they would like to spend more time with their children (compared to 72% of females), citing work as the main barrier to doing so. More men (39%) than women (32%) thought that a quality children should look for in a father was ‘the ability to support a family’, which again suggests men put pressure on themselves to be providers. Of the parents surveyed, males reported that this quality was something they feel they have, but were much less likely (80%) to report having parenting skills compared to females (93%).
... being emotionally strong when there is a crisis?
Base: All 2016 respondents – 1017, males 481, females 536
To what extent do you feel you and your partner should be responsible for...
... taking charge of key financial and legal matters?
... being emotionally strong when there is a crisis?
Women were more likely to state they and their partner should be equally responsible for these roles in a relation-ship, and a significantly higher proportion of women feel that they should be less responsible than their partner for these responsibilities. Despite these differences, the ma-jority of men and women feel that they should share these three responsibilities equally with their partner.
PERSONAL QUALITIESHonesty (81%), a good sense of humour (78%), and a car-ing compassionate nature (76%) are the three most import-ant qualities that those looking for a male partner seek, and correspondingly, they are the three most important qualities that men think a partner looks for in a man. The greatest discrepancy between the preferences of those looking for a male partner and the assumption made by men is on the point of honesty. Over four in five of those looking for a male partner (81%) look for honesty in a man while less than two-thirds of men (62%) believe that prospective part-ners look for this quality in a man.
Additionally, the proportion of those looking for a male partner who look for a good sense of humour, care and compassion, the ability to show love, a hard working ethic, intelligence, compatibility personality wise, being family ori-entated, morality and parenting skills is significantly higher than the proportion of men who think prospective partners look for these qualities in a man, suggesting there is a disparity between what those who are looking for a male partner want, and what men think they want.
A significantly higher proportion of men (41%) believe that prospective partners look for financial dependability in a man than is sought amongst those looking for a male part-ner (29%). Additionally, a higher proportion of men believe that a prospective partner looks for confidence, physical attractiveness, a strong character, and decisiveness in a man than is observed among the preferences cited by those looking for a male partner.
FIGURE 24 QUALITIES IN MEN AS PARTNERS
C1. What qualities and abilities do you look for in a partner?Base: All heterosexual women and gay or bisexual men 2016 – 528
C2. What qualities or abilities do you think partners look for in a man?Base: All men 2016 - 489

P20 MASCULINITY AUDIT 2016 MASCULINITY AUDIT 2016 P21
Almost four in 10 men (39%) feel that they lack some of the qualities that a partner looks for in a man, this proportion is significantly higher than that observed in the 2014 study (32%).
Among men who feel that they lack some of the qualities and abilities they were asked about at C2, over a quarter indicated that they lack confidence and physical attractive-ness (both 26%). These are both qualities which a greater proportion of men believe a prospective partner looks for in a man than is reportedly sought among those looking for a male partner. It should also be noted that these two qualities ranked 12th and 13th among those most preva-lently cited by women as important. This indicates that the deficit males feel with respect to these qualities may be unwarranted.
Financial dependability was the third most frequently cited shortfall among men. As observed in C1 and C2, the pro-portion of women who indicate they look for this quality in a man is significantly lower than the proportion of men who believe prospective partners look for this quality. Further-more, this quality ranked 16th out of 19 among the qualities most prevalently cited by women as important.
Overall, therefore, a key finding from the study is that men feel they are coming up short amongst the characteristics
they perceive to be important to potential partners and so are putting unnecessary additional pressures on them-selves.
Almost half of men who feel that they lack some of the qualities and abilities they were asked about at C2 (48%), feel that these shortfalls hinder their ability to start a rela-
FAMILY & RELATIONSHIPS
FIGURE 25 LACKING QUALITIES DESIRED BY PROSPECTIVE PARTNERS
C2i. Do you feel that you personally lack any of these qualities or abilities?Base: All male respondents 2014 – 490, all male respondents 2016 - 489
FIGURE 26 QUALITIES MEN BELIEVE THEY LACK
C2ii. Which qualities or abilities do you feel you lack?Base: men who indicated in 2016 that they feel they lack some of the
qualities they were asked about at C2 - 189
FAMILY & RELATIONSHIPS
tionship. This proportion is significantly lower than in 2014. It should be noted that the proportion of men who feel this way constitutes under one fifth (18%) of all males who participated in the 2016 study.
Four in 10 males (40%) in the 2016 study feel that women have unrealistic expectations of men. This proportion is lower than that observed in 2014 (46%).The proportion who disagree with this statement has risen significantly from 12% in 2014 to 18% in 2016.
CHILDREN AND PARENTHOODIn 2016, almost nine out of 10 males (87%) agree that they would like to spend more time with their children; this is significantly higher than among females (72%). This pro-portion has risen among males from 77% in 2014, however, remains unchanged among females since 2014, therefore illustrating an area of increasing gender disparity and a further reason why men are finding the work/life balance so tough in 2016.
Working hours, the pressure of work and commuting times are the three most frequently cited reasons by males and females for why they don’t spend as much time with their children as they would like.
Almost three-quarters of males who said they would like to spend more time with their children (74%) cite working hours as a cause; this is significantly higher than among females (46%), reflecting the results of males being signifi-cantly more likely to work more than 43 hours per week. The proportion of females who cite working hours as
FIGURE 27 AGREEMENT THAT LACKING QUALITIES HINDERS ABILITY TO START RELATIONSHIPS
C2i. Do you feel that you personally lack any of these qualities or abilities?Base: All male respondents 2014 – 490, all male respondents 2016 - 489
FIGURE 28 UNREALISTIC EXPECTATIONS OF MEN
C3. To what extent do you agree or disagree that “Women have unrealistic expectations of men”?
Base: All men 2014 – 490, all men 2016 - 489
FIGURE 29 WOULD LIKE TO SPEND MORE TIME WITH CHILDREN
B3i. To what extent do you agree with the statement “I would like to spend more time with my child/children”?
Base: All respondents with children <18 (S6i): 217, males 84, females 133

P22 MASCULINITY AUDIT 2016 MASCULINITY AUDIT 2016 P23
FIGURE 31 QUALITIES AND ABILITIES PARENTS HAVE AND LACK
D2i. Which of the following qualities and abilities do you feel you have or don’t have yourself as a parent?Base size: All respondents who have children 299, males 128, females 172
preventing them from spending time with their children has fallen significantly from 71% in 2014 to 46% in 2016.
Both males and females were asked what qualities children need in a father. Responses for the total sample 2016 are shown in Figure 30 alongside male and female sub-sets.
As in 2014, the ability to show love (total 2016 58%) and being a good role model (total 2016 56%) were seen as the most important quality children need in a father, theses was seen more strongly amongst women (ability to show love 62%, being a good role model 57%) than men (ability to show love 53%, being a good role model 54%). Reliability was seen as a more important quality to females (30%) than males (26%) but interestingly the ability to support a family is seen as a more important quality children need in a father amongst males (39%) than females (32%).
Parents were then asked what qualities and abilities they felt they have or lack. Responses amongst the total sample 2016 are shown in Figure 31 alongside male and female sub-sets.
On the whole, the majority of parents felt they had the qualities and abilities needed to be a parent, the qualities most parents felt they had were loyalty (96%), reliability (94%) and the ability to show love (91%). Fathers showed the same trend as parents as a whole, with most fathers agreeing that they had loyalty (96%) and reliability (93%) however they also felt they had morality (91%). Mothers followed this trend too, with loyalty coming out most (96%), followed by reliability (95%) and the ability to show love (94%). Parenting skills (93%) and interest in/sharing child’s interests (91%) are also felt to be strong qualities amongst mothers.
A common theme for the qualities and abilities both mothers and fathers felt they lacked most was educational attainment/career success (10% for both groups), the sec-ond most common quality both groups felt they lacked was being a good role model (10% for males, 8% for females). Fathers were more lacking in confidence parenting their children; more male respondents felt they were lacking in parenting skills (10%) than females (2%), and more males felt they were lacking an interest in or sharing in their child’s interests (8%) than females (5%).
FAMILY & RELATIONSHIPS
FIGURE 30 QUALITIES CHILDREN SHOULD LOOK FOR IN A FATHER
D2. What qualities and abilities should children look for in a father?Base: All respondents - 1,017, males 481, females 536
FAMILY & RELATIONSHIPS
P24 MASCULINITY AUDIT 2016 MASCULINITY AUDIT 2016 P25
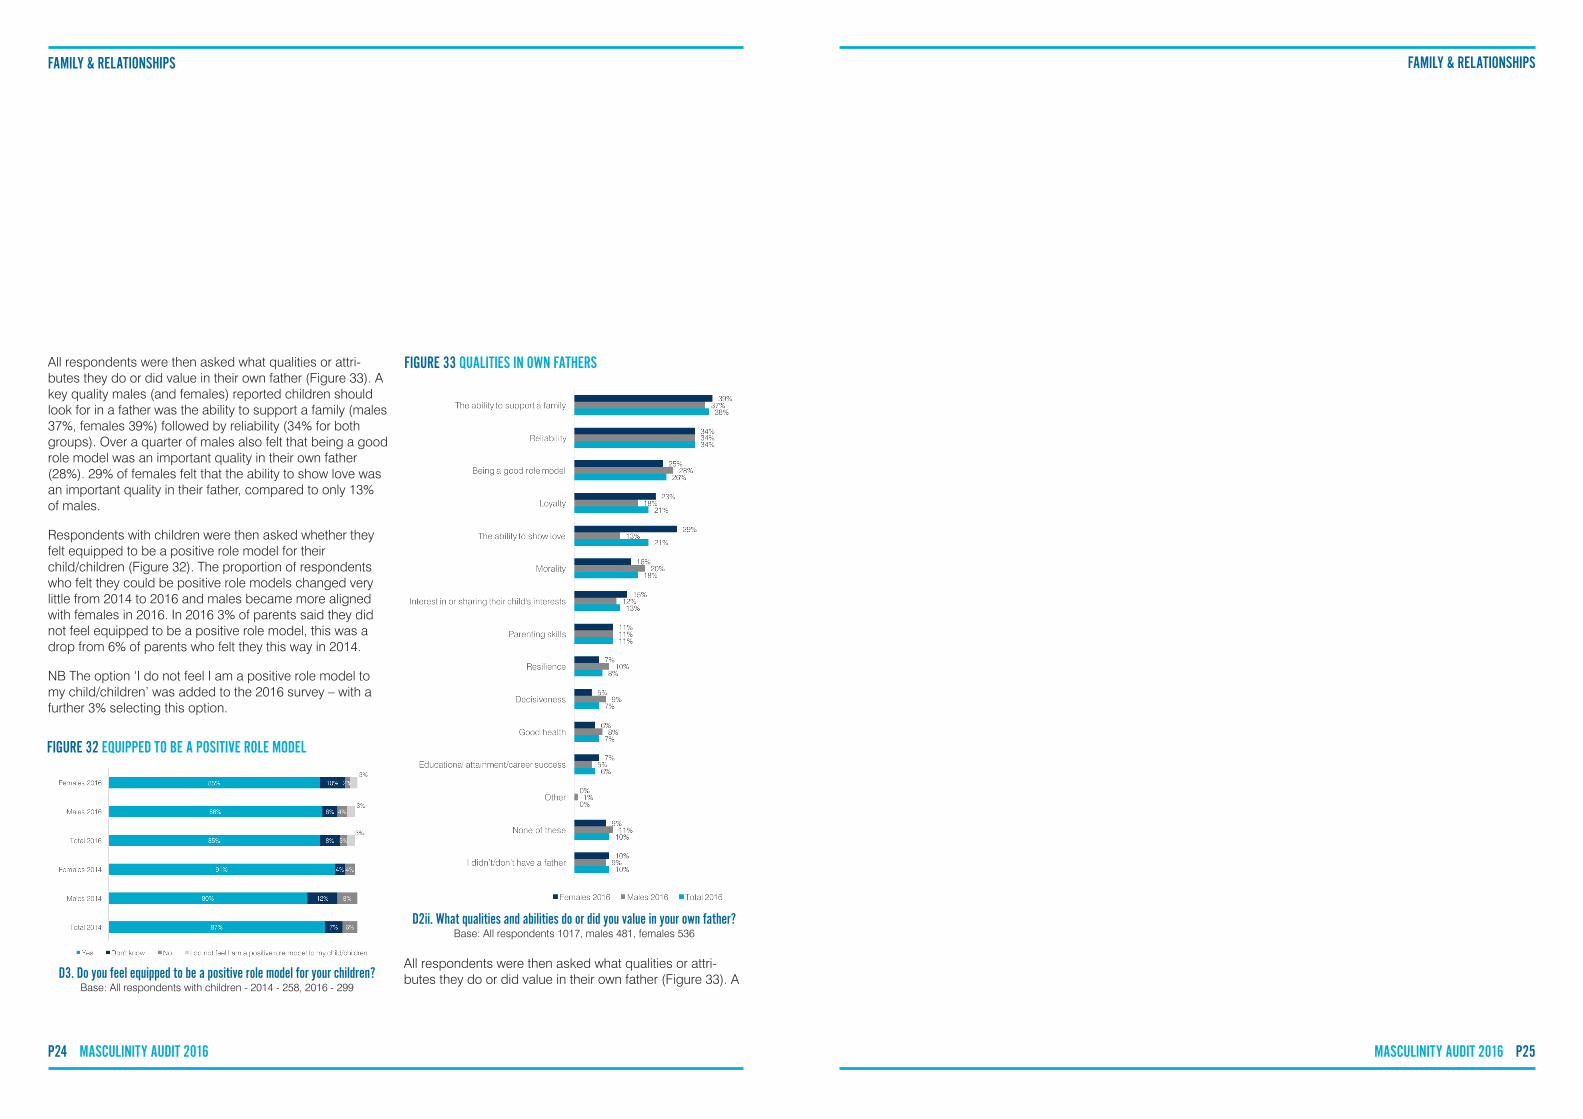
All respondents were then asked what qualities or attri-butes they do or did value in their own father (Figure 33). A key quality males (and females) reported children should look for in a father was the ability to support a family (males 37%, females 39%) followed by reliability (34% for both groups). Over a quarter of males also felt that being a good role model was an important quality in their own father (28%). 29% of females felt that the ability to show love was an important quality in their father, compared to only 13% of males.
Respondents with children were then asked whether they felt equipped to be a positive role model for their child/children (Figure 32). The proportion of respondents who felt they could be positive role models changed very little from 2014 to 2016 and males became more aligned with females in 2016. In 2016 3% of parents said they did not feel equipped to be a positive role model, this was a drop from 6% of parents who felt they this way in 2014.
NB The option ‘I do not feel I am a positive role model to my child/children’ was added to the 2016 survey – with a further 3% selecting this option.
All respondents were then asked what qualities or attri-butes they do or did value in their own father (Figure 33). A
FAMILY & RELATIONSHIPS FAMILY & RELATIONSHIPS
FIGURE 33 QUALITIES IN OWN FATHERS
D2ii. What qualities and abilities do or did you value in your own father?Base: All respondents 1017, males 481, females 536
FIGURE 32 EQUIPPED TO BE A POSITIVE ROLE MODEL
D3. Do you feel equipped to be a positive role model for your children?Base: All respondents with children - 2014 - 258, 2016 - 299

P26 MASCULINITY AUDIT 2016 MASCULINITY AUDIT 2016 P27
NB ‘Some discrepancies in the 2014/2016 figures may have come about here as ‘I have a male role model but none of the above’, ‘I have a female not a male role model’, and ‘I don’t have a role model’, were added to the 2016 survey, in place of ‘None of the above’ in the 2014 survey.
Males who selected a male role model from those listed were asked what qualities they admire in their role model (Figure 35). As in 2014, a wide variety of qualities were cited by men but it is clear that the qualities most admired
ROLE MODELS & MEDIA
ROLE MODELSThe following section within the survey focused on role models and what makes a good role model. Firstly males were asked ‘Of the men you know personally, who do you see as your role model?’.
A third of the male sample surveyed in 2016 saw their father as their role model, an increase of 3% from the males surveyed in 2014. Other family members outside of fathers were all seen as being the main male role model by slightly less of the sample than at the 2014 wave; grand-father (5%), brother (3%) and uncle (2%). 2% of the males surveyed said they did not have a male role model, but that they did have a female one. In 2014, 43% of male respon-dents said that none of the males listed were their role model. In 2016 the same proportion of the sample said that they did not have a male role model (Figure 34).
4. ROLE MODELS & MEDIASUMMARYJust as in 2014, four in 10 male respondents in 2016 reported having no role model. Those who did over-whelmingly choose their father or grandfather as a role model among men they know personally (33% and 5% respectively). Very few males reported having a female role model (2%). The qualities males most admire in their role models are honesty, supportiveness and de-pendability. Interestingly physical strength did not score highly as something males admire in their role models.
Whilst the majority of respondents agree that men are stereotyped in the media, more than half of male respondents (55%) thought men are stereotyped mainly negatively and 64% of female respondents thought mainly positively. From a selection, the media image de-picting a caring, loyal and funny father character (from a Halifax ad) was most highly ranked as being something men both related and aspired to.
from the prompted list include honesty (55%), supportive-ness (53%), and dependability (52%). Other qualities cited included loyalty (49%), wisdom (45%), intelligence (41%) and patience (40%). Of the qualities listed physical strength was the least admired.
MEDIA AND STEREOTYPESFirstly respondents were asked if they thought males were stereotyped in the media, there was little difference be-tween males and females opinions, with six out of 10 of each group in agreement that males were stereotyped in the media. This was a drop from 68% in 2014 in agreement that males were stereotyped in the media.
Over half of male respondents (55%) who thought that men were stereotyped in the media felt that they were stereo-typed in a mostly negative way. Females felt the opposite 64% of them felt that men were stereotyped in a positive way.
ROLE MODELS & MEDIA
FIGURE 34 MALE ROLE MODELS
E1. Of the men you know personally, who do you see as your role model?Base: All males 2014 - 490, 2016 - 489
FIGURE 35 QUALITIES IN ROLE MODELS
E1i. What qualities do you admire in your role model?Base: All male respondents who have a role model 2016 (E1)- 278
FIGURE 36 MALE MEDIA STEREOTYPES
E1ii. Do you think men are stereotyped in the media, e.g. in ads, TV shows, films, the radio?
Base: All respondents 2014 - 1,002 2016 - 1,017

P28 MASCULINITY AUDIT 2016 MASCULINITY AUDIT 2016 P29
Consistent with the findings of the 2014 survey, in 2016 the image male respondents both related to (34%) and aspired to (39%) most was the Halifax ad (however this was a drop from 2014 findings, where 45% of male respondents relat-ed to the Halifax ad, and 51% aspired to it). The full advert depicts a father character that is caring, loyal and funny. Men were least likely to select the Sun and Lynx ads as first choice for those they relate and aspire to.
NB An additional image was added to the survey in 2016 for Strongbow.
ROLE MODELS & MEDIA
Respondents were then asked how men are most com-monly portrayed in the media. On the whole respondents thought men were mostly portrayed in the media as having a sense of humour (80%), being decisive (65%), intelligent (65%) and physically strong (89%); these responses were driven by female respondents.
The more negative aspects that were picked up by our sample of how men were portrayed in the media were being mostly thick skinned (77%), selfish (69%), impatient (69%) and uncommunicative. Males and females were largely in agreement with how men were portrayed in the media, however females often felt the characteristics were portrayed more strongly than males. For example 77% of males felt men were portrayed in the media as having a sense of humour vs. 84% of females; 74% of males thought men were portrayed as being thick skinned vs. 80% of females; 58% of males felt that men were portrayed as intelligent in the media vs. 71% of females; 85% of males felt that men were portrayed as being physically strong vs. 92% of females.
Respondents were then asked what words or phrases they find to be sexist. A wide range of words and phrases came out, some of the most common (which could be deemed as terms of endearment), being ‘babe’, ‘love’, ‘darling’, ‘bird’. On the whole female respondents tended to find these words and phrases more sexist than males (e.g. 5% of females vs 2% of males found the term ‘babe’ sexist, 6% of females vs 2% of males found the term ‘love’ sexist).
Men within the sample were finally presented with seven different images of males from recent advertisements (both from television and print) - see opposite.
Men were asked to rank the images in order from 1 to 7, firstly in relation to which they relate to most (with 1 being the image they relate to most and 7 the least) and then in relation to which they aspire to most (with 1 being the image they aspire to most and 7 the least).
ROLE MODELS & MEDIA
STRONGBOW B&Q
THE SUN
LYNX
GUCCI DOVE HALIFAX
FIGURE 37 FIRST SELECTION - RELATE AND ASPIRE
FIGURE 38 LAST SELECTION - RELATE AND ASPIRE
E4ii. Please rank the advertisements from 1 to 7,with the one you feel you aspire/relate to most at 1 and least at 7
Base: All males - 489

MASCULINITY AUDIT 2016 P31P30 MASCULINITY AUDIT 2016
PRIMARY DEMOGRAPHICSThe online sample was collected using Public Knowledge’s in-house panel, panelbase.net. The sample collected was representative of the UK population in terms of gender, age and region and data was weighted following fieldwork to ensure accurate representativeness. Whilst ‘other’ was given as a gender option, no participant selected this as their gender.
APPENDICES
DATA PROCESSING AND ANALYSISWithin this report any mention of ‘significance’ refers to statistical significance. Statistical significance is used to refer to a result that is unlikely to have occurred by chance and in this case is tested using Pearson’s chi-square. Significance can be calculated to different percentages, with higher percentages representing more noteworthy responses.
Survey data was assessed for statistical significance ac-cording to the following variables:
• Gender• Age• Geographical location• Socio-economic group• Relationship status• Sexual orientation• Living arrangements• Age of children in household• Main income earner• Current working status• Hours worked in a week• Doing the job want to do• Job loss• Frustration with life• Depression• Talk to anyone about depression
Please note, where 0% is charted this represents a number of respondents less than 1% of the sample.
This report is accompanied by data tables and raw data files where further information can be found, if required.
APPENDICES
FIGURE (i) GENDER
S1. Please select your genderBase: All respondents - 1,017
AGE N %16-24 117 12%
25-34 174 17%
35-44 166 17%
45-54 181 18%
55-64 146 15%
65+ 216 22%
TABLE (i) PROFILE OF SAMPLE BY AGE
S2. Which of the following age bands applies to you?Base: All respondents - 1,017
Figure (ii) shows the sample composition by region.
The ethnic profile of the sample is shown in Table (ii) beside national figures from the 2011 census. Whilst the sample contains a slightly higher proportion of white respondents than the national population (90% compared to 86% from the census), the ethnic breakdown across the sample is largely representative when compared to the national population.
APPENDICES
FIGURE (ii) PROFILE OF SAMPLE BY REGION
S3. Where do you live?Base: All respondents - 1,017
TABLE (ii) ETHNIC PROFILE
S9. Which os these best describes your ethnic group?Base: All respondents - 1,017
N % CENSUSWhite (Total) 912 92% 86%
British 839 84%
Irish 16 2%
Other white background 57 6%
Mixed (Total) 16 1% 2.20%
White and Asian 2 0%
Any other mixed background 5 0%
White and Black African 1 0%
White and Black Caribbean 8 1%
Asian or Asian British (Total) 40 4% 7.50%
Pakistani 7 1%
Any other Asian background 3 0%
Indian 19 2%
Chinese 8 1%
Bangladeshi 3 0%
Black or Black British (Total) 24 2% 3.30%
Black African 15 1%
Black Caribbean 9 1%
Other 1 0% 1%
Prefer not to say 8 1%

MASCULINITY AUDIT 2016 P33P32 MASCULINITY AUDIT 2016
APPENDICES
SECONDARY DEMOGRAPHICSTable (iii) shows a breakdown of the secondary demo-graphics of the sample including relationship status, living arrangements and working status.
More than half of the sample is in a relationship; either married or in a civil partnership (45%), in a relationship and living with their partner (19%) or in a relationship and not living with their partner (6%). Just under a quarter (21%) is single and the remainder are divorced, widowed or sepa-rated. Males within the sample are significantly more likely to be single (25%) compared to females (16%).
In line with the proportion of participants in a relationship, more than half said they are living with their partner (56%). A quarter (25%) live with their children or their partner’s chil-dren and 4% said their children have left home. Less than a fifth (17%) live on their own and 11% live with parents or family. Males were significantly more likely to live on their own (20% compared to 14% of females).
60% of the sample are in employment either full-time (38%), part-time (15%) or self-employed (7%). 4% of the sample identified themselves as unemployed (either look-ing for work or not) which is roughly in line with the national unemployment rate of 4.9% (as reported by the Office of National Statistics in October 2016). Almost a quarter of the sample (21%) is retired reflecting the fact that 22% are 65+ years of age.
Males within the sample are significantly more likely to be employed full-time (48%), whilst females are significantly more likely to be employed part-time (19%) or full-time homemakers (12%).
Just over half of those surveyed (55%) are the main income earner in their household and males (72%) were significant-ly more likely to be the main income earner compared to females (38%).
N %RELATIONSHIP STATUSMarried/civil partnership 451 45%
Single 205 21%
In a relationship (living with partner) 191 19%
In a relationship (not living with partner) 64 6%
Divorced 47 5%
Widowed 27 3%
Separated from partner/ husband /wife 13 1%
Prefer not to say 0 0%
LIVING ARRANGEMENTSLiving with partner 563 56%
Living with my children/partner’s children 254 25%
Living on my own 171 17%
Living with parents/family 106 11%
Living with housemates/friends 45 5%
My children/partner’s children have left home 38 4%
My children/partner’s children house share between parents
14 1%
WORKING STATUSEmployed full-time 387 38%
Retired 208 21%
Employed part-time 147 15%
Student 55 5%
Full-time homemaker 67 7%
Self-employed 72 7%
Unemployed - looking for work 31 3%
Disabled or too ill to work 35 4%
Unemployed - not looking for work 8 1%
TABLE (iii) SECONDARY DEMOGRAPHICS
As in the 2014 survey, the sample contains a spread in terms of socio-economic grade (see Figure 3), with those classified as C1 best represented within the sample. A quarter (25%) is classified as socio-economic grades D or E and just over a quarter (27%) were classified as so-cio-economic groups A or B.
92% of the sample identified themselves as heterosexual; in line with the ONS Integrated Household Survey which reported that 93.7% of the UK population identified them-selves as heterosexual or straight (see Figure (iv)). 3% of the sample identified themselves as bisexual and 3% as gay (2% gay man, 1% lesbian/gay women). 1% actively said they did not wish to disclose this information.
30% of the sample identified as having children, covering a spread of ages, as can be seen in Figure (v).
APPENDICES
FIGURE (iii) SOCIO-ECONOMIC GROUP
S7i. What is the occupation of the main income earner in your household?Base: All respondents - 1,017
FIGURE (iv) SEXUAL ORIENTATION
S5. Which of the following best describes your sexual orientation?Base: All respondents - 1,017
FIGURE (v) HOUSEHOLDS WITH CHILDREN
S6i. What ages are your children?Base: All respondents with children - 299

THECALMZONE.NET