mas macroeconomic review
TRANSCRIPT
macroeconomic
economic policy departmentVolume VII, Issue 2
October 2008
MA
S Macroeconom
ic Review
Volum
e VII, Issue 1, A
pril 2008
Volume VII, Issue 2 October 2008
macro eco cover.indd 2 10/29/07 3:32:22 PM
Economic Policy Department Monetary Authority of Singapore

ISSN 0219-8908
Economic Policy Department Monetary Authority of Singapore
http://www.mas.gov.sg
All rights reserved. No part of this publication may be reproduced, stored in a retrieval system or transmitted in any form or by any means, electronic, mechanised, photocopying, recording or otherwise, without the prior written permission of the copyright owner except in accordance with the provisions of the Copyright Act (Cap. 63). Application for the copyright owner's written permission to reproduce any part of this publication should be addressed to:
Economic Policy Department Monetary Authority of Singapore 10 Shenton Way MAS Building Singapore 079117
Printed by Chung Printing
macro eco cover.indd 3 10/29/07 3:32:22 PM
Published in October 2008
Monetary Authority of Singapore Economic Policy Department
Contents Preface i Highlights ii‐iii Monetary Policy Statement iv‐v 1 Macroeconomic Developments 1.1 External Developments 2
Box A: The Phillips Curve Revisited 5 1.2 Domestic Economy 10 1.3 Macroeconomic Policy 18
Box B: Review of MAS’ Money Market Operations in FY2007/08 25 2 Wage‐Price Dynamics 2.1 Labour Market Conditions 30 2.2 Consumer Price Developments 33
Box C: Recent Trends in Singapore’s Resident Labour Force 39 Participation Rate
3 Outlook 3.1 External Outlook 46 3.2 Outlook for the Singapore Economy 50 Box D: Market Share Analysis of Regional Manufacturing Exports 60 3.3 Labour Market 65 3.4 Inflation 67 3.5 Monetary Policy 72 Special Features
Special Feature A: An Empirical Analysis of Exchange Rate Pass‐through 76 in Singapore
Special Feature B: Analysing Oil Price Shocks and their Impact on the 86 Singapore Economy Special Feature C: Economic Benefits from International Cooperation 92 on the Environment Statistical Appendix 94 List of Selected Publications 103

Macroeconomic Review, October 2008
Monetary Authority of Singapore Economic Policy Department
LIST OF ABBREVIATIONS BCA Building & Construction Authority bpd barrels per day bps basis points COE Certificate of Entitlement CPF Central Provident Fund CPI consumer price index DLI Domestic Liquidity Indicator DOS Department of Statistics ECB European Central Bank EDB Economic Development Board EIA Energy Information Administration EPD Economic Policy Department FAO Food and Agriculture Organisation of the United Nations FI fiscal impulse FISIM financial intermediation services indirectly measured FX foreign exchange FY financial year HDB Housing Development Board IMF International Monetary Fund IPI Import Price Index IRAS Inland Revenue Authority of Singapore LFPR labour force participation rate LPG Liquid Petroleum Gas MMOs money market operations MMS Monetary Model of Singapore MOF Ministry of Finance m‐o‐m month‐on‐month MOM Ministry of Manpower MOT Ministry of Transport MPS Monetary Policy Statement MTI Ministry of Transport NEER nominal effective exchange rate NODX non‐oil domestic exports NORX non‐oil re‐exports NTUC National Trades Union Congress OECD Organisation of Economic Cooperation and Development OPEC Organisation of the Petroleum Exporting Countries PCE personal consumption expenditures q‐o‐q quarter‐on‐quarter REER real effective exchange rate SAAR seasonally adjusted annualised rate SGS Singapore Government Securities STB Singapore Tourism Board STI Straits Times Index UBCI Unit Business Cost Index ULC Unit Labour Cost USCI Unit Services Cost Index WTI West Texas Intermediate y‐o‐y year‐on‐year
Preface i
Monetary Authority of Singapore Economic Policy Department
Preface The Macroeconomic Review is published twice a year in conjunction with the release of the MAS Monetary Policy Statement. The Review documents the Economic Policy Department’s (EPD) analyses and assessment of macroeconomic developments in the Singapore economy, and shares with market participants, analysts and the wider public the basis for the policy decisions conveyed in the Monetary Policy Statement. It also features results from some of the in‐depth studies undertaken by the department on various economic issues facing Singapore. The Review was edited by Associate Professor Peter Wilson. We are grateful to Professor Sam Ouliaris for his assistance and guidance with the empirical analysis on the exchange rate pass‐through in Singapore and Professor Andrew Rose for his contribution of Special Feature C. The data used in the Review were drawn from the following government agencies: BCA, CPF Board, DOS, EDB, IE Singapore, LTA, MOF, MOM, MTI, STB and URA. The Review may be accessed in PDF format on the MAS website: http://www.mas.gov.sg/publications/macro_review/index.html. The Review may also be purchased at major bookstores, online (http://asp.marketasia.com.sg/Spore/sporeindex.asp), or on an annual subscription basis (details on the last page).
ii Macroeconomic Review, October 2008
Monetary Authority of Singapore Economic Policy Department
Highlights The global financial crisis has entered uncharted waters. What was referred to, a little more than a year ago, as a US subprime mortgage problem has since evolved into worldwide financial turmoil, requiring urgent stabilisation measures by governments in both developed and developing countries. The financial turbulence has caused risk aversion on a wider scale and, subsequently, a sharp squeeze on liquidity and credit. This will have significant repercussions for other areas of economic activity. The full magnitude of the crisis is yet unknown and the efficacy of mitigating policy responses remains to be seen. However, the balance of risks has increasingly shifted away from earlier fears of rising inflationary pressures to concerns over significantly weaker economic growth. As a small and open economy with strong linkages with the global economy and international financial markets, Singapore will not be immune to this turbulence. Indeed, the economy has already weakened over the course of this year. GDP growth slowed from 7.7% last year to 4.6% in the first half of 2008 and is estimated to have slipped to ‐0.5% y‐o‐y in the third quarter. Moreover, growth is expected to remain below trend in 2009. Meanwhile, CPI inflation appears to have peaked in tandem with the cooling economy and the moderation in global commodity prices. A detailed review of recent developments in the external environment and the Singapore economy can be found in Chapters 1 and 2. In commemoration of the 50th anniversary of the seminal article by A. W. Phillips, who first documented the empirical relationship between wage inflation and the level of unemployment, Box A revisits the “Phillips Curve” relationship and considers the lessons that can be learnt from it since the 1970s. Previously in the Review, we had explored the concept of a weak synchronicity between the Asian and G3 economies. In Chapter 3, we reconsider this issue and suggest that Asia’s initial insulation arising from the weak synchronicity of its business cycle with developed countries might wane in the coming months. We also set out a framework that identifies the transmission channels through which global financial and economic shocks can affect domestic economic activity. This supplements our earlier analysis which categorised the prospects for different sectors of the economy according to their vulnerability to a slowdown in US demand. Some of these spillovers have already been felt while others will take time to filter through the system. We conclude this chapter with EPD’s outlook for the labour market and inflation, which envisages a moderation in employment growth and a decline in underlying inflation alongside the narrowing of the output gap. Looking beyond the immediate cyclical stresses confronting the economy, this Review discusses longer‐term structural challenges for Singapore. Box C examines trends in the resident labour force participation rate, and identifies female and older‐age cohorts as presenting opportunities to augment future labour force growth. Box D presents EPD’s findings on the changing export market shares of seven East Asian economies over the last five years, and highlights the continuous process of upgrading to higher value added exports that is evident among the advanced economies in Asia, including Singapore, thus ensuring their continuing relevance in global markets. We also include in this Review three Special features. Special Feature A is an econometric analysis of the effect of Singapore’s monetary policy on prices. In particular, it documents the magnitude of the exchange rate impact on consumer price changes across the business cycle, as well as the time lags for the transmission to be completed. This is especially pertinent today as the economy transits from a period of sustained above‐trend growth amidst rising external inflationary pressures to one characterised by weaker economic growth and a diminution of inflationary pressures. We find evidence of asymmetric effects in the pricing behaviour of wholesalers and retailers. For example, retailers appear to pass on a greater amount of an import cost increase to consumers during an economic upturn, compared to other periods.

Highlights iii
Monetary Authority of Singapore Economic Policy Department
Special Feature B examines in some detail the effect of oil price shocks on growth and inflation outcomes in Singapore, where a number of industries from transport‐hub services to rig‐building and petrochemicals are tied to oil prices. We also document the decline in industries’ dependence on oil since 2001 and highlight the importance of identifying the source and duration of an oil price shock in order to ascertain its impact on the economy. Finally, the current financial crisis has put the spotlight on the importance of global interdependence and the need for international co‐operation. This Review concludes with a Special Feature by Professor Andrew Rose of the University of California, Berkeley, on how international environmental agreements can be more forthcoming and how they can strengthen economic linkages between countries. The next issue of the Review will be released in April 2009.
Economic Policy Department Monetary Authority of Singapore
28 October 2008
iv Macroeconomic Review, October 2008
Monetary Authority of Singapore Economic Policy Department
10 October 2008
Monetary Policy Statement
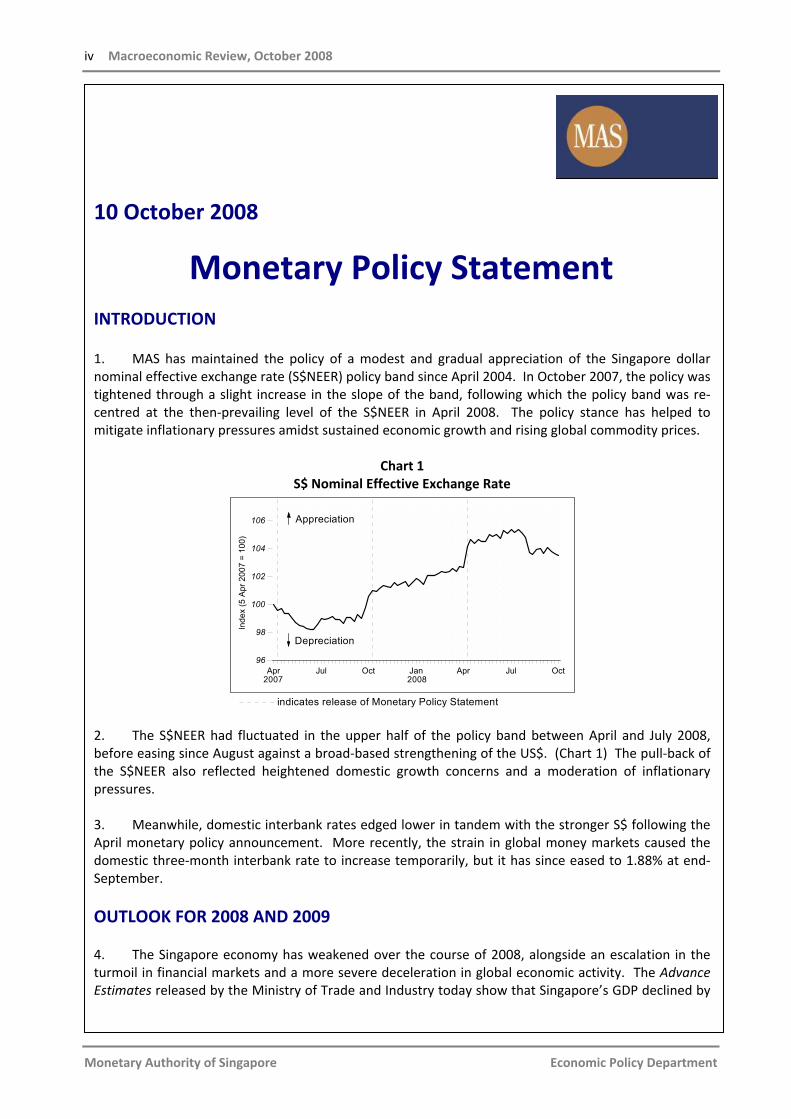
INTRODUCTION 1. MAS has maintained the policy of a modest and gradual appreciation of the Singapore dollar nominal effective exchange rate (S$NEER) policy band since April 2004. In October 2007, the policy was tightened through a slight increase in the slope of the band, following which the policy band was re‐centred at the then‐prevailing level of the S$NEER in April 2008. The policy stance has helped to mitigate inflationary pressures amidst sustained economic growth and rising global commodity prices.
Chart 1 S$ Nominal Effective Exchange Rate
Apr Jul Oct Jan Apr Jul Oct
96
98
100
102
104
106
Inde
x (5
Apr
200
7 =
100)
indicates release of Monetary Policy Statement
Appreciation
Depreciation
2007 2008
2. The S$NEER had fluctuated in the upper half of the policy band between April and July 2008, before easing since August against a broad‐based strengthening of the US$. (Chart 1) The pull‐back of the S$NEER also reflected heightened domestic growth concerns and a moderation of inflationary pressures. 3. Meanwhile, domestic interbank rates edged lower in tandem with the stronger S$ following the April monetary policy announcement. More recently, the strain in global money markets caused the domestic three‐month interbank rate to increase temporarily, but it has since eased to 1.88% at end‐September.
OUTLOOK FOR 2008 AND 2009 4. The Singapore economy has weakened over the course of 2008, alongside an escalation in the turmoil in financial markets and a more severe deceleration in global economic activity. The Advance Estimates released by the Ministry of Trade and Industry today show that Singapore’s GDP declined by

Monetary Policy Statement v
Monetary Authority of Singapore Economic Policy Department
6.3% on a quarter‐on‐quarter seasonally adjusted annualised basis in Q3 2008. On a year‐ago basis, activity also contracted mildly. The slowdown was generally broad based as external shocks were transmitted to the domestic economy via both the financial and trade channels. Nonetheless, certain industries, such as transport & storage, information & communications, and bank intermediation, continued to hold up, providing some support to GDP growth. 5. Looking ahead, the outlook for the global economy has deteriorated amidst heightened risk aversion and deleveraging in the financial sector. After a brief rebound in Q2 2008, economic conditions in the US have worsened as the effects of the fiscal stimulus package dissipated. The Japanese and Eurozone economies contracted in Q2 2008 and near‐term conditions remain difficult. Economies in Asia, including China and India, are also expected to slow. 6. These developments have presented new uncertainties for the Singapore economy. The risks to external demand conditions continue to be on the downside, and a more severe global downturn cannot be discounted. Slower growth in Asia will restrain activity in a range of services industries in Singapore such as transport‐hub and tourism. Against this less favourable environment, Singapore’s GDP growth forecast for 2008 has been revised from 4‐5% to around 3%. Economic growth will likely remain below its potential rate over the next few quarters. Prospects of a recovery in the latter half of 2009 will depend significantly on how conditions evolve in the G3 and regional economies. 7. CPI inflation has peaked, declining from 7.5% in Q2 2008 to 6.5% in July‐August on a year‐on‐year basis. In addition, it has fallen on a quarter‐on‐quarter basis, easing from 2.1% in Q1 to 1.4% in Q2 and 1.1% in July‐August. The sequential fall in CPI inflation reflects a moderation of both external and domestic price pressures. Externally, the recent sharp decline in commodity prices has helped to dampen global inflation. Domestically, the effects of past monetary policy tightening measures and the slowing economy have alleviated price pressures and eased resource constraints. Cost pressures have begun to recede, as evidenced by the recent fall in commercial rentals and more subdued wage increases. 8. CPI inflation is projected to come within the 6‐7% forecast range in 2008, while the MAS underlying inflation measure, which excludes accommodation and private road transport costs, is expected to be 5‐6%. Over the coming months and into early 2009, the headline inflation rate will continue to be impacted by the pass‐through of some earlier domestic cost increases. Nevertheless, CPI inflation is expected to trend down in 2009 as the global and domestic economies slow and for the year as a whole it is forecast to moderate to 2.5‐3.5%, with the MAS underlying inflation coming down to around 2%.
MONETARY POLICY 9. Against the backdrop of a weakening external economic environment and continuing stresses in global financial markets, the growth of the Singapore economy is expected to remain below potential in the period ahead. Concomitantly, external and domestic inflationary pressures are likely to ease. 10. MAS is therefore shifting its policy stance to a zero percent appreciation of the S$NEER policy band. This policy maintains the current level of the policy band, and there will be no re‐centring of the band or change to its width. MAS stands ready to intervene to dampen excessive volatility in the S$NEER should this become necessary. MAS will also continue to closely monitor developments in the external environment and their impact on the Singapore economy.


Chapter 1 Macroeconomic
Developments

2 Macroeconomic Review, October 2008
Monetary Authority of Singapore Economic Policy Department
1.1 External Developments Worsening Growth‐Inflation Dynamics The global economy faced challenging conditions
in H1 2008. The global economic environment proved challenging in the first half of 2008. The growth‐inflation mix in the G3 economies was particularly unfavourable, with growth turning down sharply and headline CPI inflation reaching multi‐year highs. (Charts 1.1 and 1.5) Box A on “The Phillips Curve Revisited” provides a historical perspective on the changing growth‐inflation dynamics that has confronted the global economy over the decades. In comparison, while headline CPI inflation in Asia ex‐Japan1 also surged, growth held up relatively well as domestic demand and exports to emerging markets helped to offset weaker demand from the G3 economies. Asia’s domestic demand was more robust, due in part to the healthier balance sheets of the banking, corporate and household sectors. These factors enabled Asia’s growth to become less synchronised with the business cycle in the G3 economies, at least in H1 this year. (Table 1.1)
Underlying US domestic demand was tepid in Q2 2008.
In the US, underlying domestic demand was tepid in Q2 2008, weighed down by the housing market correction, ongoing financial market turbulence and deteriorating labour market. Although growth picked up to 2.8% q‐o‐q SAAR in Q2 from 0.9% in Q1, this was primarily due to external demand and the one‐off government transfers to households. (Chart 1.2) Net exports contributed a significant 2.9% points to GDP growth, while fiscal disbursements to households boosted personal disposable income at an annualised rate of 17%, which temporarily lifted consumer spending. Even so, personal consumption growth only picked up slightly to 1.2% in Q2, compared with 0.9% in Q1 2008 and an average of 3.0% between Q1 2003 and Q4 2007.
Chart 1.1 G3 GDP Growth
2006 Q3 2007 Q3 2008 Q2-4
-2
0
2
4
6
QO
Q S
AA
R %
Gro
wth
Japan
USEurozone
G3*
Source: Datastream * Weighted by 2007 nominal GDP in US$, converted at the 2007 average exchange rate.
Table 1.1
GDP Growth y‐o‐y (%)
2008 2006 2007
Q1 Q2 Total* 5.0 5.0 5.0 4.2 Industrial Countries* 2.8 2.5 2.2 1.7 US 2.8 2.0 2.5 2.1 Eurozone 3.0 2.6 2.1 1.4 Japan 2.4 2.1 1.2 0.7
NIE‐3* 5.9 5.9 6.7 4.4 Hong Kong 7.0 6.4 7.3 4.2 Korea 5.1 5.0 5.8 4.8 Taiwan 4.9 5.7 6.3 4.3
ASEAN‐4* 5.5 6.1 6.5 6.0 Indonesia 5.5 6.3 6.3 6.4 Malaysia 5.8 6.3 7.1 6.3 Thailand 5.1 4.8 6.1 5.3 Philippines 5.4 7.2 4.7 4.6 China 11.6 11.9 10.6 10.1 India 9.8 9.3 8.8 7.9
Source: CEIC and Datastream * Weighted by shares in Singapore’s non‐oil domestic exports.
1 Asia ex‐Japan comprises ASEAN‐4 (Indonesia, Malaysia, the Philippines, Thailand), NIE‐3 (Hong Kong, South Korea,
Taiwan), China and India.

Macroeconomic Developments 3
Monetary Authority of Singapore Economic Policy Department
More recently, real consumer spending fell by an average of 2.9% m‐o‐m SAAR in July and August, as the effects of the tax rebates dissipated. Residential investment continued to decline at a double‐digit rate, as housing demand remained depressed.
Growth weakened sharply in the Eurozone and Japan …
In the Eurozone economies, growth momentum has decelerated significantly. Following a strong expansion of 2.7% q‐o‐q SAAR in Q1 2008, GDP growth in the Eurozone fell by 0.7% in Q2. This was the first contraction in nearly a decade, dragged down by slippage in Germany, France and Italy, the three largest economies in the Eurozone. The decline was across all the expenditure components of GDP except government consumption, as higher borrowing costs, rising inflation, housing market corrections and softening global demand dampened confidence and economic activity. The Japanese economy contracted by 3.0% q‐o‐q SAAR in Q2 2008, after two quarters of above 2% growth. In particular, private consumption fell at its sharpest rate in seven quarters, in tandem with the plunge in consumer confidence to its lowest point in 26 years. Corporate investment contracted at a more rapid pace in Q2 as firms continued to be constrained by falling profits and poor business sentiment. Exports, which supported growth throughout 2007 and Q1 2008, also registered their first decline in 13 quarters. … while Asia ex‐Japan remained relatively resilient. Asia ex‐Japan has been fairly resilient so far this year, with growth moderating only slightly from 7.4% y‐o‐y in Q1 2008 to 6.4% in Q2. The slowdown was more pronounced in the Northeast Asian economies of Hong Kong, Korea and Taiwan, where household and fixed investment spending growth slowed from 3.5% in Q1 to 1.0% in Q2 due to the global financial turmoil and surging inflation. (Chart 1.3) However, domestic demand growth in the resource‐rich Southeast Asian economies, especially Malaysia and Indonesia, held up well at 4.5% in Q2, reflecting the positive terms of trade shock from high commodity prices, such as for crude petroleum, palm oil and rice. (Chart 1.4) China also continued to power ahead, with growth reaching 10.4% in H1 2008, before moderating somewhat to 9.0% in Q3. The buoyant Chinese economy acted as a catalyst
Chart 1.2 Contribution to US GDP Growth
2006 Q3 2007 Q3 2008-4
0
4
8
GD
P Q
OQ
SA
AR
Gro
wth
% P
oint
Con
trib
utio
n to
-4
0
4
8
-4
QO
Q S
AA
R %
Gro
wth
Personal Consumption ExpendituresBusiness SpendingResidential Investments
Change in InventoriesNet ExportsGovernmentGDP (RHS)
Q2 Source: Bureau of Economic Analysis
Chart 1.3 Contribution to NIE‐3 GDP Growth
2006 Q3 2007 Q3 2008-2
0
2
4
6
8G
DP
YOY
Gro
wth
% P
oint
Con
trib
utio
n to
4.0
4.5
5.0
5.5
6.0
6.5
YOY
% G
row
th
OthersInvestment
Private Consumption
Govt Consumption
Net Exports
GDP Growth (RHS)
Q2
Source: CEIC
Chart 1.4 Contribution to ASEAN‐4 GDP Growth
2006 Q3 2007 Q3 2008-3
0
3
6
9
GD
P YO
Y G
row
th%
Poi
nt C
ontr
ibut
ion
to
5.2
5.6
6.0
6.4
6.8
YOY
% G
row
th
Q2
OthersInvestment
Private Consumption
Govt Consumption
Net Exports
GDP Growth (RHS)
Source: CEIC
4 Macroeconomic Review, October 2008
Monetary Authority of Singapore Economic Policy Department
for the rest of Asia’s exports, benefiting the suppliers of both intermediate inputs and final consumer goods. Most regions faced rising inflationary pressures.
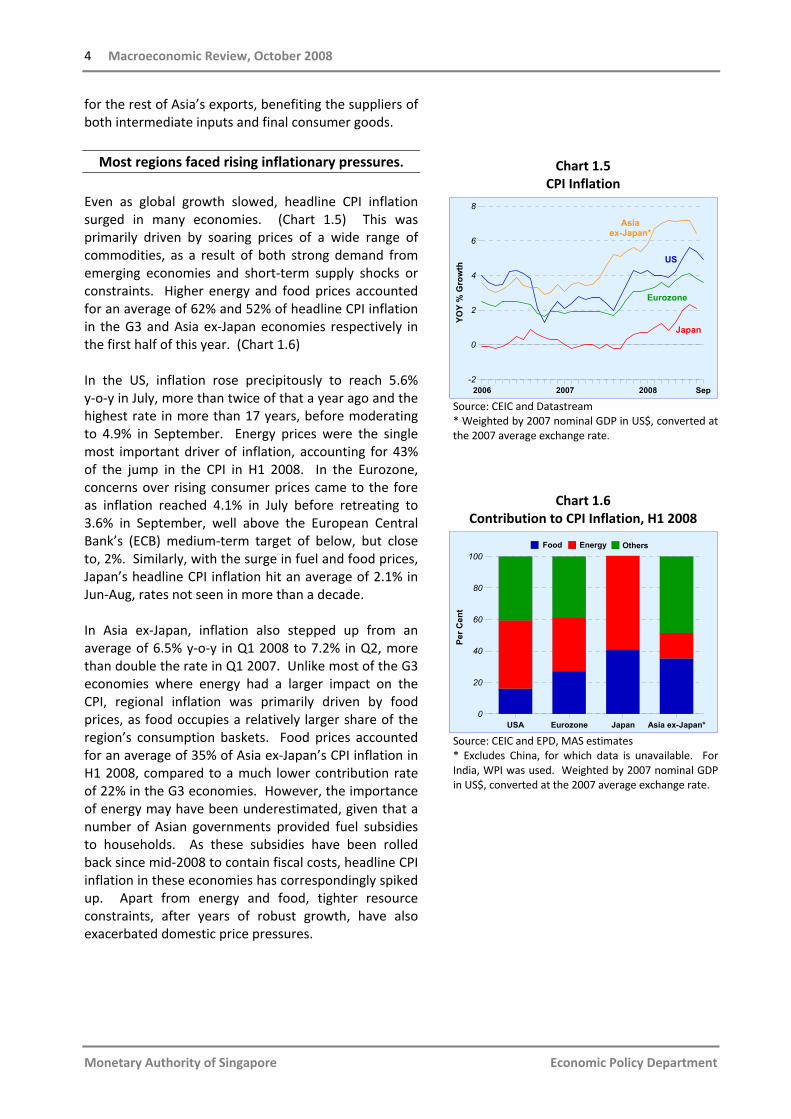
Even as global growth slowed, headline CPI inflation surged in many economies. (Chart 1.5) This was primarily driven by soaring prices of a wide range of commodities, as a result of both strong demand from emerging economies and short‐term supply shocks or constraints. Higher energy and food prices accounted for an average of 62% and 52% of headline CPI inflation in the G3 and Asia ex‐Japan economies respectively in the first half of this year. (Chart 1.6) In the US, inflation rose precipitously to reach 5.6% y‐o‐y in July, more than twice of that a year ago and the highest rate in more than 17 years, before moderating to 4.9% in September. Energy prices were the single most important driver of inflation, accounting for 43% of the jump in the CPI in H1 2008. In the Eurozone, concerns over rising consumer prices came to the fore as inflation reached 4.1% in July before retreating to 3.6% in September, well above the European Central Bank’s (ECB) medium‐term target of below, but close to, 2%. Similarly, with the surge in fuel and food prices, Japan’s headline CPI inflation hit an average of 2.1% in Jun‐Aug, rates not seen in more than a decade. In Asia ex‐Japan, inflation also stepped up from an average of 6.5% y‐o‐y in Q1 2008 to 7.2% in Q2, more than double the rate in Q1 2007. Unlike most of the G3 economies where energy had a larger impact on the CPI, regional inflation was primarily driven by food prices, as food occupies a relatively larger share of the region’s consumption baskets. Food prices accounted for an average of 35% of Asia ex‐Japan’s CPI inflation in H1 2008, compared to a much lower contribution rate of 22% in the G3 economies. However, the importance of energy may have been underestimated, given that a number of Asian governments provided fuel subsidies to households. As these subsidies have been rolled back since mid‐2008 to contain fiscal costs, headline CPI inflation in these economies has correspondingly spiked up. Apart from energy and food, tighter resource constraints, after years of robust growth, have also exacerbated domestic price pressures.
Chart 1.5 CPI Inflation
2006 2007 2008 Sep-2
0
2
4
6
8
YOY
% G
row
th
Japan
US
Eurozone
Asia ex-Japan*
Source: CEIC and Datastream * Weighted by 2007 nominal GDP in US$, converted at the 2007 average exchange rate.
Chart 1.6 Contribution to CPI Inflation, H1 2008
USA Eurozone Japan Asia ex-Japan*0
20
40
60
80
100
Per C
ent
OthersFood Energy
Source: CEIC and EPD, MAS estimates * Excludes China, for which data is unavailable. For India, WPI was used. Weighted by 2007 nominal GDP in US$, converted at the 2007 average exchange rate.

Macroeconomic Developments 5
Monetary Authority of Singapore Economic Policy Department
Box A The Phillips Curve Revisited
This year marks the 50th anniversary of the seminal article in Economica by the New Zealand‐born economist A. W. Phillips, who first documented the empirical relationship between the level of unemployment and the rate of change of money wage rates, or wage inflation. This box explores how the Phillips curve can be used to interpret economic developments over the decades since the 1970s. The Phillips curve in its original form showed an inverse relationship between the rate of unemployment and the rate of wage increases for the UK economy between 1861 and 1913. (Chart A1) It seemed to suggest that unemployment and inflation were linked in a systematic way that economists had not previously appreciated, and offered the tantalising possibility of a trade‐off over time between unemployment and price inflation, provided that productivity change was held constant and import price rises were not excessive. Years with low unemployment tended to have higher inflation, and years with high unemployment tended to have lower inflation.1/
Chart A1 The Phillips Curve for the UK, 1861‐1913
0 1 2 3 4 5
UK Unemployment Rate (%)
-3
0
3
6
9
12
UK
Wag
e In
flatio
n (%
)
Following Phillips’ 1958 paper, other economists such as Paul Samuelson and Robert Solow also found the same relationship for other countries, especially the US. They believed, incorrectly as it turned out, that there was a stable relationship between inflation and unemployment, such that the Phillips curve offered policymakers a “menu of choice” in terms of macroeconomic outcomes. By using monetary and fiscal policy to influence aggregate demand, policymakers could choose to move the economy to any point on the curve and read off the corresponding inflation and unemployment rates. For example, if the current rate of unemployment was deemed to be too high, policymakers could adopt expansionary fiscal and monetary policies to move to where the unemployment rate was lower but would be obliged to accept a higher rate of inflation as the trade‐off. The Great Inflation The misguided perception of a stable trade‐off between growth and inflation led many governments in the 1960s and 1970s to pursue overly expansionary monetary and fiscal policies to reduce unemployment, which resulted in persistently high inflation over that period. Sustained fiscal deficits also contributed to excessive aggregate demand pressures. Meltzer (2005) noted that “Neglecting or ignoring the effects of policy actions (i.e. fiscal deficits) on money growth or inflation was a major error in the 1960s and 1970s”. Policymakers at that time also thought that inflation could be reined in by wage‐price controls, under the
1/ Subsequent work on the Phillips curve replaced the unemployment rate with the output gap, but the inferences
remain the same.
6 Macroeconomic Review, October 2008
Monetary Authority of Singapore Economic Policy Department
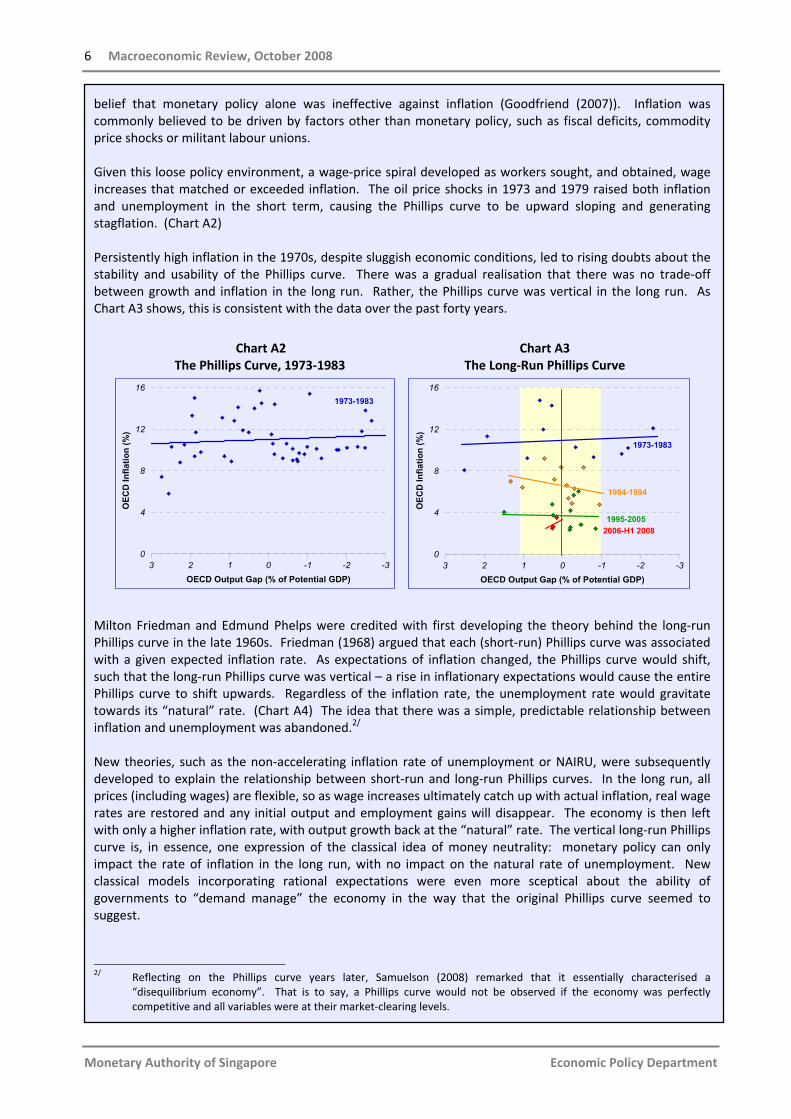
belief that monetary policy alone was ineffective against inflation (Goodfriend (2007)). Inflation was commonly believed to be driven by factors other than monetary policy, such as fiscal deficits, commodity price shocks or militant labour unions. Given this loose policy environment, a wage‐price spiral developed as workers sought, and obtained, wage increases that matched or exceeded inflation. The oil price shocks in 1973 and 1979 raised both inflation and unemployment in the short term, causing the Phillips curve to be upward sloping and generating stagflation. (Chart A2) Persistently high inflation in the 1970s, despite sluggish economic conditions, led to rising doubts about the stability and usability of the Phillips curve. There was a gradual realisation that there was no trade‐off between growth and inflation in the long run. Rather, the Phillips curve was vertical in the long run. As Chart A3 shows, this is consistent with the data over the past forty years.
Chart A2
The Phillips Curve, 1973‐1983 Chart A3
The Long‐Run Phillips Curve
-3-2-10123OECD Output Gap (% of Potential GDP)
0
4
8
12
16
OEC
D In
flatio
n (%
)
-3-2-10123OECD Output Gap (% of Potential GDP)
0
4
8
12
16
OEC
D In
flatio
n (%
)
1973-1983
1973-1983
2006-H1 20081995-2005
1984-1994
Milton Friedman and Edmund Phelps were credited with first developing the theory behind the long‐run Phillips curve in the late 1960s. Friedman (1968) argued that each (short‐run) Phillips curve was associated with a given expected inflation rate. As expectations of inflation changed, the Phillips curve would shift, such that the long‐run Phillips curve was vertical – a rise in inflationary expectations would cause the entire Phillips curve to shift upwards. Regardless of the inflation rate, the unemployment rate would gravitate towards its “natural” rate. (Chart A4) The idea that there was a simple, predictable relationship between inflation and unemployment was abandoned.2/
New theories, such as the non‐accelerating inflation rate of unemployment or NAIRU, were subsequently developed to explain the relationship between short‐run and long‐run Phillips curves. In the long run, all prices (including wages) are flexible, so as wage increases ultimately catch up with actual inflation, real wage rates are restored and any initial output and employment gains will disappear. The economy is then left with only a higher inflation rate, with output growth back at the “natural” rate. The vertical long‐run Phillips curve is, in essence, one expression of the classical idea of money neutrality: monetary policy can only impact the rate of inflation in the long run, with no impact on the natural rate of unemployment. New classical models incorporating rational expectations were even more sceptical about the ability of governments to “demand manage” the economy in the way that the original Phillips curve seemed to suggest.
2/ Reflecting on the Phillips curve years later, Samuelson (2008) remarked that it essentially characterised a
“disequilibrium economy”. That is to say, a Phillips curve would not be observed if the economy was perfectly competitive and all variables were at their market‐clearing levels.

Macroeconomic Developments 7
Monetary Authority of Singapore Economic Policy Department
Chart A4 The Stylised Long‐run Phillips Curve
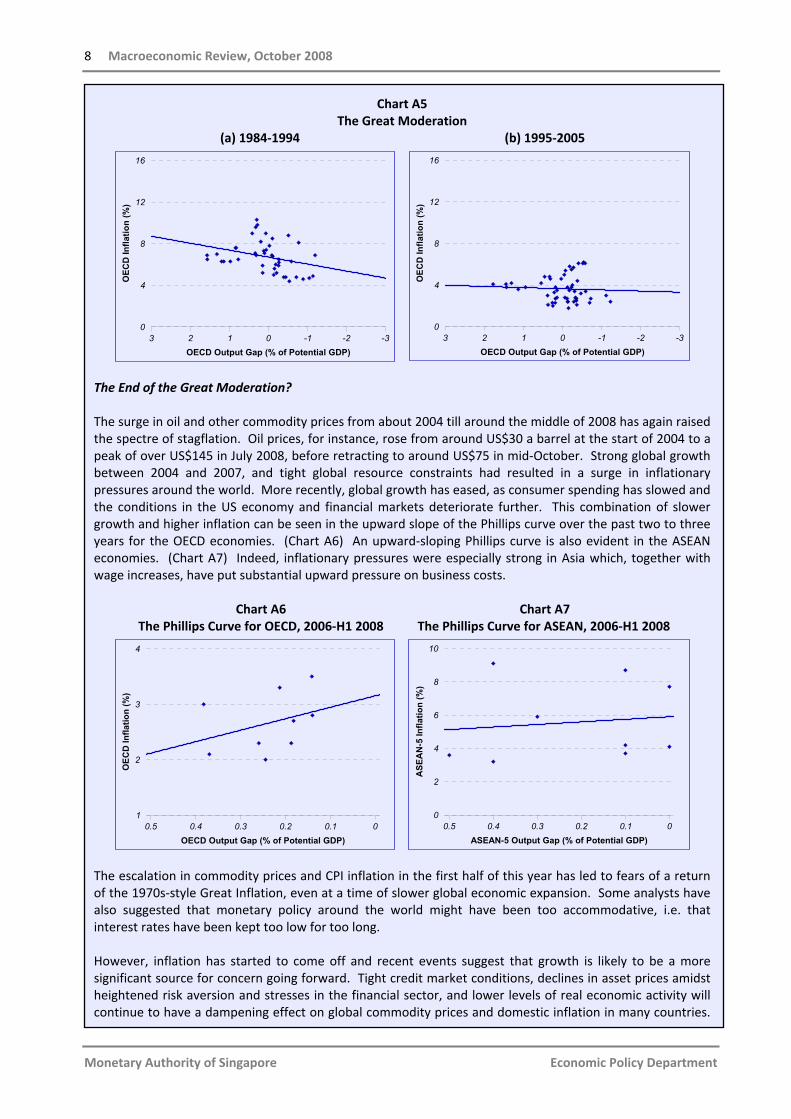
The Great Moderation Following the disappointment over the performance of the US economy in the 1970s (low growth and high inflation), then‐Fed Chairman Paul Volcker decided in October 1979 to impose very tight control over the money supply in an attempt to bring down inflation and inflationary expectations in the US. Volcker’s resolve – in the face of strong political pressure – was crucial in breaking the back of the high inflation psychology. The Fed funds rate rose to almost 20% in 1981 and the unemployment rate soared to 11% at the end of 1982. At the same time, many other OECD countries, such as the UK, also came round to the view that there was no long‐term trade‐off between growth and inflation and that tight monetary policy was necessary to reverse inflationary expectations. As inflation moderated, the Phillips curve edged down and became downward sloping again. The Great Moderation that followed was characterised by a substantial reduction in the variability of both output and inflation. Some studies have suggested that the variability of quarterly real GDP growth has declined by half since the mid‐1980s, while the variability of quarterly inflation has declined by about two‐thirds (see for example, Blanchard and Simon (2001)). Romer and Romer (2002) noted that aggregate demand policy during this period became “more temperate” and once again committed to low inflation. They contended that “the fundamental source of changes in policy has been changes in policymakers’ beliefs in how the economy functions”. Bernanke (2004) argued that “improved monetary policy has likely made an important contribution not only to the reduced volatility of inflation (which is not particularly controversial) but to the reduced volatility of output as well”. At the global level, other factors also contributed to the Great Moderation. Worldwide import tariff reductions and the emergence of China as a low‐cost “factory of the world” helped to keep goods prices down. At the same time, IT advances contributed to higher productivity growth, while the increased depth and sophistication of financial markets and more efficient inventory management techniques, made possible by advances in IT and communications technology, improved macroeconomic performance. The result was a period of sustained strong growth without escalating inflation, or what Bank of England Governor Mervyn King (2003) called a NICE – Non‐Inflationary Consistently Expansionary – period. Beginning in the mid‐1980s, the Great Moderation marked a golden age for the OECD in terms of sustained economic growth with low inflation. (Charts A5a and A5b) The power of the trade unions was weakened, commodity price inflation was subdued and inflationary expectations stabilised at lower levels. Globalisation in trade, investment and capital flows also proceeded at a rapid pace during this period. Samuelson (2008) noted that the US economy became “virtually a Say’s Law economy” in that a cowed US labour force – under threat from foreign lower‐wage, productive workers – had to accept jobs with lower real wages.
Long-run Phillips curve
InflationRate
UnemploymentRate
Natural rate ofunemployment
0
Lowinflation
Highinflation
8 Macroeconomic Review, October 2008
Monetary Authority of Singapore Economic Policy Department
Chart A5 The Great Moderation
(a) 1984‐1994 (b) 1995‐2005
-3-2-10123OECD Output Gap (% of Potential GDP)
0
4
8
12
16
OEC
D In
flatio
n (%
)
-3-2-10123OECD Output Gap (% of Potential GDP)
0
4
8
12
16
OEC
D In
flatio
n (%
)
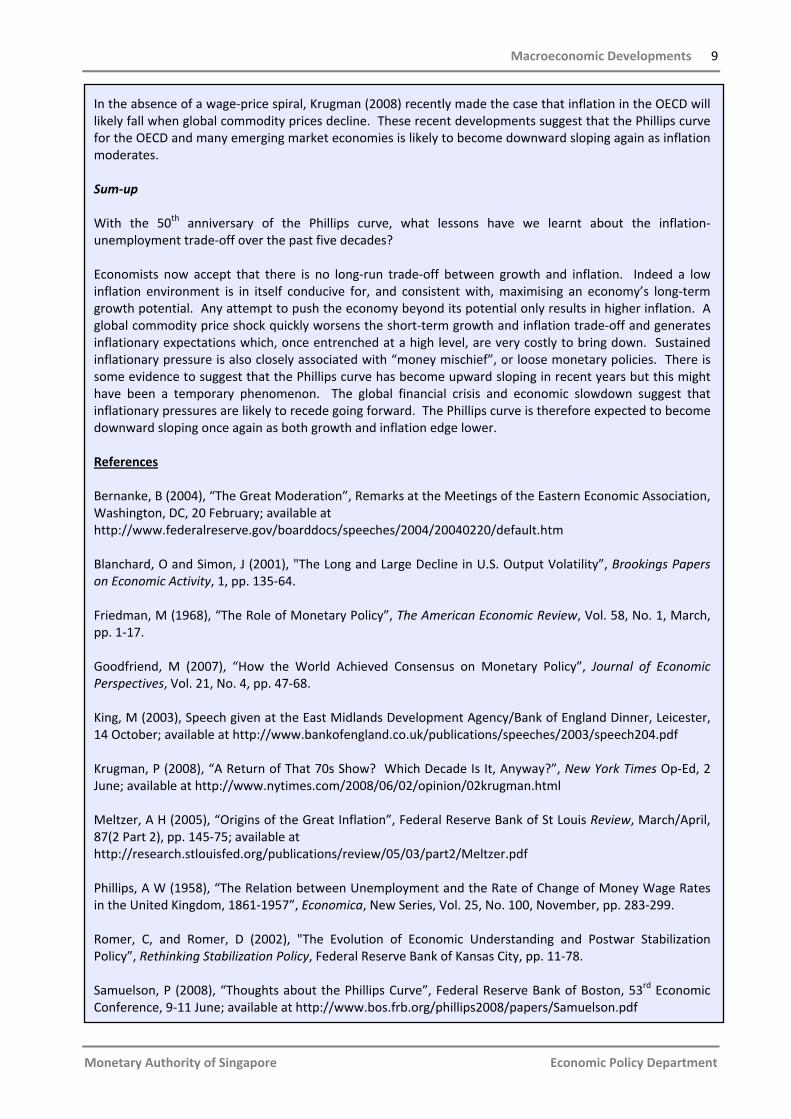
The End of the Great Moderation? The surge in oil and other commodity prices from about 2004 till around the middle of 2008 has again raised the spectre of stagflation. Oil prices, for instance, rose from around US$30 a barrel at the start of 2004 to a peak of over US$145 in July 2008, before retracting to around US$75 in mid‐October. Strong global growth between 2004 and 2007, and tight global resource constraints had resulted in a surge in inflationary pressures around the world. More recently, global growth has eased, as consumer spending has slowed and the conditions in the US economy and financial markets deteriorate further. This combination of slower growth and higher inflation can be seen in the upward slope of the Phillips curve over the past two to three years for the OECD economies. (Chart A6) An upward‐sloping Phillips curve is also evident in the ASEAN economies. (Chart A7) Indeed, inflationary pressures were especially strong in Asia which, together with wage increases, have put substantial upward pressure on business costs.
Chart A6 The Phillips Curve for OECD, 2006‐H1 2008
Chart A7 The Phillips Curve for ASEAN, 2006‐H1 2008
00.10.20.30.40.5OECD Output Gap (% of Potential GDP)
1
2
3
4
OEC
D In
flatio
n (%
)
00.10.20.30.40.5ASEAN-5 Output Gap (% of Potential GDP)
0
2
4
6
8
10
ASE
AN
-5 In
flatio
n (%
)
The escalation in commodity prices and CPI inflation in the first half of this year has led to fears of a return of the 1970s‐style Great Inflation, even at a time of slower global economic expansion. Some analysts have also suggested that monetary policy around the world might have been too accommodative, i.e. that interest rates have been kept too low for too long. However, inflation has started to come off and recent events suggest that growth is likely to be a more significant source for concern going forward. Tight credit market conditions, declines in asset prices amidst heightened risk aversion and stresses in the financial sector, and lower levels of real economic activity will continue to have a dampening effect on global commodity prices and domestic inflation in many countries.
Macroeconomic Developments 9
Monetary Authority of Singapore Economic Policy Department
In the absence of a wage‐price spiral, Krugman (2008) recently made the case that inflation in the OECD will likely fall when global commodity prices decline. These recent developments suggest that the Phillips curve for the OECD and many emerging market economies is likely to become downward sloping again as inflation moderates. Sum‐up With the 50th anniversary of the Phillips curve, what lessons have we learnt about the inflation‐unemployment trade‐off over the past five decades? Economists now accept that there is no long‐run trade‐off between growth and inflation. Indeed a low inflation environment is in itself conducive for, and consistent with, maximising an economy’s long‐term growth potential. Any attempt to push the economy beyond its potential only results in higher inflation. A global commodity price shock quickly worsens the short‐term growth and inflation trade‐off and generates inflationary expectations which, once entrenched at a high level, are very costly to bring down. Sustained inflationary pressure is also closely associated with “money mischief”, or loose monetary policies. There is some evidence to suggest that the Phillips curve has become upward sloping in recent years but this might have been a temporary phenomenon. The global financial crisis and economic slowdown suggest that inflationary pressures are likely to recede going forward. The Phillips curve is therefore expected to become downward sloping once again as both growth and inflation edge lower. References Bernanke, B (2004), “The Great Moderation”, Remarks at the Meetings of the Eastern Economic Association, Washington, DC, 20 February; available at http://www.federalreserve.gov/boarddocs/speeches/2004/20040220/default.htm Blanchard, O and Simon, J (2001), "The Long and Large Decline in U.S. Output Volatility”, Brookings Papers on Economic Activity, 1, pp. 135‐64. Friedman, M (1968), “The Role of Monetary Policy”, The American Economic Review, Vol. 58, No. 1, March, pp. 1‐17. Goodfriend, M (2007), “How the World Achieved Consensus on Monetary Policy”, Journal of Economic Perspectives, Vol. 21, No. 4, pp. 47‐68. King, M (2003), Speech given at the East Midlands Development Agency/Bank of England Dinner, Leicester, 14 October; available at http://www.bankofengland.co.uk/publications/speeches/2003/speech204.pdf Krugman, P (2008), “A Return of That 70s Show? Which Decade Is It, Anyway?”, New York Times Op‐Ed, 2 June; available at http://www.nytimes.com/2008/06/02/opinion/02krugman.html Meltzer, A H (2005), “Origins of the Great Inflation”, Federal Reserve Bank of St Louis Review, March/April, 87(2 Part 2), pp. 145‐75; available at http://research.stlouisfed.org/publications/review/05/03/part2/Meltzer.pdf Phillips, A W (1958), “The Relation between Unemployment and the Rate of Change of Money Wage Rates in the United Kingdom, 1861‐1957”, Economica, New Series, Vol. 25, No. 100, November, pp. 283‐299. Romer, C, and Romer, D (2002), "The Evolution of Economic Understanding and Postwar Stabilization Policy”, Rethinking Stabilization Policy, Federal Reserve Bank of Kansas City, pp. 11‐78. Samuelson, P (2008), “Thoughts about the Phillips Curve”, Federal Reserve Bank of Boston, 53rd Economic Conference, 9‐11 June; available at http://www.bos.frb.org/phillips2008/papers/Samuelson.pdf
10 Macroeconomic Review, October 2008
Monetary Authority of Singapore Economic Policy Department
1.2 Domestic Economy Cold Currents Hit the Economy
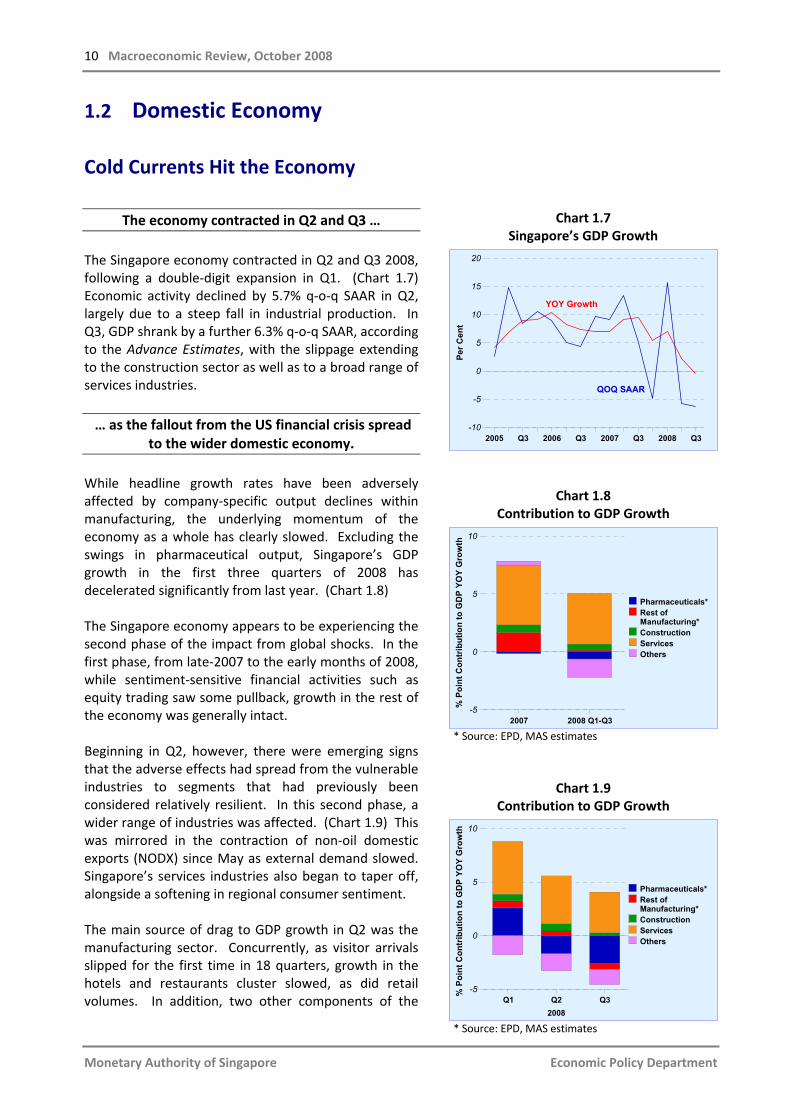
The economy contracted in Q2 and Q3 … The Singapore economy contracted in Q2 and Q3 2008, following a double‐digit expansion in Q1. (Chart 1.7) Economic activity declined by 5.7% q‐o‐q SAAR in Q2, largely due to a steep fall in industrial production. In Q3, GDP shrank by a further 6.3% q‐o‐q SAAR, according to the Advance Estimates, with the slippage extending to the construction sector as well as to a broad range of services industries. … as the fallout from the US financial crisis spread
to the wider domestic economy. While headline growth rates have been adversely affected by company‐specific output declines within manufacturing, the underlying momentum of the economy as a whole has clearly slowed. Excluding the swings in pharmaceutical output, Singapore’s GDP growth in the first three quarters of 2008 has decelerated significantly from last year. (Chart 1.8) The Singapore economy appears to be experiencing the second phase of the impact from global shocks. In the first phase, from late‐2007 to the early months of 2008, while sentiment‐sensitive financial activities such as equity trading saw some pullback, growth in the rest of the economy was generally intact. Beginning in Q2, however, there were emerging signs that the adverse effects had spread from the vulnerable industries to segments that had previously been considered relatively resilient. In this second phase, a wider range of industries was affected. (Chart 1.9) This was mirrored in the contraction of non‐oil domestic exports (NODX) since May as external demand slowed. Singapore’s services industries also began to taper off, alongside a softening in regional consumer sentiment. The main source of drag to GDP growth in Q2 was the manufacturing sector. Concurrently, as visitor arrivals slipped for the first time in 18 quarters, growth in the hotels and restaurants cluster slowed, as did retail volumes. In addition, two other components of the
Chart 1.7 Singapore’s GDP Growth
2005 Q3 2006 Q3 2007 Q3 2008 Q3-10
-5
0
5
10
15
20
Per C
ent
YOY Growth
QOQ SAAR
Chart 1.8 Contribution to GDP Growth
2007 2008 Q1-Q3-5
0
5
10
% P
oint
Con
trib
utio
n to
GD
P YO
Y G
row
th
Pharmaceuticals*Rest ofManufacturing*ConstructionServicesOthers
* Source: EPD, MAS estimates
Chart 1.9 Contribution to GDP Growth
Q1 Q2 Q32008
-5
0
5
10
% P
oint
Con
trib
utio
n to
GD
P YO
Y G
row
th
Pharmaceuticals*Rest ofManufacturing*ConstructionServicesOthers
* Source: EPD, MAS estimates

Macroeconomic Developments 11
Monetary Authority of Singapore Economic Policy Department
national accounts, namely taxes on products and financial intermediation services indirectly measured (FISIM) contributed negatively to overall growth. The financial services sector as a whole, however, exhibited unexpected resilience in Q2 in spite of poor sentiment in the financial markets. Manufacturing was weighed down by a range of
cyclical and industry‐specific factors … Manufacturing output contracted by 49% q‐o‐q SAAR in Q2, buffeted by company and industry‐specific factors, as well as cyclical pressures. The slump in manufacturing was attributed to sharp reversals in the biomedical and electronics clusters following strong expansions in Q1. (Chart 1.10) In particular, pharmaceutical production plunged by 92% q‐o‐q SAAR in Q2, due in part to a temporary switch in the product mix to lower value added active pharmaceutical ingredients (API). Other industry‐specific factors also contributed to the decline in pharmaceutical output. Specifically, plant capacity was utilised for the production of intermediate output, which is recorded as manufacturing output only when converted into the full API. Similarly, clinical and validation trials – for drugs planned for production in 2009 – took up capacity at plant facilities but did not contribute to manufacturing output. Competition from cheaper generic products, a phenomenon faced by the global drug industry, also took a bite out of pharmaceutical production in Q2. The manufacturing sector was further weakened by a contraction in electronics output, which fell by 25% in Q2. (Chart 1.11) This was caused by company‐specific factors in the infocomms & consumer electronics segment, namely the winding down of production at Motorola’s handset plant in Singapore. The closure of Motorola’s handset plant also adversely affected some of the domestic contract manufacturers in the PC peripherals segment. The semiconductor segment suffered its second consecutive quarter of decline, alongside a cyclical crunch in the global IT industry. As components of electronics end‐products, semiconductors tend to be the first to feel the squeeze from weak end demand. Moreover, the domestic semiconductor segment has
Chart 1.10 Contribution to Manufacturing
Output Growth
2008 Q1 2008 Q2-60
-30
0
30
60
90
Out
put Q
OQ
SA
AR
Gro
wth
% P
oint
Con
trib
utio
n to
Man
ufac
turin
g
TransportEngineeringChemicalsGeneralManufacturingIndustriesPrecisionEngineeringElectronicsBiomedical
Chart 1.11 Contribution to Electronics Output Growth
2008 Q1 2008 Q2-30
-20
-10
0
10
20
30
Out
put Q
OQ
SA
AR
Gro
wth
% P
oint
Con
trib
utio
n to
Ele
ctro
nics
SemiconductorsComputerPeripheralsData StorageInfocomms &ConsumerElectronicsOther Electronics
12 Macroeconomic Review, October 2008
Monetary Authority of Singapore Economic Policy Department
been hit harder than other chip industries in the region, as chips produced in Singapore are higher in value and are destined chiefly for the G3 economies. … while high oil prices drove a wedge between oil
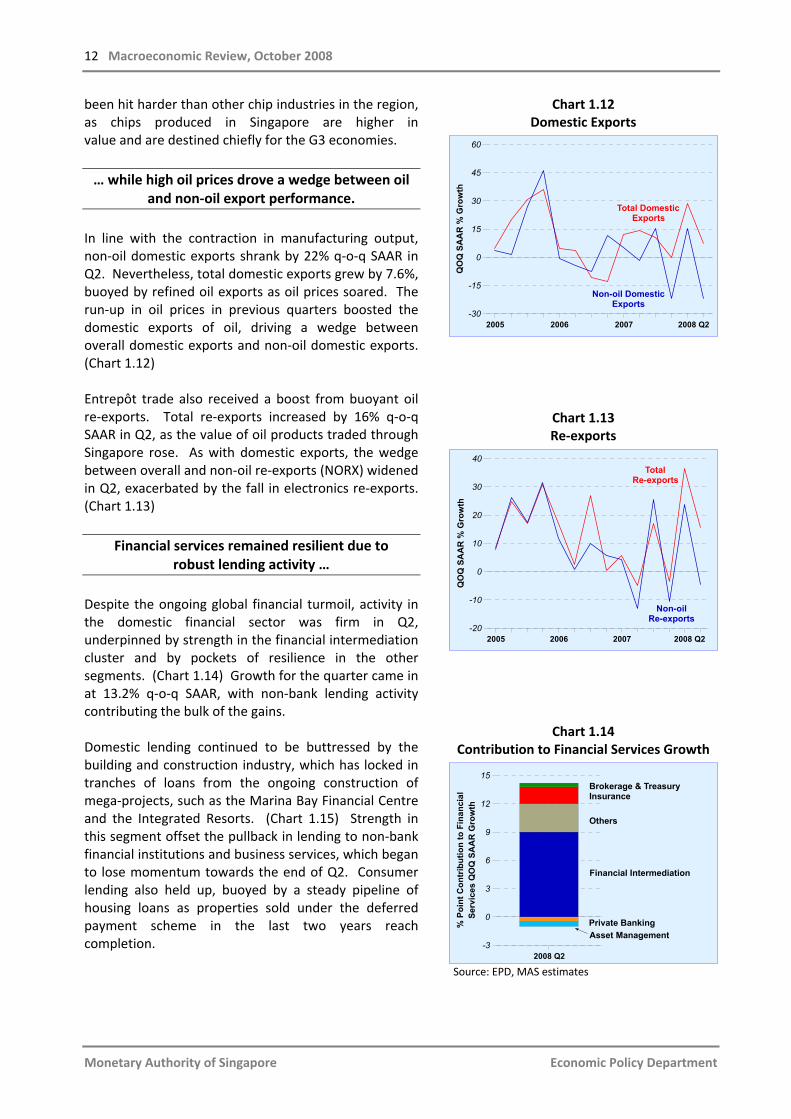
and non‐oil export performance. In line with the contraction in manufacturing output, non‐oil domestic exports shrank by 22% q‐o‐q SAAR in Q2. Nevertheless, total domestic exports grew by 7.6%, buoyed by refined oil exports as oil prices soared. The run‐up in oil prices in previous quarters boosted the domestic exports of oil, driving a wedge between overall domestic exports and non‐oil domestic exports. (Chart 1.12) Entrepôt trade also received a boost from buoyant oil re‐exports. Total re‐exports increased by 16% q‐o‐q SAAR in Q2, as the value of oil products traded through Singapore rose. As with domestic exports, the wedge between overall and non‐oil re‐exports (NORX) widened in Q2, exacerbated by the fall in electronics re‐exports. (Chart 1.13)
Financial services remained resilient due to robust lending activity …
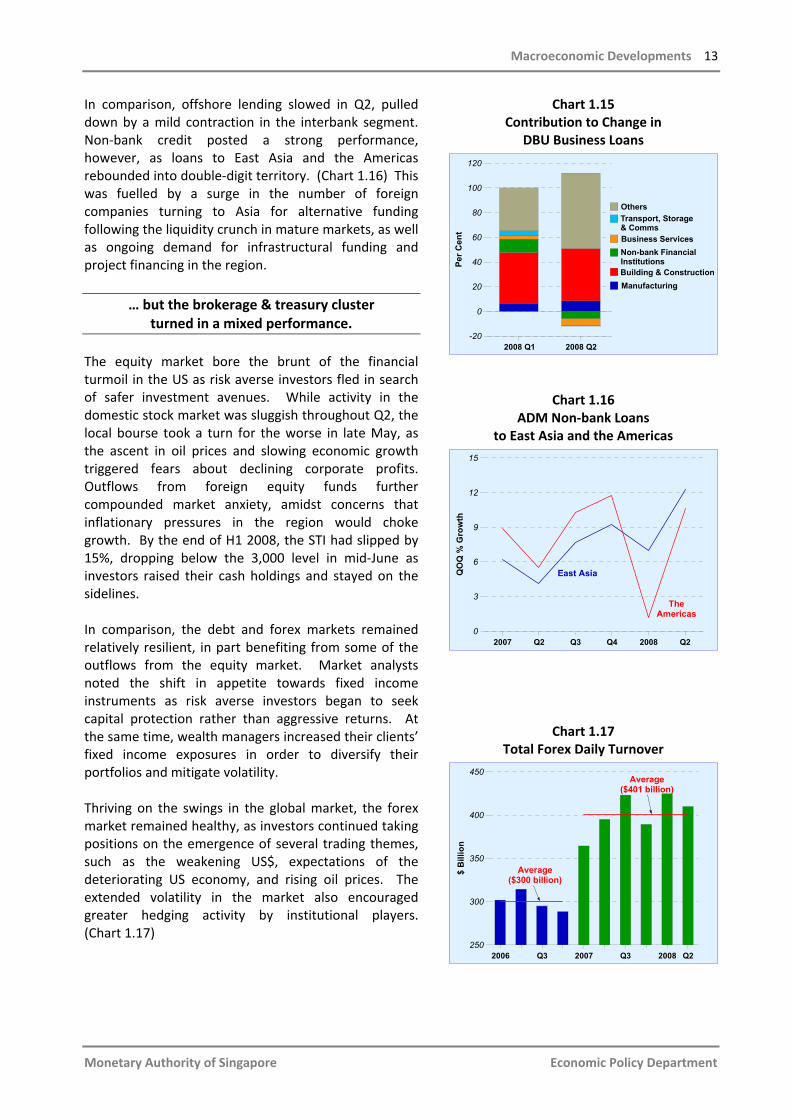
Despite the ongoing global financial turmoil, activity in the domestic financial sector was firm in Q2, underpinned by strength in the financial intermediation cluster and by pockets of resilience in the other segments. (Chart 1.14) Growth for the quarter came in at 13.2% q‐o‐q SAAR, with non‐bank lending activity contributing the bulk of the gains. Domestic lending continued to be buttressed by the building and construction industry, which has locked in tranches of loans from the ongoing construction of mega‐projects, such as the Marina Bay Financial Centre and the Integrated Resorts. (Chart 1.15) Strength in this segment offset the pullback in lending to non‐bank financial institutions and business services, which began to lose momentum towards the end of Q2. Consumer lending also held up, buoyed by a steady pipeline of housing loans as properties sold under the deferred payment scheme in the last two years reach completion.
Chart 1.12 Domestic Exports
2005 2006 2007 2008 Q2-30
-15
0
15
30
45
60
QO
Q S
AA
R %
Gro
wth
Total Domestic Exports
Non-oil Domestic Exports
Chart 1.13 Re‐exports
2005 2006 2007 2008 Q2-20
-10
0
10
20
30
40Q
OQ
SA
AR
% G
row
thTotal
Re-exports
Non-oil Re-exports
Chart 1.14 Contribution to Financial Services Growth
2008 Q2-3
0
3
6
9
12
15
Serv
ices
QO
Q S
AA
R G
row
th%
Poi
nt C
ontr
ibut
ion
to F
inan
cial Insurance
Financial Intermediation
Brokerage & Treasury
Asset ManagementPrivate Banking
Others
Source: EPD, MAS estimates
Macroeconomic Developments 13
Monetary Authority of Singapore Economic Policy Department
In comparison, offshore lending slowed in Q2, pulled down by a mild contraction in the interbank segment. Non‐bank credit posted a strong performance, however, as loans to East Asia and the Americas rebounded into double‐digit territory. (Chart 1.16) This was fuelled by a surge in the number of foreign companies turning to Asia for alternative funding following the liquidity crunch in mature markets, as well as ongoing demand for infrastructural funding and project financing in the region.
… but the brokerage & treasury cluster turned in a mixed performance.
The equity market bore the brunt of the financial turmoil in the US as risk averse investors fled in search of safer investment avenues. While activity in the domestic stock market was sluggish throughout Q2, the local bourse took a turn for the worse in late May, as the ascent in oil prices and slowing economic growth triggered fears about declining corporate profits. Outflows from foreign equity funds further compounded market anxiety, amidst concerns that inflationary pressures in the region would choke growth. By the end of H1 2008, the STI had slipped by 15%, dropping below the 3,000 level in mid‐June as investors raised their cash holdings and stayed on the sidelines. In comparison, the debt and forex markets remained relatively resilient, in part benefiting from some of the outflows from the equity market. Market analysts noted the shift in appetite towards fixed income instruments as risk averse investors began to seek capital protection rather than aggressive returns. At the same time, wealth managers increased their clients’ fixed income exposures in order to diversify their portfolios and mitigate volatility. Thriving on the swings in the global market, the forex market remained healthy, as investors continued taking positions on the emergence of several trading themes, such as the weakening US$, expectations of the deteriorating US economy, and rising oil prices. The extended volatility in the market also encouraged greater hedging activity by institutional players. (Chart 1.17)
Chart 1.15 Contribution to Change in
DBU Business Loans
2008 Q1 2008 Q2-20
0
20
40
60
80
100
120
Per C
ent
Transport, Storage& CommsBusiness ServicesNon-bank Financial Institutions
ManufacturingBuilding & Construction
Others
Chart 1.16 ADM Non‐bank Loans
to East Asia and the Americas
2007 Q2 Q3 Q4 2008 Q20
3
6
9
12
15Q
OQ
% G
row
th
The Americas
East Asia
Chart 1.17 Total Forex Daily Turnover
2006 Q3 2007 Q3 2008 Q2250
300
350
400
450
$ B
illio
n
Average($300 billion)
Average($401 billion)

14 Macroeconomic Review, October 2008
Monetary Authority of Singapore Economic Policy Department
Growth of services was subdued on softer regional demand.
Meanwhile, certain regional‐oriented industries softened towards the end of Q2 2008. Hospitality‐related sectors were hit as visitor arrivals declined by 0.7% y‐o‐y in Q2, the first quarterly fall since Q4 2003. (Chart 1.18) Against the backdrop of elevated room rates, average hotel occupancy dipped to a seasonally adjusted 84% in Q2, from 87% a year ago. In H1 2008, visitor arrivals totalled 5.1 million, prompting STB in August to flag the possibility that its target of 10.8 million visitor arrivals this year may not be met. The fall in visitor arrivals, coupled with greater caution in spending by residents, caused retail volumes (excluding motor vehicles) to contract sequentially in Q2 by 4.9% q‐o‐q SAAR. Keen demand for architectural and engineering services, due to the boom in construction activity in both the residential and commercial property segments, led to a 12.1% q‐o‐q SAAR increase in business services. Moreover, even as sales of private homes fell in Q2 alongside faltering market sentiment, real estate services held firm as commercial leasing activity remained brisk.
Taxes on products and FISIM also adversely impacted GDP growth.
Since the beginning of 2008, GDP growth has been weighed down by two components that are not directly captured in the value added of key sectors in the national accounts. (Chart 1.19) One component is taxes on products2, which comprises around 7% of GDP. These taxes include the goods and services tax (GST), stamp duty and excise duties. As the increase in taxes on products generally follows trend GDP growth, it seldom contracts, except in years where there are strong negative shocks. In H1 this year, however, taxes on products declined by a significant 13% y‐o‐y, following the fall in stamp duty from a record high in 2007 during the property market boom.
Chart 1.18
Visitor Arrivals and Hotel Room Rates
2006 Jul 2007 Jul 2008 Aug-10
0
10
20
30
40
50
YOY
% G
row
th
Visitor Arrivals*
Average Room Rate
* Data excludes Malaysian land arrivals.
Chart 1.19 Taxes on Products and FISIM
2007 Q2 Q3 Q4 2008 Q2-20
-10
0
10
20
YOY
% G
row
th
Taxes on Products FISIM*
* FISIM is a negative item in the national accounts.
2 See DOS Information Paper “Rebasing of the Singapore System of National Accounts to Reference Year 1995”, January
2003, for more details on taxes on products.
Macroeconomic Developments 15
Monetary Authority of Singapore Economic Policy Department
Besides taxes on products, another component which lowered overall GDP in H1 2008 was FISIM, which amounts to around 5% of GDP. This component is subtracted from overall GDP to account for the intermediate financial services consumed by other sectors. FISIM surged by 16% y‐o‐y in H1, dragging down headline GDP in the process. Together, these two components shaved 1.8% points off GDP growth in H1 this year.
The economy continued slipping in Q3 2008. In Q3 2008, the Singapore economy underwent further slippage, contracting by 6.3% q‐o‐q SAAR, according to the Advance Estimates. The economy thus appears to have entered a more advanced stage of weakness, with the deterioration of sectors reliant on regional demand adding to the strain from sentiment‐sensitive and G3‐oriented industries. Meanwhile, construction activity slowed to single‐digit y‐o‐y growth, as supply bottlenecks set in and high construction costs eroded gains in certified payments.
Manufacturing suffered a further drag from weak pharmaceuticals and infocomms output.
Manufacturing activity contracted by 11.5% y‐o‐y in Q3, according to the Advance Estimates. Pharmaceutical output weakness lingered as production was hit by routine maintenance and retooling shutdowns, as well as the spillover from industry‐specific pressures from the previous quarter. Electronics output also softened, following the phased relocation of Motorola’s handset production and the slowing global demand for IT.
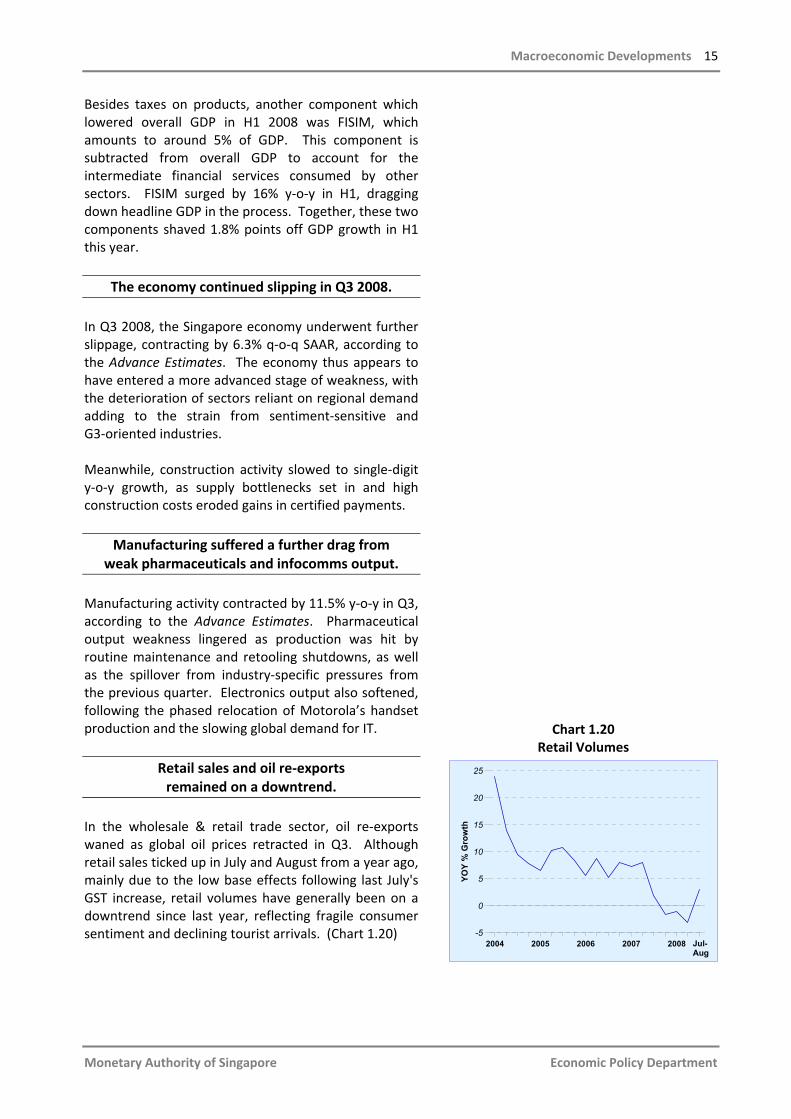
Retail sales and oil re‐exports remained on a downtrend.
In the wholesale & retail trade sector, oil re‐exports waned as global oil prices retracted in Q3. Although retail sales ticked up in July and August from a year ago, mainly due to the low base effects following last July's GST increase, retail volumes have generally been on a downtrend since last year, reflecting fragile consumer sentiment and declining tourist arrivals. (Chart 1.20)
Chart 1.20 Retail Volumes
2004 2005 2006 2007 2008-5
0
5
10
15
20
25
YOY
% G
row
th
Jul-Aug

16 Macroeconomic Review, October 2008
Monetary Authority of Singapore Economic Policy Department
Financial markets weakened further ... With global financial markets in upheaval, risk aversion remained high throughout Q3. Investor sentiment nose‐dived in mid‐September, as a fresh spate of market and credit‐related losses pushed global investment bank Lehman Brothers into bankruptcy and pressured Merrill Lynch, the world’s largest brokerage, into a takeover deal by Bank of America, while the remaining investment banks, Goldman Sachs and Morgan Stanley, relinquished their investment bank status to become bank holding companies. At the same time, the American International Group (AIG) faced severe liquidity pressures amidst a slew of downgrades, and was ultimately bailed out by the US Federal Reserve via an emergency loan, surrendering an 80% stake in the company. Weakness in the Eurozone and Japan also sent ripples throughout the region. In the domestic financial sector, sentiment‐sensitive industries such as the brokerage & treasury markets and fund management services deteriorated.
… causing the benchmark stock index to fall. Alongside similar losses in regional bourses, the Straits Times Index (STI) declined by 20% in Q3 after falling by 15% over the first half of the year. (Chart 1.21) As a result, the STI plummeted to 2,359 at end‐September, with the small‐cap and S‐share indices suffering drops of 51% and 69% respectively year‐to‐date. (Chart 1.22) Correspondingly, turnover volumes in the overall market plummeted to two‐year lows. The fund management industry was hit by declining asset values and lower discretionary funds under management as investors cut losses and increased their cash holdings. The Merrill Lynch Fund Manager Global Survey conducted in September suggests that risk appetite has fallen to a new low, with the majority of respondents overweighting bonds for the first time in the survey’s history. Emerging markets were rated underweight, reflecting net equity fund outflows from Asia in recent months. Notably, these responses were observed before the dramatic shifts in the US financial landscape in September, and sentiment is likely to have further weakened since then.
Chart 1.21 Stock Market Performance since
the Peak in 2007
Oct Jan Apr Jul Sep
10
20
30
40
50
60
70
80B
illio
n U
nits
2250
2500
2750
3000
3250
3500
3750
4000
Inde
x
Volume (LHS) STI (RHS)
2007 2008
Source: SGX
Chart 1.22 FTSE Small Cap and China Indices, Sep 2008
STI Small Cap Index China Index-80
-60
-40
-20
0
% G
row
th (Y
ear-
to-d
ate)
Source: SGX
Macroeconomic Developments 17
Monetary Authority of Singapore Economic Policy Department
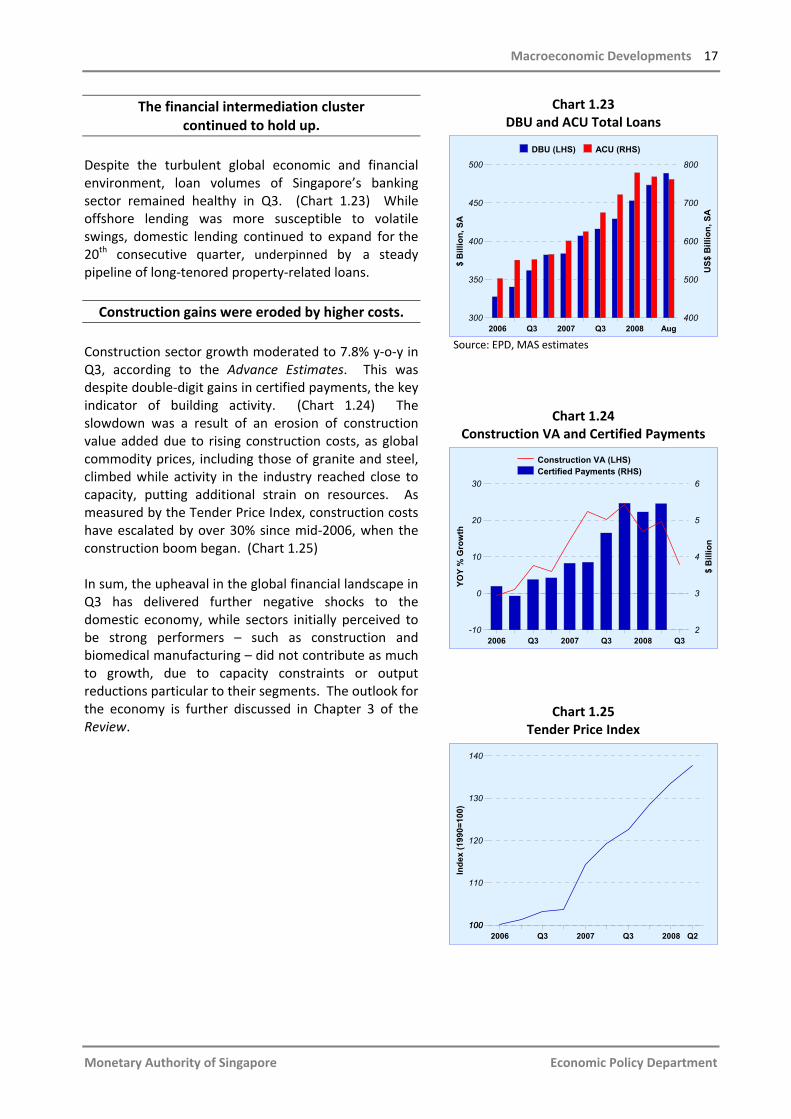
The financial intermediation cluster continued to hold up.
Despite the turbulent global economic and financial environment, loan volumes of Singapore’s banking sector remained healthy in Q3. (Chart 1.23) While offshore lending was more susceptible to volatile swings, domestic lending continued to expand for the 20th consecutive quarter, underpinned by a steady pipeline of long‐tenored property‐related loans. Construction gains were eroded by higher costs.
Construction sector growth moderated to 7.8% y‐o‐y in Q3, according to the Advance Estimates. This was despite double‐digit gains in certified payments, the key indicator of building activity. (Chart 1.24) The slowdown was a result of an erosion of construction value added due to rising construction costs, as global commodity prices, including those of granite and steel, climbed while activity in the industry reached close to capacity, putting additional strain on resources. As measured by the Tender Price Index, construction costs have escalated by over 30% since mid‐2006, when the construction boom began. (Chart 1.25) In sum, the upheaval in the global financial landscape in Q3 has delivered further negative shocks to the domestic economy, while sectors initially perceived to be strong performers – such as construction and biomedical manufacturing – did not contribute as much to growth, due to capacity constraints or output reductions particular to their segments. The outlook for the economy is further discussed in Chapter 3 of the Review.
Chart 1.23 DBU and ACU Total Loans
2006 Q3 2007 Q3 2008 Aug 300
350
400
450
500
$ B
illio
n, S
A
400
500
600
700
800
US$
Bill
ion,
SA
DBU (LHS) ACU (RHS)
Source: EPD, MAS estimates
Chart 1.24 Construction VA and Certified Payments
2006 Q3 2007 Q3 2008 Q3-10
0
10
20
30
YOY
% G
row
th
2
3
4
5
6
$ B
illio
n
Construction VA (LHS)Certified Payments (RHS)
Chart 1.25 Tender Price Index
2006 Q3 2007 Q3 2008 Q2100
110
120
130
140
100
Inde
x (1
990=
100)
18 Macroeconomic Review, October 2008
Monetary Authority of Singapore Economic Policy Department
1.3 Macroeconomic Policy Singapore’s macroeconomic stance has evolved in line with cyclical developments in the economy.
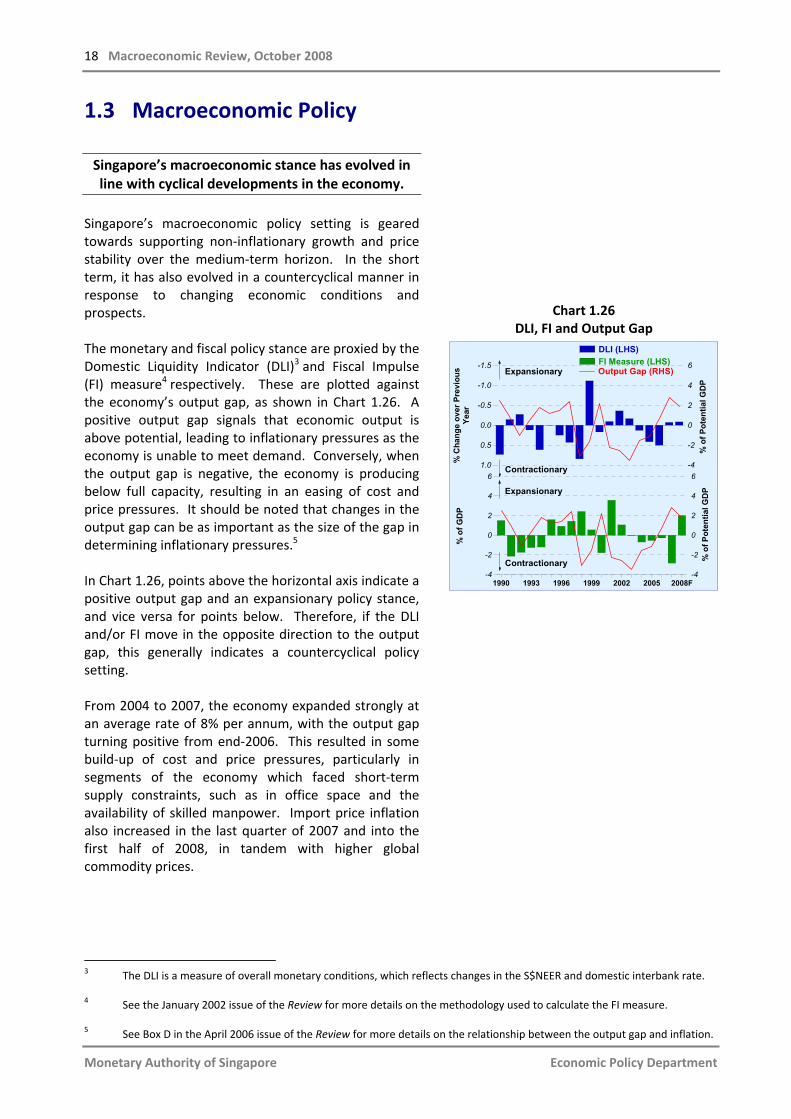
Singapore’s macroeconomic policy setting is geared towards supporting non‐inflationary growth and price stability over the medium‐term horizon. In the short term, it has also evolved in a countercyclical manner in response to changing economic conditions and prospects. The monetary and fiscal policy stance are proxied by the Domestic Liquidity Indicator (DLI)3 and Fiscal Impulse (FI) measure4 respectively. These are plotted against the economy’s output gap, as shown in Chart 1.26. A positive output gap signals that economic output is above potential, leading to inflationary pressures as the economy is unable to meet demand. Conversely, when the output gap is negative, the economy is producing below full capacity, resulting in an easing of cost and price pressures. It should be noted that changes in the output gap can be as important as the size of the gap in determining inflationary pressures.5 In Chart 1.26, points above the horizontal axis indicate a positive output gap and an expansionary policy stance, and vice versa for points below. Therefore, if the DLI and/or FI move in the opposite direction to the output gap, this generally indicates a countercyclical policy setting. From 2004 to 2007, the economy expanded strongly at an average rate of 8% per annum, with the output gap turning positive from end‐2006. This resulted in some build‐up of cost and price pressures, particularly in segments of the economy which faced short‐term supply constraints, such as in office space and the availability of skilled manpower. Import price inflation also increased in the last quarter of 2007 and into the first half of 2008, in tandem with higher global commodity prices.
Chart 1.26 DLI, FI and Output Gap
1990 1993 1996 1999 2002 2005 2008F-4
-2
0
2
4
6
-4
-2
0
2
4
6
% o
f GD
P
Contractionary % o
f Pot
entia
l GD
P
-1.5
-1.0
-0.5
0.0
0.5
1.0 -4
-2
0
2
4
6
% C
hang
e ov
er P
revi
ous
Year
Expansionary
DLI (LHS)
Output Gap (RHS)FI Measure (LHS)
% o
f Pot
entia
l GD
P
Contractionary
Expansionary
3 The DLI is a measure of overall monetary conditions, which reflects changes in the S$NEER and domestic interbank rate. 4 See the January 2002 issue of the Review for more details on the methodology used to calculate the FI measure. 5 See Box D in the April 2006 issue of the Review for more details on the relationship between the output gap and inflation.
Macroeconomic Developments 19
Monetary Authority of Singapore Economic Policy Department
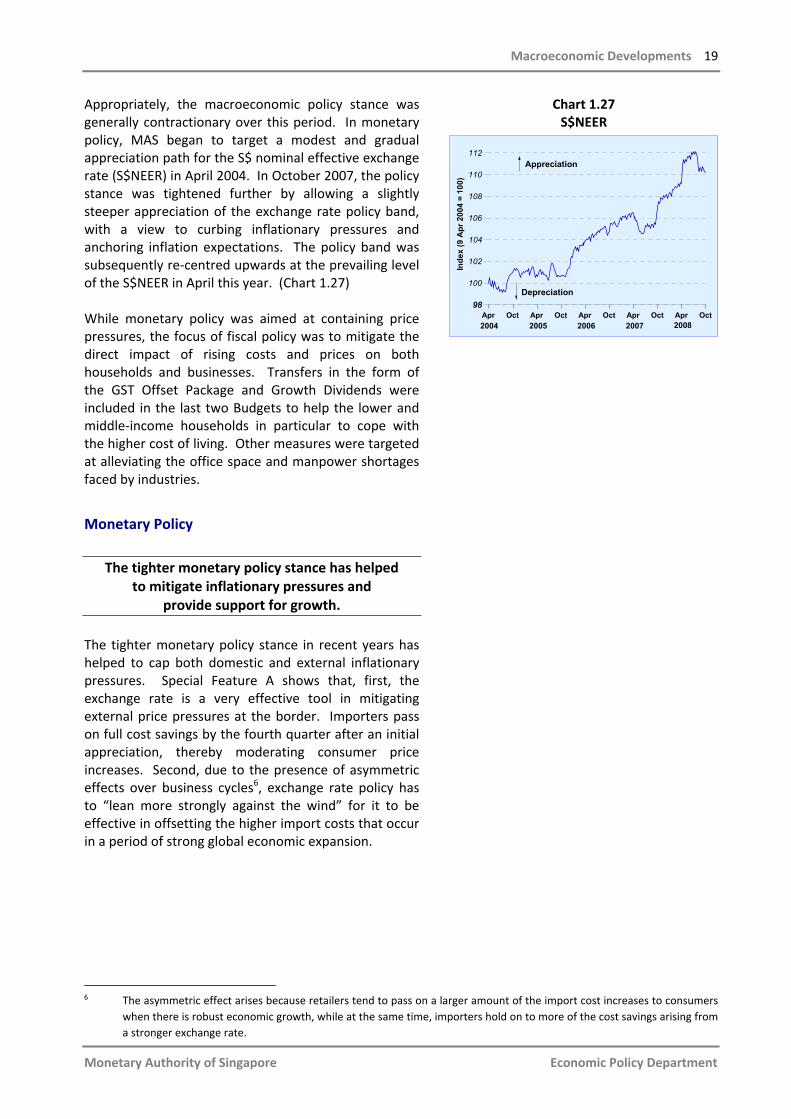
Appropriately, the macroeconomic policy stance was generally contractionary over this period. In monetary policy, MAS began to target a modest and gradual appreciation path for the S$ nominal effective exchange rate (S$NEER) in April 2004. In October 2007, the policy stance was tightened further by allowing a slightly steeper appreciation of the exchange rate policy band, with a view to curbing inflationary pressures and anchoring inflation expectations. The policy band was subsequently re‐centred upwards at the prevailing level of the S$NEER in April this year. (Chart 1.27) While monetary policy was aimed at containing price pressures, the focus of fiscal policy was to mitigate the direct impact of rising costs and prices on both households and businesses. Transfers in the form of the GST Offset Package and Growth Dividends were included in the last two Budgets to help the lower and middle‐income households in particular to cope with the higher cost of living. Other measures were targeted at alleviating the office space and manpower shortages faced by industries.
Monetary Policy
The tighter monetary policy stance has helped to mitigate inflationary pressures and
provide support for growth. The tighter monetary policy stance in recent years has helped to cap both domestic and external inflationary pressures. Special Feature A shows that, first, the exchange rate is a very effective tool in mitigating external price pressures at the border. Importers pass on full cost savings by the fourth quarter after an initial appreciation, thereby moderating consumer price increases. Second, due to the presence of asymmetric effects over business cycles6, exchange rate policy has to “lean more strongly against the wind” for it to be effective in offsetting the higher import costs that occur in a period of strong global economic expansion.
Chart 1.27 S$NEER
Apr Oct Apr Oct Apr Oct Apr Oct Apr Oct
98
100
102
104
106
108
110
112
98
Inde
x (9
Apr
200
4 =
100)
Appreciation
Depreciation
2004 200820072005 2006
6 The asymmetric effect arises because retailers tend to pass on a larger amount of the import cost increases to consumers
when there is robust economic growth, while at the same time, importers hold on to more of the cost savings arising from a stronger exchange rate.

20 Macroeconomic Review, October 2008
Monetary Authority of Singapore Economic Policy Department
In the absence of a S$NEER appreciation, cost and inflation pressures would have risen further.
Over a longer period, the tighter policy stance has also continued to foster medium‐term price stability as the basis for sustainable economic growth. Using the MAS macroeconometric model, a counterfactual simulation was conducted to assess the growth and inflation outcomes which would have occurred had MAS not allowed the S$NEER to appreciate between Q4 2005 and Q2 2008.7 The results show that GDP growth and CPI inflation in 2007 would have been higher at 8.9% and 3.8% respectively, compared to the 7.7% and 2.1% actually recorded. (Table 1.2) This would have aggravated the short‐term capacity constraints that the economy was already facing. The boost to GDP growth would be short‐lived as the underlying strong build‐up in cost pressures would cause growth to slow sharply to 3.3% by H1 2008, while pushing CPI inflation much higher to 10%. Growth and inflation outcomes would also have been much more volatile (as shown by the standard deviations in Table 1.2). Furthermore, higher inflation would have persisted into 2009, with GDP growth averaging some 1.7% points below the baseline. In the absence of MAS’ pre‐emptive monetary policy actions, the economy would have grown at a faster pace and stronger domestic price pressures would have resulted from the larger positive output gap. At the same time, the rise in global commodity prices would have led to higher import costs due to the loss of the filtering effect from a stronger exchange rate. In the event, the initiation of tighter monetary policy, particularly in the last two policy cycles, helped to bring down inflation. Without the tightening, domestic costs and inflationary pressures would have eventually impinged on growth. As such, there would still be appreciating pressures on the S$REER, arising from higher domestic cost inflation relative to Singapore’s major trading partners. Using the CPI as the price deflator, the S$REER is estimated to have risen by 1.9% q‐o‐q in Q2 2008. (Chart 1.28) On a monthly basis, it peaked in May 2008, before moderating as domestic CPI increased at a slower pace compared to our trading partners.
Table 1.2 Counterfactual Simulation Results Under
Alternative Monetary Policy Paths (%)
2007 H1 2008 Std Dev* Actual
GDP Growth
7.7 4.5 2.3
CPI Inflation
2.1 7.1 2.6
Counterfactual GDP Growth
8.9 3.3 3.4
CPI Inflation
3.8 10 3.7
* Over the period Q1 2006‐Q2 2008.
Chart 1.28 S$REER deflated by the CPI
1995 1997 1999 2001 2003 2005
80
85
90
95
100
105
110
115
80
Inde
x (J
an 1
995=
100)
REERCPI
NEER
2008
Relative CPI
Aug
7 The simulation effectively eliminated the 10% appreciation in the S$ trade‐weighted index that took place between Q4
2005 and mid‐2008.

Macroeconomic Developments 21
Monetary Authority of Singapore Economic Policy Department
Liquidity conditions remained tight despite some easing in recent months.
Overall liquidity conditions were tighter from April to July 2008, as shown by the positive DLI. (Chart 1.29) This was driven by the strengthening of the S$NEER. However, since August 2008, there has been some easing in liquidity conditions, with the DLI turning negative in line with the fall in the exchange rate. Nonetheless, there has been a trend tightening in liquidity conditions over the past year. (Chart 1.30) Overall domestic monetary conditions remain relatively tight, and still exert some degree of restraint on economic activity. In line with the slowdown in domestic economic activity, money demand growth has slowed. From a high of 24% y‐o‐y in Q2 2007, the growth of M2 moderated to 12% in Q1 2008 before easing further to 8.7% in August. This reflected, to some degree, the reduced demand for credit by the private sector. Loans to non‐bank customers (domestic credit to the private sector) rose by a monthly average of $3.1 billion in Jul‐Aug, compared with an increase of $4.1 billion in Q1 2008. While new loans, particularly to the property‐related sector (including housing loans), have continued to grow, the pace of increase has slowed considerably from the peak in Q4 last year. (Chart 1.31) Meanwhile, domestic interbank rates edged lower in tandem with the stronger S$ following the policy announcement in April 2008. The benchmark three‐month domestic interbank rate fell by 31 bps from 1.31% in end‐March to 1.0% in early August, the lowest level since September 2004. However, in the wake of the dislocation in global money markets and growing market expectations of a weaker S$, the benchmark rate rose to around 1.88% at end‐September. (Chart 1.32) MAS has temporarily kept a higher level of liquidity in the banking system through its money market operations (MMOs). Over the course of the year, MAS’ MMOs have ensured sufficient liquidity in the banking system to meet banks’ demand for reserve and settlement balances. The amount of liquidity in the banking system is estimated by taking into consideration the banking sector’s demand for funds and the net liquidity impact of autonomous money market factors. Box B at the end of the chapter provides a review of MAS’ MMOs in FY2007/08.
Chart 1.29
Domestic Liquidity Indicator
Apr Jul Oct Jan Apr Jul
-0.9
-0.6
-0.3
0.0
0.3
0.6
0.9
Cha
nge
from
Pre
viou
s Q
uart
er Tightening
Easing
Sep2007 2008
Exchange RateChanges
Interest RateChanges
DLI
Chart 1.30 Domestic Liquidity Indicator
Apr Jul Oct Jan Apr Jul
-2
-1
0
1
2
3C
umul
ativ
e C
hang
e
Tightening
Easing
Sep2007 2008
Chart 1.31 Domestic Credit to Private Sector
2007 Q2 Q3 Q4 2008 Q2 Q3*0
1
2
3
4
5
0
Ave
rage
Mon
thly
Cha
nge
($ B
illio
n)
Domestic Credit to Private Sector
Bank Loans to Property-related Sector
* Average of Jul‐Aug.
22 Macroeconomic Review, October 2008
Monetary Authority of Singapore Economic Policy Department
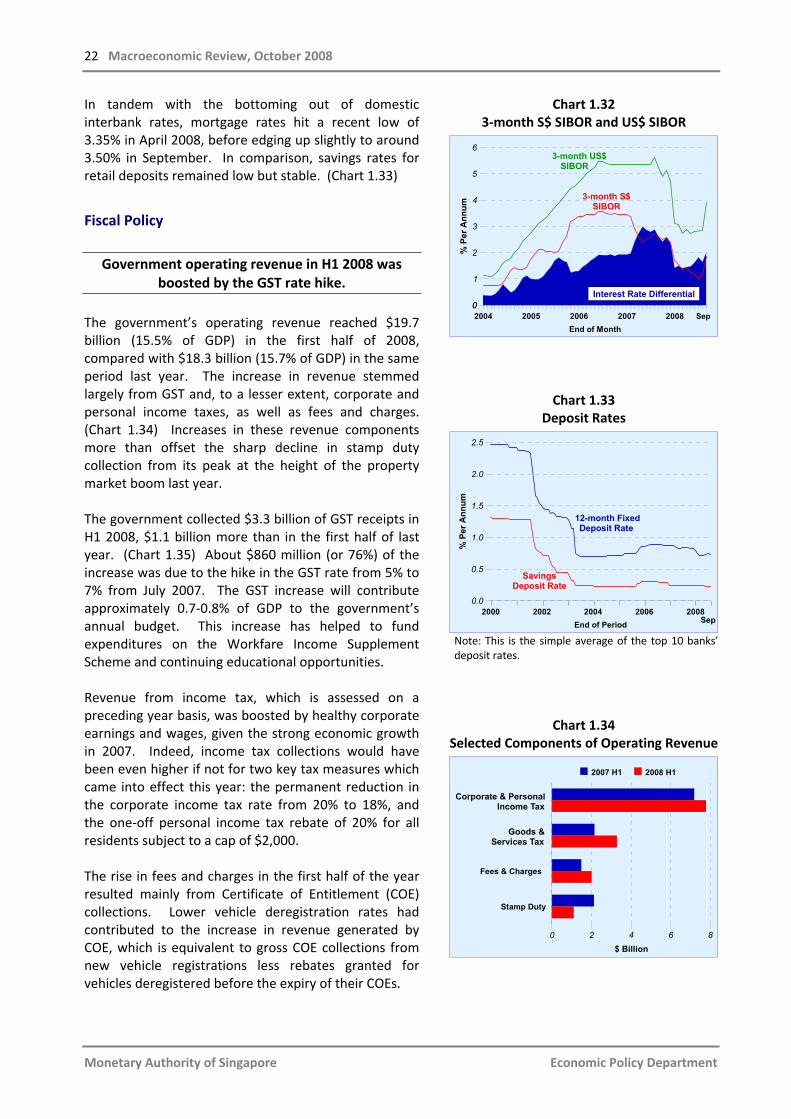
In tandem with the bottoming out of domestic interbank rates, mortgage rates hit a recent low of 3.35% in April 2008, before edging up slightly to around 3.50% in September. In comparison, savings rates for retail deposits remained low but stable. (Chart 1.33)
Fiscal Policy
Government operating revenue in H1 2008 was boosted by the GST rate hike.
The government’s operating revenue reached $19.7 billion (15.5% of GDP) in the first half of 2008, compared with $18.3 billion (15.7% of GDP) in the same period last year. The increase in revenue stemmed largely from GST and, to a lesser extent, corporate and personal income taxes, as well as fees and charges. (Chart 1.34) Increases in these revenue components more than offset the sharp decline in stamp duty collection from its peak at the height of the property market boom last year. The government collected $3.3 billion of GST receipts in H1 2008, $1.1 billion more than in the first half of last year. (Chart 1.35) About $860 million (or 76%) of the increase was due to the hike in the GST rate from 5% to 7% from July 2007. The GST increase will contribute approximately 0.7‐0.8% of GDP to the government’s annual budget. This increase has helped to fund expenditures on the Workfare Income Supplement Scheme and continuing educational opportunities. Revenue from income tax, which is assessed on a preceding year basis, was boosted by healthy corporate earnings and wages, given the strong economic growth in 2007. Indeed, income tax collections would have been even higher if not for two key tax measures which came into effect this year: the permanent reduction in the corporate income tax rate from 20% to 18%, and the one‐off personal income tax rebate of 20% for all residents subject to a cap of $2,000. The rise in fees and charges in the first half of the year resulted mainly from Certificate of Entitlement (COE) collections. Lower vehicle deregistration rates had contributed to the increase in revenue generated by COE, which is equivalent to gross COE collections from new vehicle registrations less rebates granted for vehicles deregistered before the expiry of their COEs.
Chart 1.32 3‐month S$ SIBOR and US$ SIBOR
2004 2005 2006 2007 2008End of Month
0
1
2
3
4
5
6
0
% P
er A
nnum
3-month US$ SIBOR
3-month S$ SIBOR
Interest Rate Differential
Sep
Chart 1.33 Deposit Rates
2000 2002 2004 2006 2008End of Period
0.0
0.5
1.0
1.5
2.0
2.5
% P
er A
nnum
Sep
12-month Fixed Deposit Rate
Savings Deposit Rate
Note: This is the simple average of the top 10 banks’ deposit rates.
Chart 1.34 Selected Components of Operating Revenue
Fees & Charges
Stamp Duty
0 2 4 6 8$ Billion
2007 H1 2008 H1
Corporate & PersonalIncome Tax
Goods &Services Tax

Macroeconomic Developments 23
Monetary Authority of Singapore Economic Policy Department
There were increases in both operating and development expenditure.
Government expenditure rose from $16.4 billion in H1 2007 to $19.2 billion (15.0% of GDP) in the first half of this year, with increases in both operating and development spending. (Chart 1.36) Operating expenditure was $1.7 billion higher at $14.8 billion (11.6% of GDP), with the bulk of the increase attributed to security and external relations. Spending on health and national development also increased by about $0.1 billion each. (Chart 1.37) At the same time, development expenditure rose by $1.1 billion to $4.4 billion (3.5% of GDP) in H1 2008. This was largely accounted for by MTI, which saw higher expenditure for projects such as the Science & Technology Plan 2010 and Economic Development Assistance Scheme. MOT also recorded higher spending on road projects like the Marina Coastal Expressway, as well as rail transport projects, such as the Circle Line, Boon Lay Extension Line, and the first phase of the Downtown Line. The procreation incentives announced in August
are not expected to have a large impact on the budget this year.
At the National Day Rally on 17 Aug 2008, the government announced a slew of measures to encourage and provide more support for couples to get married and have children, in an effort to tackle the low fertility rate in Singapore. The measures are broad‐based, ranging from longer maternity leave to greater tax incentives and subsidies for childcare. The enhanced package is expected to cost the government an additional $700 million in FY2009, on top of the $900 million that it would have spent on existing measures to promote marriage and parenthood. The impact of these new procreation perks on the government’s budget for this calendar year will not be very large (about $170 million), since most of the measures only take effect from August 2008. There will also be no revenue loss from the tax incentives this year since these claims are only applicable to the Year of Assessment 2009 and beyond.
Chart 1.35 GST Collections
2002 H1 2003 H2 2005 H1 2006 H2 2008 H10
1
2
3
4
0
$ B
illio
n
Chart 1.36 Government Expenditure
2007 H1 2008 H10
5
10
15$
Bill
ion
Operating Expenditure Development Expenditure
Chart 1.37 Selected Components of Operating Expenditure
Education
Health
National Development
0 2 4 6 8$ Billion
2007 H1 2008 H1
Security & External Relations

24 Macroeconomic Review, October 2008
Monetary Authority of Singapore Economic Policy Department
The government is expected to record a smaller primary surplus in 2008.
For this year, the government has also disbursed a significant amount of special transfers to households. These mainly include the Growth Dividends ($0.87 billion) announced in the FY2008 Budget and measures committed in the GST Offset Package last year, such as GST Credits and utility rebates. At the recent National Day Rally, the government announced a 50% increase in utility rebates and the second instalment of Growth Dividends, totalling an additional $0.26 billion, to further ease the burden of households, given the prevailing environment of elevated price levels and increased uncertainty in the global economic outlook. Overall, the government recorded a primary surplus of $0.6 billion (0.4% of GDP) in the first half of 2008, moderating from $1.9 billion in the same period a year ago.8 For 2008 as a whole, the government’s primary surplus is estimated to fall to $4.3 billion9 (1.6% of GDP), from $8.2 billion (3.4% of GDP) in 2007. (Chart 1.38)
Chart 1.38 Primary Fiscal Surplus/Deficit
1999 2002 2005 2008F-2
-1
0
1
2
3
4
% o
f GD
P
8 The primary surplus/deficit is defined as operating revenue (excluding net investment income contributions) less
operating and development expenditure. 9 MAS’ estimates are based on previous years’ trends and take into consideration the primary surplus budgeted for FY2008.
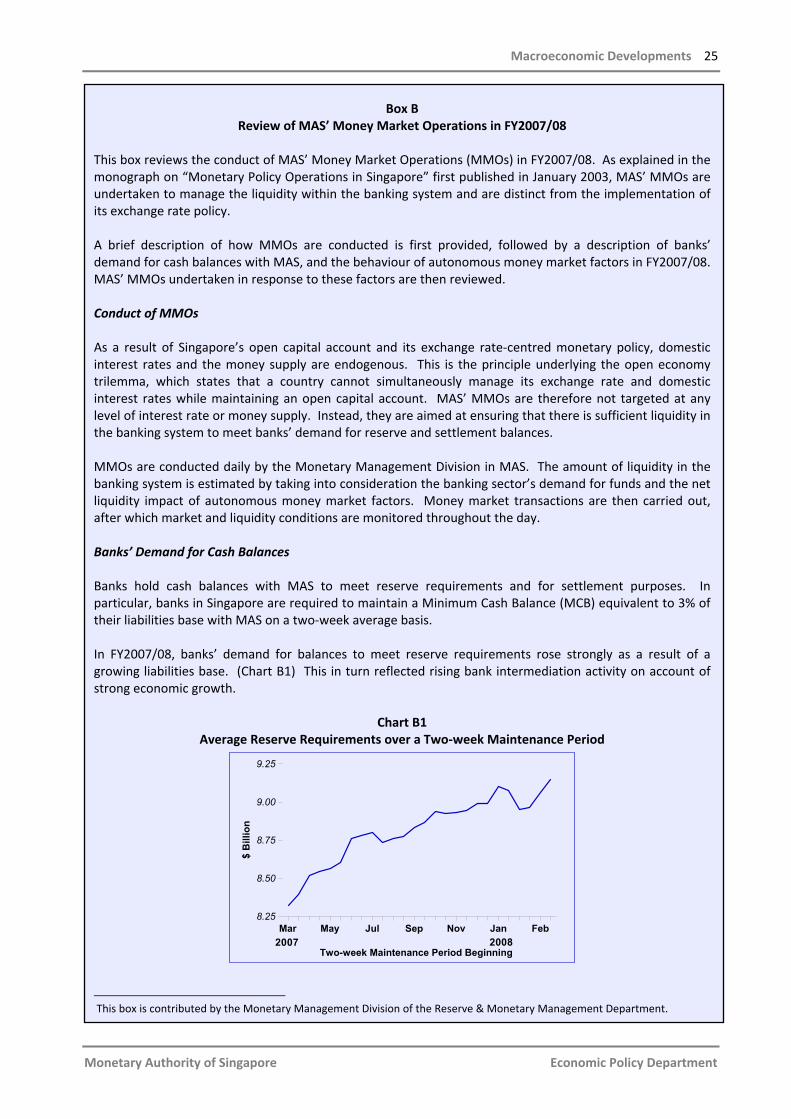
Macroeconomic Developments 25
Monetary Authority of Singapore Economic Policy Department
Box B Review of MAS’ Money Market Operations in FY2007/08
This box reviews the conduct of MAS’ Money Market Operations (MMOs) in FY2007/08. As explained in the monograph on “Monetary Policy Operations in Singapore” first published in January 2003, MAS’ MMOs are undertaken to manage the liquidity within the banking system and are distinct from the implementation of its exchange rate policy. A brief description of how MMOs are conducted is first provided, followed by a description of banks’ demand for cash balances with MAS, and the behaviour of autonomous money market factors in FY2007/08. MAS’ MMOs undertaken in response to these factors are then reviewed. Conduct of MMOs As a result of Singapore’s open capital account and its exchange rate‐centred monetary policy, domestic interest rates and the money supply are endogenous. This is the principle underlying the open economy trilemma, which states that a country cannot simultaneously manage its exchange rate and domestic interest rates while maintaining an open capital account. MAS’ MMOs are therefore not targeted at any level of interest rate or money supply. Instead, they are aimed at ensuring that there is sufficient liquidity in the banking system to meet banks’ demand for reserve and settlement balances. MMOs are conducted daily by the Monetary Management Division in MAS. The amount of liquidity in the banking system is estimated by taking into consideration the banking sector’s demand for funds and the net liquidity impact of autonomous money market factors. Money market transactions are then carried out, after which market and liquidity conditions are monitored throughout the day. Banks’ Demand for Cash Balances Banks hold cash balances with MAS to meet reserve requirements and for settlement purposes. In particular, banks in Singapore are required to maintain a Minimum Cash Balance (MCB) equivalent to 3% of their liabilities base with MAS on a two‐week average basis. In FY2007/08, banks’ demand for balances to meet reserve requirements rose strongly as a result of a growing liabilities base. (Chart B1) This in turn reflected rising bank intermediation activity on account of strong economic growth.
Chart B1 Average Reserve Requirements over a Two‐week Maintenance Period
Mar May Jul Sep Nov Jan Feb
Two-week Maintenance Period Beginning
8.25
8.50
8.75
9.00
9.25
$ B
illio
n
2007 2008
This box is contributed by the Monetary Management Division of the Reserve & Monetary Management Department.
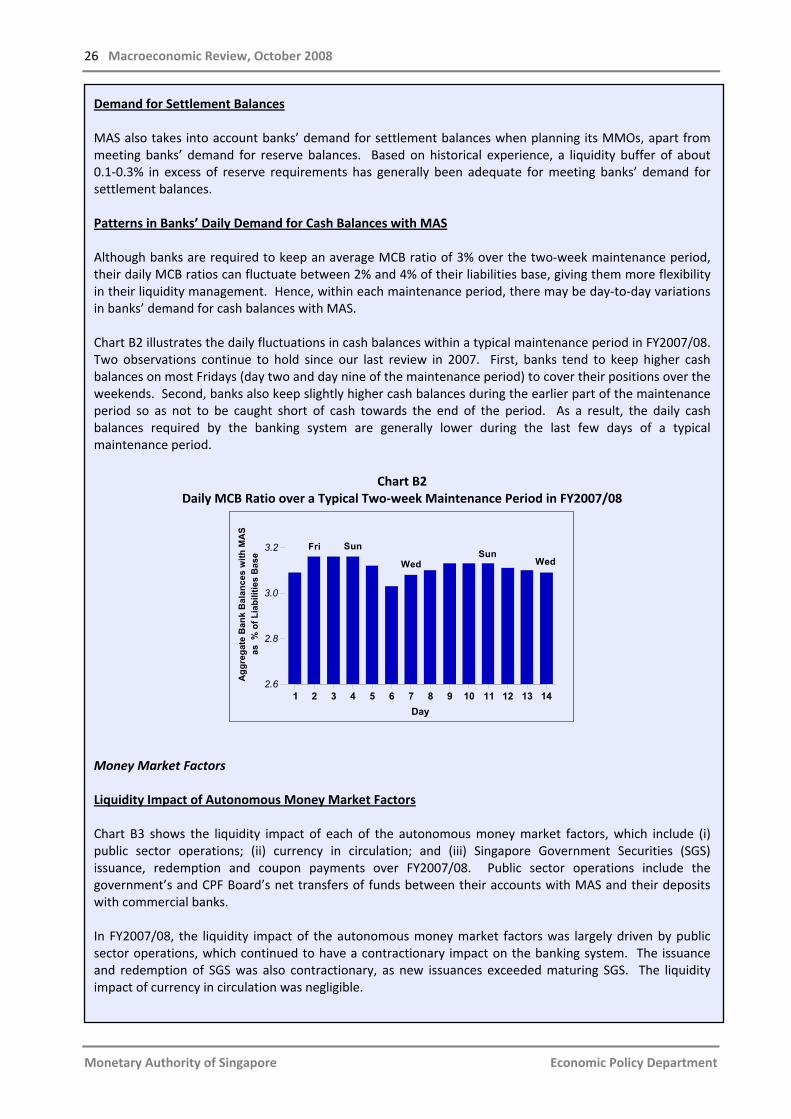
26 Macroeconomic Review, October 2008
Monetary Authority of Singapore Economic Policy Department
Demand for Settlement Balances MAS also takes into account banks’ demand for settlement balances when planning its MMOs, apart from meeting banks’ demand for reserve balances. Based on historical experience, a liquidity buffer of about 0.1‐0.3% in excess of reserve requirements has generally been adequate for meeting banks’ demand for settlement balances. Patterns in Banks’ Daily Demand for Cash Balances with MAS Although banks are required to keep an average MCB ratio of 3% over the two‐week maintenance period, their daily MCB ratios can fluctuate between 2% and 4% of their liabilities base, giving them more flexibility in their liquidity management. Hence, within each maintenance period, there may be day‐to‐day variations in banks’ demand for cash balances with MAS. Chart B2 illustrates the daily fluctuations in cash balances within a typical maintenance period in FY2007/08. Two observations continue to hold since our last review in 2007. First, banks tend to keep higher cash balances on most Fridays (day two and day nine of the maintenance period) to cover their positions over the weekends. Second, banks also keep slightly higher cash balances during the earlier part of the maintenance period so as not to be caught short of cash towards the end of the period. As a result, the daily cash balances required by the banking system are generally lower during the last few days of a typical maintenance period.
Chart B2
Daily MCB Ratio over a Typical Two‐week Maintenance Period in FY2007/08
1 2 3 4 5 6 7 8 9 10 11 12 13 14Day
2.6
2.8
3.0
3.2
as %
of L
iabi
litie
s B
ase
Agg
rega
te B
ank
Bal
ance
s w
ith M
AS
FriSun
WedSun
Wed
Money Market Factors Liquidity Impact of Autonomous Money Market Factors Chart B3 shows the liquidity impact of each of the autonomous money market factors, which include (i) public sector operations; (ii) currency in circulation; and (iii) Singapore Government Securities (SGS) issuance, redemption and coupon payments over FY2007/08. Public sector operations include the government’s and CPF Board’s net transfers of funds between their accounts with MAS and their deposits with commercial banks. In FY2007/08, the liquidity impact of the autonomous money market factors was largely driven by public sector operations, which continued to have a contractionary impact on the banking system. The issuance and redemption of SGS was also contractionary, as new issuances exceeded maturing SGS. The liquidity impact of currency in circulation was negligible.

Macroeconomic Developments 27
Monetary Authority of Singapore Economic Policy Department
Chart B3 Liquidity Impact of Autonomous Money Market Factors
2007 Q2 Q3 Q4 2008 Q1
0
Contractionary (-) : Withdrawal of liquidity from banking system
Expansionary (+) : Injection of liquidity into banking system
Public Sector OperationsCurrency in CirculationSingapore Government Securities
Net Liquidity Impact of MAS’ MMOs Over FY2007/08, MAS' MMOs took into consideration the impact of autonomous money market factors and MAS’ foreign exchange (FX) intervention operations on liquidity. With the implementation of the MAS Standing Facility in June 2006 and improvements in banks’ liquidity management, the average effective bank balances as a ratio of liabilities base hovered at about 3.1% for the two‐week maintenance period. (Chart B4)
Chart B4 Effective Average Two‐week MCB Ratios
Mar May Jul Sep Nov Jan Feb
Two-week Maintenance Period Beginning
3.0
3.1
3.2
3.3
3.4
as
% o
f Lia
bilit
ies
Bas
eM
CB
Rat
ios
expr
esse
d
2007 2008
Instruments for MMOs For its MMOs, MAS uses three key instruments to inject liquidity into the banking system and to withdraw liquidity from it, namely (i) FX swaps or reverse swaps; (ii) SGS repos or reverse repos; and (iii) clean lending or borrowing. Chart B5 illustrates the distribution of MMOs among the three key instruments as at end‐FY2007/08.

28 Macroeconomic Review, October 2008
Monetary Authority of Singapore Economic Policy Department
Chart B5 Distribution of MMOs by Instrument
FY 2007/08
FX Reverse Swap
SGSReverse
Repo
Borrowing
1%
73%
26%
FX Reverse Swap
FY 2006/07
23%
Borrowing
77%

Chapter 2 Wage-Price Dynamics

30 Macroeconomic Review, October 2008
Monetary Authority of Singapore Economic Policy Department
2.1 Labour Market Conditions
Employment expansion was unprecedented in H1 2008.
Despite signs of slower economic growth, the job market remained strong. In H1 2008, employment gains rose to an all‐time high of 144,600, up 19% from 121,100 in H2 2007. (Chart 2.1) However, the number of jobs created moderated slightly to 71,400 in Q2, from a peak of 73,200 in Q1.
Record job creation was mainly a result of the sharp increase in construction employment.
While employment creation was exceptionally strong in H1 2008, it was somewhat less broad‐based compared to the preceding half‐year. This can be inferred from the employment diffusion index, which fell from a peak of 96 in Q4 2007 to 93 in Q1 2008 and 87 in Q2.1 (Chart 2.2) Indeed, the record job creation in H1 was mainly the result of a substantial increase in construction jobs, driven by robust expansion in building activities. Job gains in construction rose from 24,000 in H2 2007 to 36,900 in H1 2008, contributing 26% of total employment gains. (Chart 2.3) Notably, the rate of job creation in this sector surpassed that during the construction boom before the Asian Financial Crisis. The business services sector also continued to register robust employment gains of 26,200 in H1 2008 compared to 19,900 in H2 2007 and 21,900 in H1. This was largely driven by the strong derived demand for legal and accountancy professionals and administrative & support staff from other industries. In comparison, in the financial services sector, there appeared to be early signs of the impact of the ongoing global financial crisis, as firms were more cautious about new hiring. This sector, which saw its strongest employment growth last year, created 7,800 jobs in H1 2008, down sharply from 12,400 in H2 2007. Job gains in the manufacturing sector slowed slightly from 23,300 in H2 2007 to 21,900 in H1 2008, due to
Chart 2.1 Total Employment Changes
H1 H2 H1 H2 H1 H2 H1
0
40
80
120
160
Thou
sand
2005 2006 2007 2008
Chart 2.2
Employment Diffusion Index
2005 2006 2007 200875
80
85
90
95
100In
dex
Q2
Source: EPD, MAS estimates
Chart 2.3 Employment Changes by Sector
H1 H2 H1
0
40
80
120
160
Thou
sand Other Services
Financial ServicesCommerceManufacturingBusiness ServicesConstruction
2007 2008
* Business Services comprise Real Estate & Leasing Services, Professional Services and Administrative & Support Services. Commerce includes Wholesale & Retail Trade and Hotels & Restaurants.
1 The index is equal to 100 when all industries are increasing employment and zero when all are decreasing employment. A
reading of 50 indicates an equal number of industries are increasing and decreasing employment.

Wage‐Price Dynamics 31
Monetary Authority of Singapore Economic Policy Department
weak external demand. In particular, the electronics industry shed 2,400 jobs in H1. Part of these job losses were retrenchments due to ongoing restructuring, especially in the infocomms & consumer electronics segment. As a result, the manufacturing sector continued to account for the bulk of total retrenchments in H1. (Chart 2.4)
Manpower demand remained strong alongside more job seekers.
Manpower demand remained generally strong in most sectors in Q2 2008. The overall job vacancy rate stood at 2.5% in Q2, unchanged from the preceding two quarters. (Chart 2.5) Apart from manufacturing which saw a slight decline, all other sectors reported higher or stable vacancy rates. However, the number of job vacancies fell short of job seekers in Q2 2008 for the first time in four quarters. The seasonally adjusted ratio of job vacancies to unemployed persons dropped from 1.34 in Q4 2007 to 1.15 in Q1 2008 and 0.87 in Q2 (i.e. there were 87 job vacancies for every 100 job seekers). The robust labour market in recent quarters could have encouraged more people to seek job opportunities.
The expansion in the labour force caused an increase in the headline unemployment rate.
Notwithstanding strong job creation, the headline unemployment rate edged up to 2.3% in Q2 this year. The resident unemployment rate also rose from 2.4% in Q4 2007 to 3.1% in Q2 2008. To understand the effects of labour demand and supply on the unemployment rate, EPD estimated the quarterly labour force using employment numbers from reports on the labour market by MOM and unemployment statistics from the Labour Force Survey.2 While q‐o‐q employment growth eased in Q2 2008, theexpansion in the labour force continued to rise and reached a record high in Q2. (Table 2.1) Since the change in the unemployment rate is approximately the difference between labour force growth and employment growth, the faster rate at which the labour force expanded relative to employment led to the rise in the unemployment rate in Q2.
Chart 2.4 Retrenchment by Sector
2005 2006 2007 20080
1
2
3
4
Thou
sand
Manufacturing Services Construction
Q2
Chart 2.5 Job Vacancy Rate
2006 Q3 2007 Q3 2008 Q20.5
1.0
1.5
2.0
2.5
3.0
3.5
Per C
ent
Construction
OverallServices
Manufacturing
Table 2.1 Employment and Labour Force Growth
(%)
2007 2008
Q1 Q2 Q3 Q4 Q1 Q2
Employment Growth (q‐o‐q)
2.0 2.5 2.2 2.3 2.7 2.5
Labour Force Growth (q‐o‐q)*
1.8 2.9 0.8 2.5 2.8 3.7
Overall Unemployment Rate
2.5 2.9 1.5 1.6 1.8 2.9
Overall Unemployment Rate, SA
2.8 2.3 1.7 1.7 2.0 2.3
* EPD, MAS estimates
2 Only annual labour force figures are available. The size of the quarterly labour force is estimated from the sum of
employed and unemployed persons.

32 Macroeconomic Review, October 2008
Monetary Authority of Singapore Economic Policy Department
The growth in the labour force was probably the result of a general increase in the resident labour force participation rate since 2004. Looking at population trends and participation rates of the various age groups as well as the impact of business cycles on participation rates, the pick up in the resident labour force participation rate can be attributed to cyclical and structural factors, such as higher female participation rates and a deferment of retirement plans. Box C at the end of this chapter highlights recent trends in Singapore’s resident labour force participation rate.
Wage growth in most sectors moderated in Q2, but remained strong.
Overall nominal wage growth moderated from a high of 11% y‐o‐y in Q1 2008 to 3.1% in Q2. The large decline was particularly evident in the community, social & personal services sector. (Chart 2.6) In Q1, wages in that sector increased by an atypical high of 21% y‐o‐y. This was primarily due to a second round of salary adjustments, mostly in the form of one‐off bonus payments in some groups in the civil service. In Q2, wage growth turned negative due partly to a high base last year.3 Excluding the community, social & personal services sector, nominal wages grew by 8.2% y‐o‐y in Q1 and 6.4% in Q2. Nonetheless, wage growth in some sectors such as construction, wholesale & retail trade and manufacturing remained stronger in Q2 2008 than 2007. In particular, on account of robust activity and intense competition for workers, wages for construction employees rose by 8.9% y‐o‐y in H1 this year, exceeding the 5.1% growth in 2007. In other segments of the economy, wage growth slipped in Q2 due to a weakening business outlook. For example, wages declined by 1.6% y‐o‐y in the real estate segment (subsumed under the category “Business Services”) in Q2 2008, reflecting the general slowdown in the property market in recent months. Similarly, wages in the financial services and hotels & restaurants sectors rose by 5.2% and 1.9% respectively in Q2, the smallest increment since end‐2006.
Chart 2.6 Nominal Wage Growth by Industry
Overall
Construction
Business Services
Wholesale & Retail
Information & Comm
Financial Services
Manufacturing
Transport & Storage
Hotels & Restaurants
-10 -5 0 5 10 15 20YOY % Growth
2008 Q2 2008 Q1 2007
Community, Social & Personal Services
3 The first round of salary adjustments, mostly in the form of one‐off bonus payments, was in April 2007. As a result, y‐o‐y
wage growth in this sector turned significantly negative in Q2 2008 due to the high base.
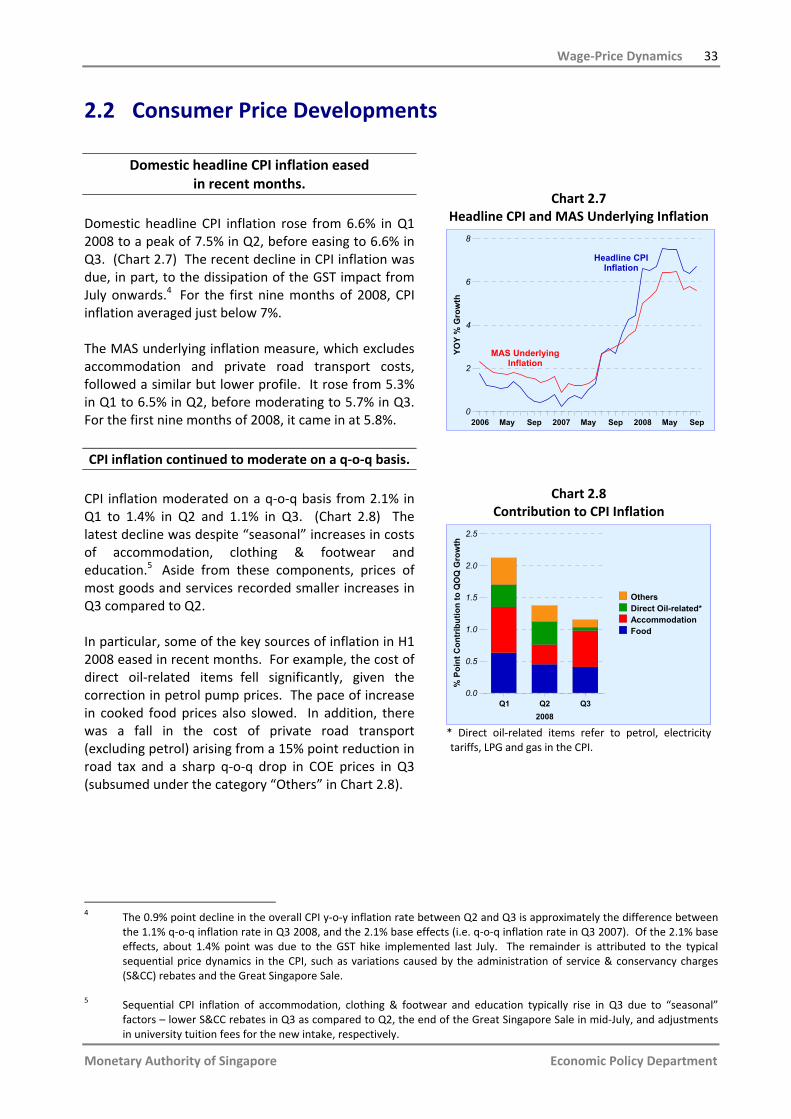
Wage‐Price Dynamics 33
Monetary Authority of Singapore Economic Policy Department
2.2 Consumer Price Developments
Domestic headline CPI inflation eased in recent months.
Domestic headline CPI inflation rose from 6.6% in Q1 2008 to a peak of 7.5% in Q2, before easing to 6.6% in Q3. (Chart 2.7) The recent decline in CPI inflation was due, in part, to the dissipation of the GST impact from July onwards.4 For the first nine months of 2008, CPI inflation averaged just below 7%. The MAS underlying inflation measure, which excludes accommodation and private road transport costs, followed a similar but lower profile. It rose from 5.3% in Q1 to 6.5% in Q2, before moderating to 5.7% in Q3. For the first nine months of 2008, it came in at 5.8%. CPI inflation continued to moderate on a q‐o‐q basis.
CPI inflation moderated on a q‐o‐q basis from 2.1% in Q1 to 1.4% in Q2 and 1.1% in Q3. (Chart 2.8) The latest decline was despite “seasonal” increases in costs of accommodation, clothing & footwear and education.5 Aside from these components, prices of most goods and services recorded smaller increases in Q3 compared to Q2. In particular, some of the key sources of inflation in H1 2008 eased in recent months. For example, the cost of direct oil‐related items fell significantly, given the correction in petrol pump prices. The pace of increase in cooked food prices also slowed. In addition, there was a fall in the cost of private road transport (excluding petrol) arising from a 15% point reduction in road tax and a sharp q‐o‐q drop in COE prices in Q3 (subsumed under the category “Others” in Chart 2.8).
Chart 2.7 Headline CPI and MAS Underlying Inflation
2006 May Sep 2007 May Sep 2008 May Sep0
2
4
6
8
YOY
% G
row
th
MAS Underlying Inflation
Headline CPI Inflation
Chart 2.8 Contribution to CPI Inflation
Q1 Q2 Q32008
0.0
0.5
1.0
1.5
2.0
2.5
% P
oint
Con
trib
utio
n to
QO
Q G
row
th
OthersDirect Oil-related*AccommodationFood
* Direct oil‐related items refer to petrol, electricity tariffs, LPG and gas in the CPI.
4 The 0.9% point decline in the overall CPI y‐o‐y inflation rate between Q2 and Q3 is approximately the difference between
the 1.1% q‐o‐q inflation rate in Q3 2008, and the 2.1% base effects (i.e. q‐o‐q inflation rate in Q3 2007). Of the 2.1% base effects, about 1.4% point was due to the GST hike implemented last July. The remainder is attributed to the typical sequential price dynamics in the CPI, such as variations caused by the administration of service & conservancy charges (S&CC) rebates and the Great Singapore Sale.
5 Sequential CPI inflation of accommodation, clothing & footwear and education typically rise in Q3 due to “seasonal”
factors – lower S&CC rebates in Q3 as compared to Q2, the end of the Great Singapore Sale in mid‐July, and adjustments in university tuition fees for the new intake, respectively.

34 Macroeconomic Review, October 2008
Monetary Authority of Singapore Economic Policy Department
Oil prices have corrected sharply since July on concerns over slower global economic growth …
After hitting US$147 in mid‐July, the West Texas Intermediate (WTI) crude oil price has pulled back sharply to around US$68 on concerns over the slowing global economy. (Chart 2.9) Poor prospects for global oil demand have overshadowed supply concerns due to geopolitical events and the absence of normal inventory build‐up in the OECD countries. The disruption of Caspian export flows in August due to tensions between Russia and Georgia, as well as the impact of Hurricanes Gustav and Ike, also failed to lift prices significantly. Nevertheless, despite the recent correction, the average year‐to‐date WTI oil price of US$111 is still some 54% higher than the average of US$72 in 2007. ... although oil‐related CPI inflation remained high. The recent retreat in oil prices led to several rounds of cuts in domestic petrol pump prices. (Chart 2.10) Notwithstanding this, prices of other direct oil‐related items in the CPI basket continued to rise in response to previous sharp increases in oil prices. For example, electricity tariffs were raised by 5.0% q‐o‐q in Q3 and by another 21% in Q4, as the tariff for the quarter is pegged to the three‐month forward price of fuel oil quoted in the first month of the preceding quarter.6 Similarly, piped gas prices were raised by 5.3% m‐o‐m and 4.1% in August and September respectively. As a result, while CPI inflation of direct oil‐related items declined from 28% y‐o‐y in H1 2008, it remained high at 20% in Q3 and contributed nearly a fifth to overall CPI inflation during this period. Apart from direct oil‐related items, other items in the CPI basket have also seen price increases recently due to previous rises in oil prices. In July, taxi operators implemented fuel surcharges and private bus operators hiked fares in response to more costly petrol and diesel. These caused public road transport cost inflation to rise from 5.6% y‐o‐y in H1 2008 to 6.7% in Q3. Following a jump in jet and bunker fuel from year‐ago levels, air and sea fares have also risen by around 9.2% since the start of the year (subsumed under the category “Other Travel & Transport” in Chart 2.11). This has, in turn, driven up the cost of holiday travel packages.
Chart 2.9 WTI Oil Prices
60
80
100
120
140
160
US$
Per
Bar
rel
2007 2008Oct Jan Apr Jul Oct*Jul
Source: Bloomberg * As at 23 October.
Chart 2.10
Electricity, Gas, LPG and Petrol CPI
2007 May Sep 2008 May Sep90
100
110
120
130
140
150
Inde
x (J
an 2
007=
100)
LPG
Electricity Tariff
Gas
Petrol
Chart 2.11 Public Road Transport and
Other Travel & Transport CPI
2007 May Sep 2008 May Sep95
100
105
110
115
120
Inde
x (J
an 2
007=
100)
Public Road Transport
Other Travel & Transport
6 See the August 2008 issue of Inflation Monthly for a stylised flow diagram that summarises the tariff determination
process.

Wage‐Price Dynamics 35
Monetary Authority of Singapore Economic Policy Department
In general, as oil is an important input in production, distribution and retailing processes, the surge in oil prices this year has contributed indirectly to price increases in a wide range of items in the CPI. Using Input‐Output Tables to calculate the oil content in the production of all goods and services, EPD estimated that the total contribution from the increase in oil prices to domestic CPI inflation could be as high as 39% (or 2.7% points) in Jan‐Sep 2008.7
While global food prices also fell from recent peaks …
Global food commodity price inflation abated in recent months after intensifying in Q1 2008. The IMF Food & Beverage Commodity Price Index, for example, rose at a slower pace of 4.2% between April and June and actually fell by 13% between July and September, after surging by 19% between January and March. (Chart 2.12) The sharp increase in the international prices of basic foods in the earlier part of the year was due to a combination of factors, including low levels of exportable supplies, weather‐related supply disruptions, increased biofuel production, higher input costs and trade restrictions. 8 In recent months, however, prices have fallen on the prospect of record levels of production in nearly all types of crops this year.9 Nonetheless, compared to a year ago, global food prices as at September are still some 15% higher. … domestic food prices continued to rise due to
earlier increases in global food prices and higher domestic costs.
Reflecting global price developments with a lag, domestic food import prices rose by 1.7% between January and April 2008 and a significantly higher 5.8% between May and August. (Chart 2.13) These increases, alongside intensified domestic business cost pressures, then fed through to higher final consumer food prices.
Chart 2.12 IMF Food & Beverage Commodity
Price Index
2007 May Sep 2008 May Sep100
110
120
130
140
150
160
Inde
x (J
an 2
007=
100)
Source: IMF
Chart 2.13
Food Import Price Index*
2007 May Sep 2008 May100
105
110
115
120
Inde
x (J
an 2
007=
100)
Aug
* Weighted average of the food, beverages and animal & vegetable oils categories in the Import Price Index
7 The estimate assumes full pass‐through from production costs to retail prices, i.e. the maximum possible contribution
from oil prices to CPI inflation. 8 For example, rice export bans in several key exporting countries such as Vietnam, India and Cambodia had caused
international panic buying and the near‐tripling of rice prices in H1 2008. 9 The FAO's latest forecast for world cereal production in 2008 stands at a record 2.23 billion tonnes, up 4.9% from 2007,
with the bulk of the increase coming from wheat.
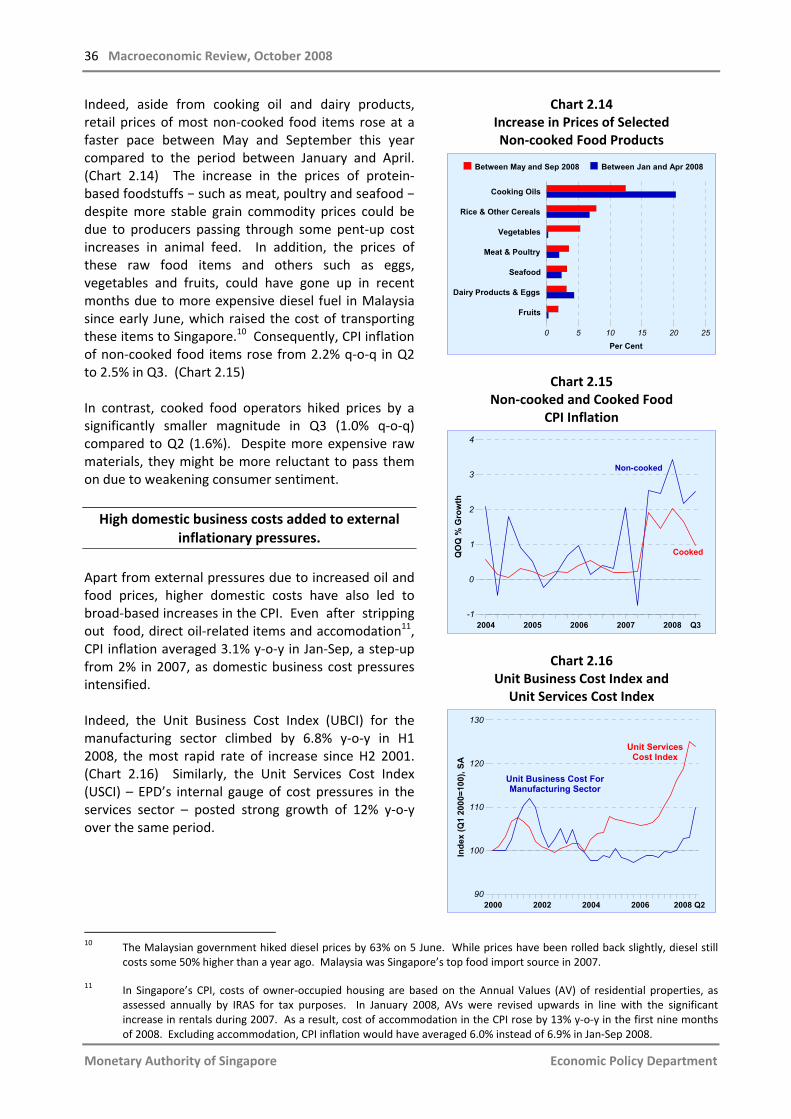
36 Macroeconomic Review, October 2008
Monetary Authority of Singapore Economic Policy Department
Indeed, aside from cooking oil and dairy products, retail prices of most non‐cooked food items rose at a faster pace between May and September this year compared to the period between January and April. (Chart 2.14) The increase in the prices of protein‐based foodstuffs − such as meat, poultry and seafood − despite more stable grain commodity prices could be due to producers passing through some pent‐up cost increases in animal feed. In addition, the prices of these raw food items and others such as eggs, vegetables and fruits, could have gone up in recent months due to more expensive diesel fuel in Malaysia since early June, which raised the cost of transporting these items to Singapore.10 Consequently, CPI inflation of non‐cooked food items rose from 2.2% q‐o‐q in Q2 to 2.5% in Q3. (Chart 2.15) In contrast, cooked food operators hiked prices by a significantly smaller magnitude in Q3 (1.0% q‐o‐q) compared to Q2 (1.6%). Despite more expensive raw materials, they might be more reluctant to pass them on due to weakening consumer sentiment. High domestic business costs added to external
inflationary pressures. Apart from external pressures due to increased oil and food prices, higher domestic costs have also led to broad‐based increases in the CPI. Even after stripping out food, direct oil‐related items and accomodation11, CPI inflation averaged 3.1% y‐o‐y in Jan‐Sep, a step‐up from 2% in 2007, as domestic business cost pressures intensified. Indeed, the Unit Business Cost Index (UBCI) for the manufacturing sector climbed by 6.8% y‐o‐y in H1 2008, the most rapid rate of increase since H2 2001. (Chart 2.16) Similarly, the Unit Services Cost Index (USCI) – EPD’s internal gauge of cost pressures in the services sector – posted strong growth of 12% y‐o‐y over the same period.
Chart 2.14 Increase in Prices of Selected Non‐cooked Food Products
Cooking Oils
Rice & Other Cereals
Vegetables
Meat & Poultry
Seafood
Dairy Products & Eggs
Fruits
0 5 10 15 20 25Per Cent
Between May and Sep 2008 Between Jan and Apr 2008
Chart 2.15 Non‐cooked and Cooked Food
CPI Inflation
2004 2005 2006 2007 2008 Q3-1
0
1
2
3
4
QO
Q %
Gro
wthNon-cooked
Cooked
Chart 2.16
Unit Business Cost Index and Unit Services Cost Index
2000 2002 2004 2006 2008 Q290
100
110
120
130
Inde
x (Q
1 20
00=1
00),
SA
Unit Services Cost Index
Unit Business Cost For Manufacturing Sector
10 The Malaysian government hiked diesel prices by 63% on 5 June. While prices have been rolled back slightly, diesel still
costs some 50% higher than a year ago. Malaysia was Singapore’s top food import source in 2007. 11 In Singapore’s CPI, costs of owner‐occupied housing are based on the Annual Values (AV) of residential properties, as
assessed annually by IRAS for tax purposes. In January 2008, AVs were revised upwards in line with the significant increase in rentals during 2007. As a result, cost of accommodation in the CPI rose by 13% y‐o‐y in the first nine months of 2008. Excluding accommodation, CPI inflation would have averaged 6.0% instead of 6.9% in Jan‐Sep 2008.
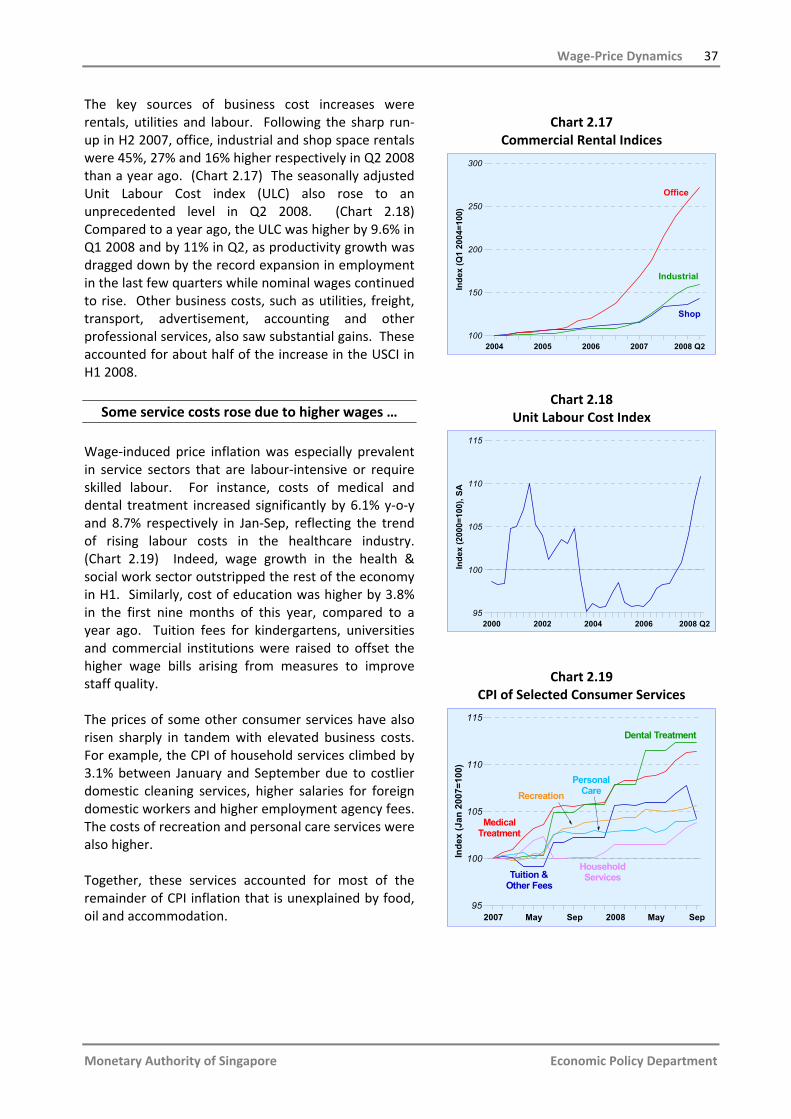
Wage‐Price Dynamics 37
Monetary Authority of Singapore Economic Policy Department
The key sources of business cost increases were rentals, utilities and labour. Following the sharp run‐up in H2 2007, office, industrial and shop space rentals were 45%, 27% and 16% higher respectively in Q2 2008 than a year ago. (Chart 2.17) The seasonally adjusted Unit Labour Cost index (ULC) also rose to an unprecedented level in Q2 2008. (Chart 2.18) Compared to a year ago, the ULC was higher by 9.6% in Q1 2008 and by 11% in Q2, as productivity growth was dragged down by the record expansion in employment in the last few quarters while nominal wages continued to rise. Other business costs, such as utilities, freight, transport, advertisement, accounting and other professional services, also saw substantial gains. These accounted for about half of the increase in the USCI in H1 2008.
Some service costs rose due to higher wages … Wage‐induced price inflation was especially prevalent in service sectors that are labour‐intensive or require skilled labour. For instance, costs of medical and dental treatment increased significantly by 6.1% y‐o‐y and 8.7% respectively in Jan‐Sep, reflecting the trend of rising labour costs in the healthcare industry. (Chart 2.19) Indeed, wage growth in the health & social work sector outstripped the rest of the economy in H1. Similarly, cost of education was higher by 3.8% in the first nine months of this year, compared to a year ago. Tuition fees for kindergartens, universities and commercial institutions were raised to offset the higher wage bills arising from measures to improve staff quality. The prices of some other consumer services have also risen sharply in tandem with elevated business costs. For example, the CPI of household services climbed by 3.1% between January and September due to costlier domestic cleaning services, higher salaries for foreign domestic workers and higher employment agency fees. The costs of recreation and personal care services were also higher. Together, these services accounted for most of the remainder of CPI inflation that is unexplained by food, oil and accommodation.
Chart 2.17
Commercial Rental Indices
2004 2005 2006 2007 2008 Q2100
150
200
250
300
Inde
x (Q
1 20
04=1
00)
Office
Shop
Industrial
Chart 2.18 Unit Labour Cost Index
2000 2002 2004 2006 2008 Q295
100
105
110
115
Inde
x (2
000=
100)
, SA
Chart 2.19 CPI of Selected Consumer Services
2007 May Sep 2008 May Sep95
100
105
110
115
Inde
x (J
an 2
007=
100)
Medical Treatment
Tuition & Other Fees
Dental Treatment
RecreationPersonal
Care
Household Services
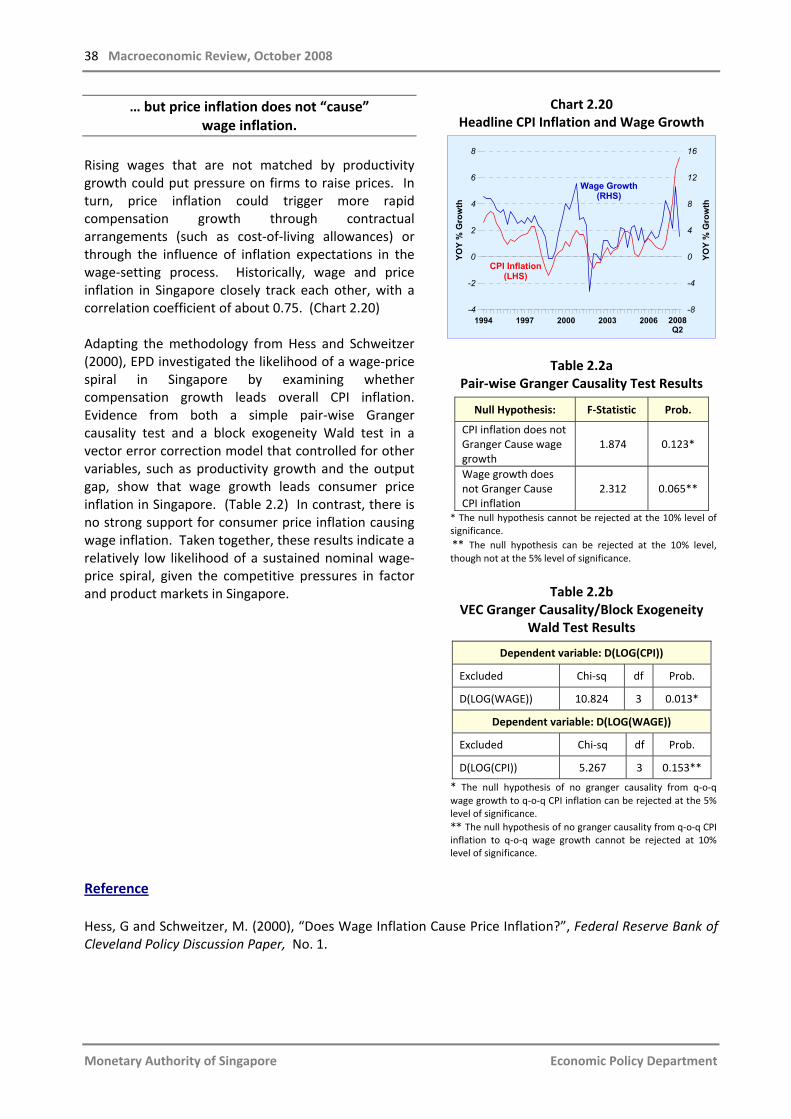
38 Macroeconomic Review, October 2008
Monetary Authority of Singapore Economic Policy Department
… but price inflation does not “cause” wage inflation.
Rising wages that are not matched by productivity growth could put pressure on firms to raise prices. In turn, price inflation could trigger more rapid compensation growth through contractual arrangements (such as cost‐of‐living allowances) or through the influence of inflation expectations in the wage‐setting process. Historically, wage and price inflation in Singapore closely track each other, with a correlation coefficient of about 0.75. (Chart 2.20) Adapting the methodology from Hess and Schweitzer (2000), EPD investigated the likelihood of a wage‐price spiral in Singapore by examining whether compensation growth leads overall CPI inflation. Evidence from both a simple pair‐wise Granger causality test and a block exogeneity Wald test in a vector error correction model that controlled for other variables, such as productivity growth and the output gap, show that wage growth leads consumer price inflation in Singapore. (Table 2.2) In contrast, there is no strong support for consumer price inflation causing wage inflation. Taken together, these results indicate a relatively low likelihood of a sustained nominal wage‐price spiral, given the competitive pressures in factor and product markets in Singapore.
Chart 2.20 Headline CPI Inflation and Wage Growth
1994 1997 2000 2003 2006
-4
-2
0
2
4
6
8
YOY
% G
row
th
-8
-4
0
4
8
12
16
YOY
% G
row
th
CPI Inflation (LHS)
Wage Growth (RHS)
2008Q2
Table 2.2a
Pair‐wise Granger Causality Test Results
Null Hypothesis: F‐Statistic Prob.
CPI inflation does not Granger Cause wage growth
1.874 0.123*
Wage growth does not Granger Cause CPI inflation
2.312 0.065**
* The null hypothesis cannot be rejected at the 10% level of significance. ** The null hypothesis can be rejected at the 10% level, though not at the 5% level of significance.
Table 2.2b
VEC Granger Causality/Block Exogeneity Wald Test Results
Dependent variable: D(LOG(CPI))
Excluded Chi‐sq df Prob.
D(LOG(WAGE)) 10.824 3 0.013*
Dependent variable: D(LOG(WAGE))
Excluded Chi‐sq df Prob.
D(LOG(CPI)) 5.267 3 0.153**
* The null hypothesis of no granger causality from q‐o‐q wage growth to q‐o‐q CPI inflation can be rejected at the 5% level of significance. ** The null hypothesis of no granger causality from q‐o‐q CPI inflation to q‐o‐q wage growth cannot be rejected at 10% level of significance.
Reference Hess, G and Schweitzer, M. (2000), “Does Wage Inflation Cause Price Inflation?”, Federal Reserve Bank of Cleveland Policy Discussion Paper, No. 1.

Wage‐Price Dynamics 39
Monetary Authority of Singapore Economic Policy Department
Box CRecent Trends in Singapore’s Resident Labour Force Participation Rate
Introduction In labour‐scarce Singapore, the labour force participation rate (LFPR) is a key factor underpinning the economy’s medium‐term potential growth. There have been several studies looking at this issue in other countries. For example, Aaronson et al. (2006) from the US Federal Reserve Board undertook an extensive study of the factors contributing to the decline in the US LFPR and the implications for the potential labour supply. The Westpac Institutional Bank (2007) recently looked at the past and future trends in New Zealand’s LFPR. This box examines the factors that have influenced Singapore’s resident LFPR and its likely trend going forward by adapting some parts of the analytical framework used in the above studies. Structural Factors behind Changes in Singapore’s Resident LFPR Apart from a sharp fall in 19951/, Singapore’s overall resident LFPR trended slightly upwards in the 1990s before declining between 2002 and 2005 and rising again in 2006 and 2007. (Chart C1)
Chart C1 Resident LFPR
1990 1993 1996 1999 2002 200561
62
63
64
65
66
Per C
ent
2007 The deviation of the overall LFPR in a particular year from its sample mean can be decomposed using the following identity:
( ) ( ) ( ) ( )[ ]∑ −×−+×−+×−=−j
jtjjtjjjtjtjjt SSRRSRRSRRRR ,,,,
where R denotes participation rate, S population share, j demographic group, t year and overbars indicate the mean over the sample period. The first expression on the right hand side captures the contribution from the deviation of each demographic group’s mean participation rate from the overall sample mean, weighted by the group’s population share. The second measures the deviation of each group’s actual participation rate from its own mean, weighted by its average population share. The final expression is an interaction term, which turns out to be negligible in this study. Changes in the first term over time can be interpreted as the contribution from changes in the group’s population shares or changes in demographics, and changes in the second term over time indicate the contribution from changes in the group’s participation rates.
1/ Data for 1990, 1995, 2000 and 2005 are from the Census of Population and General Household Survey conducted by
DOS, and hence are not directly comparable with data for the other years which are from the Labour Force Survey.
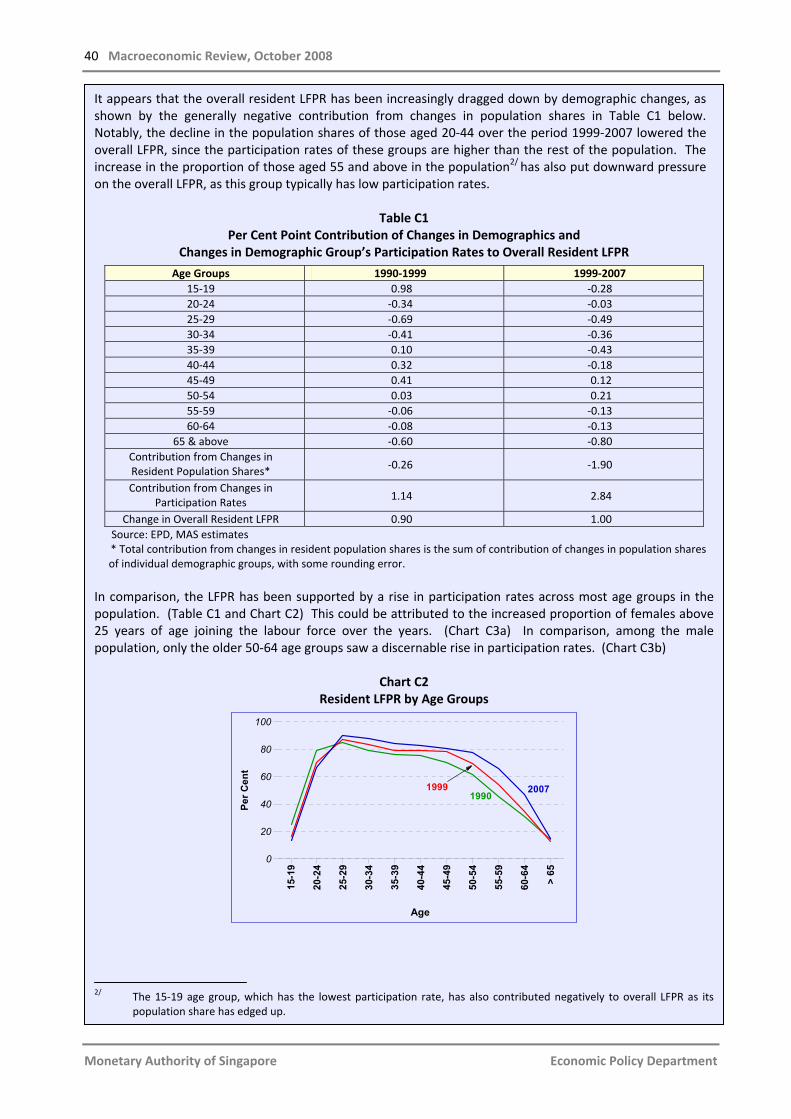
40 Macroeconomic Review, October 2008
Monetary Authority of Singapore Economic Policy Department
It appears that the overall resident LFPR has been increasingly dragged down by demographic changes, as shown by the generally negative contribution from changes in population shares in Table C1 below. Notably, the decline in the population shares of those aged 20‐44 over the period 1999‐2007 lowered the overall LFPR, since the participation rates of these groups are higher than the rest of the population. The increase in the proportion of those aged 55 and above in the population2/ has also put downward pressure on the overall LFPR, as this group typically has low participation rates.
Table C1
Per Cent Point Contribution of Changes in Demographics and Changes in Demographic Group’s Participation Rates to Overall Resident LFPR
Age Groups 1990‐1999 1999‐2007 15‐19 0.98 ‐0.28 20‐24 ‐0.34 ‐0.03 25‐29 ‐0.69 ‐0.49 30‐34 ‐0.41 ‐0.36 35‐39 0.10 ‐0.43 40‐44 0.32 ‐0.18 45‐49 0.41 0.12 50‐54 0.03 0.21 55‐59 ‐0.06 ‐0.13 60‐64 ‐0.08 ‐0.13
65 & above ‐0.60 ‐0.80 Contribution from Changes in Resident Population Shares* ‐0.26 ‐1.90
Contribution from Changes in Participation Rates 1.14 2.84
Change in Overall Resident LFPR 0.90 1.00 Source: EPD, MAS estimates * Total contribution from changes in resident population shares is the sum of contribution of changes in population shares
of individual demographic groups, with some rounding error. In comparison, the LFPR has been supported by a rise in participation rates across most age groups in the population. (Table C1 and Chart C2) This could be attributed to the increased proportion of females above 25 years of age joining the labour force over the years. (Chart C3a) In comparison, among the male population, only the older 50‐64 age groups saw a discernable rise in participation rates. (Chart C3b)
Chart C2 Resident LFPR by Age Groups
15-1
9
20-2
4
25-2
9
30-3
4
35-3
9
40-4
4
45-4
9
50-5
4
55-5
9
60-6
4
> 65
0
20
40
60
80
100
Per C
ent
Age
200719991990
2/ The 15‐19 age group, which has the lowest participation rate, has also contributed negatively to overall LFPR as its
population share has edged up.
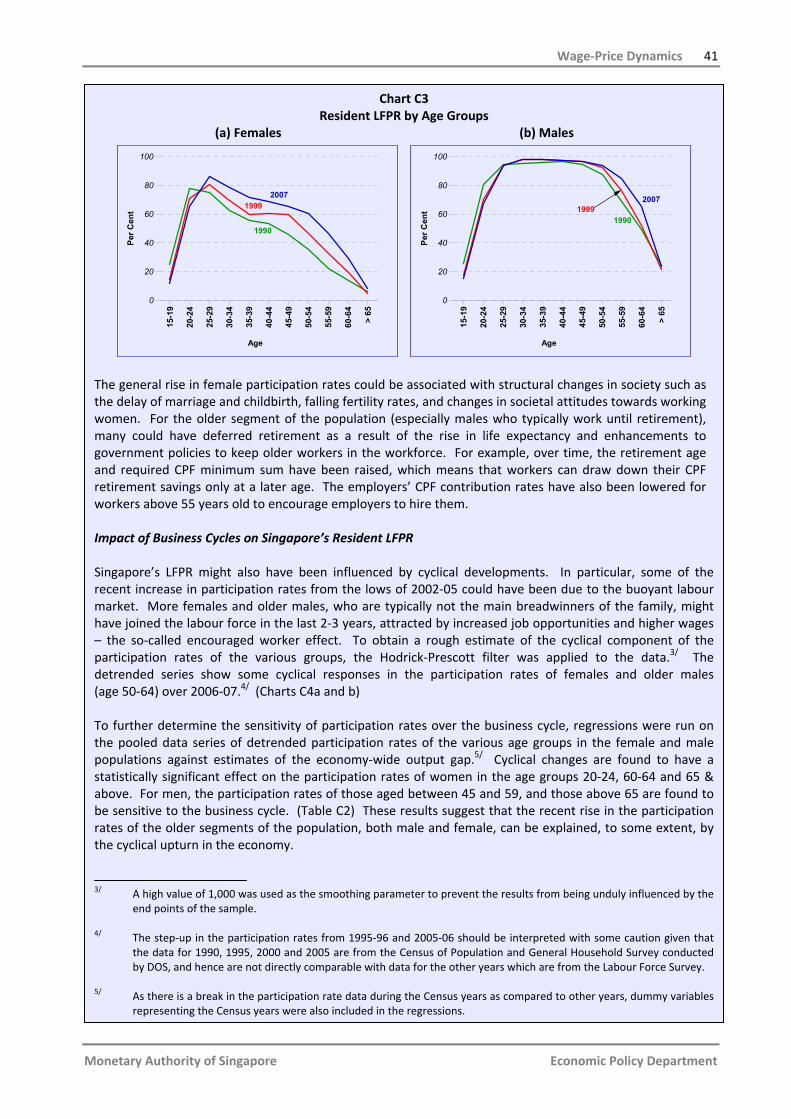
Wage‐Price Dynamics 41
Monetary Authority of Singapore Economic Policy Department
Chart C3Resident LFPR by Age Groups
(a) Females (b) Males
15-1
9
20-2
4
25-2
9
30-3
4
35-3
9
40-4
4
45-4
9
50-5
4
55-5
9
60-6
4
> 65
0
20
40
60
80
100
Per C
ent
Age
19992007
1990
15-1
9
20-2
4
25-2
9
30-3
4
35-3
9
40-4
4
45-4
9
50-5
4
55-5
9
60-6
4
> 65
0
20
40
60
80
100
Per C
ent
Age
19992007
1990
The general rise in female participation rates could be associated with structural changes in society such as the delay of marriage and childbirth, falling fertility rates, and changes in societal attitudes towards working women. For the older segment of the population (especially males who typically work until retirement), many could have deferred retirement as a result of the rise in life expectancy and enhancements to government policies to keep older workers in the workforce. For example, over time, the retirement age and required CPF minimum sum have been raised, which means that workers can draw down their CPF retirement savings only at a later age. The employers’ CPF contribution rates have also been lowered for workers above 55 years old to encourage employers to hire them. Impact of Business Cycles on Singapore’s Resident LFPR Singapore’s LFPR might also have been influenced by cyclical developments. In particular, some of the recent increase in participation rates from the lows of 2002‐05 could have been due to the buoyant labour market. More females and older males, who are typically not the main breadwinners of the family, might have joined the labour force in the last 2‐3 years, attracted by increased job opportunities and higher wages – the so‐called encouraged worker effect. To obtain a rough estimate of the cyclical component of the participation rates of the various groups, the Hodrick‐Prescott filter was applied to the data.3/ The detrended series show some cyclical responses in the participation rates of females and older males (age 50‐64) over 2006‐07.4/ (Charts C4a and b) To further determine the sensitivity of participation rates over the business cycle, regressions were run on the pooled data series of detrended participation rates of the various age groups in the female and male populations against estimates of the economy‐wide output gap.5/ Cyclical changes are found to have a statistically significant effect on the participation rates of women in the age groups 20‐24, 60‐64 and 65 & above. For men, the participation rates of those aged between 45 and 59, and those above 65 are found to be sensitive to the business cycle. (Table C2) These results suggest that the recent rise in the participation rates of the older segments of the population, both male and female, can be explained, to some extent, by the cyclical upturn in the economy.
3/ A high value of 1,000 was used as the smoothing parameter to prevent the results from being unduly influenced by the
end points of the sample. 4/ The step‐up in the participation rates from 1995‐96 and 2005‐06 should be interpreted with some caution given that
the data for 1990, 1995, 2000 and 2005 are from the Census of Population and General Household Survey conducted by DOS, and hence are not directly comparable with data for the other years which are from the Labour Force Survey.
5/ As there is a break in the participation rate data during the Census years as compared to other years, dummy variables
representing the Census years were also included in the regressions.
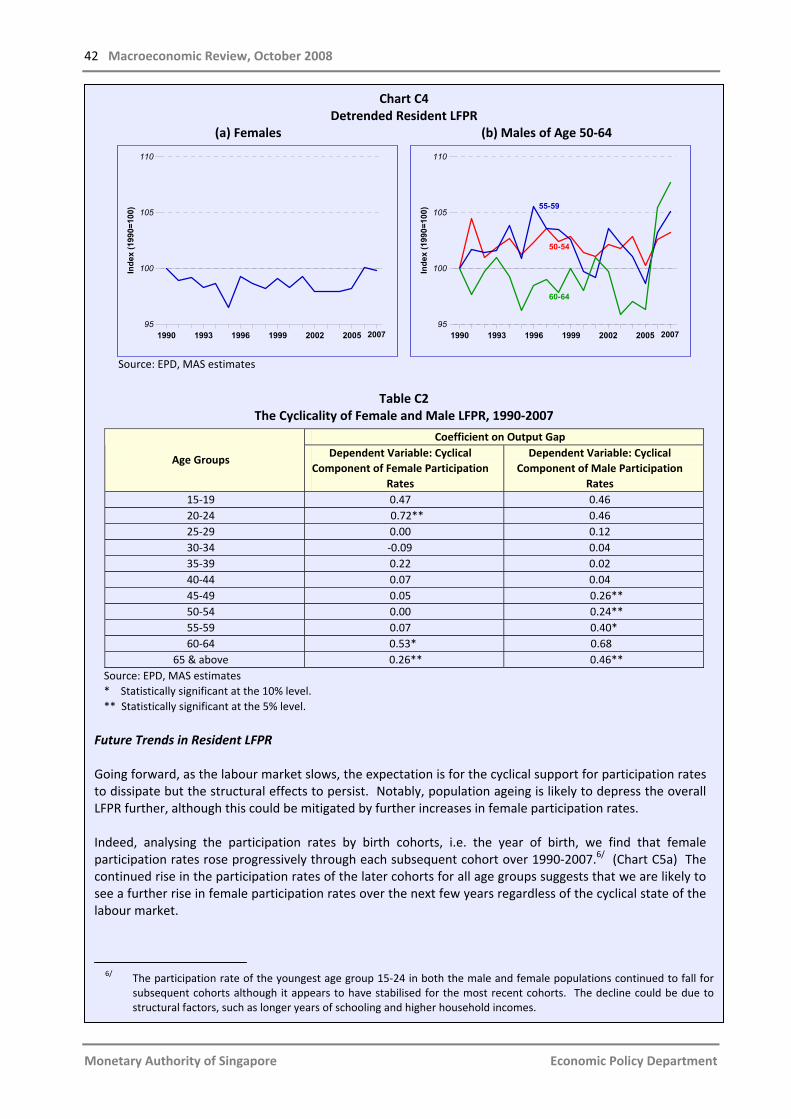
42 Macroeconomic Review, October 2008
Monetary Authority of Singapore Economic Policy Department
Chart C4Detrended Resident LFPR
(a) Females (b) Males of Age 50‐64
1990 1993 1996 1999 2002 2005
95
100
105
110
Inde
x (1
990=
100)
2007 1990 1993 1996 1999 2002 2005
95
100
105
110
Inde
x (1
990=
100)
50-54
55-59
60-64
2007
Source: EPD, MAS estimates
Table C2
The Cyclicality of Female and Male LFPR, 1990‐2007
Coefficient on Output Gap
Age Groups Dependent Variable: Cyclical
Component of Female Participation Rates
Dependent Variable: Cyclical Component of Male Participation
Rates 15‐19 0.47 0.46 20‐24 0.72** 0.46 25‐29 0.00 0.12 30‐34 ‐0.09 0.04 35‐39 0.22 0.02 40‐44 0.07 0.04 45‐49 0.05 0.26** 50‐54 0.00 0.24** 55‐59 0.07 0.40* 60‐64 0.53* 0.68
65 & above 0.26** 0.46** Source: EPD, MAS estimates * Statistically significant at the 10% level. ** Statistically significant at the 5% level.
Future Trends in Resident LFPR Going forward, as the labour market slows, the expectation is for the cyclical support for participation rates to dissipate but the structural effects to persist. Notably, population ageing is likely to depress the overall LFPR further, although this could be mitigated by further increases in female participation rates. Indeed, analysing the participation rates by birth cohorts, i.e. the year of birth, we find that female participation rates rose progressively through each subsequent cohort over 1990‐2007.6/ (Chart C5a) The continued rise in the participation rates of the later cohorts for all age groups suggests that we are likely to see a further rise in female participation rates over the next few years regardless of the cyclical state of the labour market.
6/ The participation rate of the youngest age group 15‐24 in both the male and female populations continued to fall for
subsequent cohorts although it appears to have stabilised for the most recent cohorts. The decline could be due to structural factors, such as longer years of schooling and higher household incomes.

Wage‐Price Dynamics 43
Monetary Authority of Singapore Economic Policy Department
In contrast, for most of the male population, there is little change in participation rates in the recent cohorts. However, older males in the age group of 55‐64 show an increasing inclination to work, probably because of the structural reasons mentioned earlier. (Chart C5b) As this group will grow as the population ages, a rise in its participation rate will provide some offset to the downward pressure on the LFPR from changing demographics.
Chart C5 Changes in the Resident LFPR by Birth Year*
(a) Females (b) Males
1930 1940 1950 1960 1970 1980
-15
-10
-5
0
5
10
15
20
Perc
enta
ge P
oint
1987
55-64
45-54 35-44
25-34 15-24
1930 1940 1950 1960 1970 1980
-15
-10
-5
0
5
10
15
20
Perc
enta
ge P
oint
1987
55-64
45-54 35-44
25-34
15-24
Source: EPD, MAS estimates * The birth year is based on the midpoint of each age group. The change in the participation rate of each birth cohort in each age group is computed as the deviation from the mean of the age group.
Based on the experience of OECD countries, there is still scope for further increase in Singapore’s female participation rate. For example, many women in Sweden remain active in the workforce until close to retirement age, which shows up as a U‐shaped curve for participation rates. In contrast, Singapore’s female participation rate peaks at the age of 25‐29 and trends down subsequently as women increasingly drop out of the workforce after marriage. (Chart C6) Similarly, participation rates of the older segment of the population, i.e. those above 55 years old, are below those in Japan, which has a large proportion of economically active in the older population. (Chart C7) EPD’s estimates show that if Singapore’s participation rates (aged 30‐54) and the older population (55 and above) could reach those of Sweden and Japan in 2007 respectively over a period of 30 years, this would raise our labour force growth by 0.2% point per annum on average.
Chart C6 Chart C7 Resident Female LFPR by Age Groups,
Singapore and Sweden LFPR of Resident Older Workers,
Singapore and Japan
15-1
9
20-2
4
25-2
9
30-3
4
35-3
9
40-4
4
45-4
9
50-5
4
55-5
9
60-6
4
> 65
0
20
40
60
80
100
Per C
ent
Age
Sweden
Singapore
55-5
9
60-6
4
> 65
0
20
40
60
80
Per C
ent
Singapore Japan
Age.
Source: OECD
44 Macroeconomic Review, October 2008
Monetary Authority of Singapore Economic Policy Department
Sum‐up Singapore’s overall resident LFPR has been supported by structural factors such as higher female participation in the labour force and later retirement as well as the recent cyclical upturn in the economy. However, the ageing population has an increasing dampening effect on LFPR over time and will become a bigger drag going forward. The cyclical boost will also dissipate as the labour market softens. Nevertheless, the negative impact of these factors on labour force growth could be offset if the participation rates of females and the older segment of the population rise to levels achieved by some OECD countries. References Aaronson, S, Fallick, B, Figura, A, Pingle, J and Wascher W (2006), “The Recent Decline in the Labor Force Participation Rate and Its Implications for Potential Labor Supply”, Brookings Papers on Economic Activity, No.1, pp 69‐154. Westpac Institutional Bank (2007), “Labour Force Participation in New Zealand – Past, Present and Future”, Occasional Paper, January 2007.

Chapter 3 Outlook
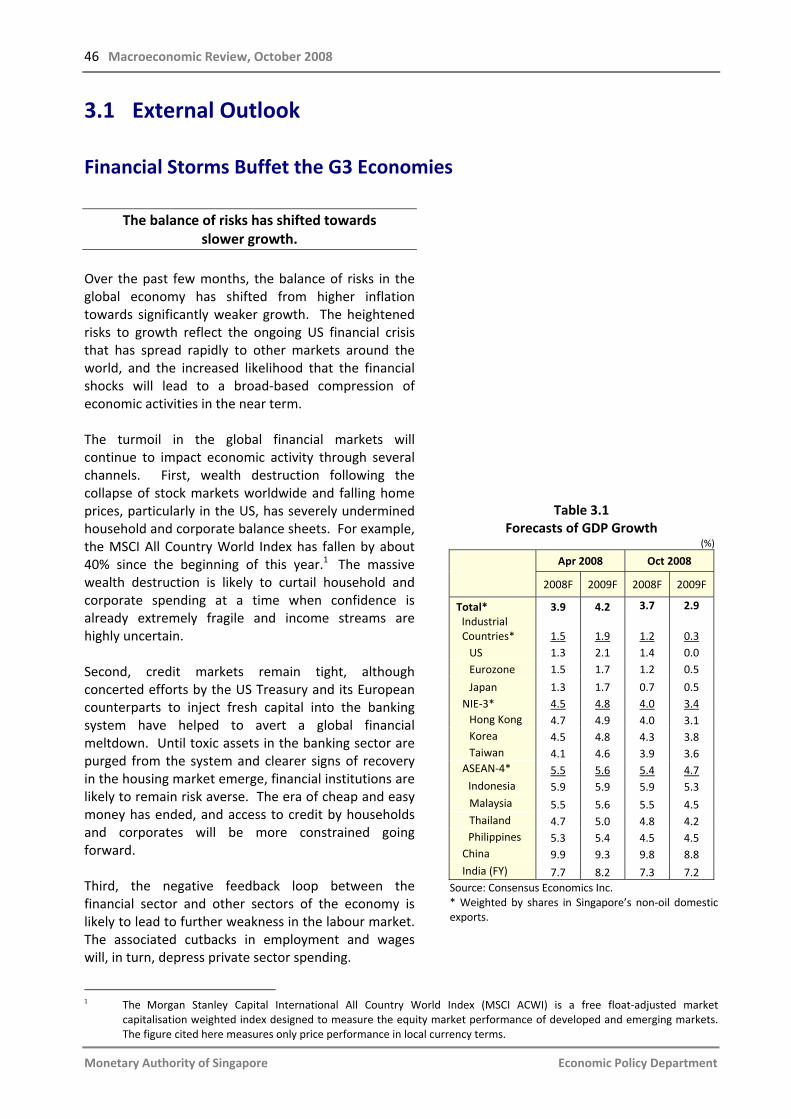
46 Macroeconomic Review, October 2008
Monetary Authority of Singapore Economic Policy Department
3.1 External Outlook Financial Storms Buffet the G3 Economies
The balance of risks has shifted towards slower growth.
Over the past few months, the balance of risks in the global economy has shifted from higher inflation towards significantly weaker growth. The heightened risks to growth reflect the ongoing US financial crisis that has spread rapidly to other markets around the world, and the increased likelihood that the financial shocks will lead to a broad‐based compression of economic activities in the near term. The turmoil in the global financial markets will continue to impact economic activity through several channels. First, wealth destruction following the collapse of stock markets worldwide and falling home prices, particularly in the US, has severely undermined household and corporate balance sheets. For example, the MSCI All Country World Index has fallen by about 40% since the beginning of this year.1 The massive wealth destruction is likely to curtail household and corporate spending at a time when confidence is already extremely fragile and income streams are highly uncertain. Second, credit markets remain tight, although concerted efforts by the US Treasury and its European counterparts to inject fresh capital into the banking system have helped to avert a global financial meltdown. Until toxic assets in the banking sector are purged from the system and clearer signs of recovery in the housing market emerge, financial institutions are likely to remain risk averse. The era of cheap and easy money has ended, and access to credit by households and corporates will be more constrained going forward. Third, the negative feedback loop between the financial sector and other sectors of the economy is likely to lead to further weakness in the labour market. The associated cutbacks in employment and wages will, in turn, depress private sector spending.
Table 3.1 Forecasts of GDP Growth
(%)
Apr 2008 Oct 2008
2008F 2009F 2008F 2009F
Total* 3.9 4.2 3.7 2.9 Industrial Countries* 1.5 1.9 1.2 0.3 US 1.3 2.1 1.4 0.0 Eurozone 1.5 1.7 1.2 0.5
Japan 1.3 1.7 0.7 0.5 NIE‐3* 4.5 4.8 4.0 3.4 Hong Kong 4.7 4.9 4.0 3.1 Korea 4.5 4.8 4.3 3.8 Taiwan 4.1 4.6 3.9 3.6
ASEAN‐4* 5.5 5.6 5.4 4.7 Indonesia 5.9 5.9 5.9 5.3 Malaysia 5.5 5.6 5.5 4.5 Thailand 4.7 5.0 4.8 4.2 Philippines 5.3 5.4 4.5 4.5 China 9.9 9.3 9.8 8.8 India (FY) 7.7 8.2 7.3 7.2
Source: Consensus Economics Inc. * Weighted by shares in Singapore’s non‐oil domestic exports.
1 The Morgan Stanley Capital International All Country World Index (MSCI ACWI) is a free float‐adjusted market
capitalisation weighted index designed to measure the equity market performance of developed and emerging markets. The figure cited here measures only price performance in local currency terms.

Outlook 47
Monetary Authority of Singapore Economic Policy Department
Shocks from the financial turmoil will impinge on G3 growth.
The propagation of shocks from the financial sector to the rest of the economy has been more discernable in the G3 economies, where growth has slowed considerably. Growth projections for the G3 economies have been sharply downgraded since April this year, in line with the downturn in the OECD Leading Indicators. (Table 3.1 and Chart 3.1) In the US, house prices continued to fall by 1.4% q‐o‐q in Q2 2008, dragged down by rising foreclosures and housing inventories. (Chart 3.2) The housing downturn and difficult credit conditions will be mutually reinforcing, resulting in adverse spillovers on the rest of the economy, while weaker conditions in the labour market will further depress the economy. Non‐farm payrolls declined by 159,000 in September and a cumulative 760,000 since the start of this year, pushing up the unemployment rate from 4.9% in January to 6.1% in September. (Chart 3.3) Accordingly, growth in private consumption is expected to slow sharply. Exports, a key support to growth in H1 2008, are unlikely to be sustained, as spending in other parts of the world weaken going forward. Analysts have downgraded the growth forecast for 2009 from 2.1% in April to 0% in October. In the Eurozone, financial difficulties have caused banks to become more risk averse, leading to sharply tighter credit conditions. Despite government injections of capital and liquidity into the banking system, the three‐month interbank rate remains near its recent peak. Moreover, slowing exports and the ongoing downturn in the real estate and construction sectors in a number of economies pose significant downside risks to growth. Forward‐looking indicators, such as the business and consumer sentiment and Purchasing Managers’ indices, have fallen to multi‐year lows. The consensus growth forecast for 2009 has been shaved from 1.7% in April to 0.5% in October. The near‐term growth outlook for Japan also leans on the downside. Prospects for consumer spending are weak, amidst record‐low consumer sentiment and a rise in the unemployment rate from 3.8% in January this year to 4.2% in August. At the same time, sluggish external conditions will reduce exports.
Chart 3.1
OECD Leading Indicators
2003 2004 2005 2006 2007 2008-10
-5
0
5
10
15
Ann
ualis
ed 6
-mth
Rat
e of
Cha
nge,
%
Japan
US
Eurozone
Aug Source: Datastream
Chart 3.2 US House Prices
2005 2006 2007 2008 Q2-2
-1
0
1
2
3
4
QO
Q %
Gro
wth
Source: Office of Federal Housing Enterprise Oversight
Chart 3.3 Changes in US Non‐farm Payrolls
2005 2006 2007 2008 Sep-200
-100
0
100
200
300
400
Thou
sand
Per
sons
Source: Bureau of Labour Statistics

48 Macroeconomic Review, October 2008
Monetary Authority of Singapore Economic Policy Department
Given flagging household spending and global demand, firms are unlikely to build capacity in the near term, especially as profits have fallen for four consecutive quarters. The latest Tankan business conditions diffusion index dropped to its lowest level since Q4 2003 and is forecast to fall further in Q4 2008, suggesting that investors remain cautious about the near‐term economic outlook. (Chart 3.4)
Growth in Asia ex‐Japan is set to weaken alongside waning G3 growth.
In EPD’s assessment, Asia’s initial insulation arising from the weak synchronicity of its business cycle with that of the developed economies is likely to wane in the coming months. As argued in the October 2007 issue of the Review, weak synchronicity is partly conditional upon the nature and magnitude of the G3 slowdown. Given that the G3 economies are experiencing a sharper and more broad‐based downturn than previously anticipated, Asia will not escape unscathed. The October 2007 Review found that for every 1% decline in US personal consumption expenditures (PCE), Asia’s exports would fall by 2.2%. As the expansionary effects of the fiscal rebates on US PCE fade from H2 2008 onwards, the resultant scale‐back or even outright contraction of US consumer spending will impact Asia’s exports heavily over the next year. In the April 2008 issue of the Review, EPD highlighted that slower G3 demand could be partially mitigated in the short term by strong regional demand, especially from China. However, recent data shows a fall‐off in the growth of China’s imports from Asia since May. (Chart 3.5) While this could be partly due to enforced factory shutdowns in China in the run‐up to the Beijing Olympics in August, there are some initial signs that the Chinese economy is slowing. For instance, growth in China’s industrial and capital goods imports has slowed, even in the earlier months of 2008. (Chart 3.6) This could signal weaker export growth for the rest of Asia going forward. In addition, while Asian commodity exporters enjoyed a favourable terms of trade shock in H1 2008, commodity prices have weakened and are forecast to decline into 2009. (Chart 3.7) The region’s exports of commodities are likely to slow concomitantly.
Chart 3.4 Japan Tankan Survey of Business Conditions
2004 2005 2006 2007 2008-30
-20
-10
0
10
20
30
Diff
usio
n In
dex
Large Enterprises
All Enterprises
Medium Enterprises
Small Enterprises
Q4F Source: Bank of Japan
Chart 3.5 China’s Imports from Asia
Jan Mar May Jul Sep0
5
10
15
20
25
30
YOY
% G
row
th (i
n U
S$) 2006
2008
2007
Source: CEIC Note: Asia refers to Hong Kong, Indonesia, Malaysia, the Philippines, Singapore, South Korea, Taiwan and Thailand.
Chart 3.6 Volume of China’s Imports of
Intermediate and Capital Goods
2007 2008 Jan-May 2008 Jun-Aug 0
5
10
15
20
25
YOY
% G
row
th
Intermediate Goods Capital Goods
Source: CEIC
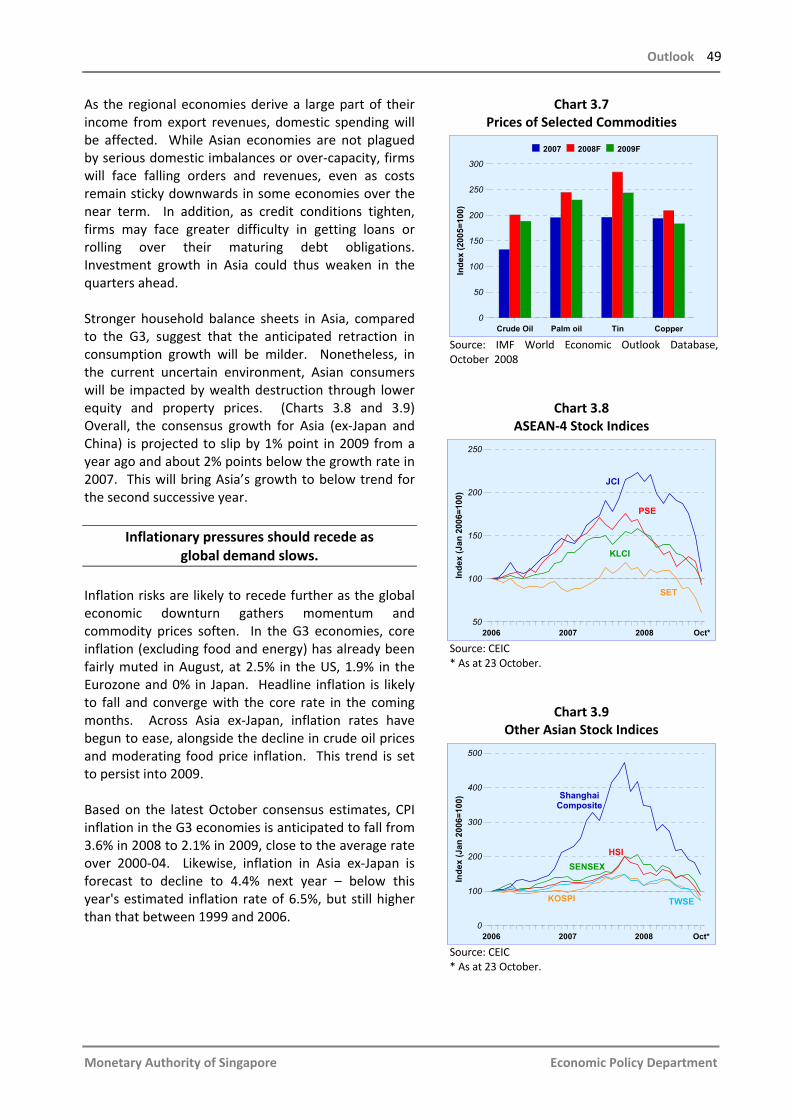
Outlook 49
Monetary Authority of Singapore Economic Policy Department
As the regional economies derive a large part of their income from export revenues, domestic spending will be affected. While Asian economies are not plagued by serious domestic imbalances or over‐capacity, firms will face falling orders and revenues, even as costs remain sticky downwards in some economies over the near term. In addition, as credit conditions tighten, firms may face greater difficulty in getting loans or rolling over their maturing debt obligations. Investment growth in Asia could thus weaken in the quarters ahead. Stronger household balance sheets in Asia, compared to the G3, suggest that the anticipated retraction in consumption growth will be milder. Nonetheless, in the current uncertain environment, Asian consumers will be impacted by wealth destruction through lower equity and property prices. (Charts 3.8 and 3.9) Overall, the consensus growth for Asia (ex‐Japan and China) is projected to slip by 1% point in 2009 from a year ago and about 2% points below the growth rate in 2007. This will bring Asia’s growth to below trend for the second successive year.
Inflationary pressures should recede as global demand slows.
Inflation risks are likely to recede further as the global economic downturn gathers momentum and commodity prices soften. In the G3 economies, core inflation (excluding food and energy) has already been fairly muted in August, at 2.5% in the US, 1.9% in the Eurozone and 0% in Japan. Headline inflation is likely to fall and converge with the core rate in the coming months. Across Asia ex‐Japan, inflation rates have begun to ease, alongside the decline in crude oil prices and moderating food price inflation. This trend is set to persist into 2009. Based on the latest October consensus estimates, CPI inflation in the G3 economies is anticipated to fall from 3.6% in 2008 to 2.1% in 2009, close to the average rate over 2000‐04. Likewise, inflation in Asia ex‐Japan is forecast to decline to 4.4% next year – below this year's estimated inflation rate of 6.5%, but still higher than that between 1999 and 2006.
Chart 3.7 Prices of Selected Commodities
Crude Oil Palm oil Tin Copper0
50
100
150
200
250
300
Inde
x (2
005=
100)
2007 2008F 2009F
Source: IMF World Economic Outlook Database, October 2008
Chart 3.8 ASEAN‐4 Stock Indices
2006 2007 2008 Oct*50
100
150
200
250In
dex
(Jan
200
6=10
0)
PSE
JCI
KLCI
SET
Source: CEIC * As at 23 October.
Chart 3.9 Other Asian Stock Indices
2006 2007 2008 Oct*0
100
200
300
400
500
Inde
x (J
an 2
006=
100)
HSI
Shanghai Composite
SENSEX
KOSPI TWSE
Source: CEIC * As at 23 October.

50 Macroeconomic Review, October 2008
Monetary Authority of Singapore Economic Policy Department
3.2 Outlook for the Singapore Economy Global Headwinds Confront the Domestic Economy The Singapore economy has weakened over the course of this year, after four years of robust growth averaging 8% between 2004 and 2007. The repercussions from the collapse of the US subprime mortgage market continue to unfold and the outlook for the external environment has deteriorated significantly since the last Review. The recent spate of internationally‐coordinated government interventions has significantly reduced the chances of an outright collapse of the global financial system, but is unlikely to reverse the momentum of economic weakness that has taken hold in many industrialised countries. At this juncture, however, the extent of the retraction in economic activity is uncertain. Accordingly, EPD’s analysis of Singapore’s short‐term prospects focuses on identifying the channels through which the global financial and economic shocks will be transmitted to domestic economic activity.
The global financial crisis impacts domestic economic activity through three channels.
Unlike a typical external demand‐led slowdown, the propagation of a financial‐induced shock to the rest of the economy is more complex and involves additional impact points. A stylised characterisation of the dynamics of the current downturn is shown in Figure 3.1. There are three broad channels through which the global financial crisis, and the attendant squeeze in liquidity and credit, could impinge on domestic economy activity. First, the crisis has an immediate impact on the sentiment‐driven segments of the financial sector, such as wealth advisory and brokerage & treasury activities.
Second, as consumer sentiment weakens, this has a direct bearing on domestic‐oriented activities, such as retail trade and those related to the property market. Third, the repercussions on the external‐oriented sectors come indirectly through a widespread contraction in economic activity and a sharp pullback in spending in the external economies, including Asia. Given the open nature of the Singapore economy, a large proportion of industries, such as manufacturing, transport‐hub and tourism services, are quickly affected by the fall in external demand. Subsequently, as business conditions worsen, companies’ profit margins are squeezed, forcing them to curtail investment spending and cut back on employment and wages. The latter in turn further dampens consumer sentiment and consumption, thus exacerbating the contraction in domestic‐oriented activities. As a result, Singapore’s economic growth could see further slippage in the quarters ahead. Nevertheless, it will be cushioned somewhat by the strong cyclical starting point of the economy, flexible factor markets, a diversified and robust corporate base, and the ongoing build‐up of capacity in key segments of the economy. Taking all these factors into account, GDP growth is expected to be around 3% in 2008, and the economy will continue to grow below its potential rate into 2009. Prospects for a recovery in the latter half of next year are predicated on the performance of the G3 and regional economies.

Outlook 51
Monetary Authority of Singapore Economic Policy Department
Figure 3.1 Dynamics of the Current Downturn
Slowdown in
G3 Economies
Weaker Regional
Demand
Fall in
External Demand
Fall in
Re‐exports
Contraction in
Domestic Export Orders
Inventory Drawdown;
Cutback in Production
Squeeze in Business
Profit Margins
Wage Cuts,
Shorter Work Weeks,
Retrenchments
Cutback in
Investment Spending
Fall in Private
Disposable Income
Weakening in
Consumer Sentiment
Pullback in
Consumer Spending
Global Financial
Market Turmoil and
Credit Squeeze
Decline in
Household Wealth
Fall in Trade‐related
Services
Fall in Tourism‐related
Services
Pullback in
Sentiment‐driven
Financial Activities
IMMEDIATE
CHANNEL DIRECT
CHANNEL
Correction in
Asset Prices
Increase in
Precautionary Saving
Decline in
GDP Growth
INDIRECT
CHANNEL
Contraction in Domestic‐
oriented Activities
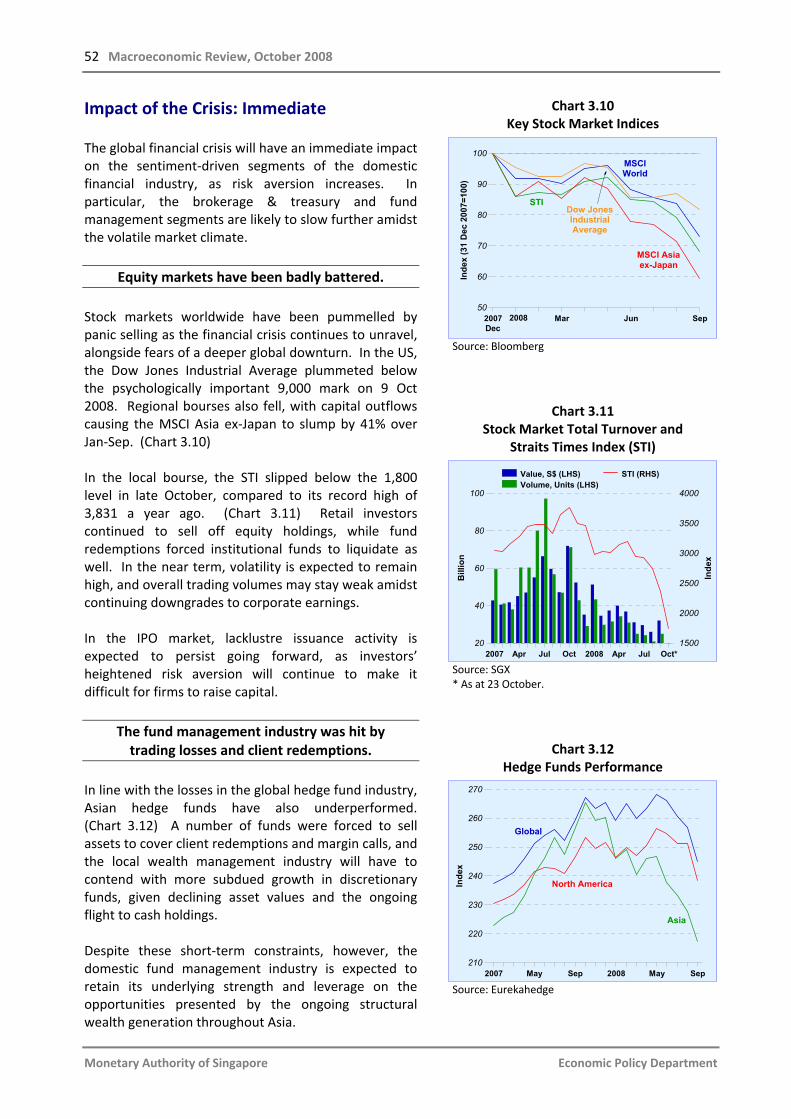
52 Macroeconomic Review, October 2008
Monetary Authority of Singapore Economic Policy Department
Impact of the Crisis: Immediate The global financial crisis will have an immediate impact on the sentiment‐driven segments of the domestic financial industry, as risk aversion increases. In particular, the brokerage & treasury and fund management segments are likely to slow further amidst the volatile market climate.
Equity markets have been badly battered. Stock markets worldwide have been pummelled by panic selling as the financial crisis continues to unravel, alongside fears of a deeper global downturn. In the US, the Dow Jones Industrial Average plummeted below the psychologically important 9,000 mark on 9 Oct 2008. Regional bourses also fell, with capital outflows causing the MSCI Asia ex‐Japan to slump by 41% over Jan‐Sep. (Chart 3.10) In the local bourse, the STI slipped below the 1,800 level in late October, compared to its record high of 3,831 a year ago. (Chart 3.11) Retail investors continued to sell off equity holdings, while fund redemptions forced institutional funds to liquidate as well. In the near term, volatility is expected to remain high, and overall trading volumes may stay weak amidst continuing downgrades to corporate earnings. In the IPO market, lacklustre issuance activity is expected to persist going forward, as investors’ heightened risk aversion will continue to make it difficult for firms to raise capital.
The fund management industry was hit by trading losses and client redemptions.
In line with the losses in the global hedge fund industry, Asian hedge funds have also underperformed. (Chart 3.12) A number of funds were forced to sell assets to cover client redemptions and margin calls, and the local wealth management industry will have to contend with more subdued growth in discretionary funds, given declining asset values and the ongoing flight to cash holdings. Despite these short‐term constraints, however, the domestic fund management industry is expected to retain its underlying strength and leverage on the opportunities presented by the ongoing structuralwealth generation throughout Asia.
Chart 3.10 Key Stock Market Indices
2007 Mar Jun Sep50
60
70
80
90
100
Inde
x (3
1 D
ec 2
007=
100)
MSCI Asia ex-Japan
MSCI World
STIDow Jones Industrial Average
Dec2008
Source: Bloomberg
Chart 3.11 Stock Market Total Turnover and
Straits Times Index (STI)
2007 Apr Jul Oct 2008 Apr Jul Oct*20
40
60
80
100
Bill
ion
1500
2000
2500
3000
3500
4000
Inde
x
Value, S$ (LHS)Volume, Units (LHS)
STI (RHS)
Source: SGX * As at 23 October.
Chart 3.12 Hedge Funds Performance
2007 May Sep 2008 May Sep210
220
230
240
250
260
270
Inde
x
North America
Global
Asia
Source: Eurekahedge
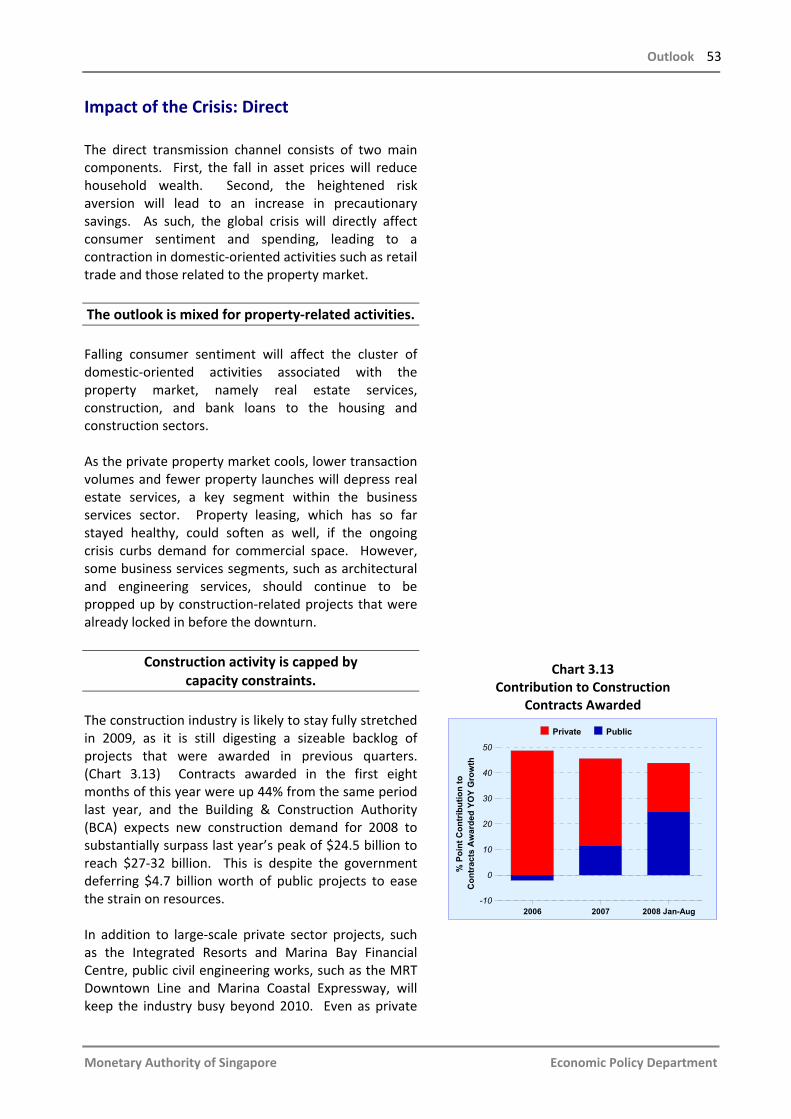
Outlook 53
Monetary Authority of Singapore Economic Policy Department
Impact of the Crisis: Direct The direct transmission channel consists of two main components. First, the fall in asset prices will reduce household wealth. Second, the heightened risk aversion will lead to an increase in precautionary savings. As such, the global crisis will directly affect consumer sentiment and spending, leading to a contraction in domestic‐oriented activities such as retail trade and those related to the property market. The outlook is mixed for property‐related activities. Falling consumer sentiment will affect the cluster of domestic‐oriented activities associated with the property market, namely real estate services, construction, and bank loans to the housing and construction sectors. As the private property market cools, lower transaction volumes and fewer property launches will depress real estate services, a key segment within the business services sector. Property leasing, which has so far stayed healthy, could soften as well, if the ongoing crisis curbs demand for commercial space. However, some business services segments, such as architectural and engineering services, should continue to be propped up by construction‐related projects that were already locked in before the downturn.
Construction activity is capped by capacity constraints.
The construction industry is likely to stay fully stretched in 2009, as it is still digesting a sizeable backlog of projects that were awarded in previous quarters. (Chart 3.13) Contracts awarded in the first eight months of this year were up 44% from the same period last year, and the Building & Construction Authority (BCA) expects new construction demand for 2008 to substantially surpass last year’s peak of $24.5 billion to reach $27‐32 billion. This is despite the government deferring $4.7 billion worth of public projects to ease the strain on resources. In addition to large‐scale private sector projects, such as the Integrated Resorts and Marina Bay Financial Centre, public civil engineering works, such as the MRT Downtown Line and Marina Coastal Expressway, will keep the industry busy beyond 2010. Even as private
Chart 3.13 Contribution to Construction
Contracts Awarded
2006 2007 2008 Jan-Aug-10
0
10
20
30
40
50
Con
trac
ts A
war
ded
YOY
Gro
wth
% P
oint
Con
trib
utio
n to
Private Public
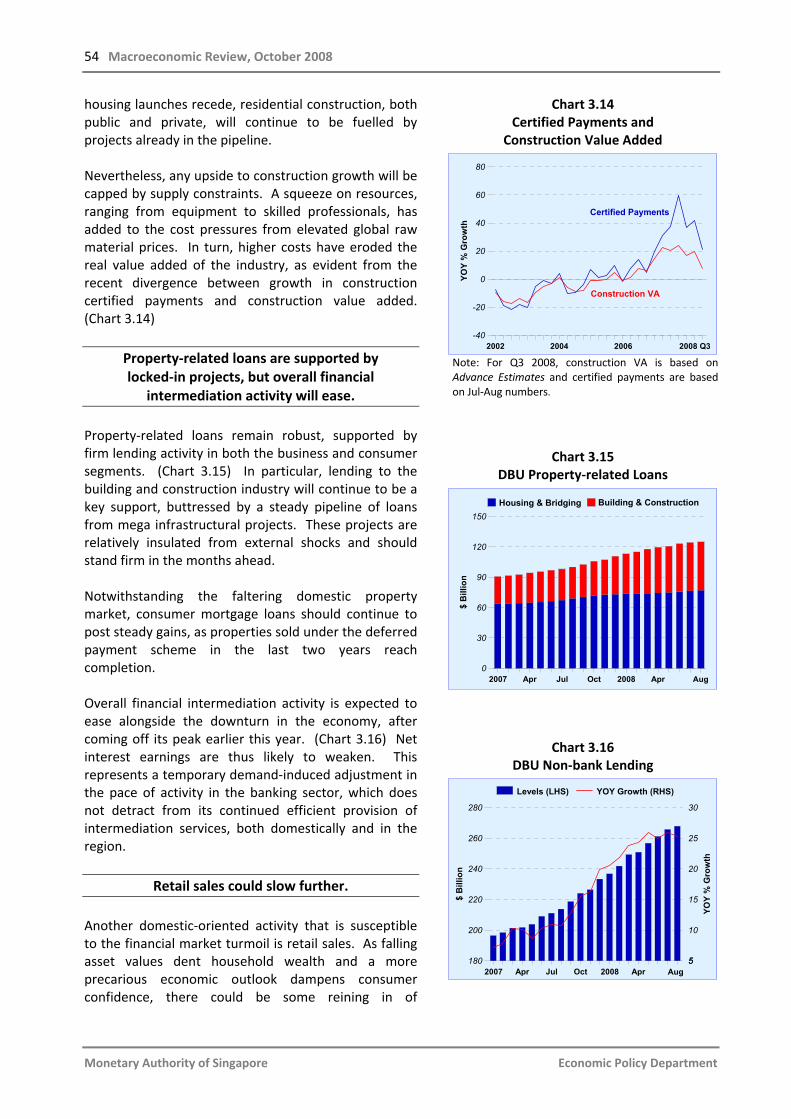
54 Macroeconomic Review, October 2008
Monetary Authority of Singapore Economic Policy Department
housing launches recede, residential construction, both public and private, will continue to be fuelled by projects already in the pipeline. Nevertheless, any upside to construction growth will be capped by supply constraints. A squeeze on resources, ranging from equipment to skilled professionals, has added to the cost pressures from elevated global raw material prices. In turn, higher costs have eroded the real value added of the industry, as evident from the recent divergence between growth in construction certified payments and construction value added. (Chart 3.14)
Property‐related loans are supported by locked‐in projects, but overall financial
intermediation activity will ease. Property‐related loans remain robust, supported by firm lending activity in both the business and consumer segments. (Chart 3.15) In particular, lending to the building and construction industry will continue to be a key support, buttressed by a steady pipeline of loans from mega infrastructural projects. These projects are relatively insulated from external shocks and should stand firm in the months ahead. Notwithstanding the faltering domestic property market, consumer mortgage loans should continue to post steady gains, as properties sold under the deferred payment scheme in the last two years reach completion. Overall financial intermediation activity is expected to ease alongside the downturn in the economy, after coming off its peak earlier this year. (Chart 3.16) Net interest earnings are thus likely to weaken. This represents a temporary demand‐induced adjustment in the pace of activity in the banking sector, which does not detract from its continued efficient provision of intermediation services, both domestically and in the region.
Retail sales could slow further. Another domestic‐oriented activity that is susceptible to the financial market turmoil is retail sales. As falling asset values dent household wealth and a more precarious economic outlook dampens consumer confidence, there could be some reining in of
Chart 3.14 Certified Payments and
Construction Value Added
2002 2004 2006 2008 Q3-40
-20
0
20
40
60
80
YOY
% G
row
th
Certified Payments
Construction VA
Note: For Q3 2008, construction VA is based on Advance Estimates and certified payments are based on Jul‐Aug numbers.
Chart 3.15 DBU Property‐related Loans
2007 Apr Jul Oct 2008 Apr0
30
60
90
120
150
$ B
illio
n
Housing & Bridging Building & Construction
Aug
Chart 3.16 DBU Non‐bank Lending
2007 Apr Jul Oct 2008 Apr180
200
220
240
260
280
$ B
illio
n
5
10
15
20
25
30
5
YOY
% G
row
th
Levels (LHS) YOY Growth (RHS)
Aug

Outlook 55
Monetary Authority of Singapore Economic Policy Department
discretionary spending. Thus, retailers and restaurants could see slower business during the year‐end season and into 2009. Retail volumes, which have been sliding on a sequential basis for three consecutive months since May, edged up slightly in August but could weaken further, especially if tourist traffic continues to slow.
Impact of the Crisis: Indirect As the global financial crisis evolves into a worldwide economic slowdown, the Singapore economy will be affected by the fall in external demand, given its openness to the global economy and dependence on trade. In particular, the external‐oriented industries, such as manufacturing, transport‐hub and tourism‐related services, will be hit. Diversification in manufacturing will provide some
cushion against the downturn. Since the 2001 dotcom bust, the manufacturing sector has diversified beyond its dependence on IT exports. As shown in Chart 3.17, the share of electronics has fallen from 44% of overall manufacturing value added in 2000 to 30% in 2007. In comparison, the share of the biomedical sector has risen from 10% to 24%, on the back of expansion in the pharmaceutical industry. The domestic pharmaceutical industry largely operates in accordance with its own supply‐side dynamics, where output is driven by structural factors, such as drug efficacy issues, generic competition and US regulatory approval for new drugs. Despite the deterioration in external demand, domestic pharmaceutical production is likely to bounce back modestly in 2009, with new capacity from the Abbott nutritional plant and Novartis tabletting facility providing a fillip.
Domestic IT has fallen temporarily out of sync with the global tech cycle.
While Singapore’s electronics production has closely followed the global IT cycle (as proxied by global chip sales), a series of company‐specific shocks has temporarily dislodged the sector’s linkage with the global electronics industry.
Chart 3.17
Share of Manufacturing Value Added
2000 2001 2002 2003 2004 2005 2006 20070
10
20
30
40
50
% S
hare
of M
fg V
alue
Add
ed
Electronics Biomedical

56 Macroeconomic Review, October 2008
Monetary Authority of Singapore Economic Policy Department
Specifically, the domestic IT landscape has been punctuated by company‐specific events, especially the winding down of Maxtor’s hard disk drive plant and Motorola’s handset plant in Singapore. As seen from Chart 3.18, the closure of Maxtor’s disk drive operations arising from its acquisition by Seagate was evident from the drag in the domestic data storage segment in 2006. Global market share losses by Motorola and the ultimate rationalisation of its handset plant in Singapore also led to sharp contractions in the infocomms & consumer electronics segment since 2006, and particularly in 2008 as the plant wound down operations completely. Nonetheless, while global and domestic tech cycles have temporarily fallen out of sync, the domestic electronics industry would not be shielded against a demand‐led global IT slowdown. A fall‐off in end demand will ultimately permeate all aspects of the IT value chain, and weigh on the domestic IT sector. A global IT slowdown looms on weak end demand … The global IT outlook has weakened in line with the macroeconomic climate. On the corporate front, tighter credit conditions arising from the Wall Street meltdown will see companies rein in IT budgets and defer spending on technology upgrades, while consolidation among financial firms could further reduce IT demand. A report by Forrester, a US research company, in September found that 43% of companies (or 49% of financial services companies) in the US and Western Europe had already cut their overall IT budgets, which include hardware, software and IT services. Although the financial sector makes up only about a fifth of global IT spending, it is usually the main driver of overall tech spending growth. (Chart 3.19) On the consumer front, Wall Street woes and the high cost of energy have started to slow user demand for electronics goods. As shown in Chart 3.20, US electronics retail sales generally follow disposable personal income, net of consumer spending on fuel. While the US fiscal stimulus disbursed over Apr‐Jul gave a temporary boost to disposable incomes, and consequently to electronics retail sales, high pump prices – gasoline prices peaked in June and remained elevated throughout September – have squeezed spending on IT. Looking ahead, the year‐end holiday season, which retailers rely on for the bulk of IT sales, is likely to be lacklustre.
Chart 3.18 Contribution to Electronics Output Growth
2000 2003 2006-40
-20
0
20
40
Out
put Y
OY
Gro
wth
% P
oint
Con
trib
utio
n to
Ele
ctro
nics
-40
-20
0
20
40
YOY
% G
row
th
SemiconductorComputer PeripheralsInfocomms & ConsumerElectronics
Data StorageOther ElectronicsGlobal Chip Sales (RHS)
2008 Jan-Sep*
Source: Semiconductor Industry Association for global chip sales * Jan‐Aug for global chip sales.
Chart 3.19
Drivers of Global IT Spending Growth, 2006‐08E
Agri, Mining & ConstEducationWholesale TradeTransportationHealthcareProcess MfgUtilitiesRetail TradeLocal & Regional GovServicesDiscrete MfgNational and Int'l GovCommunicationsFinancial Services
0 5 10 15 20 25Per Cent
Source: Gartner and Deutsche Bank
Chart 3.20 US Electronics Retail Sales and Disposable Personal Income
2008 Feb Mar Apr May Jun Jul Aug98
100
102
104
106
108
Inde
x (J
an 2
008=
100)
, SA Disposable Personal
Income (less Fuel Expenditure)
Electronics Retail Sales
Source: CEIC

Outlook 57
Monetary Authority of Singapore Economic Policy Department
… despite some support from emerging markets. Although weak demand lies at the heart of the current IT slowdown, overcapacity in the memory chip market could undermine the tech industry from the supply side. Nevertheless, overall supply‐side conditions are healthier compared to the 2001 tech downturn. Excess semiconductor inventories are currently at half the level reached during 2001, as semiconductor inventories remain generally benign outside of the memory segment. (Chart 3.21) The current slowdown is unlikely to be of the same magnitude as the 2001 tech downturn, as the global IT industry has a crucial safety net – emerging market demand – to fall back on. Indeed, emerging market demand has propped up growth in key end markets, and this support has grown significantly since the dotcom bust. In the PC market, which accounts for some 40% of overall semiconductor consumption, the share of emerging market (Asia ex‐Japan and rest of world) demand in overall unit shipments has grown from 30% in 2000 to 48% in 2007. (Chart 3.22) This share is expected to increase in the years ahead, particularly as the PC penetration rate in China remains low at 9%, compared to 82% for the US in 2007, according to Gartner. However, emerging markets remain vulnerable to macroeconomic headwinds, and the near‐term IT outlook is clouded with uncertainty. A sustained fall‐off in end demand will have knock‐on effects throughout the entire technology supply chain, thus pushing out an eventual recovery. A broader recovery across the technology sector, and in turn the domestic electronics industry, will not come until demand shows clear signs of firming. This may not be before the second half of 2009, according to industry analysts.
Singapore’s domestic exports are tied to final demand in the G3.
The slippage in external demand has already affected Singapore’s NODX, which declined further by 8.5% y‐o‐y in Q3 this year, although high oil prices have continued to support oil exports. Compared with the region, Singapore’s higher value added NODX are tied more directly to the G3 markets and are thus relatively less leveraged on emerging market demand. While China has grown to be an important trading partner for Singapore, its recent contribution to Singapore’s total export growth has been relatively small. (Chart 3.23)
Chart 3.21 Excess Semiconductor Inventories
2001 2002 2003 2004 2005 2006 2007 2008-2
0
2
4
6
8
10
12
14
US$
Bill
ion
Q2
Source: iSuppli
Chart 3.22 PC Unit Shipments
2000 2001 2002 2003 2004 2005 2006 20070
50
100
150
200
250
300M
illio
n U
nits
G3 Asia ex-Japan ROW
Source: IDC
Chart 3.23 Regional Export Growth, Jan‐Aug 2008
Idn Msia Sgp Thai Korea Taiwan HK0
5
10
15
20
25
30
35
% P
oint
Con
trib
utio
n to
Gro
wth
G3 China ROW
Source: CEIC and IE Singapore Note: Singapore data refers to domestic exports. Malaysia’s data is to July, while Indonesia’s is to June.

58 Macroeconomic Review, October 2008
Monetary Authority of Singapore Economic Policy Department
This could be due in part to the nature of Singapore’s exports to China. Singapore exports primarily intermediate goods to China, which are used for production and subsequent export, and hence do not feed directly into China’s domestic market. As seen in Chart 3.24, China’s imports for processing, i.e. intermediate imports used to produce goods for export, have levelled off since the latter half of 2007, while its exports produced using local inputs have increased. Conversely, China is a relatively more important export destination for the rest of the region, as they export more primary commodities and consumer goods, such as LCD TVs, which plug directly into China’s domestic market. Notwithstanding the cyclical sensitivity of Singapore’s higher value added exports to the G3‐led slowdown in the near term, the continuous rise in the quality of its exports places the Singapore economy on a stronger footing in the medium term to confront the challenge from lower‐cost producers in the region, notably China. This assessment is confirmed in EPD’s study on the evolving profiles of regional exports over the last five years, as set out in Box D at the end of this section.
Support from China for Singapore’s entrepôt trade has also waned.
Similarly, Singapore’s NORX growth slipped in Q3 2008 to 3.8%, from 7.3% in Q2, alongside weaker external demand conditions. In particular, the share of NORX to China has tapered off since reaching a peak in 2007. (Chart 3.25) China’s contribution to Singapore’s re‐exports growth has also diminished alongside China’s increased capability to source electronics inputs domestically. Electronics re‐exports comprised 75% of Singapore’s total NORX to China in 2007. The trade‐related transport services will be weighed
down by weak end demand and high oil prices. In the trade‐related transport sector, a more challenging macroeconomic backdrop will cap the growth of air cargo volumes. As airfreight is driven by higher value and time‐reliant goods, such as electronics, it is sensitive to stresses in end demand and the global IT cycle. The slippage in end demand is exacerbated by high fuel prices, which will compress profit margins further. While bunker fuel makes up about 20% of overall costs for shipping companies, jet
Chart 3.24 China’s Imports and Exports
2007 May Sep 2008 May Sep60
80
100
120
140
160
180
100
Inde
x (J
an 2
007=
100)
Exports Produced with Local Inputs
Imports for Processing
Imports for Domestic Demand
Source: CEIC
Chart 3.25 NORX to China
2003 2004 2005 2006 2007 2008
0
3
6
9
12
15
0
% S
hare
of N
on-o
il R
e-ex
port
s
-15
0
15
30
45
60
YOY
% G
row
th
Share (LHS) YOY Growth (RHS)
Jan-Sep

Outlook 59
Monetary Authority of Singapore Economic Policy Department
fuel comprises the bulk (40%) of costs for airlines. Notably, airline fuel surcharges have risen rapidly since May this year. (Chart 3.26) Although fuel prices have fallen from their mid‐July peaks, they remain elevated and will continue to pose significant challenges to airlines. Similarly, sea cargo volumes are forecast to soften into next year. As utilisation rates on container liners slip, some signs of price competition have emerged with liners cutting rates to shore up market shares, which will further undermine industry profitability. Dry bulk shipping is also vulnerable to softening emerging market demand for commodities and the credit squeeze. Indeed, the benchmark Baltic Dry Index, which captures the price of chartering capesize carriers – bulk ships that carry raw materials and commodities such as coal, cement, iron ore, steel and grain – has dived to a two‐year low from a record high in May 2008. (Chart 3.27)
Tourism‐related services are set to slow. The outlook for tourism‐related services, including hotels, restaurants, and air travel, is also uncertain in the near term. Visitor arrivals to Singapore fell for the third straight month in August 2008 by 7.7% y‐o‐y, the steepest fall since 2003. In particular, visitor numbers from Singapore’s two largest markets, Indonesia and China, shrank by double digits in August. One of the reasons for the recent weakness was the escalation in average hotel room rates, which went up by 26% y‐o‐y in the first eight months this year. A softening of economic activity in key regional markets in the period ahead could further reduce tourist arrivals and the demand for corporate travel.
Chart 3.26 FedEx Fuel Surcharge Rates
2008 Feb Mar Apr May Jun Jul Aug14
16
18
20
22
24
26
Per C
ent
Source: FedEx
Chart 3.27 Baltic Exchange Dry Index
2006 Jul 2007 Jul 2008 Jul0
2000
4000
6000
8000
10000
12000
14000In
dex
(198
5=10
00)
Oct*
Source: Bloomberg *As at 23 October.

60 Macroeconomic Review, October 2008
Monetary Authority of Singapore Economic Policy Department
Box D Market Share Analysis of Regional Manufacturing Exports
Introduction The East Asian economies1/ have experienced relatively strong export growth over the last five years, with the region as a whole registering average growth of 22% over 2003‐07. (Chart D1) However, there are differences in the relative export performance of individual economies, which are less easily discerned from the broad figures. This box takes a closer look at the export structures of seven East Asian economies and identifies the trends in export performance of key products across these markets.
Chart D1 Regional Exports
2001 2002 2003 2004 2005 2006 20070
500
1000
1500
2000
2500
0
US$
Bill
ion
-10
0
10
20
30
40
-10
Per C
ent
Regional Exports (LHS) YOY Growth (RHS)
Source: CEIC
Analytical Framework To map out the export composition of each economy over a five‐year period from 2003 to 2007, a dynamic market share analysis was used, adapted from Escolano (2008). This framework captures two elements of export competitiveness, as shown in Figure D1. First, it measures how fast each export segment is growing relative to overall world export growth. This is plotted along the vertical axis, where values above zero indicate segments growing faster than the world average and vice versa. Second, the market share gains each economy has made within a given trade segment are captured along the horizontal axis, where values above zero indicate growing market share and vice versa. The upper right quadrant, shaded yellow in Figure D1, thus represents fast‐growing export segments that have gained market share. Countries whose exports are clustered in this quadrant can be said to have a more dynamic export structure.
Figure D1 Market Share Analysis
Growth of segmen
t com
pared
to world export g
rowth
Falling market share Fast growth segment
Growing market share Fast growth segment
Falling market share Slow growth segment
Growing market share Slow growth segment
0 Growth of segment’s global market share
1/ East Asia refers to China, Indonesia, Malaysia, Singapore, South Korea, Taiwan and Thailand.
0
Outlook 61
Monetary Authority of Singapore Economic Policy Department
Regional Export Profiles Chart D2 illustrates the market share dynamics of regional exports across a comprehensive range of export categories, classified by one‐digit SITC codes.2/ The size of each bubble corresponds to the segment’s share of total exports in the respective economy. Accordingly, trade baskets across the region were largely dominated by electronics and manufactured goods, such as textiles and furniture. Oil exports made up a sizeable share of the export baskets in Singapore and Indonesia, while Singapore was relatively more tapped into the chemicals segment, reflecting the steady expansion of its pharmaceuticals and petrochemicals industries over the last five years. The machinery and transport equipment segment (excluding electronics) had a large weight in the export baskets of both Korea and Thailand, due to strong growth in their automobile industries, and robust shipbuilding activity in the former. China’s export performance outstripped the region with world market share gains for every segment between 2003 and 2007, especially in electronics and manufactured goods. The Chinese electronics segment made the greatest headway, compared with flat or negative market share shifts for the rest of the region. Nevertheless, the rest of the region recorded market share gains in other fast‐growing products (clustered in the upper right quadrant), indicating a fairly dynamic export structure on the whole. A Closer Look at the Electronics Industry The sizeable share of electronics in the region’s exports warrants a deeper analysis of that segment’s dynamics.3/ Broadly, IT exports can be grouped into four key product categories, namely semiconductors, electrical circuits, office & data processing (including PCs, printers and hard disk drives) and telecommunications apparatus (including handsets and flat‐screen TVs).4/ As shown in Chart D3, the NIEs – Singapore, Korea and Taiwan – share a similar export profile. Specifically, the semiconductor segment led market share gains for these economies, while the office & data processing segment lost the most market share over the same period. The export baskets of the NIEs were also weighted more heavily in intermediate components such as semiconductors and printed circuit boards. In addition, office & data processing and telecommunications exports formed a sizeable share of Singapore and Korean exports, respectively, reflecting the exports of hard disk drives and printers in the former, and the global presence of Korean firms, Samsung and LG, in the latter. In comparison, the office & data processing segment led market share gains in China, Thailand and Malaysia, due in part to the relocation of production activity – primarily in PCs and hard disk drives – away from the NIEs to these economies. For China, final products from the office & data processing and telecommunications segments featured prominently in its export configuration. This matches its relatively low‐cost environment, which has spurred the expansion of assembly operations in end products, for subsequent distribution worldwide.
2/ Ten segments covering SITC codes 0‐9 were analysed. SITC 0, 1, 2 and 4 correspond to primary commodities, SITC 3 to oil, SITC 5 to chemicals (including pharmaceuticals), SITC 6 and 8 to manufactured goods, SITC 7 to machinery & transport equipment (MTE, including electronics), and SITC 9 to “others”.
3/ Electronics exports comprised 30% of the region’s total exports in 2007. 4/ SITC 776 corresponds to semiconductors, SITC 772 to printed circuits, SITC 75 to office & data processing, and SITC 76 to telecommunications apparatus.
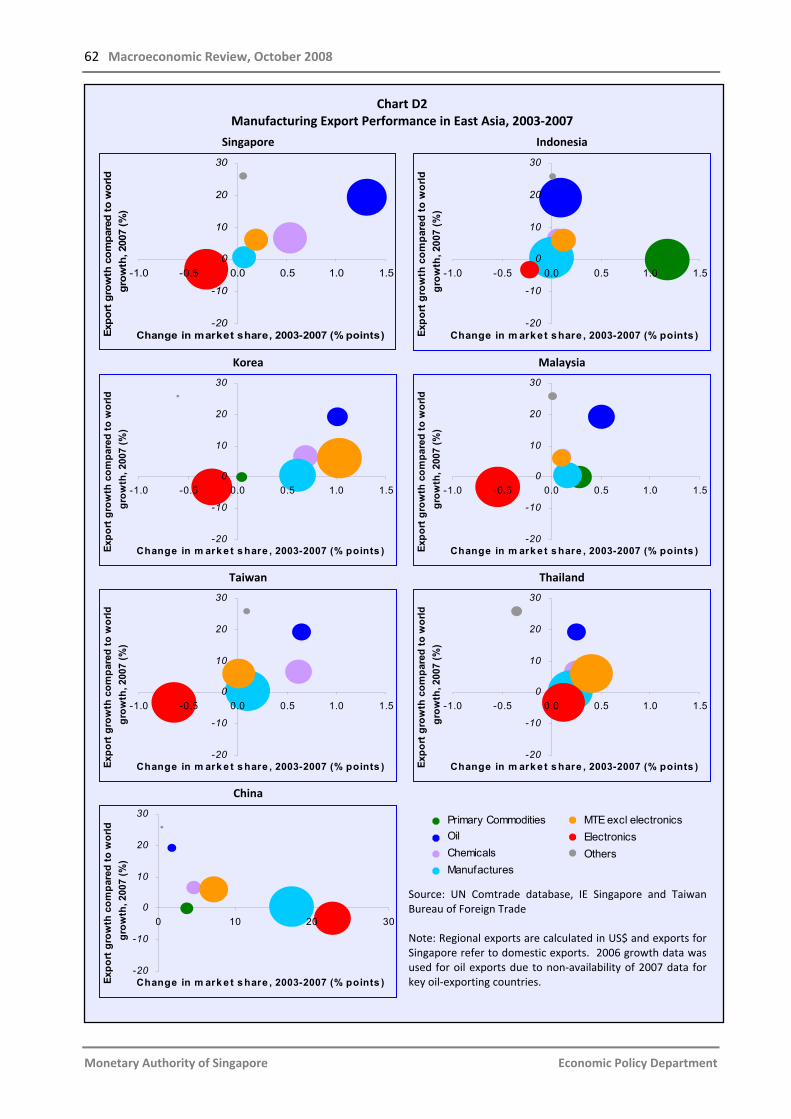
62 Macroeconomic Review, October 2008
Monetary Authority of Singapore Economic Policy Department
Chart D2 Manufacturing Export Performance in East Asia, 2003‐2007
Singapore
-20
-10
0
10
20
30
-1.0 -0.5 0.0 0.5 1.0 1.5
Change in market share, 2003-2007 (% points)Expo
rt g
row
th c
ompa
red
to w
orld
gr
owth
, 200
7 (%
)
Indonesia
-20
-10
0
10
20
30
-1.0 -0.5 0.0 0.5 1.0 1.5
Change in m arket share , 2003-2007 (% points )Expo
rt g
row
th c
ompa
red
to w
orld
gr
owth
, 200
7 (%
)
Korea
-20
-10
0
10
20
30
-1.0 -0.5 0.0 0.5 1.0 1.5
Change in m ark e t s hare , 2003-2007 (% points )Expo
rt g
row
th c
ompa
red
to w
orld
gr
owth
, 200
7 (%
)
Malaysia
-20
-10
0
10
20
30
-1.0 -0.5 0.0 0.5 1.0 1.5
Change in m ark e t s hare , 2003-2007 (% points )Expo
rt g
row
th c
ompa
red
to w
orld
gr
owth
, 200
7 (%
)
Taiwan
-20
-10
0
10
20
30
-1.0 -0.5 0.0 0.5 1.0 1.5
Change in m ark e t s hare , 2003-2007 (% points )Expo
rt g
row
th c
ompa
red
to w
orld
gr
owth
, 200
7 (%
)
Thailand
-20
-10
0
10
20
30
-1.0 -0.5 0.0 0.5 1.0 1.5
Change in m ark e t s hare , 2003-2007 (% points )Expo
rt g
row
th c
ompa
red
to w
orld
gr
owth
, 200
7 (%
)
China
-20
-10
0
10
20
30
0 10 20 30
Change in m ark e t s hare , 2003-2007 (% points )Expo
rt g
row
th c
ompa
red
to w
orld
gr
owth
, 200
7 (%
)
Primary CommoditiesOilChemicalsManufactures
MTE excl electronicsElectronicsOthers
Source: UN Comtrade database, IE Singapore and Taiwan Bureau of Foreign Trade Note: Regional exports are calculated in US$ and exports for Singapore refer to domestic exports. 2006 growth data was used for oil exports due to non‐availability of 2007 data for key oil‐exporting countries.

Outlook 63
Monetary Authority of Singapore Economic Policy Department
Chart D3 Electronics Export Performance in East Asia, 2003‐2007
Singapore
-10
-5
0
5
10
-4 -2 0 2 4
Change in m arket share , 2003-2007 (% points )Gro
wth
of s
ecto
r com
pare
d to
wor
ld
expo
rt g
row
th (%
pt,
2007
)
Indonesia
-10
-5
0
5
10
-4 -2 0 2 4
Change in m arket share , 2003-2007 (% points )Gro
wth
of s
ecto
r com
pare
d to
wor
ld
expo
rt g
row
th (%
pt,
2007
)
Korea
-10
-5
0
5
10
-4 -2 0 2 4
Change in m ark e t s hare , 2003-2007 (% points )Gro
wth
of s
ecto
r com
pare
d to
wor
ld
expo
rt g
row
th (%
pt,
2007
)
Malaysia
-10
-5
0
5
10
-4 -2 0 2 4
Change in m ark e t s hare , 2003-2007 (% points )Gro
wth
of s
ecto
r com
pare
d to
wor
ld
expo
rt g
row
th (%
pt,
2007
)
Taiwan
-10
-5
0
5
10
-4 -2 0 2 4
Change in m ark e t s hare , 2003-2007 (% points )Gro
wth
of s
ecto
r com
pare
d to
wor
ld
expo
rt g
row
th (%
pt,
2007
)
4
Thailand
-10
-5
0
5
10
-4 -2 0 2 4
Change in m ark e t s hare , 2003-2007 (% points )Gro
wth
of s
ecto
r com
pare
d to
wor
ld
expo
rt g
row
th (%
pt,
2007
)
China
-10
-5
0
5
10
0 10 20 30
Change in m arket share , 2003-2007 (% points )Gro
wth
of s
ecto
r com
pare
d to
wor
ld
expo
rt g
row
th (%
pt,
2007
)
Office and data Telecom apparatusPrinted circuitsSemiconductors
Source: UN Comtrade database, IE Singapore and Taiwan Bureau of Foreign Trade Note: Regional exports are calculated in US$ and exports for Singapore refer to domestic exports. The bubble size represents the share in each country’s 2007 electronic exports.

64 Macroeconomic Review, October 2008
Monetary Authority of Singapore Economic Policy Department
The above analysis does not take into account the quality of products exported by each country, which can be proxied by a cross‐country comparison of the unit values of similar exports. Quality differences are particularly marked in the semiconductor segment, one of the key pillars of regional IT exports. Chart D4 shows the unit values for semiconductor exports from the region to the US market in 2003 and 2007.
Chart D4 Unit Value of Semiconductor Exports to the US
2003 20070
1
2
3
4
0
US$
Taiwan
Singapore
Korea
Malaysia
Indonesia
China
Thailand
Source: US Department of Commerce and the US International Trade Commission
From the chart, it can be seen that the NIEs produce higher quality semiconductors compared with the rest of the region. This quality gap, moreover, has widened with time. Thus while China has emerged as a strong competitor in the regional IT industry in terms of market share, it still mostly produces electronics at the lower end of the value added spectrum, leaving scope for growth in niche market segments for its competitors. Sum‐up The East Asian economies have experienced relatively strong export growth over the last five years, with rising market shares in fast‐growing segments. However, there are differences in the relative export performance of individual economies, which are less easily discerned from the broad figures. This box has used a dynamic market share analysis to examine the export structures of seven East Asian economies and identifies the trends in export performance of key products across these markets. Our findings suggest that, while increases in market share for China and, to a lesser extent, Malaysia and Thailand, may have reduced the market shares of the more advanced economies of Singapore, Korea and Taiwan, the latter economies have generally managed to offset the rapid volume growth of their competitors by shifting production to higher value added IT exports, thus ensuring continued relevance in particular segments of these world markets. Reference Escolano, J (2008), "Competitiveness in the Southern Euro Area: France, Greece, Italy, Portugal, and Spain", IMF Working Paper, No. 08/112, pp. 6‐16.
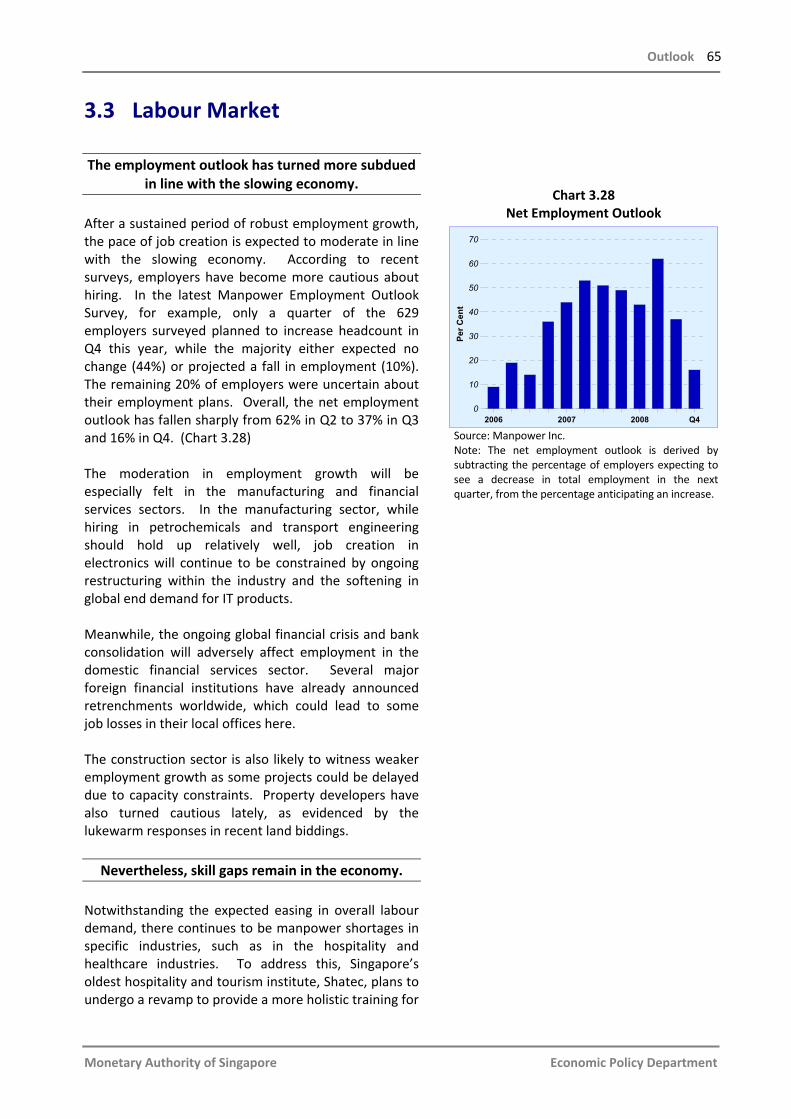
Outlook 65
Monetary Authority of Singapore Economic Policy Department
3.3 Labour Market The employment outlook has turned more subdued
in line with the slowing economy. After a sustained period of robust employment growth, the pace of job creation is expected to moderate in line with the slowing economy. According to recent surveys, employers have become more cautious about hiring. In the latest Manpower Employment Outlook Survey, for example, only a quarter of the 629 employers surveyed planned to increase headcount in Q4 this year, while the majority either expected no change (44%) or projected a fall in employment (10%). The remaining 20% of employers were uncertain about their employment plans. Overall, the net employment outlook has fallen sharply from 62% in Q2 to 37% in Q3 and 16% in Q4. (Chart 3.28) The moderation in employment growth will be especially felt in the manufacturing and financial services sectors. In the manufacturing sector, while hiring in petrochemicals and transport engineering should hold up relatively well, job creation in electronics will continue to be constrained by ongoing restructuring within the industry and the softening in global end demand for IT products. Meanwhile, the ongoing global financial crisis and bank consolidation will adversely affect employment in the domestic financial services sector. Several major foreign financial institutions have already announced retrenchments worldwide, which could lead to some job losses in their local offices here. The construction sector is also likely to witness weaker employment growth as some projects could be delayed due to capacity constraints. Property developers have also turned cautious lately, as evidenced by the lukewarm responses in recent land biddings.
Nevertheless, skill gaps remain in the economy. Notwithstanding the expected easing in overall labour demand, there continues to be manpower shortages in specific industries, such as in the hospitality and healthcare industries. To address this, Singapore’s oldest hospitality and tourism institute, Shatec, plans to undergo a revamp to provide a more holistic training for
Chart 3.28 Net Employment Outlook
2006 2007 2008 Q40
10
20
30
40
50
60
70
Per C
ent
Source: Manpower Inc. Note: The net employment outlook is derived by subtracting the percentage of employers expecting to see a decrease in total employment in the next quarter, from the percentage anticipating an increase.

66 Macroeconomic Review, October 2008
Monetary Authority of Singapore Economic Policy Department
workers. Similarly, scholarships are being offered to Singaporeans interested in pursuing studies in the healthcare industries, such as radiology, in anticipation of greater demand for such workers. As such, a continued reliance on foreigners to plug specific skill gaps is expected over the medium term. Indeed, STB projects that the Integrated Resorts and related firms will create 60,000 jobs over the next few years, 45% of which could be filled by foreigners. In the healthcare industry, there are also insufficient trained local personnel to fill the 7,000 jobs that MOH anticipates will be created over the next five years.
The skills of local workers will be upgraded … Meanwhile, there are ongoing policies to equip Singaporeans with the necessary skills to remain employable. Under the Continuing Education and Training (CET) Masterplan, for instance, the NTUC Unit for Contract & Casual Workers (UCCW) recently launched a training initiative aimed at assisting contract and casual workers to upgrade their skills as well as helping them with career progression and life‐long employment. The Skills Development Levy (SDL) rate for low‐skilled workers was also reduced in October 2008, to further encourage employers to upgrade the skills of local workers.
… while older workers are encouraged to stay in employment.
In response to the ageing population and falling fertility rates, older workers are being encouraged to stay employed for a longer period of time. To this end, MOM and its tripartite partners have introduced several initiatives. For example, the government has committed itself to enact re‐employment legislation by 2012. When it comes into effect, employers will be required to offer re‐employment to their workers when they reach the current statutory retirement age of 62, although the workers may not necessarily be retained in the same job or receive the same wage. This legislation will further strengthen the government’s efforts to address the medium to longer‐term manpower requirements of the economy.

Outlook 67
Monetary Authority of Singapore Economic Policy Department
3.4 Inflation Price pressures from both external and domestic
sources should moderate. After reaching a peak in June, domestic CPI inflation is expected to ease going into 2009. Falling commodity prices will help to dampen domestic inflationary pressures from external sources, while domestic business cost pressures will recede in tandem with slower economic growth.
Domestic fuel‐related CPI inflation will slow significantly in 2009.
Barring supply disruptions arising from geopolitical tensions or weather‐related factors, the tight conditions in the global oil market are likely to ease in the near term. Oil demand, especially in industrial economies, should moderate alongside weaker economic growth. The Energy Information Administration (EIA) has projected global oil demand growth at 0.3 million barrels per day (bpd) in 2008 and 0.7 million bpd in 2009, down from 1.1 million bpd in 2007. At the same time, the completion of key projects in Saudi Arabia, Brazil and Azerbaijan next year will provide a boost to oil supply, increasing spare capacity from the record low of 1.2 million bpd in Q3 2008 to about 3.0 million bpd by the end of next year. (Chart 3.29) Aside from improvements in the oil demand‐supply balance, the ongoing deleveraging process across risky assets, including oil, could continue to exert downward pressure on oil prices. Nevertheless, the high marginal costs of oil production and exploration, as well as relatively firm demand from emerging economies, will limit the downside to oil prices. (Chart 3.30) Taking into account current analyst forecasts and futures prices, the average annual WTI oil price is expected to fall by 22% to US$80 per barrel in 2009, from US$103 in 2008. (Chart 3.31) This compares with a 61% y‐o‐y increase in oil prices between January and October. Given the current oil price forecast, direct fuel‐related items in the domestic CPI, such as petrol, could record price declines in 2009. However, some indirect pass‐through effects might persist, given the complex ways that energy prices feed into firms’ cost structures.
Chart 3.29 Crude Oil Spare Capacity
1970 1980 1990 20000
2
4
6
8
10
12
0
Mill
ion
Bar
rels
Per
Day
2009F
Source: EIA
Chart 3.30 Indicators of Oil Production Costs
1991 1995 1999 2003 20070
20
40
60
80
0
US$
Per
Bar
rel
50
100
150
200
250
Inde
x (1
991=
100)
Marginal Cost of Producing a Barrel of Oil (LHS)US PPI for Oil Inputs (RHS)
Source: IMF
Chart 3.31 WTI Crude Oil Price Forecasts
2007 Jul 2008 Jul 2009 Jul40
60
80
100
120
140
US$
Per
Bar
rel
Dec
Analyst*
Nymex Spot
Futures**
Forecast
Source: Bloomberg * Bloomberg Weighted Analyst Average ** Nymex WTI futures on 23 Oct 2008.
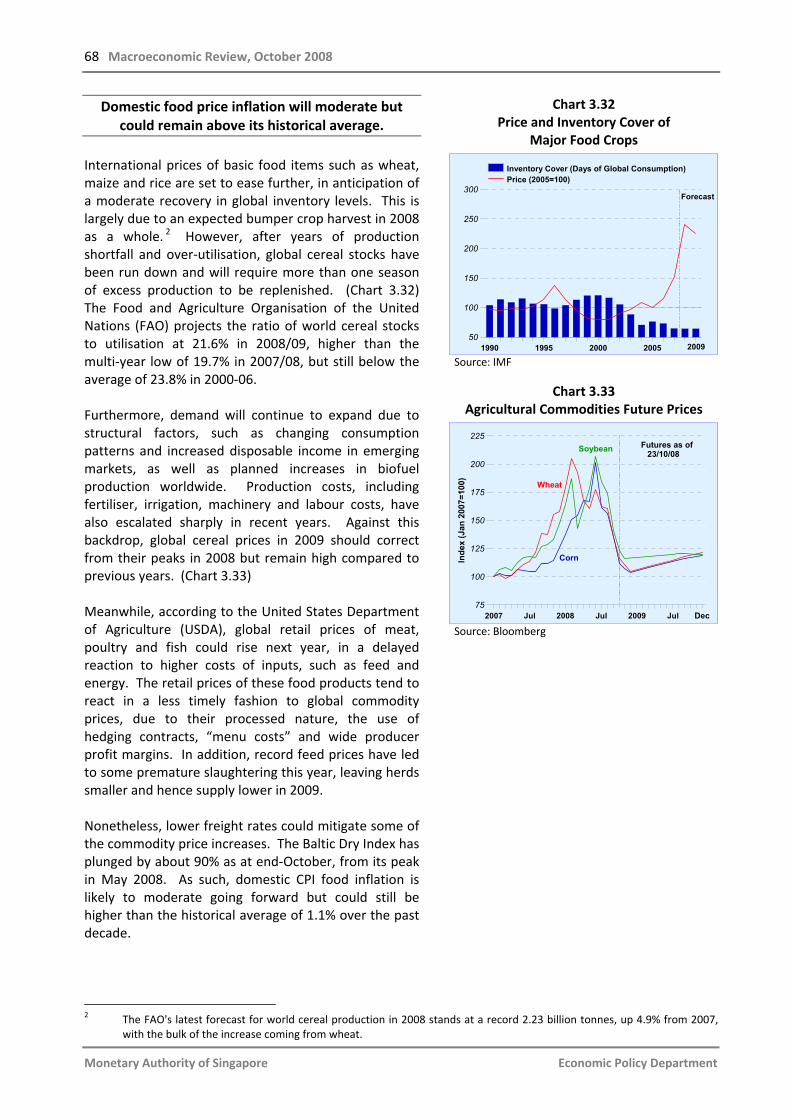
68 Macroeconomic Review, October 2008
Monetary Authority of Singapore Economic Policy Department
Domestic food price inflation will moderate but could remain above its historical average.
International prices of basic food items such as wheat, maize and rice are set to ease further, in anticipation of a moderate recovery in global inventory levels. This is largely due to an expected bumper crop harvest in 2008 as a whole. 2 However, after years of production shortfall and over‐utilisation, global cereal stocks have been run down and will require more than one season of excess production to be replenished. (Chart 3.32) The Food and Agriculture Organisation of the United Nations (FAO) projects the ratio of world cereal stocks to utilisation at 21.6% in 2008/09, higher than the multi‐year low of 19.7% in 2007/08, but still below the average of 23.8% in 2000‐06. Furthermore, demand will continue to expand due to structural factors, such as changing consumption patterns and increased disposable income in emerging markets, as well as planned increases in biofuel production worldwide. Production costs, including fertiliser, irrigation, machinery and labour costs, have also escalated sharply in recent years. Against this backdrop, global cereal prices in 2009 should correct from their peaks in 2008 but remain high compared to previous years. (Chart 3.33) Meanwhile, according to the United States Department of Agriculture (USDA), global retail prices of meat, poultry and fish could rise next year, in a delayed reaction to higher costs of inputs, such as feed and energy. The retail prices of these food products tend to react in a less timely fashion to global commodity prices, due to their processed nature, the use of hedging contracts, “menu costs” and wide producer profit margins. In addition, record feed prices have led to some premature slaughtering this year, leaving herds smaller and hence supply lower in 2009. Nonetheless, lower freight rates could mitigate some of the commodity price increases. The Baltic Dry Index has plunged by about 90% as at end‐October, from its peak in May 2008. As such, domestic CPI food inflation is likely to moderate going forward but could still be higher than the historical average of 1.1% over the past decade.
Chart 3.32 Price and Inventory Cover of
Major Food Crops
1990 1995 2000 200550
100
150
200
250
300
Inventory Cover (Days of Global Consumption)Price (2005=100)
2009
Forecast
Source: IMF
Chart 3.33 Agricultural Commodities Future Prices
2007 Jul 2008 Jul 2009 Jul75
100
125
150
175
200
225
Inde
x (J
an 2
007=
100)
Dec
Corn
Wheat
Soybean Futures as of 23/10/08
Source: Bloomberg
2 The FAO's latest forecast for world cereal production in 2008 stands at a record 2.23 billion tonnes, up 4.9% from 2007,
with the bulk of the increase coming from wheat.
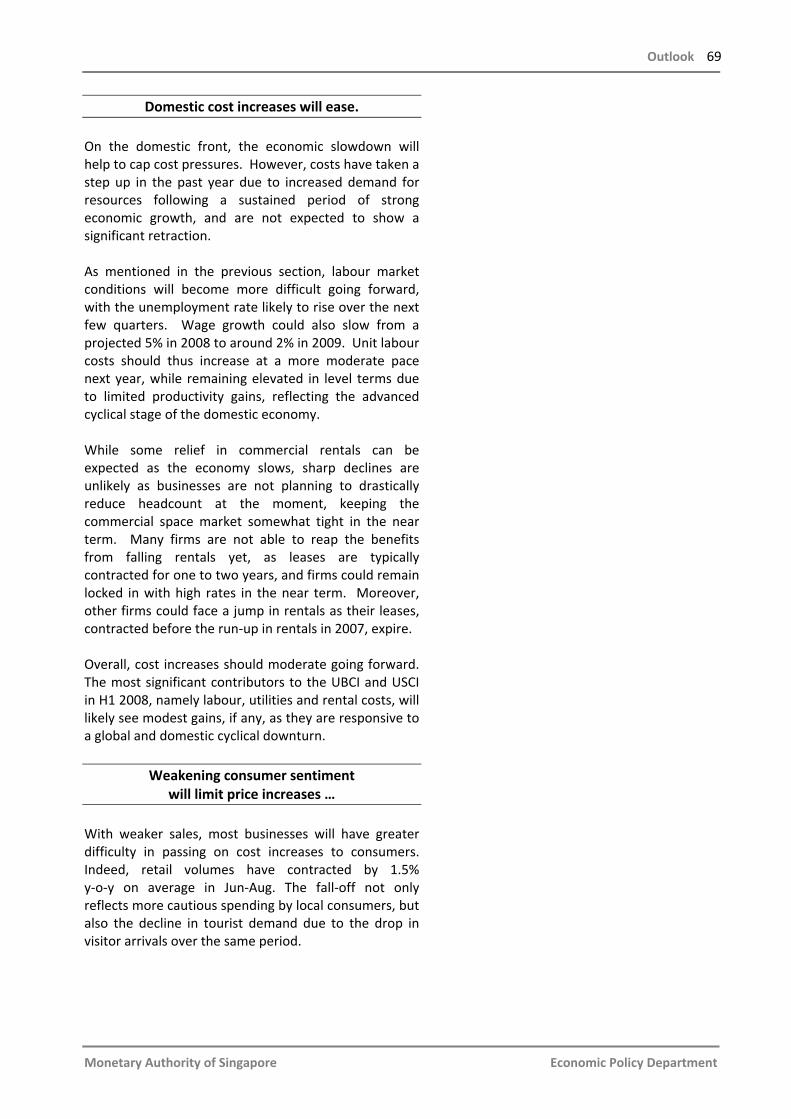
Outlook 69
Monetary Authority of Singapore Economic Policy Department
Domestic cost increases will ease. On the domestic front, the economic slowdown will help to cap cost pressures. However, costs have taken a step up in the past year due to increased demand for resources following a sustained period of strong economic growth, and are not expected to show a significant retraction. As mentioned in the previous section, labour market conditions will become more difficult going forward, with the unemployment rate likely to rise over the next few quarters. Wage growth could also slow from a projected 5% in 2008 to around 2% in 2009. Unit labour costs should thus increase at a more moderate pace next year, while remaining elevated in level terms due to limited productivity gains, reflecting the advanced cyclical stage of the domestic economy. While some relief in commercial rentals can be expected as the economy slows, sharp declines are unlikely as businesses are not planning to drastically reduce headcount at the moment, keeping the commercial space market somewhat tight in the near term. Many firms are not able to reap the benefits from falling rentals yet, as leases are typically contracted for one to two years, and firms could remain locked in with high rates in the near term. Moreover, other firms could face a jump in rentals as their leases, contracted before the run‐up in rentals in 2007, expire. Overall, cost increases should moderate going forward. The most significant contributors to the UBCI and USCI in H1 2008, namely labour, utilities and rental costs, will likely see modest gains, if any, as they are responsive to a global and domestic cyclical downturn.
Weakening consumer sentiment will limit price increases …
With weaker sales, most businesses will have greater difficulty in passing on cost increases to consumers. Indeed, retail volumes have contracted by 1.5% y‐o‐y on average in Jun‐Aug. The fall‐off not only reflects more cautious spending by local consumers, but also the decline in tourist demand due to the drop in visitor arrivals over the same period.

70 Macroeconomic Review, October 2008
Monetary Authority of Singapore Economic Policy Department
The impact of the economic downturn is likely to be more severe on the prices of big‐ticket items. In particular, car prices could remain relatively low in 2009. Thus far, average car COE premiums in H2 2008 have fallen by about 20% y‐o‐y due to lower demand arising from concerns over higher driving costs. (Chart 3.34) Prices could decline further in the months ahead, before recovering slightly from Q2 2009 onwards due to an anticipated cut in COE supply for Quota Year 2009 (April 2009 to March 2010).3
… in line with a narrowing of the output gap. The output gap and CPI inflation in Singapore correlate fairly well. (Chart 3.35) Strong inflationary pressures will emerge when there is a sustained positive output gap, as seen in the last two years. Conversely, a swift decline in the output gap will significantly dampen inflationary pressures. EPD’s estimates suggest that the relatively rapid narrowing of the positive output gap in 2008‐09 could bring underlying inflation down markedly, to around the levels seen in 2004‐07. In particular, the consumer sentiment and wage‐related components4 in the CPI could see significantly slower rates of increase next year, in line with the slowdown in economic growth. (Chart 3.36) CPI inflation is expected to fall to 2.5‐3.5% in 2009. In summary, external sources of inflation (food and oil) will ease in 2009 due to improving demand‐supply dynamics in world markets. For businesses, domestic labour and rental costs should stabilise or even ease slightly next year, after accelerating from H2 2007 to H1 this year. Price increases for sentiment‐sensitive goods and services will also be limited as the domestic economy slows further. Against the moderation in cost pressures from both external and domestic sources, the average q‐o‐q CPI inflation should be significantly lower in 2009 compared to H2 2007 and 2008, although still slightly above the historical average of 0.3% in 2004‐07. (Chart 3.37)
Chart 3.34 COE Premiums
2006 Jul 2007 Jul 2008 Jul Oct8
10
12
14
16
18
20
$ Th
ousa
nd
Catergory A
Weighted Average of Catergory B & E
Chart 3.35 Output Gap and MAS Underlying Inflation
1984 1990 1996 2002-4
-2
0
2
4
6
% o
f Pot
entia
l GD
P
-4
-2
0
2
4
6
YOY
% G
row
th
2007
MAS Underlying Inflation (RHS)
Output Gap (LHS)
Chart 3.36 Contribution to MAS Underlying Inflation
2004-2007 2008F 2009F0
1
2
3
4
5
6
7
% P
oint
Con
trib
utio
n
GSTOthersWage-relatedConsumerSentiment-relatedCommodity-related
Source: EPD, MAS estimates
3 This is due to a 50% cut in the targeted annual vehicle growth rate by LTA from 3% to 1.5% with effect from 2009. 4 The MAS underlying inflation measure can be segregated into the following components: (i) consumer sentiment‐related,
i.e. cooked food, clothing & footwear and recreation & others; (ii) wage‐related, i.e. public transport, education and health; (iii) commodity‐related, i.e. non‐cooked food and direct oil‐related items; (iv) impact from the GST hikes in January 2004 and July 2007; and (v) others.
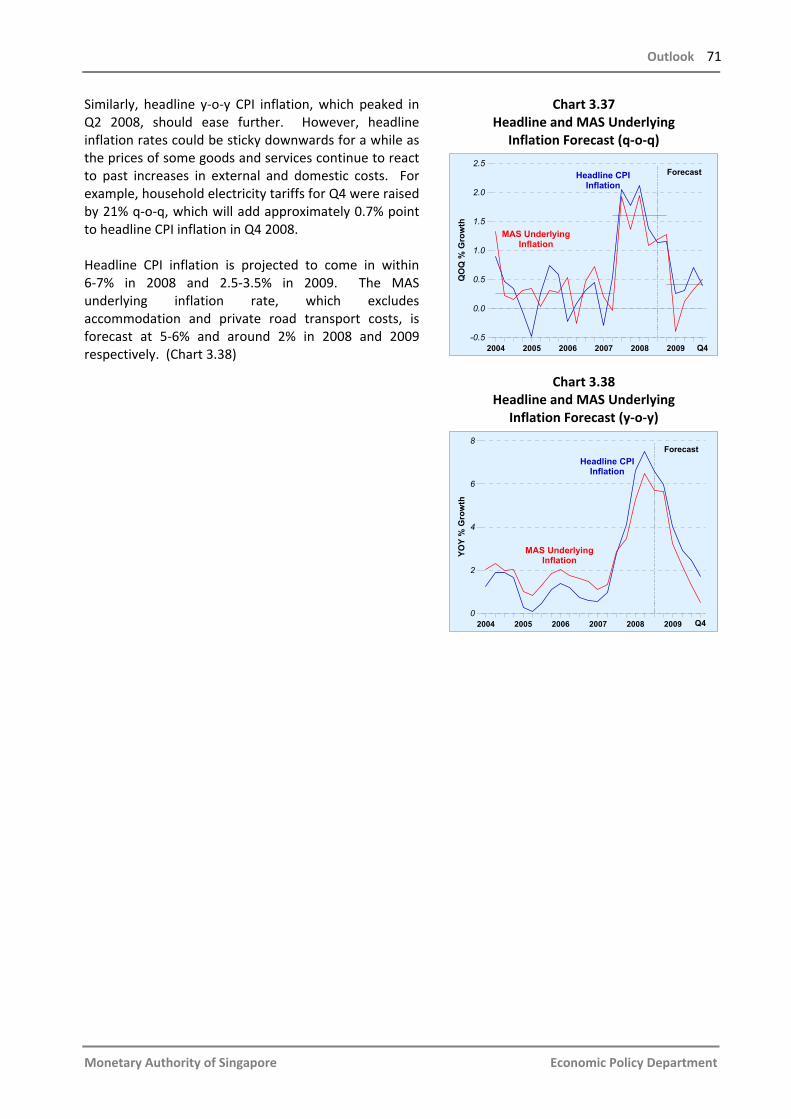
Outlook 71
Monetary Authority of Singapore Economic Policy Department
Similarly, headline y‐o‐y CPI inflation, which peaked in Q2 2008, should ease further. However, headline inflation rates could be sticky downwards for a while as the prices of some goods and services continue to react to past increases in external and domestic costs. For example, household electricity tariffs for Q4 were raised by 21% q‐o‐q, which will add approximately 0.7% point to headline CPI inflation in Q4 2008. Headline CPI inflation is projected to come in within 6‐7% in 2008 and 2.5‐3.5% in 2009. The MAS underlying inflation rate, which excludes accommodation and private road transport costs, is forecast at 5‐6% and around 2% in 2008 and 2009 respectively. (Chart 3.38)
Chart 3.37 Headline and MAS Underlying
Inflation Forecast (q‐o‐q)
2004 2005 2006 2007 2008 2009-0.5
0.0
0.5
1.0
1.5
2.0
2.5
QO
Q %
Gro
wth
MAS Underlying Inflation
Headline CPI Inflation
Forecast
Q4
Chart 3.38
Headline and MAS Underlying Inflation Forecast (y‐o‐y)
2004 2005 2006 2007 2008 20090
2
4
6
8
YOY
% G
row
th
MAS Underlying Inflation
Headline CPI Inflation
Forecast
Q4
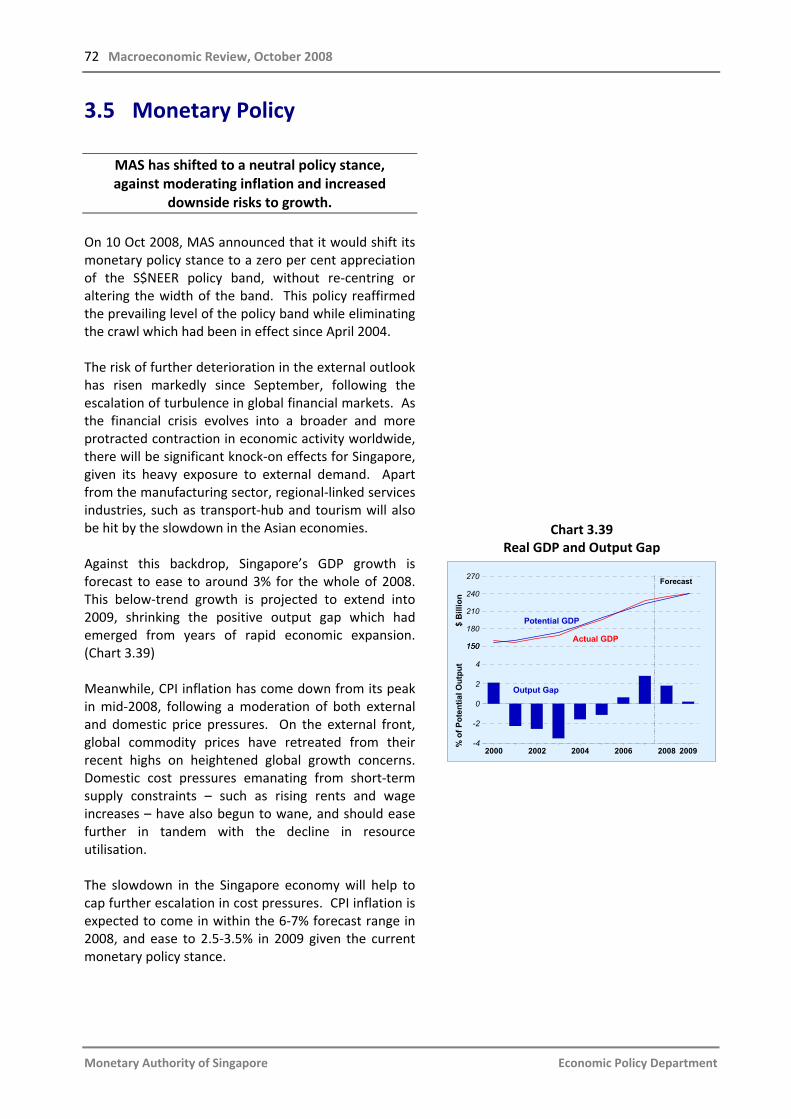
72 Macroeconomic Review, October 2008
Monetary Authority of Singapore Economic Policy Department
3.5 Monetary Policy
MAS has shifted to a neutral policy stance, against moderating inflation and increased
downside risks to growth. On 10 Oct 2008, MAS announced that it would shift its monetary policy stance to a zero per cent appreciation of the S$NEER policy band, without re‐centring or altering the width of the band. This policy reaffirmed the prevailing level of the policy band while eliminating the crawl which had been in effect since April 2004. The risk of further deterioration in the external outlook has risen markedly since September, following the escalation of turbulence in global financial markets. As the financial crisis evolves into a broader and more protracted contraction in economic activity worldwide, there will be significant knock‐on effects for Singapore, given its heavy exposure to external demand. Apart from the manufacturing sector, regional‐linked services industries, such as transport‐hub and tourism will also be hit by the slowdown in the Asian economies. Against this backdrop, Singapore’s GDP growth is forecast to ease to around 3% for the whole of 2008. This below‐trend growth is projected to extend into 2009, shrinking the positive output gap which had emerged from years of rapid economic expansion. (Chart 3.39) Meanwhile, CPI inflation has come down from its peak in mid‐2008, following a moderation of both external and domestic price pressures. On the external front, global commodity prices have retreated from their recent highs on heightened global growth concerns. Domestic cost pressures emanating from short‐term supply constraints – such as rising rents and wage increases – have also begun to wane, and should ease further in tandem with the decline in resource utilisation. The slowdown in the Singapore economy will help to cap further escalation in cost pressures. CPI inflation is expected to come in within the 6‐7% forecast range in 2008, and ease to 2.5‐3.5% in 2009 given the current monetary policy stance.
Chart 3.39
Real GDP and Output Gap
* EPD, internal estimates.2000 2002 2004 2006 2008 2009-4
-2
0
2
4
150
180
210
240
270
150
Forecast
Potential GDP
Actual GDP
Output Gap
$ B
illio
n%
of P
oten
tial O
utpu
t
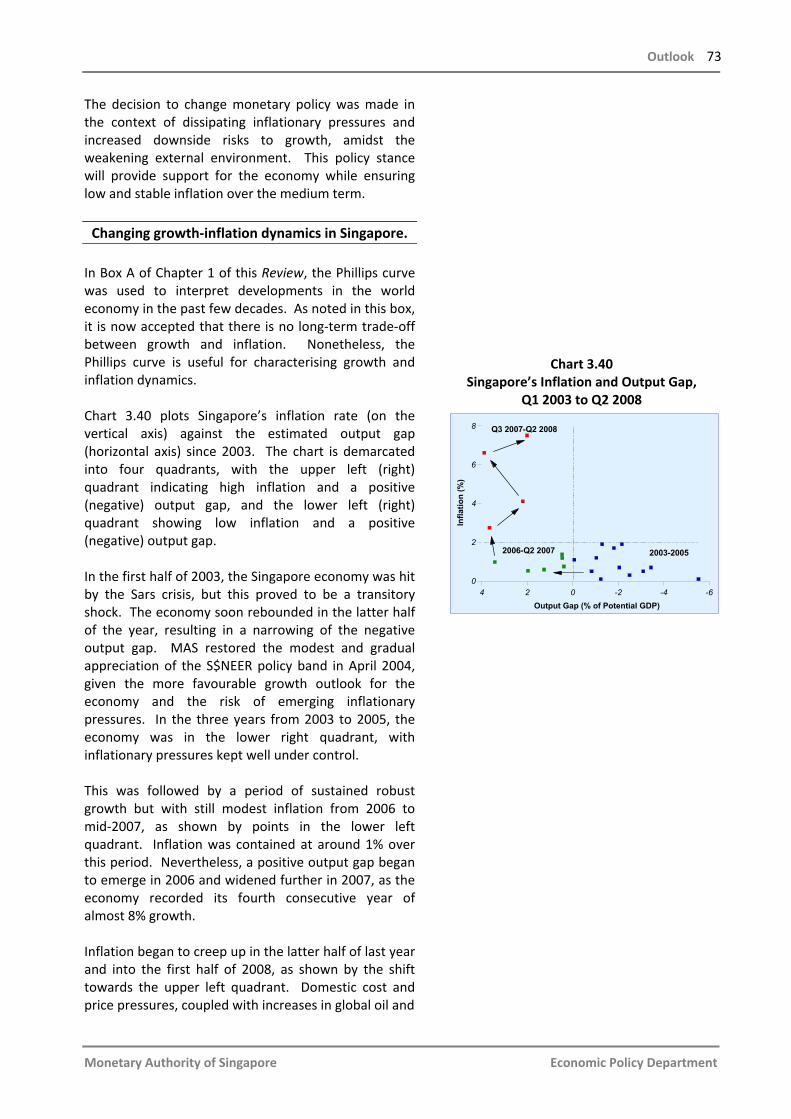
Outlook 73
Monetary Authority of Singapore Economic Policy Department
The decision to change monetary policy was made in the context of dissipating inflationary pressures and increased downside risks to growth, amidst the weakening external environment. This policy stance will provide support for the economy while ensuring low and stable inflation over the medium term. Changing growth‐inflation dynamics in Singapore. In Box A of Chapter 1 of this Review, the Phillips curve was used to interpret developments in the world economy in the past few decades. As noted in this box, it is now accepted that there is no long‐term trade‐off between growth and inflation. Nonetheless, the Phillips curve is useful for characterising growth and inflation dynamics. Chart 3.40 plots Singapore’s inflation rate (on the vertical axis) against the estimated output gap (horizontal axis) since 2003. The chart is demarcated into four quadrants, with the upper left (right) quadrant indicating high inflation and a positive (negative) output gap, and the lower left (right) quadrant showing low inflation and a positive (negative) output gap. In the first half of 2003, the Singapore economy was hit by the Sars crisis, but this proved to be a transitory shock. The economy soon rebounded in the latter half of the year, resulting in a narrowing of the negative output gap. MAS restored the modest and gradual appreciation of the S$NEER policy band in April 2004, given the more favourable growth outlook for the economy and the risk of emerging inflationary pressures. In the three years from 2003 to 2005, the economy was in the lower right quadrant, with inflationary pressures kept well under control. This was followed by a period of sustained robust growth but with still modest inflation from 2006 to mid‐2007, as shown by points in the lower left quadrant. Inflation was contained at around 1% over this period. Nevertheless, a positive output gap began to emerge in 2006 and widened further in 2007, as the economy recorded its fourth consecutive year of almost 8% growth. Inflation began to creep up in the latter half of last year and into the first half of 2008, as shown by the shift towards the upper left quadrant. Domestic cost andprice pressures, coupled with increases in global oil and
Chart 3.40 Singapore’s Inflation and Output Gap,
Q1 2003 to Q2 2008
-6-4-2024 Output Gap (% of Potential GDP)
0
2
4
6
8
Infla
tion
(%)
2003-20052006-Q2 2007
Q3 2007-Q2 2008
74 Macroeconomic Review, October 2008
Monetary Authority of Singapore Economic Policy Department
food prices, brought inflation to a peak of 7.5% in Q2 2008. Against this backdrop, the monetary policystance was tightened further by adopting a slightly faster rate of appreciation of the S$NEER policy band in October 2007, and subsequently re‐centring the band upwards in April 2008. EPD’s baseline projection for the rest of 2008 and 2009 is for a gradual decline in inflation, as the pace of global price increases moderates and domestic cost pressures ease in tandem with a narrowing output gap. Amidst considerable uncertainty surrounding the global economy and financial markets, the balance of risks facing the Singapore economy is currently tilted towards a further slippage in growth. The economy is thus expected to gravitate towards the intersection point of the quadrants.

Special Features
76 Macroeconomic Review, October 2008
Monetary Authority of Singapore Economic Policy Department
An Empirical Analysis of Exchange Rate Pass‐through in Singapore1 Introduction Reflecting its small and open economy, Singapore adopts an exchange rate‐centred monetary policy regime to achieve medium‐term price stability. The nominal exchange rate affects consumer prices through two channels: (i) the domestic prices of imported goods, given Singapore’s high degree of dependence on imports for consumption needs; and (ii) the general profit margin of exporters, which affects the level of resource utilisation and hence domestic price pressures.2 The first channel, commonly known as “exchange rate pass‐through”, consists of two distinct stages. In the first, changes in the exchange rate are directly translated into the prices of imports in
local currency terms. These price changes are passed on in whole or in part to the consumer during the second stage. The extent of pass‐through at each stage has previously been separately examined in MAS (2001a and 2001b). This feature highlights the main findings of a more recent study on exchange rate pass‐through for the Singapore economy. Specifically, it updates the earlier results and combines the two stages to assess the cumulative impact on domestic CPI. 3 To further the understanding of the price transmission mechanism, asymmetric pass‐through effects are allowed for over the business cycle.
First Stage Exchange Rate Pass‐through Empirical Modelling and Estimation Results A simple modification to the “Law of One Price” is used to assess the degree of first stage exchange rate pass‐through in Singapore over the long‐run:
( )( )β
α
t
tt
E
*IMPIMP = (1)
In (1), IMP denotes the S$‐denominated import price index, IMP* is the foreign import price index (proxied by EPD’s foreign wholesale prices index weighted by Singapore’s major trading partners) and E is the Nominal Effective Exchange Rate (S$NEER) that converts foreign prices into domestic prices.
1 This Special Feature was done in collaboration with Professor Sam Ouliaris of the National University of Singapore (NUS)
Business School. The full paper with detailed results will be released as a MAS Staff Paper in early 2009. 2 See Box C in the April 2008 issue of the Review for a stylised description of the price determination mechanism in
Singapore. 3 The second channel in the price determination mechanism is not considered in this feature. A general equilibrium macro
econometric model would be needed to assess the overall impact of the exchange rate on consumer prices.
Special Feature A
1
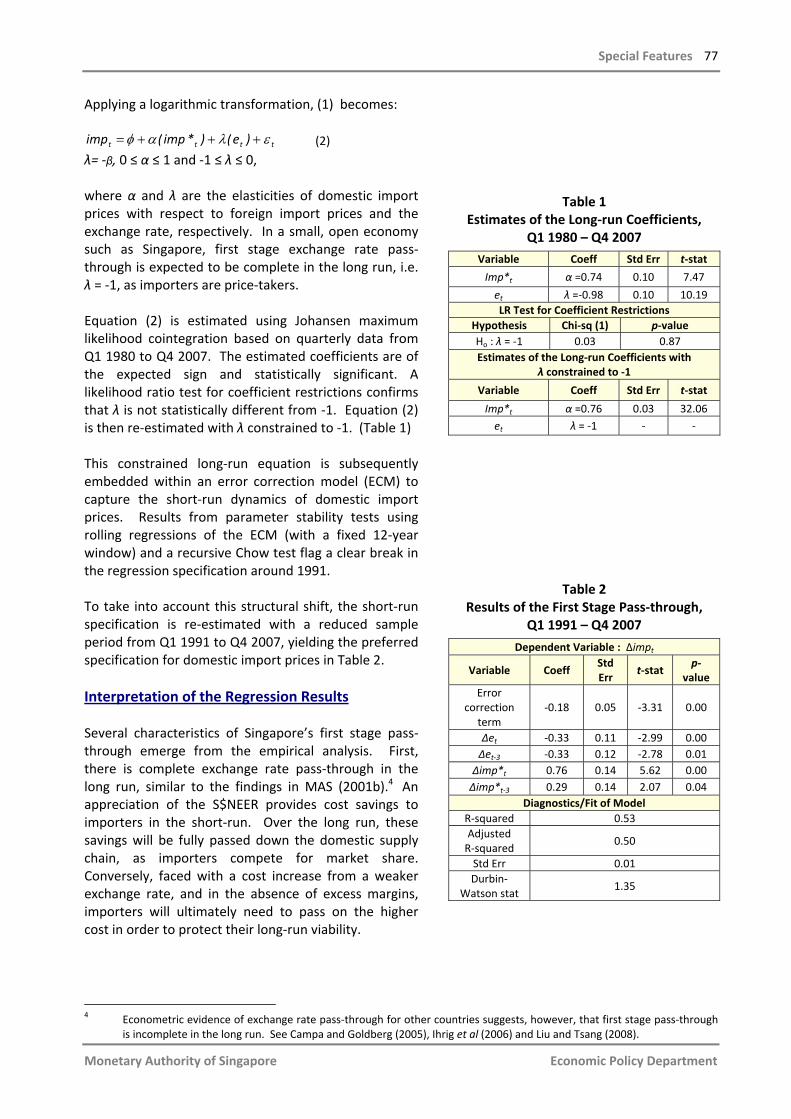
Special Features 77
Monetary Authority of Singapore Economic Policy Department
Applying a logarithmic transformation, (1) becomes:
tttt )e()*imp(imp ελαφ +++=
λ= ‐β, 0 ≤ α ≤ 1 and ‐1 ≤ λ ≤ 0, where α and λ are the elasticities of domestic import prices with respect to foreign import prices and the exchange rate, respectively. In a small, open economy such as Singapore, first stage exchange rate pass‐through is expected to be complete in the long run, i.e. λ = ‐1, as importers are price‐takers. Equation (2) is estimated using Johansen maximum likelihood cointegration based on quarterly data from Q1 1980 to Q4 2007. The estimated coefficients are of the expected sign and statistically significant. A likelihood ratio test for coefficient restrictions confirms that λ is not statistically different from ‐1. Equation (2) is then re‐estimated with λ constrained to ‐1. (Table 1) This constrained long‐run equation is subsequently embedded within an error correction model (ECM) to capture the short‐run dynamics of domestic import prices. Results from parameter stability tests using rolling regressions of the ECM (with a fixed 12‐year window) and a recursive Chow test flag a clear break in the regression specification around 1991. To take into account this structural shift, the short‐run specification is re‐estimated with a reduced sample period from Q1 1991 to Q4 2007, yielding the preferred specification for domestic import prices in Table 2. Interpretation of the Regression Results Several characteristics of Singapore’s first stage pass‐through emerge from the empirical analysis. First, there is complete exchange rate pass‐through in the long run, similar to the findings in MAS (2001b).4 An appreciation of the S$NEER provides cost savings to importers in the short‐run. Over the long run, these savings will be fully passed down the domestic supply chain, as importers compete for market share. Conversely, faced with a cost increase from a weaker exchange rate, and in the absence of excess margins, importers will ultimately need to pass on the higher cost in order to protect their long‐run viability.
Table 1 Estimates of the Long‐run Coefficients,
Q1 1980 – Q4 2007
Variable Coeff Std Err t‐stat
Imp*t α =0.74 0.10 7.47
et λ =‐0.98 0.10 10.19 LR Test for Coefficient Restrictions
Hypothesis Chi‐sq (1) p‐value Ho : λ = ‐1 0.03 0.87 Estimates of the Long‐run Coefficients with
λ constrained to ‐1
Variable Coeff Std Err t‐stat
Imp*t α =0.76 0.03 32.06
et λ = ‐1 ‐ ‐
Table 2
Results of the First Stage Pass‐through, Q1 1991 – Q4 2007
Dependent Variable : Δimpt
Variable Coeff Std Err
t‐stat p‐
value Error
correction term
‐0.18 0.05 ‐3.31 0.00
Δet ‐0.33 0.11 ‐2.99 0.00 Δet‐3 ‐0.33 0.12 ‐2.78 0.01
Δimp*t 0.76 0.14 5.62 0.00 Δimp*t‐3 0.29 0.14 2.07 0.04
Diagnostics/Fit of Model R‐squared 0.53 Adjusted R‐squared
0.50
Std Err 0.01 Durbin‐
Watson stat 1.35
4 Econometric evidence of exchange rate pass‐through for other countries suggests, however, that first stage pass‐through
is incomplete in the long run. See Campa and Goldberg (2005), Ihrig et al (2006) and Liu and Tsang (2008).
(2)
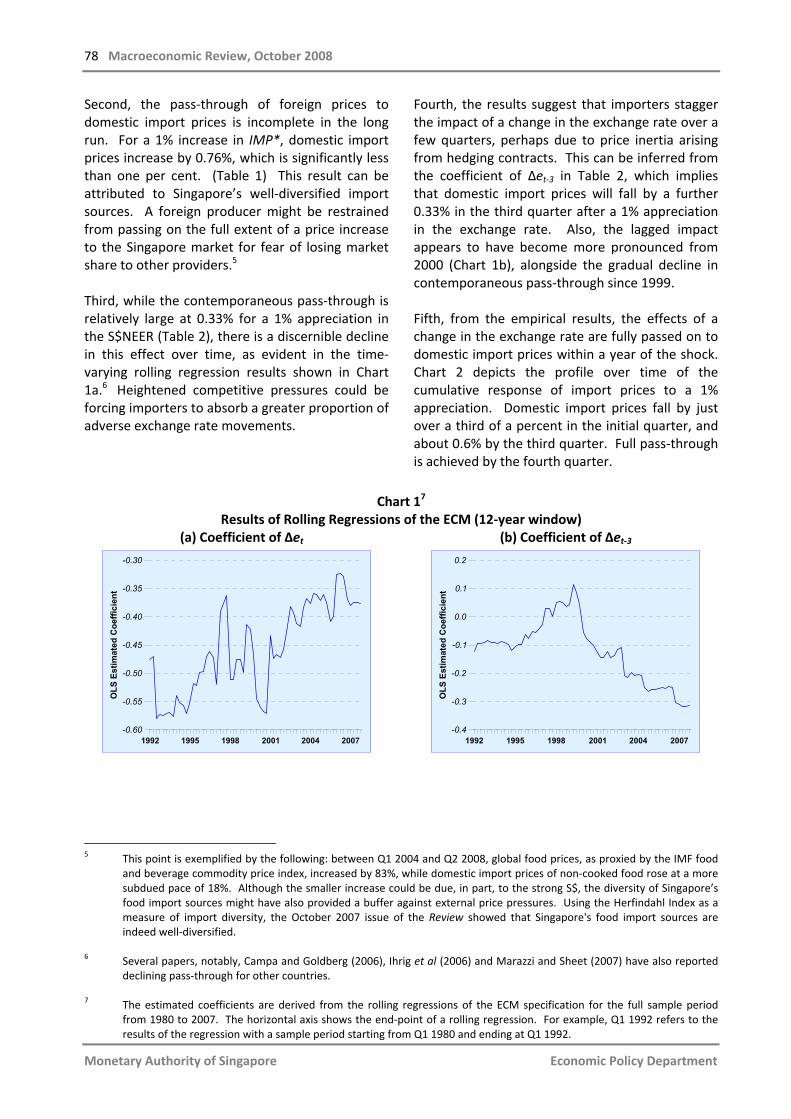
78 Macroeconomic Review, October 2008
Monetary Authority of Singapore Economic Policy Department
Second, the pass‐through of foreign prices to domestic import prices is incomplete in the long run. For a 1% increase in IMP*, domestic import prices increase by 0.76%, which is significantly less than one per cent. (Table 1) This result can be attributed to Singapore’s well‐diversified import sources. A foreign producer might be restrained from passing on the full extent of a price increase to the Singapore market for fear of losing market share to other providers.5 Third, while the contemporaneous pass‐through is relatively large at 0.33% for a 1% appreciation in the S$NEER (Table 2), there is a discernible decline in this effect over time, as evident in the time‐varying rolling regression results shown in Chart 1a.6 Heightened competitive pressures could be forcing importers to absorb a greater proportion of adverse exchange rate movements.
Fourth, the results suggest that importers stagger the impact of a change in the exchange rate over a few quarters, perhaps due to price inertia arising from hedging contracts. This can be inferred from the coefficient of Δet‐3 in Table 2, which implies that domestic import prices will fall by a further 0.33% in the third quarter after a 1% appreciation in the exchange rate. Also, the lagged impact appears to have become more pronounced from 2000 (Chart 1b), alongside the gradual decline in contemporaneous pass‐through since 1999. Fifth, from the empirical results, the effects of a change in the exchange rate are fully passed on to domestic import prices within a year of the shock. Chart 2 depicts the profile over time of the cumulative response of import prices to a 1% appreciation. Domestic import prices fall by just over a third of a percent in the initial quarter, and about 0.6% by the third quarter. Full pass‐through is achieved by the fourth quarter.
Chart 17
Results of Rolling Regressions of the ECM (12‐year window) (a) Coefficient of Δet
1992 1995 1998 2001 2004 2007-0.60
-0.55
-0.50
-0.45
-0.40
-0.35
-0.30
OLS
Est
imat
ed C
oeffi
cien
t
(b) Coefficient of Δet‐3
1992 1995 1998 2001 2004 2007-0.4
-0.3
-0.2
-0.1
0.0
0.1
0.2
OLS
Est
imat
ed C
oeffi
cien
t
5 This point is exemplified by the following: between Q1 2004 and Q2 2008, global food prices, as proxied by the IMF food
and beverage commodity price index, increased by 83%, while domestic import prices of non‐cooked food rose at a more subdued pace of 18%. Although the smaller increase could be due, in part, to the strong S$, the diversity of Singapore’s food import sources might have also provided a buffer against external price pressures. Using the Herfindahl Index as a measure of import diversity, the October 2007 issue of the Review showed that Singapore's food import sources are indeed well‐diversified.
6 Several papers, notably, Campa and Goldberg (2006), Ihrig et al (2006) and Marazzi and Sheet (2007) have also reported
declining pass‐through for other countries. 7 The estimated coefficients are derived from the rolling regressions of the ECM specification for the full sample period
from 1980 to 2007. The horizontal axis shows the end‐point of a rolling regression. For example, Q1 1992 refers to the results of the regression with a sample period starting from Q1 1980 and ending at Q1 1992.
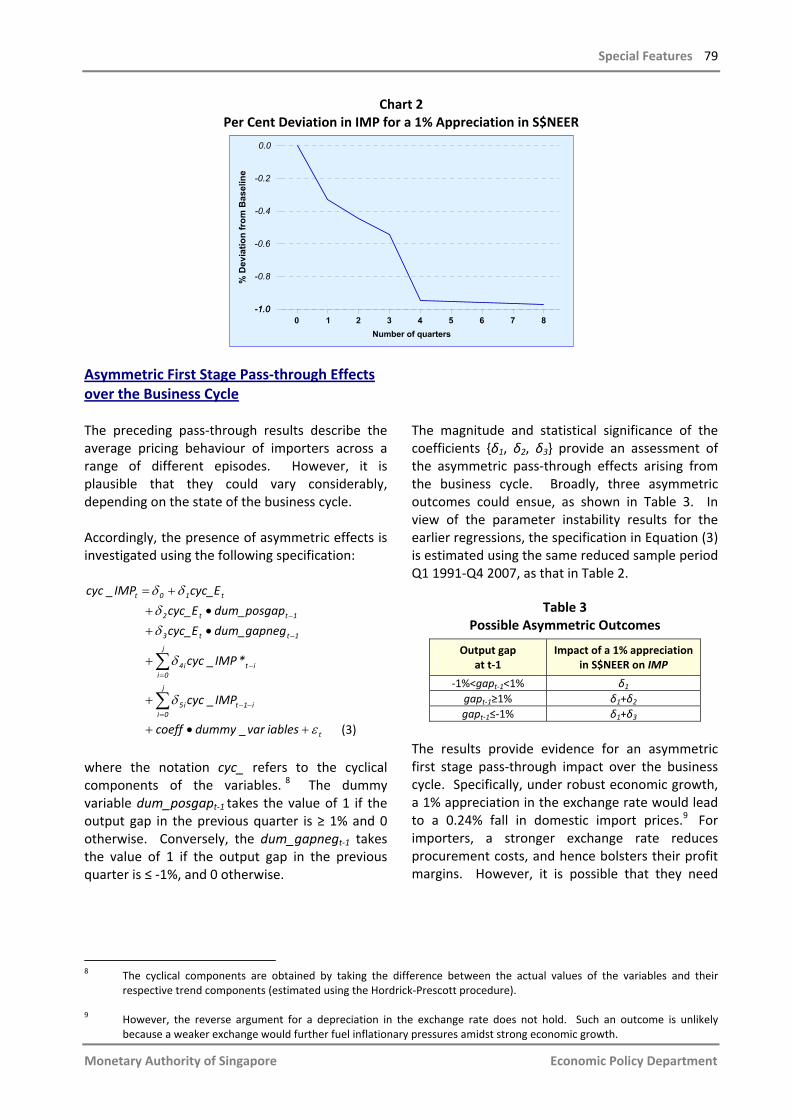
Special Features 79
Monetary Authority of Singapore Economic Policy Department
Chart 2 Per Cent Deviation in IMP for a 1% Appreciation in S$NEER
0 1 2 3 4 5 6 7 8Number of quarters
-1.0
-0.8
-0.6
-0.4
-0.2
0.0
-1.0
% D
evia
tion
from
Bas
elin
e
Asymmetric First Stage Pass‐through Effects over the Business Cycle The preceding pass‐through results describe the average pricing behaviour of importers across a range of different episodes. However, it is plausible that they could vary considerably, depending on the state of the business cycle. Accordingly, the presence of asymmetric effects is investigated using the following specification:
t
j
0ii1ti5
j
0iiti4
1tt3
1tt2
t10t
iablesvar_dummycoeff
IMP_cyc
*IMP_cyc
dum_gapnegcyc_E
dum_posgapcyc_E
cyc_EIMP_cyc
ε
δ
δ
δδ
δδ
+•+
+
+
•+•+
+ =
∑
∑
=−−
=−
−
−
where the notation cyc_ refers to the cyclical components of the variables. 8 The dummy variable dum_posgapt‐1 takes the value of 1 if the output gap in the previous quarter is ≥ 1% and 0 otherwise. Conversely, the dum_gapnegt‐1 takes the value of 1 if the output gap in the previous quarter is ≤ ‐1%, and 0 otherwise.
The magnitude and statistical significance of the coefficients {δ1, δ2, δ3} provide an assessment of the asymmetric pass‐through effects arising from the business cycle. Broadly, three asymmetric outcomes could ensue, as shown in Table 3. In view of the parameter instability results for the earlier regressions, the specification in Equation (3) is estimated using the same reduced sample period Q1 1991‐Q4 2007, as that in Table 2.
Table 3 Possible Asymmetric Outcomes
The results provide evidence for an asymmetric first stage pass‐through impact over the business cycle. Specifically, under robust economic growth, a 1% appreciation in the exchange rate would lead to a 0.24% fall in domestic import prices.9 For importers, a stronger exchange rate reducesprocurement costs, and hence bolsters their profitmargins. However, it is possible that they need
Output gap at t‐1
Impact of a 1% appreciation in S$NEER on IMP
‐1%<gapt‐1<1% δ1 gapt‐1≥1% δ1+δ2 gapt‐1≤‐1% δ1+δ3
8 The cyclical components are obtained by taking the difference between the actual values of the variables and their
respective trend components (estimated using the Hordrick‐Prescott procedure). 9 However, the reverse argument for a depreciation in the exchange rate does not hold. Such an outcome is unlikely
because a weaker exchange would further fuel inflationary pressures amidst strong economic growth.
(3)

80 Macroeconomic Review, October 2008
Monetary Authority of Singapore Economic Policy Department
only pass on a smaller portion of these cost savings over the near term, as demand is expected to remain robust on the back of continued above‐trend growth. In contrast, during sluggish economic conditions, a 1% depreciation in the exchange rate would lead to a 0.5% rise in domestic import prices.10
Second Stage Exchange Rate Pass‐through Empirical Modelling and Estimation Results The second stage of the exchange rate pass‐through entails the transmission of the change in import prices in domestic currency terms to retail prices, and hence to CPI inflation. A cost mark‐up specification is used to model this process. The model expresses Singapore’s CPI as a mark‐up over domestic unit labour cost (ULC) and S$ denominated import prices (IMP):
( ) ( )γβα ttt IMPULCCPI =
where (α – 1) is the retail mark‐up over costs and β and γ are elasticities of the CPI with respect to ULC and IMP respectively. In the presence of highly competitive markets, the mark‐up should be only marginally positive in the long run, since excess profit margins or losses are not expected to prevail. As such, consumer prices of goods and services should rise proportionately with cost increases for businesses to remain viable in the long run. This is equivalent to unit homogeneity, i.e. β + γ =1. Similar to the first stage, the logarithmic version of equation (4) is estimated using Johansen maximum likelihood cointegration based on the same sample period Q1 1991 – Q4 2007. Both the elasticities β and γ are of the expected sign and are statistically significant. The likelihood ratio test for coefficient restrictions shows that the sum of β and γ is not statistically different from 1. (Table 4) The equation is subsequently re‐estimated with this constraint, yielding the preferred long‐run specification for consumer prices in the lower panel of Table 4.
Table 4 Estimates of the Long‐run Coefficients
Q1 1991 – Q4 2007
Variable Coeff Std Err t‐stat
ulct β =0.75 0.24 3.16
impt γ =0.55 0.18 0.18
constant α =‐1.40 0.79 1.77 LR Test for Coefficient Restrictions
Hypothesis Chi‐sq (1) p‐value Ho : β + γ = 1 0.46 0.50 Estimates of the Long‐run Coefficients with the
Constraint β + γ = 1,
Variable Coeff Std Err
t‐stat
ulct β =0.58 0.08 5.25 impt γ =0.42 0.08 7.11
constant α =0.005 0.01 ‐0.51
10 Under such circumstances, domestic inflationary pressures would be muted given the slack in the economy and a tight
monetary policy is unlikely to be pursued.
(4)

Special Features 81
Monetary Authority of Singapore Economic Policy Department
Two important features of the price mechanism can be inferred from the estimation results. First, the retail market is highly competitive given that (i) the constant term in the cointegrating equation, which proxies for the cost mark‐up coefficient, is only marginally positive; and (ii) the condition of unit cost homogeneity holds in the long run. Second, on average, a 1% increase in ULC leads to a 0.58% increase in the CPI, compared with 0.42% for a similar increase in IMP. MAS (2001a) reports similar results. The larger ULC elasticity is consistent with the rising share of services items in the CPI basket – which are typically characterised by higher labour intensity – from 39% in 1988 to 51% in 2004. Similar to the first stage, the short‐run dynamics for second stage pass‐through are also specified in an error correction model. Parameter stability tests using the rolling regressions (with a fixed eight‐year window) and the recursive Chow‐test suggest a discernible break in the parameters around Q3 2000. Hence, the short‐run specification is estimated with a reduced sample period from Q3 2000 to Q4 2007. (Table 5) Diagnostic tests indicate that all the key variables are significant at the 10% level and display the expected signs. A simulation involving a 1% shock to IMP is introduced to the equation in Table 5 to assess the short‐run second stage pass‐through. For comparison, the equation is also simulated with a 1% ULC shock. Chart 3 traces the response profile of the CPI. As noted previously, first stage pass‐through is complete by the fourth quarter of the onset of the shock. In contrast, the adjustment of CPI to its long‐term equilibrium from the IMP shock is far more sluggish and protracted. Not only is the response smaller throughout the horizon, the pace of adjustment is also slower, particularly in the outer years.11
Table 5
Results of the Second Stage Pass‐through Q3 2000 – Q4 2007
Dependent Variable : Δcpit Variable Coeff Std
Err t‐stat p‐value
Error correction
term
‐0.06 0.03 ‐2.54 0.02
Δulct 0.06 0.03 2.00 0.06 Δimpt‐1 0.13 0.03 3.95 0.00 Δgapt 0.003 0.00 4.68 0.00 Δgapt‐3 0.001 0.00 1.71 0.10
Diagnostics/Fit of Model R‐squared 0.85 Adjusted R‐squared
0.80
Std Error 0.003 Durbin‐Watson stat
1.65
Chart 3
Response Profile of CPI and IMP
0 1 2 3 4 5 6 7 8 9 10 11 12Number of quarters after shock
0
20
40
60
80
100
120
100
% o
f Tot
al A
djus
tmen
t 1st Stage Pass-through
2nd Stage Pass-through
1% Shock to ULC in the Second Stage
Note: The first stage pass‐through profile is included as a basis of comparison. The magnitude of the impact is scaled in proportion to the respective long‐run elasticity for comparability purposes, given that the overall long‐run impact of the IMP and ULC shocks are less than 1%.
11 By the end of the second year, about 60% of the long‐run impact of the IMP shock is passed through to consumer prices.
The corresponding result for the ULC shock is about 40%. The subsequent adjustment slows significantly and becomes more drawn‐out in the two simulations. MAS (2001a) also reported similar results.

82 Macroeconomic Review, October 2008
Monetary Authority of Singapore Economic Policy Department
Interpretation of the Regression Results A number of factors could be contributing to the limited and protracted second stage pass‐through. First, the transmission of an import price shock to consumer prices is less direct than that of the first stage. The imported goods are first sold to the wholesalers, who would, in turn, distribute them to the retailers. At each level of the supply chain, firms face different mark‐up rates and market conditions and so might not adjust prices at the same time. Second, strong competitive pressures across the supply chain could cap the extent of adjustment, as both wholesalers and retailers limit the import price pass‐through in a bid to preserve market share. Third, at the retail level, the overall cost of a product consists of both the import cost and the non‐tradable components such as rentals. A rise in the import cost would therefore translate into a smaller proportionate increase in the overall cost of the product. The ensuing impact on profit margins is thus likely to be less severe than that of an importer whose import costs form the bulk of the overall expenses. Faced with an increase in import costs, retailers could absorb some of the increases by using their profit margins as a buffer, given the competitive retail market. Significant “menu costs” could also lead to the same outcome.12
Asymmetric Second Stage Pass‐through Effects over the Business Cycle The study also considered whether consumer prices respond asymmetrically to a given change in import prices across the business cycle, using a similar methodology. The results show that the impact of a 1% decline in import prices on the CPI is not significantly different over the business cycle, possibly due to the general downward stickiness in retail prices. It is also plausible that during a downturn, consumers, faced with increased uncertainty in their future income streams, rein in their spending despite the price reductions. Retailers therefore hold on to the bulk of the import cost savings, as large price discounts are not expected to have a discernible impact on sales. The only asymmetric outcome arises in the event of an increase in import prices. Given strong economic growth, a 1% increase in import prices would lead to a 0.24% increase in consumer prices in the same quarter. Over the other phases of the business cycle, consumer prices rise by a smaller 0.08%. These findings confirm the hypothesis that retailers pass on a greater amount of an import cost increase to consumers during robust economic conditions, which in this case amounts to three times that of the other phases in the cycle. The speed of adjustment conditional on the asymmetric impact is also noticeably faster than that of the average adjustment. The latter shows that about 60% of the long‐run impact is passed on to consumer prices by the end of the second year. (Chart 3) In comparison, the cyclical analysis shows that the same extent of pass‐through is completed within the quarter of the onset of the shock.13
12 It is important to note that the small mark‐up from the cointegrating framework is a characterisation of the average
pricing decision of firms in the long run. Across the different phases of the business cycle, there will be significant variation in the actual mark‐up, as firms adjust their product pricing to specific cyclical conditions.
13 The long‐run elasticity of the CPI with respect to IMP is 0.42. Given that the contemporaneous asymmetric impact on the
CPI is 0.24%, this is equivalent to about 60% of the long run impact.

Special Features 83
Monetary Authority of Singapore Economic Policy Department
Combining the two stages An Empirical Model of the Average Exchange Rate Pass‐through The empirical models of the first and second stage pass‐through effects, as shown in Table 2 and Table 5, respectively, are now combined to obtain the overall exchange rate pass‐through in the Singapore economy. Specifically, the model comprises the two ECM specifications:
( )
( )
ablesdummy_varicoeffgap001.0
gap003.0imp13.0ulc06.0
imp42.0ulc58.0cpi06.0cpi
ablesdummy_varicoeff*imp29.0
*imp76.0e33.0e33.0
e*imp76.0imp18.0imp
3t
t1tt
1t1t1t0t
3t
t3tt
1t1t1t0t
•++
+++−−−=
•++
+−−+−−=
∧
−
−
−−−
∧
∧
−
−
−−−
∧
Δ
ΔΔΔαΔ
Δ
ΔΔΔβΔ
Two simulations are applied to the combined model in (5) to capture the price transmission effects. In the first, the cumulative average exchange rate pass‐through to domestic inflation is traced out, while the second simulation assesses the efficacy of the exchange rate as a filter for external inflationary pressures at the border. Simulation (1) – Average Cumulative Impact of Exchange Rate Pass‐through The results show that a 1% appreciation in the exchange rate would lead to a 0.1% decline in the CPI by the fourth quarter, which is equivalent to around 25% of the full pass‐through.14 (Chart 4) By the end of the second year, the cumulative impact on CPI reaches 0.22% below baseline, amounting to about 50% of the overall pass‐through.
Moving into the outer years, the pace of adjustment becomes more sluggish on account of the muted second stage pass‐through effects. The extent of Singapore’s exchange rate pass‐through to domestic inflation thus appears to be similar to that of the other developed countries, as a consequence of the protracted second stage.15 Simulation (2) – The Exchange Rate as a Filter at the Border To illustrate the efficacy of the exchange rate as a filter for imported inflation, a shock in the form of a 1% increase in the foreign price of imports is introduced into (5). Over the long run, domestic import costs would increase by 0.76%. The exchange rate would thus have to appreciate by 0.76% to fully offset this cost increase. The 0.76% appreciation in the exchange rate is introduced into the model in the quarter following the foreign price shock. Chart 5 shows the responses of IMP and CPI to these shocks. The impact of the foreign price shock on IMP is dampened significantly by the exchange rate appreciation over time, thus implying that the exchange rate is indeed well‐placed to filter external inflationary pressures at the border. Moreover, domestic CPI is relatively insulated from the foreign price shock, reaching a peak of only 0.1% above baseline into the second year of the impact. Consumer price increases are also staggered over time on account of the drawn‐out second stage pass‐through.
14 The first stage pass‐through is complete. Hence, in the long run, CPI would be 0.42% below baseline for a 1% appreciation
in the exchange rate. A 0.1% decline in the CPI is therefore equivalent to around 25% of the full impact. 15 Gagnon and Ihrig (2004), for instance, estimate the pass‐through for a broad set of industrial countries to be roughly at
0.2% for a 1% change in the exchange rate. Liu and Tsang (2008) also find similar results for Hong Kong. At a broader level, Mishkin (2008) observes that “…the correlation between consumer price inflation and exchange rate change is now very low in most industrial countries…”
(5)
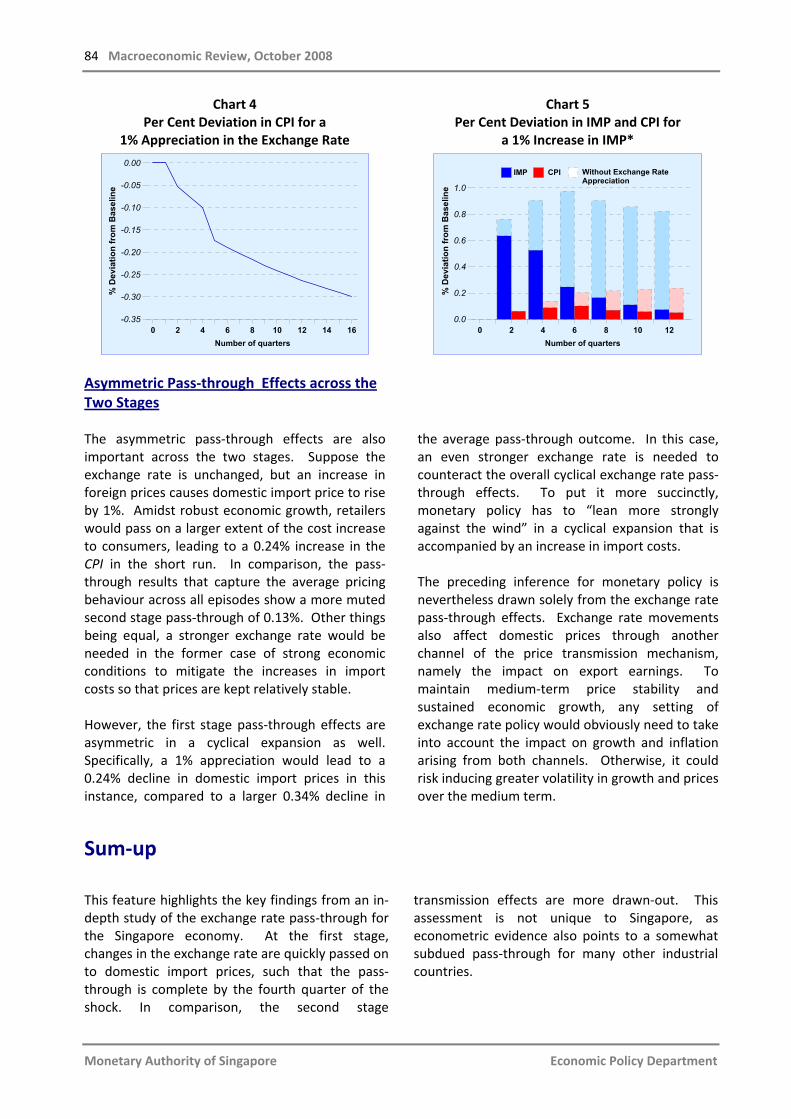
84 Macroeconomic Review, October 2008
Monetary Authority of Singapore Economic Policy Department
Chart 4 Per Cent Deviation in CPI for a
1% Appreciation in the Exchange Rate
0 2 4 6 8 10 12 14 16Number of quarters
-0.35
-0.30
-0.25
-0.20
-0.15
-0.10
-0.05
0.00
% D
evia
tion
from
Bas
elin
e
Chart 5 Per Cent Deviation in IMP and CPI for
a 1% Increase in IMP*
0 2 4 6 8 10 12Number of quarters
0.0
0.2
0.4
0.6
0.8
1.0
% D
evia
tion
from
Bas
elin
e
IMP CPI Without Exchange Rate Appreciation
Sum‐up This feature highlights the key findings from an in‐depth study of the exchange rate pass‐through for the Singapore economy. At the first stage, changes in the exchange rate are quickly passed on to domestic import prices, such that the pass‐ through is complete by the fourth quarter of the shock. In comparison, the second stage
transmission effects are more drawn‐out. This assessment is not unique to Singapore, as econometric evidence also points to a somewhat subdued pass‐through for many other industrial countries.
Asymmetric Pass‐through Effects across the Two Stages The asymmetric pass‐through effects are also important across the two stages. Suppose the exchange rate is unchanged, but an increase in foreign prices causes domestic import price to rise by 1%. Amidst robust economic growth, retailers would pass on a larger extent of the cost increase to consumers, leading to a 0.24% increase in the CPI in the short run. In comparison, the pass‐through results that capture the average pricing behaviour across all episodes show a more muted second stage pass‐through of 0.13%. Other things being equal, a stronger exchange rate would be needed in the former case of strong economic conditions to mitigate the increases in import costs so that prices are kept relatively stable. However, the first stage pass‐through effects are asymmetric in a cyclical expansion as well. Specifically, a 1% appreciation would lead to a 0.24% decline in domestic import prices in this instance, compared to a larger 0.34% decline in
the average pass‐through outcome. In this case, an even stronger exchange rate is needed to counteract the overall cyclical exchange rate pass‐through effects. To put it more succinctly, monetary policy has to “lean more strongly against the wind” in a cyclical expansion that is accompanied by an increase in import costs. The preceding inference for monetary policy is nevertheless drawn solely from the exchange rate pass‐through effects. Exchange rate movements also affect domestic prices through another channel of the price transmission mechanism, namely the impact on export earnings. To maintain medium‐term price stability and sustained economic growth, any setting of exchange rate policy would obviously need to take into account the impact on growth and inflation arising from both channels. Otherwise, it could risk inducing greater volatility in growth and prices over the medium term.

Special Features 85
Monetary Authority of Singapore Economic Policy Department
The study also found significant asymmetric pass‐through effects across the business cycle. Importers pass on a smaller share of the cost savings arising from a stronger exchange rate amidst robust economic growth, than when costs increase as a result of a weaker exchange rate during a downturn. At the second stage, retailers would tend to be more aggressive in passing on import cost increases amidst strong economic growth. Two inferences for exchange rate policy emerge from the empirical findings. First, the exchange rate, in itself, remains a very effective tool in mitigating external price pressures at the borders, as importers quickly pass on the full cost savings arising from a stronger exchange rate.
Second, in view of the asymmetric pass‐through effects, monetary policy needs to “lean more strongly against the wind” in a cyclical expansion that is accompanied by an increase in import costs. It is important to note that exchange rate movements also affect domestic prices through their impact on export earnings. Thus, exchange rate policy has to take into consideration the impact of both price transmission channels, in order to achieve medium‐term price stability.
References Campa, J and Goldberg, L (2005), “Exchange Rate Pass‐through into Import Prices”, Review of Economics and Statistics, 87(4), pp. 679‐690. Campa, J and Goldberg, L (2006), “Distribution Margins, Imported Inputs and the Sensitivity of the CPI to Exchange Rates”, NBER Working Paper 12121.
Choudhri, E and Hakura, D (2006), “Exchange Rate Pass‐through to Domestic Prices: Does the Inflationary Environment Matter?”, Journal of International Money and Finance, 25(4), pp. 614‐639 Gagnon, J and Ihrig, J (2004), “Monetary Policy and Exchange Rate Pass‐through”, International Journal of Finance and Economics, 9, pp. 315‐38. Ihrig, J, Marazzi, M and Rothenberg, A (2006), “Exchange Rate Pass‐through in the G‐7 Countries”, Board of Governors of the Federal Reserve System, International Finance Discussion Papers, 851. Liu, L and Tsang, A (2008), “Exchange Rate Pass‐through to Domestic Inflation in Hong Kong”, Hong Kong Monetary Authority Working Paper, 02/2008. Marazzi, M and Sheet, N (2007), "Declining Exchange Rate Pass‐through to US Import Prices: The Potential Role of Global Factors", Journal of International Money and Finance, 26, pp. 924‐47. Mishkin, F (2008), “Exchange Rate Pass‐through and Monetary Policy”, Speech to the Norges Bank Conference on Monetary Policy, Oslo, Norway, 7 March; available at http://www.federalreserve.gov/newsevents/speech/mishkin20080307a.htm Monetary Authority of Singapore (2001a), “Box Item 3.1: Modelling Inflation Dynamics in Singapore”, Economics Department Quarterly Bulletin, Vol III Issue 1, pp.35‐37. Monetary Authority of Singapore (2001b), “Box Item 3.1: Investigating the Exchange Rate Pass‐through Relationship in Singapore”, Economics Department Quarterly Bulletin, Vol III Issue 3, pp.47‐54.
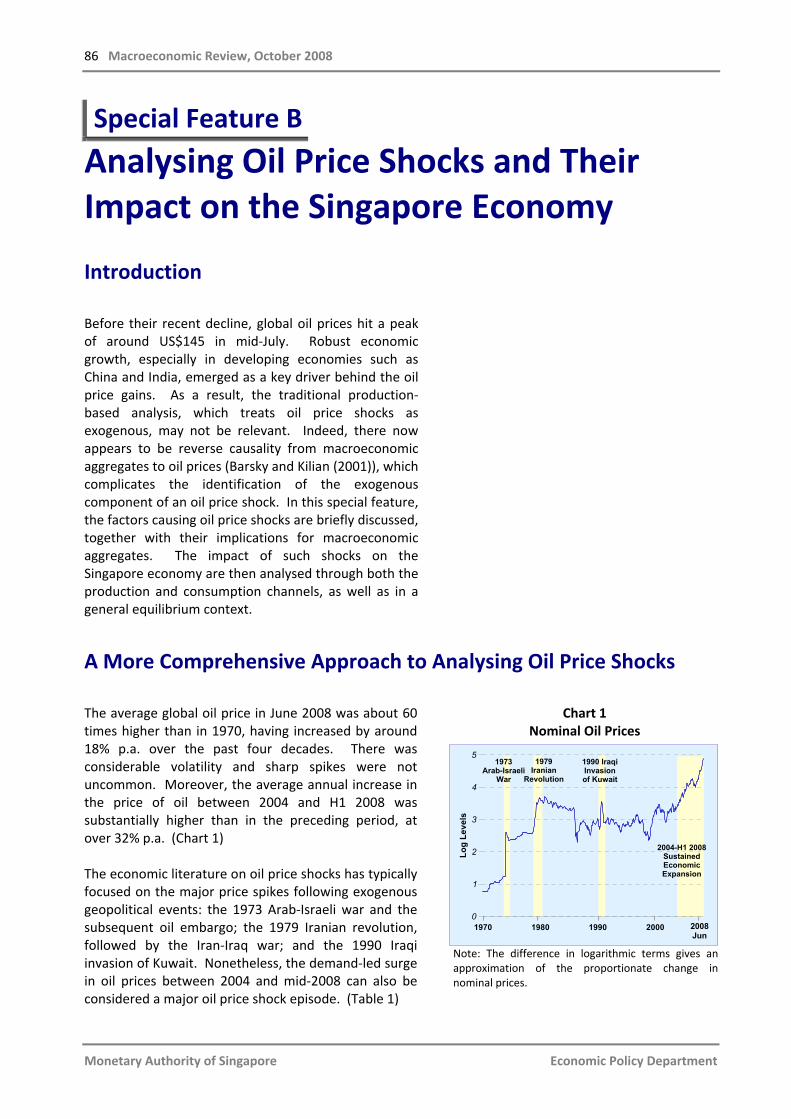
86 Macroeconomic Review, October 2008
Monetary Authority of Singapore Economic Policy Department
Analysing Oil Price Shocks and Their Impact on the Singapore Economy Introduction Before their recent decline, global oil prices hit a peak of around US$145 in mid‐July. Robust economic growth, especially in developing economies such as China and India, emerged as a key driver behind the oil price gains. As a result, the traditional production‐based analysis, which treats oil price shocks as exogenous, may not be relevant. Indeed, there now appears to be reverse causality from macroeconomic aggregates to oil prices (Barsky and Kilian (2001)), which complicates the identification of the exogenous component of an oil price shock. In this special feature, the factors causing oil price shocks are briefly discussed, together with their implications for macroeconomic aggregates. The impact of such shocks on the Singapore economy are then analysed through both the production and consumption channels, as well as in a general equilibrium context.
A More Comprehensive Approach to Analysing Oil Price Shocks The average global oil price in June 2008 was about 60 times higher than in 1970, having increased by around 18% p.a. over the past four decades. There was considerable volatility and sharp spikes were not uncommon. Moreover, the average annual increase in the price of oil between 2004 and H1 2008 was substantially higher than in the preceding period, at over 32% p.a. (Chart 1) The economic literature on oil price shocks has typically focused on the major price spikes following exogenous geopolitical events: the 1973 Arab‐Israeli war and the subsequent oil embargo; the 1979 Iranian revolution, followed by the Iran‐Iraq war; and the 1990 Iraqi invasion of Kuwait. Nonetheless, the demand‐led surge in oil prices between 2004 and mid‐2008 can also be considered a major oil price shock episode. (Table 1)
Chart 1 Nominal Oil Prices
2008 Jun
1970 1980 1990 2000
0
1
2
3
4
5
Log
Leve
ls
1973Arab-Israeli
War
1990 IraqiInvasion of Kuwait
1979 Iranian
Revolution
2004-H1 2008SustainedEconomic Expansion
Note: The difference in logarithmic terms gives an approximation of the proportionate change in nominal prices.
Special Feature B

Special Features 87
Monetary Authority of Singapore Economic Policy Department
Table 1 Price Dynamics in Each Oil Price Shock
Price Dynamics in Each Episode 1973‐1974 1979‐1980 1990 2004‐H1 2008
Total increase (%) 293 187 133 340
Pace of increase Within 1 month Within 12 months Within 4 months Over 4½ years
Kilian (2008) argues that oil price shocks have different effects on macroeconomic aggregates depending on their underlying causes. He identifies three different sources of oil price increases: (a) unexpected supply disruptions; (b) increases in aggregate demand for all industrial commodities including oil; and (c) precautionary demand shocks specific to oil. (Table 2) Drawing on detailed data work and econometric modelling to distinguish between these shocks over a four‐decade period, Kilian identifies the broad characteristics of different shock‐induced price hikes and their impact on macroeconomic aggregates. First, positive global demand conditions can offset the adverse effects of higher commodity prices on economic growth, which are endogenous to those demand conditions. This explains why higher oil prices in 2004‐H1 2008 have had less impact than in the early 1980s, and why they have co‐existed with strong economic growth for a relatively long period. Second, since market expectations adjust quickly to exogenous events, sharp increases in precautionary demand driven by uncertainty about future oil supply – rather than actual shortfalls in oil production – may well trigger immediate and large gains in oil prices.
For example, the increase in oil prices in 1990 after the invasion of Kuwait was almost entirely due to a spike in precautionary demand, not actual supply disruptions. Similarly, the 1979/80 oil price shock was not primarily due to supply disruptions as cutbacks associated with the Iranian revolution were largely offset by increased production elsewhere, although the outbreak of the Iran‐Iraq war in 1980 did initially generate a significant supply disruption. Instead, there was a strong increase in precautionary demand during that period as political instability in Iran, coupled with the Iranian hostage crisis and the Soviet invasion of Afghanistan, heightened fears that the oil fields in Iran and Saudi Arabia might be destroyed. Third, oil prices typically respond to a mix of shocks whose composition shifts over time. For instance, the rapid rise in oil prices after the Iranian revolution was motivated by both a rise in precautionary demand in 1979 and a gradual but strong increase in economic activity that started two years earlier. While the cumulative effect of the precautionary demand shock peaked prior to the Iran‐Iraq war and gradually subsided in the early 1980s, robust economic activity continued to sustain high oil prices. Supply disruptions thus only served to intensify some of these demand‐led price dynamics during this period. (Table 3)
Table 2
Types of Oil Price Shock and Their Impact on Macroeconomic Aggregates
Types of Shocks to Oil Prices Impact on Key Macroeconomic
Variables Unexpected Supply
Disruptions Increases in Aggregate Demand for All Industrial Commodities
Precautionary Demand Shocks Specific to Oil
Real Oil Price Small, sharp and transitory increase
Large and persistent increase with some delay
Immediate, large and persistent increase with some
overshooting
US CPI Inflation Largely flat Sustained increase with largest
deviation in the third year Sustained increase
US GDP Growth Small and transitory
decline Increase in the first year but below trend from second year onwards
Gradual decline with largest deviation in the third year
Source: Kilian (2008)
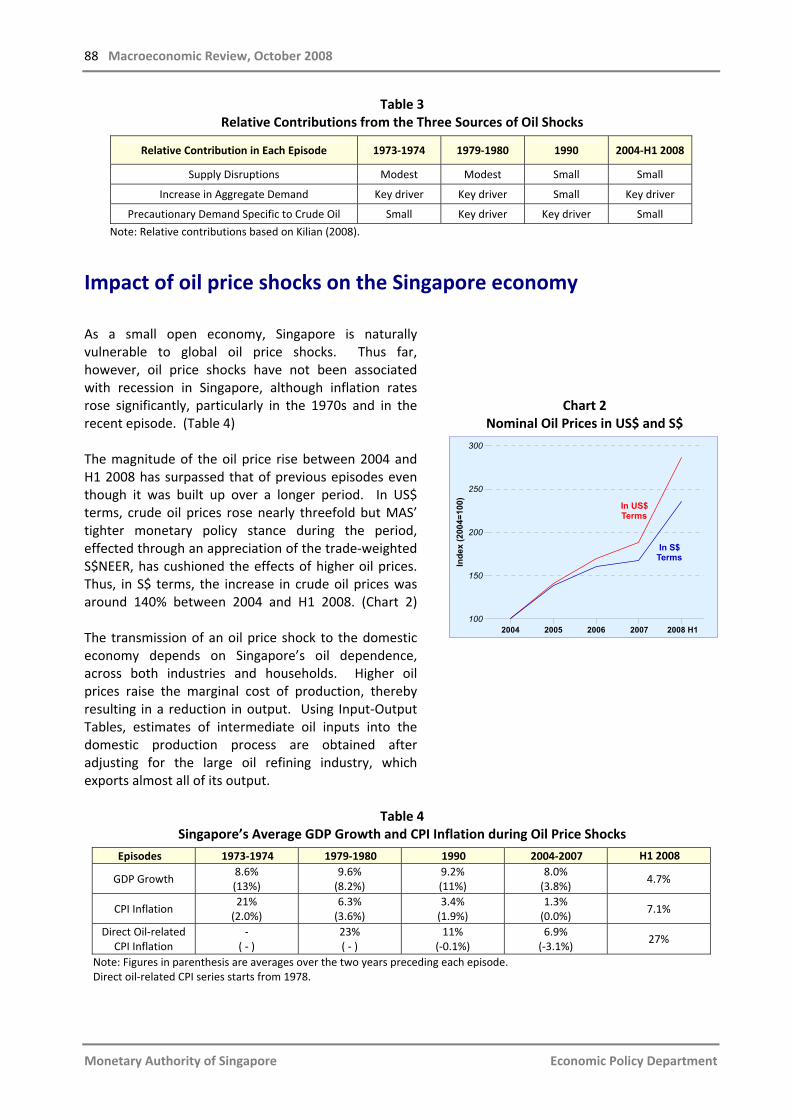
88 Macroeconomic Review, October 2008
Monetary Authority of Singapore Economic Policy Department
Table 3 Relative Contributions from the Three Sources of Oil Shocks
Relative Contribution in Each Episode 1973‐1974 1979‐1980 1990 2004‐H1 2008
Supply Disruptions Modest Modest Small Small
Increase in Aggregate Demand Key driver Key driver Small Key driver
Precautionary Demand Specific to Crude Oil Small Key driver Key driver Small
Note: Relative contributions based on Kilian (2008).
Impact of oil price shocks on the Singapore economy As a small open economy, Singapore is naturally vulnerable to global oil price shocks. Thus far, however, oil price shocks have not been associated with recession in Singapore, although inflation rates rose significantly, particularly in the 1970s and in the recent episode. (Table 4) The magnitude of the oil price rise between 2004 and H1 2008 has surpassed that of previous episodes even though it was built up over a longer period. In US$ terms, crude oil prices rose nearly threefold but MAS’ tighter monetary policy stance during the period, effected through an appreciation of the trade‐weighted S$NEER, has cushioned the effects of higher oil prices. Thus, in S$ terms, the increase in crude oil prices was around 140% between 2004 and H1 2008. (Chart 2) The transmission of an oil price shock to the domestic economy depends on Singapore’s oil dependence, across both industries and households. Higher oil prices raise the marginal cost of production, thereby resulting in a reduction in output. Using Input‐Output Tables, estimates of intermediate oil inputs into the domestic production process are obtained after adjusting for the large oil refining industry, which exports almost all of its output.
Chart 2 Nominal Oil Prices in US$ and S$
2004 2005 2006 2007 2008 H1100
150
200
250
300In
dex
(200
4=10
0)
In S$ Terms
In US$ Terms
Table 4
Singapore’s Average GDP Growth and CPI Inflation during Oil Price Shocks
Episodes 1973‐1974 1979‐1980 1990 2004‐2007 H1 2008
GDP Growth 8.6% (13%)
9.6% (8.2%)
9.2% (11%)
8.0% (3.8%)
4.7%
CPI Inflation 21% (2.0%)
6.3% (3.6%)
3.4% (1.9%)
1.3% (0.0%)
7.1%
Direct Oil‐related CPI Inflation
‐ ( ‐ )
23% ( ‐ )
11% (‐0.1%)
6.9% (‐3.1%)
27%
Note: Figures in parenthesis are averages over the two years preceding each episode. Direct oil‐related CPI series starts from 1978.

Special Features 89
Monetary Authority of Singapore Economic Policy Department
EPD calculates that Singapore’s oil dependence in production, i.e. the amount of oil used as intermediate inputs into the production process for each US$1 of real GDP, has declined by more than 10% since 2001. (Chart 3) In addition, Singapore’s overall oil dependence, i.e. the amount of oil used to produce US$1 of real GDP, is one of the lowest in the region, although it is higher than in other advanced economies which utilise more diverse sources of energy. (Chart 4)
Similarly, higher oil prices affect household consumption decisions by eroding their purchasing power. The degree to which this occurs is dependent on the share of oil‐related consumption in total household spending. This is estimated to have risen only slightly since 1993. (Chart 5) Compared to other economies, such as developing countries and those with colder climates, oil‐related items make up a relatively small part of Singapore’s CPI basket. (Chart 6)
Chart 3 Adjusted Oil Dependence in Production
Chart 4 Overall Oil Dependence
2001 2002 2003 2004 2005 2006 200784
88
92
96
100
Inde
x (2
001=
100)
Source: BP Statistical Review, Singapore Input‐Output Tables 2000, and EPD, MAS estimates
0
50
100
150
200
250
Inde
x (S
inga
pore
=100
)
Thailand
China
Indonesia
UK
Malaysia
France, Germany & Japan
SingaporeTaiwan
India
Hong KongUS
2007
Source: BP Statistical Review, Singapore Input‐Output Tables 2000, CEIC and EPD, MAS estimates Note: The figure for Singapore was adjusted to remove requirements of the domestic oil refining industry.
Chart 5
Share of Energy Consumption in Total Household Spending
Chart 6 Share of Oil‐related Items
in CPI Basket
1988 1993 1998 2003 2008 Q20
2
4
6
0
Per C
ent
Source: Household Expenditure Surveys, DOS Note: The figure for 2008 Q2 is based on EPD, MAS estimates.
4
8
12
16
Per C
ent
US, EU & Thailand
Indonesia
Taiwan
Malaysia
Singapore
South Korea
Hong Kong
JapanUK
Source: CEIC and EPD, MAS estimates Note: Shares are based on weights of electricity, gas, LPG, and petrol in the CPI basket.

90 Macroeconomic Review, October 2008
Monetary Authority of Singapore Economic Policy Department
Simulating the impact of a 10% increase in oil prices Drawing on Kilian’s insights on the nature of oil price shocks, EPD derived some impact multiplier estimates for key macroeconomic indicators of Singapore arising from an oil price shock. Specifically, a 10% increase in oil prices over four quarters was simulated using the Monetary Model of Singapore (MMS). Model inputs for external growth and inflation were adjusted using Kilian’s characterisation of recent and past oil shocks and their impact on macroeconomic aggregates. Given its computable general equilibrium characteristics, MMS was able to produce consistent estimates of the impact of higher oil prices on the production and consumption decisions of economic agents, including second‐round effects from capital and labour reallocation across sectors due to cutbacks in consumption expenditures and production. Chart 7 summarises the results. A 10% increase will reduce GDP growth by 0.1% point in year 1 as higher import costs dampen private consumption. Growth declines a further 0.6% point in year 2 as producers cut output owing to higher input costs and lower final demand. CPI inflation rises by 0.2% point in year 1 as prices of oil‐related items in the CPI basket increase. In year 2, CPI inflation rises by another 0.5% point as businesses pass on the higher costs to consumers.1
Chart 7 Impact on GDP Growth and CPI Inflation
from a 10% Increase in Oil Prices over 4 Quarters
GDP Growth CPI Inflation-0.8
-0.6
-0.4
-0.2
0.0
0.2
0.4
0.6
% P
oint
Dev
iatio
n Fr
om B
asel
ine
Year 1 Year 2
Sum‐up It is clear that the impact of oil price shocks on the global economy can vary with their underlying causes. In addition, the identification of the production and consumption channels, together with estimates of changing oil dependence over time, can provide a richer perspective to interpret the impact of oil price shocks on the economy. This special feature provides some evidence that Singapore’s dependence on oil on the output side has declined in recent years. In comparison, consumption dependence has largely remained the same. Finally, our simulations confirm the negative impact of a global oil price shock on Singapore’s growth and inflation dynamics, once suitable allowance is made for time lags.
1 IEA (2004) found that a sustained US$10 per barrel increase from a base scenario of US$25 per barrel would depress
OECD GDP growth by 0.4% point in both the first and second year, and raise the OECD CPI inflation rate by 0.5% point and 0.6% point in the first and second year, respectively.

Special Features 91
Monetary Authority of Singapore Economic Policy Department
References Barsky, R.B. and Kilian, L. (2001), “Do We Really Know that Oil Caused the Great Stagflation? A Monetary Alternative”, in Bernanke, B. and Rogoff, K. (eds.), NBER Macroeconomics Annual 2001, pp. 137‐183. International Energy Agency (2004), “Analysis of the Impact of Higher Oil Prices on the Global Economy”; available at http://www.iea.org/Textbase/Papers/2004/High_Oil_Prices.pdf Kilian, L (2008), Not All Oil Price Shocks Are Alike: Disentangling Demand and Supply Shocks in the Crude Oil Market, University of Michigan and CEPR.

92 Macroeconomic Review, October 2008
Monetary Authority of Singapore Economic Policy Department
Economic Benefits from International Cooperation on the Environment by Andrew K. Rose1
Countries, like people, interact with each other on a number of different dimensions. Some interactions are strictly economic; for instance, countries engage in international trade of goods, services, capital and labour. But most are not economic, at least not in any narrow sense. For instance, Singapore seeks to deter nuclear proliferation, stop the spread of narcotics, and so forth. Accordingly, Singapore, like other countries, participates in a number of institutions to further its foreign policy objectives; it has joined international organisations such as the International Atomic Energy Agency and Interpol. Environmental problems are undoubtedly among the most serious issues that stretch across national boundaries. Probably the most well known of these problems is the build up of greenhouse gases in the atmosphere, which is resulting in potentially disastrous climate change. If a country reduces its gas emissions by switching to green technologies, it bears all the costs but shares the benefits with the entire world. This makes a country less likely to reduce its emissions. Reducing the impact of such “externalities” is the primary reason for international environmental agreements (IEAs). International environmental agreements must meet two important criteria. First, countries must choose to enter into them voluntarily. Second, the agreements must be self‐enforcing. Since there is no international environmental police force, the members of an IEA must have the capacity and the willingness to respond to deviations by an individual country (or group of countries) from the rules of the treaty.
These criteria limit the potential for IEAs to improve environmental conditions. If the required amount of environmental improvement (reduction of gas emissions) deviates too far from that of the least motivated country, either that country will refuse to enter into the IEA, or the rules of the IEA will prove impossible to enforce. As such, countries that are considering an IEA are left with two undesirable options. First, they can limit the membership of the IEA to a small number of like‐minded nations. Alternatively, they can ease the environmental improvement sufficiently to match the desires of the least motivated member. Neither choice is particularly attractive. IEAs comprised of a small number of like‐minded nations are unlikely to include the most egregious polluters, and are thus unlikely to improve much on outcomes that the members could have attained unilaterally. But if the terms of the IEA are watered down to please the desires of the least motivated country in a large heterogeneous group, little overall improvement in environmental quality is likely to be achieved. This pessimistic outlook stems from the view that national governments make IEA membership and compliance decisions solely based on the merits of the environmental agreements themselves. However, in reality countries cooperate with each other on a number of additional dimensions: economic, strategic, and political. This raises the possibility of “reputation spillovers” across these arenas of interactions, whereby cooperative behaviour in one dimension of interaction may induce cooperative behaviour by other countries in other dimensions. These indirect benefits can be large.
1 Andrew K. Rose is Professor of International Business in the Haas School of Business at the University of California,
Berkeley (URL http://faculty.haas.berkeley.edu/arose). He visited EPD in August 2008 under MAS' Eminent Visitor Programme. He thanks the MAS and NUS for hospitality during the course of this work. This piece draws on research he conducted with Mark Spiegel of the Federal Reserve Bank of San Francisco.
Special Feature C
Special Features 93
Monetary Authority of Singapore Economic Policy Department
There are different reasons why IEAs can facilitate international economic exchanges. Helping your neighbours through environmental policy may, for instance, enhance a country’s perceived creditworthiness. Environmental agreements require up‐front investment whose benefits only accrue over time. Given this characteristic, the willingness of a nation to enter into an IEA provides a signal to foreign investors about the “patience”, or lack thereof, of that country’s government. A government like Singapore’s that is more willing to join an IEA also tends to discount the future at a low rate. Patience is also a desirable attribute for borrowers, as the benefits of defaulting on one’s debt obligations (an immediate cessation of debt payments) are commonly experienced immediately, while the costs of default (limited access to capital markets for some period of time) are only suffered over time. Sending a signal of patience through membership in an IEA therefore enhances the perceived creditworthiness of a nation and thus its borrowing capacity. An IEA also provides an additional arena for punishing a borrowing country for defaulting on its debt obligations. Countries are less likely to act badly in the economic sphere if they can be punished through environmental actions by foreigners. These ideas turn out to work in both theory and practice. Countries that make greater commitments to improve the environment through IEAs also engage in more international economic activity; they borrow, lend and trade more. Environmental engagement not only improves the environment, but also a country’s economy. There are thus indirect economic costs of unilateral actions and poor international citizenship. For instance, refusing to join an IEA inflicts costs over and above the purely domestic consequences of an environmental agreement. Accordingly, this line of reasoning has consequences for policy. For example, the debate over American participation in the Kyoto Protocol was framed solely in terms of the costs and benefits to the United States of participation in that treaty. However, the United States interacts with other nations in a variety of other domains,
such as security arrangements and international organisations. Perhaps the US would be finding Afghanistan and Iraq easier if it had considered the international fallout from Kyoto? Spillover benefits analogous to these may also exist in many other channels, potentially raising the overall gains from IEA membership. So … is there a cost to “going it alone”? Yes. It is inappropriate for countries to evaluate international environmental agreements without taking into account the indirect benefits of being a good citizen. Above and beyond the direct consequences of such entanglements, countries with greater IEA participation also find it easier to engage in the economic exchange of goods, services and assets, all of which come with associated benefits. Thus membership in international institutions brings indirect benefits; not joining such partnerships has costs.
*** Memberships in international environmental organisations yield costs and benefits. A country can gain directly from such interactions; its air might be cleaner, or there might be more fish in the sea. However, some gains can be indirect. Countries with long horizons and low discount rates like Singapore are more willing both to protect the environment and to maintain a reputation as a good credit risk. As they signal their discount rate through IEA activity, participation in IEAs indirectly yields economic gains. And as countries become more tightly tied into a web of international relationships, they fear that withdrawing from one domain (such as environmental cooperation), may adversely affect activities in an unrelated area (such as finance). The fear of these spillovers then encourages good behaviour in the first area. Both the signal and the fear of retaliation encourage good behaviour and good outcomes in both the economic and environmental arenas. As the problems which face us become increasingly global – climate change is the most dramatic example, but by no means the only one – countries should count not just the direct but also the indirect benefits from international engagement.
94 Macroeconomic Review, October 2008
Monetary Authority of Singapore Economic Policy Department
Statistical Appendix Table 1: Real GDP Growth by Sector Table 2: Real GDP Growth by Expenditure Table 3: Consumer Price Index
Table 4: Labour Market (I) Table 5: Labour Market (II) Table 6: External Trade Table 7: Non-oil Domestic Exports by Selected Countries
Table 8: Electronics Leading Index Table 9: Balance of Payments – Current Account Table 10: Balance of Payments – Capital & Financial Accounts
Table 11: Exchange Rates
Table 12: Singapore Dollar Nominal Effective Exchange Rate Index Table 13: Domestic Liquidity Indicator Table 14: Monetary
Table 15: Fiscal
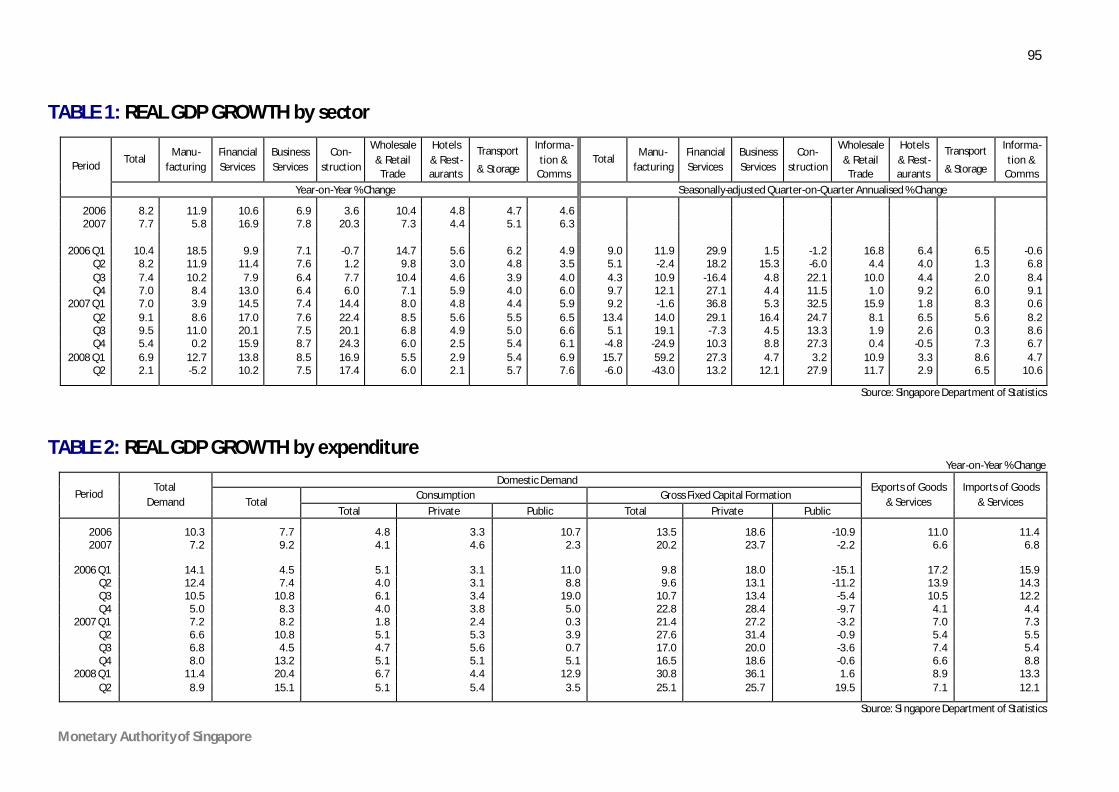
95
Monetary Authority of Singapore
TABLE 1: REAL GDP GROWTH by sector
Total Manu-
facturing Financial Services
Business Services
Con- struction
Wholesale & Retail
Trade
Hotels & Rest-aurants
Transport
& Storage
Informa-tion &
Comms Total
Manu-facturing
Financial Services
Business Services
Con- struction
Wholesale & Retail
Trade
Hotels & Rest-aurants
Transport
& Storage
Informa-tion &
Comms Period
Year-on-Year % Change Seasonally-adjusted Quarter-on-Quarter Annualised % Change
2006 8.2 11.9 10.6 6.9 3.6 10.4 4.8 4.7 4.6 2007 7.7 5.8 16.9 7.8 20.3 7.3 4.4 5.1 6.3
2006 Q1 10.4 18.5 9.9 7.1 -0.7 14.7 5.6 6.2 4.9 9.0 11.9 29.9 1.5 -1.2 16.8 6.4 6.5 -0.6
Q2 8.2 11.9 11.4 7.6 1.2 9.8 3.0 4.8 3.5 5.1 -2.4 18.2 15.3 -6.0 4.4 4.0 1.3 6.8 Q3 7.4 10.2 7.9 6.4 7.7 10.4 4.6 3.9 4.0 4.3 10.9 -16.4 4.8 22.1 10.0 4.4 2.0 8.4 Q4 7.0 8.4 13.0 6.4 6.0 7.1 5.9 4.0 6.0 9.7 12.1 27.1 4.4 11.5 1.0 9.2 6.0 9.1
2007 Q1 7.0 3.9 14.5 7.4 14.4 8.0 4.8 4.4 5.9 9.2 -1.6 36.8 5.3 32.5 15.9 1.8 8.3 0.6 Q2 9.1 8.6 17.0 7.6 22.4 8.5 5.6 5.5 6.5 13.4 14.0 29.1 16.4 24.7 8.1 6.5 5.6 8.2 Q3 9.5 11.0 20.1 7.5 20.1 6.8 4.9 5.0 6.6 5.1 19.1 -7.3 4.5 13.3 1.9 2.6 0.3 8.6 Q4 5.4 0.2 15.9 8.7 24.3 6.0 2.5 5.4 6.1 -4.8 -24.9 10.3 8.8 27.3 0.4 -0.5 7.3 6.7
2008 Q1 6.9 12.7 13.8 8.5 16.9 5.5 2.9 5.4 6.9 15.7 59.2 27.3 4.7 3.2 10.9 3.3 8.6 4.7 Q2 2.1 -5.2 10.2 7.5 17.4 6.0 2.1 5.7 7.6 -6.0 -43.0 13.2 12.1 27.9 11.7 2.9 6.5 10.6
Source: Singapore Department of Statistics
TABLE 2: REAL GDP GROWTH by expenditure Year-on-Year % Change
Domestic Demand Consumption Gross Fixed Capital Formation Period
Total Demand Total
Total Private Public Total Private Public
Exports of Goods & Services
Imports of Goods & Services
2006 10.3 7.7 4.8 3.3 10.7 13.5 18.6 -10.9 11.0 11.4 2007 7.2 9.2 4.1 4.6 2.3 20.2 23.7 -2.2 6.6 6.8
2006 Q1 14.1 4.5 5.1 3.1 11.0 9.8 18.0 -15.1 17.2 15.9
Q2 12.4 7.4 4.0 3.1 8.8 9.6 13.1 -11.2 13.9 14.3 Q3 10.5 10.8 6.1 3.4 19.0 10.7 13.4 -5.4 10.5 12.2 Q4 5.0 8.3 4.0 3.8 5.0 22.8 28.4 -9.7 4.1 4.4
2007 Q1 7.2 8.2 1.8 2.4 0.3 21.4 27.2 -3.2 7.0 7.3 Q2 6.6 10.8 5.1 5.3 3.9 27.6 31.4 -0.9 5.4 5.5 Q3 6.8 4.5 4.7 5.6 0.7 17.0 20.0 -3.6 7.4 5.4 Q4 8.0 13.2 5.1 5.1 5.1 16.5 18.6 -0.6 6.6 8.8
2008 Q1 11.4 20.4 6.7 4.4 12.9 30.8 36.1 1.6 8.9 13.3 Q2 8.9 15.1 5.1 5.4 3.5 25.1 25.7 19.5 7.1 12.1
Source: Si ngapore Department of Statistics
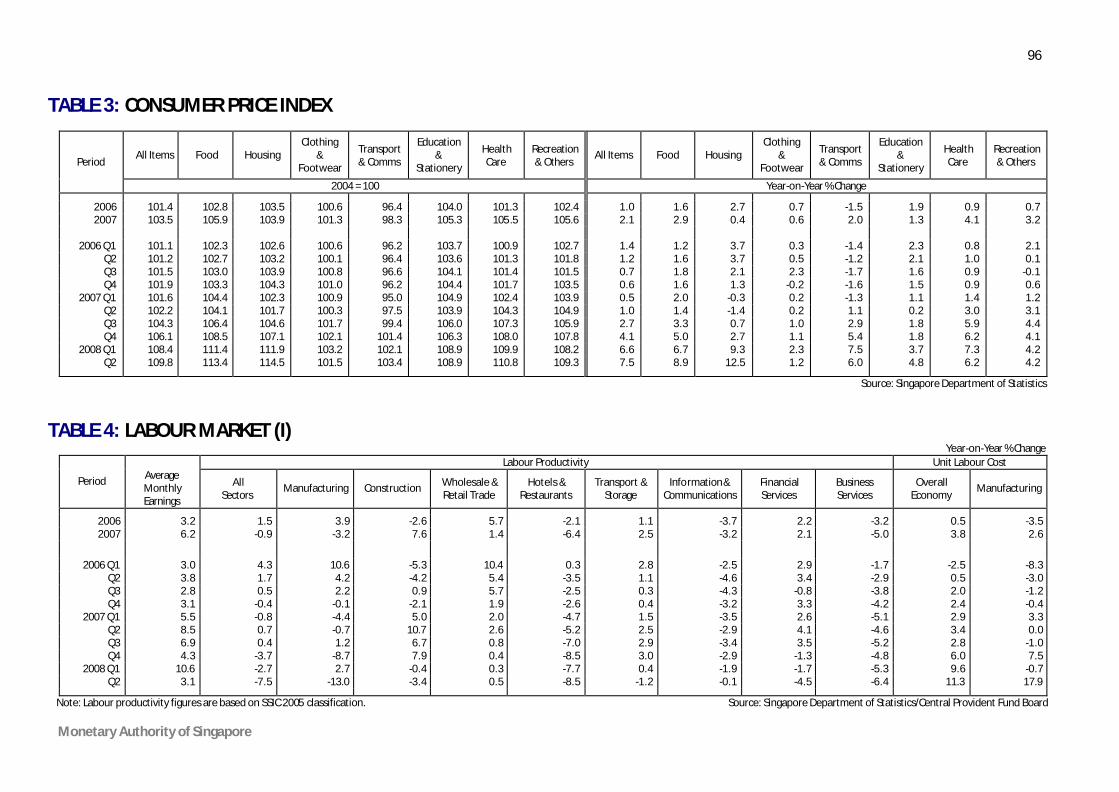
96
Monetary Authority of Singapore
TABLE 3: CONSUMER PRICE INDEX
Period
All Items Food Housing Clothing
& Footwear
Transport & Comms
Education &
Stationery
Health Care
Recreation & Others
All Items Food Housing Clothing
& Footwear
Transport & Comms
Education &
Stationery
Health Care
Recreation & Others
2004 = 100 Year-on-Year % Change
2006 101.4 102.8 103.5 100.6 96.4 104.0 101.3 102.4 1.0 1.6 2.7 0.7 -1.5 1.9 0.9 0.7 2007 103.5 105.9 103.9 101.3 98.3 105.3 105.5 105.6 2.1 2.9 0.4 0.6 2.0 1.3 4.1 3.2
2006 Q1 101.1 102.3 102.6 100.6 96.2 103.7 100.9 102.7 1.4 1.2 3.7 0.3 -1.4 2.3 0.8 2.1
Q2 101.2 102.7 103.2 100.1 96.4 103.6 101.3 101.8 1.2 1.6 3.7 0.5 -1.2 2.1 1.0 0.1 Q3 101.5 103.0 103.9 100.8 96.6 104.1 101.4 101.5 0.7 1.8 2.1 2.3 -1.7 1.6 0.9 -0.1 Q4 101.9 103.3 104.3 101.0 96.2 104.4 101.7 103.5 0.6 1.6 1.3 -0.2 -1.6 1.5 0.9 0.6
2007 Q1 101.6 104.4 102.3 100.9 95.0 104.9 102.4 103.9 0.5 2.0 -0.3 0.2 -1.3 1.1 1.4 1.2 Q2 102.2 104.1 101.7 100.3 97.5 103.9 104.3 104.9 1.0 1.4 -1.4 0.2 1.1 0.2 3.0 3.1 Q3 104.3 106.4 104.6 101.7 99.4 106.0 107.3 105.9 2.7 3.3 0.7 1.0 2.9 1.8 5.9 4.4 Q4 106.1 108.5 107.1 102.1 101.4 106.3 108.0 107.8 4.1 5.0 2.7 1.1 5.4 1.8 6.2 4.1
2008 Q1 108.4 111.4 111.9 103.2 102.1 108.9 109.9 108.2 6.6 6.7 9.3 2.3 7.5 3.7 7.3 4.2 Q2 109.8 113.4 114.5 101.5 103.4 108.9 110.8 109.3 7.5 8.9 12.5 1.2 6.0 4.8 6.2 4.2
Source: Singapore Department of Statistics
TABLE 4: LABOUR MARKET (I) Year-on-Year % Change
Labour Productivity Unit Labour Cost
Period
Average Monthly Earnings
All Sectors
Manufacturing Construction Wholesale & Retail Trade
Hotels & Restaurants
Transport & Storage
Information & Communications
Financial Services
Business Services
Overall Economy
Manufacturing
2006 3.2 1.5 3.9 -2.6 5.7 -2.1 1.1 -3.7 2.2 -3.2 0.5 -3.5 2007 6.2 -0.9 -3.2 7.6 1.4 -6.4 2.5 -3.2 2.1 -5.0 3.8 2.6
2006 Q1 3.0 4.3 10.6 -5.3 10.4 0.3 2.8 -2.5 2.9 -1.7 -2.5 -8.3
Q2 3.8 1.7 4.2 -4.2 5.4 -3.5 1.1 -4.6 3.4 -2.9 0.5 -3.0 Q3 2.8 0.5 2.2 0.9 5.7 -2.5 0.3 -4.3 -0.8 -3.8 2.0 -1.2 Q4 3.1 -0.4 -0.1 -2.1 1.9 -2.6 0.4 -3.2 3.3 -4.2 2.4 -0.4
2007 Q1 5.5 -0.8 -4.4 5.0 2.0 -4.7 1.5 -3.5 2.6 -5.1 2.9 3.3 Q2 8.5 0.7 -0.7 10.7 2.6 -5.2 2.5 -2.9 4.1 -4.6 3.4 0.0 Q3 6.9 0.4 1.2 6.7 0.8 -7.0 2.9 -3.4 3.5 -5.2 2.8 -1.0 Q4 4.3 -3.7 -8.7 7.9 0.4 -8.5 3.0 -2.9 -1.3 -4.8 6.0 7.5
2008 Q1 10.6 -2.7 2.7 -0.4 0.3 -7.7 0.4 -1.9 -1.7 -5.3 9.6 -0.7 Q2 3.1 -7.5 -13.0 -3.4 0.5 -8.5 -1.2 -0.1 -4.5 -6.4 11.3 17.9
Note: Labour productivity figures are based on SSIC 2005 classification. Source: Singapore Department of Statistics/Central Provident Fund Board
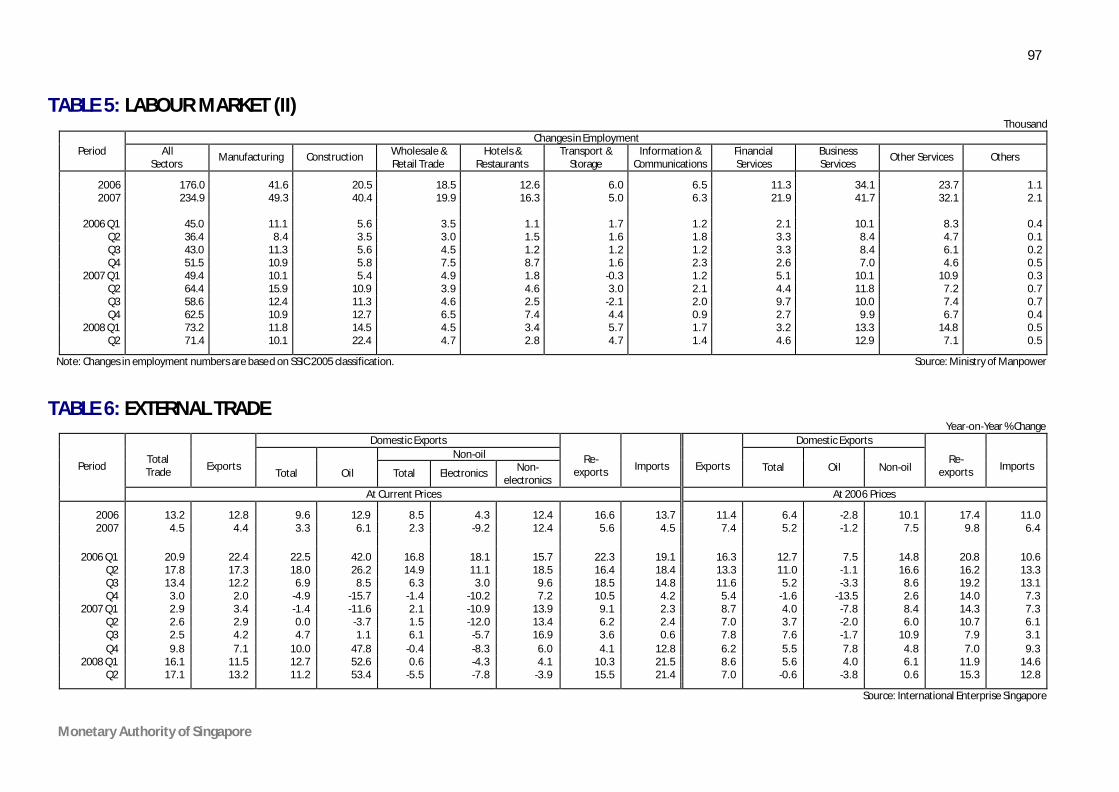
97
Monetary Authority of Singapore
TABLE 5: LABOUR MARKET (II) Thousand
Changes in Employment Period All
Sectors Manufacturing Construction Wholesale &
Retail Trade Hotels &
Restaurants Transport &
Storage Information &
Communications Financial Services
Business Services
Other Services Others
2006 176.0 41.6 20.5 18.5 12.6 6.0 6.5 11.3 34.1 23.7 1.1 2007 234.9 49.3 40.4 19.9 16.3 5.0 6.3 21.9 41.7 32.1 2.1
2006 Q1 45.0 11.1 5.6 3.5 1.1 1.7 1.2 2.1 10.1 8.3 0.4
Q2 36.4 8.4 3.5 3.0 1.5 1.6 1.8 3.3 8.4 4.7 0.1 Q3 43.0 11.3 5.6 4.5 1.2 1.2 1.2 3.3 8.4 6.1 0.2 Q4 51.5 10.9 5.8 7.5 8.7 1.6 2.3 2.6 7.0 4.6 0.5
2007 Q1 49.4 10.1 5.4 4.9 1.8 -0.3 1.2 5.1 10.1 10.9 0.3 Q2 64.4 15.9 10.9 3.9 4.6 3.0 2.1 4.4 11.8 7.2 0.7 Q3 58.6 12.4 11.3 4.6 2.5 -2.1 2.0 9.7 10.0 7.4 0.7 Q4 62.5 10.9 12.7 6.5 7.4 4.4 0.9 2.7 9.9 6.7 0.4
2008 Q1 73.2 11.8 14.5 4.5 3.4 5.7 1.7 3.2 13.3 14.8 0.5 Q2 71.4 10.1 22.4 4.7 2.8 4.7 1.4 4.6 12.9 7.1 0.5
Note: Changes in employment numbers are based on SSIC 2005 classification. Source: Ministry of Manpower
TABLE 6: EXTERNAL TRADE Year-on-Year % Change
Domestic Exports Domestic Exports Non-oil
Total Trade
Exports
Total
Oil Total Electronics Non- electronics
Re-
exports
Imports
Exports
Total
Oil
Non-oil
Re-
exports
Imports Period
At Current Prices At 2006 Prices
2006 13.2 12.8 9.6 12.9 8.5 4.3 12.4 16.6 13.7 11.4 6.4 -2.8 10.1 17.4 11.0 2007 4.5 4.4 3.3 6.1 2.3 -9.2 12.4 5.6 4.5 7.4 5.2 -1.2 7.5 9.8 6.4
2006 Q1 20.9 22.4 22.5 42.0 16.8 18.1 15.7 22.3 19.1 16.3 12.7 7.5 14.8 20.8 10.6 Q2 17.8 17.3 18.0 26.2 14.9 11.1 18.5 16.4 18.4 13.3 11.0 -1.1 16.6 16.2 13.3 Q3 13.4 12.2 6.9 8.5 6.3 3.0 9.6 18.5 14.8 11.6 5.2 -3.3 8.6 19.2 13.1 Q4 3.0 2.0 -4.9 -15.7 -1.4 -10.2 7.2 10.5 4.2 5.4 -1.6 -13.5 2.6 14.0 7.3
2007 Q1 2.9 3.4 -1.4 -11.6 2.1 -10.9 13.9 9.1 2.3 8.7 4.0 -7.8 8.4 14.3 7.3 Q2 2.6 2.9 0.0 -3.7 1.5 -12.0 13.4 6.2 2.4 7.0 3.7 -2.0 6.0 10.7 6.1 Q3 2.5 4.2 4.7 1.1 6.1 -5.7 16.9 3.6 0.6 7.8 7.6 -1.7 10.9 7.9 3.1 Q4 9.8 7.1 10.0 47.8 -0.4 -8.3 6.0 4.1 12.8 6.2 5.5 7.8 4.8 7.0 9.3
2008 Q1 16.1 11.5 12.7 52.6 0.6 -4.3 4.1 10.3 21.5 8.6 5.6 4.0 6.1 11.9 14.6 Q2 17.1 13.2 11.2 53.4 -5.5 -7.8 -3.9 15.5 21.4 7.0 -0.6 -3.8 0.6 15.3 12.8
Source: International Enterprise Singapore
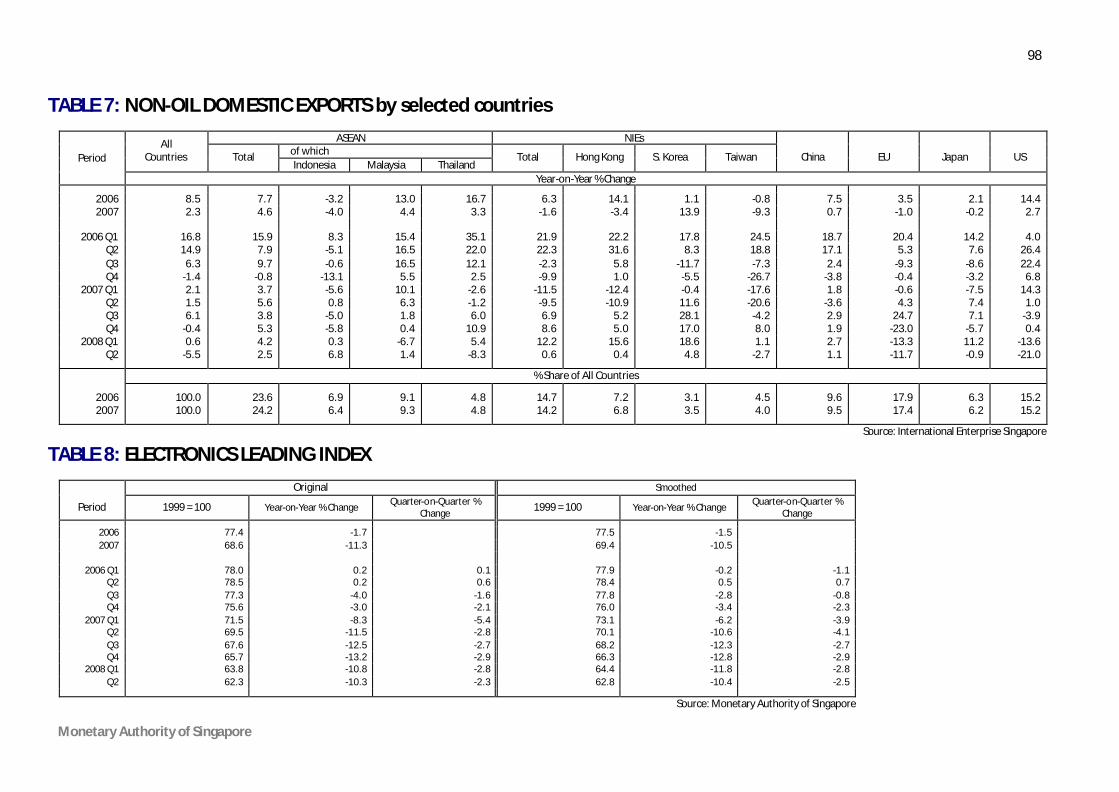
98
Monetary Authority of Singapore
TABLE 7: NON-OIL DOMESTIC EXPORTS by selected countries
ASEAN NIEs of which
All Countries Total
Indonesia Malaysia Thailand Total Hong Kong S. Korea Taiwan
China
EU
Japan
US Period
Year-on-Year % Change
2006 8.5 7.7 -3.2 13.0 16.7 6.3 14.1 1.1 -0.8 7.5 3.5 2.1 14.4 2007 2.3 4.6 -4.0 4.4 3.3 -1.6 -3.4 13.9 -9.3 0.7 -1.0 -0.2 2.7
2006 Q1 16.8 15.9 8.3 15.4 35.1 21.9 22.2 17.8 24.5 18.7 20.4 14.2 4.0
Q2 14.9 7.9 -5.1 16.5 22.0 22.3 31.6 8.3 18.8 17.1 5.3 7.6 26.4 Q3 6.3 9.7 -0.6 16.5 12.1 -2.3 5.8 -11.7 -7.3 2.4 -9.3 -8.6 22.4 Q4 -1.4 -0.8 -13.1 5.5 2.5 -9.9 1.0 -5.5 -26.7 -3.8 -0.4 -3.2 6.8
2007 Q1 2.1 3.7 -5.6 10.1 -2.6 -11.5 -12.4 -0.4 -17.6 1.8 -0.6 -7.5 14.3 Q2 1.5 5.6 0.8 6.3 -1.2 -9.5 -10.9 11.6 -20.6 -3.6 4.3 7.4 1.0 Q3 6.1 3.8 -5.0 1.8 6.0 6.9 5.2 28.1 -4.2 2.9 24.7 7.1 -3.9 Q4 -0.4 5.3 -5.8 0.4 10.9 8.6 5.0 17.0 8.0 1.9 -23.0 -5.7 0.4
2008 Q1 0.6 4.2 0.3 -6.7 5.4 12.2 15.6 18.6 1.1 2.7 -13.3 11.2 -13.6 Q2 -5.5 2.5 6.8 1.4 -8.3 0.6 0.4 4.8 -2.7 1.1 -11.7 -0.9 -21.0
% Share of All Countries
2006 100.0 23.6 6.9 9.1 4.8 14.7 7.2 3.1 4.5 9.6 17.9 6.3 15.2 2007 100.0 24.2 6.4 9.3 4.8 14.2 6.8 3.5 4.0 9.5 17.4 6.2 15.2
Source: International Enterprise Singapore
TABLE 8: ELECTRONICS LEADING INDEX
Original Smoothed
Period 1999 = 100 Year-on-Year % Change Quarter-on-Quarter %
Change 1999 = 100 Year-on-Year % Change
Quarter-on-Quarter % Change
2006 77.4 -1.7 77.5 -1.5 2007 68.6 -11.3 69.4 -10.5
2006 Q1 78.0 0.2 0.1 77.9 -0.2 -1.1
Q2 78.5 0.2 0.6 78.4 0.5 0.7 Q3 77.3 -4.0 -1.6 77.8 -2.8 -0.8 Q4 75.6 -3.0 -2.1 76.0 -3.4 -2.3
2007 Q1 71.5 -8.3 -5.4 73.1 -6.2 -3.9 Q2 69.5 -11.5 -2.8 70.1 -10.6 -4.1 Q3 67.6 -12.5 -2.7 68.2 -12.3 -2.7 Q4 65.7 -13.2 -2.9 66.3 -12.8 -2.9
2008 Q1 63.8 -10.8 -2.8 64.4 -11.8 -2.8 Q2 62.3 -10.3 -2.3 62.8 -10.4 -2.5
Source: Monetary Authority of Singapore
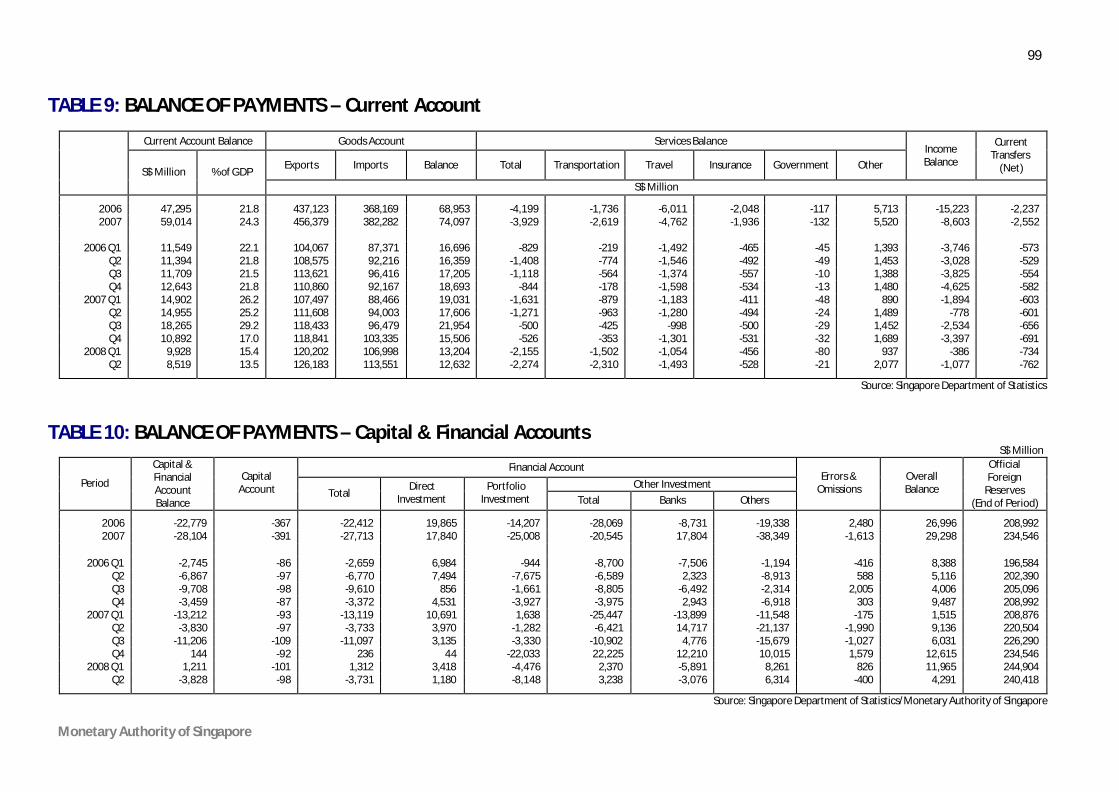
99
Monetary Authority of Singapore
TABLE 9: BALANCE OF PAYMENTS – Current Account
Current Account Balance Goods Account Services Balance
Exports Imports Balance Total Transportation Travel Insurance Government Other
Income Balance
Current Transfers
(Net) S$ Million % of GDP
S$ Million
2006 47,295 21.8 437,123 368,169 68,953 -4,199 -1,736 -6,011 -2,048 -117 5,713 -15,223 -2,237 2007 59,014 24.3 456,379 382,282 74,097 -3,929 -2,619 -4,762 -1,936 -132 5,520 -8,603 -2,552
2006 Q1 11,549 22.1 104,067 87,371 16,696 -829 -219 -1,492 -465 -45 1,393 -3,746 -573
Q2 11,394 21.8 108,575 92,216 16,359 -1,408 -774 -1,546 -492 -49 1,453 -3,028 -529 Q3 11,709 21.5 113,621 96,416 17,205 -1,118 -564 -1,374 -557 -10 1,388 -3,825 -554 Q4 12,643 21.8 110,860 92,167 18,693 -844 -178 -1,598 -534 -13 1,480 -4,625 -582
2007 Q1 14,902 26.2 107,497 88,466 19,031 -1,631 -879 -1,183 -411 -48 890 -1,894 -603 Q2 14,955 25.2 111,608 94,003 17,606 -1,271 -963 -1,280 -494 -24 1,489 -778 -601 Q3 18,265 29.2 118,433 96,479 21,954 -500 -425 -998 -500 -29 1,452 -2,534 -656 Q4 10,892 17.0 118,841 103,335 15,506 -526 -353 -1,301 -531 -32 1,689 -3,397 -691
2008 Q1 9,928 15.4 120,202 106,998 13,204 -2,155 -1,502 -1,054 -456 -80 937 -386 -734 Q2 8,519 13.5 126,183 113,551 12,632 -2,274 -2,310 -1,493 -528 -21 2,077 -1,077 -762
Source: Singapore Department of Statistics
TABLE 10: BALANCE OF PAYMENTS – Capital & Financial Accounts S$ Million
Financial Account
Other Investment Period
Capital & Financial Account Balance
Capital Account Total
Direct Investment
Portfolio Investment Total Banks Others
Errors & Omissions
Overall Balance
Official Foreign
Reserves (End of Period)
2006 -22,779 -367 -22,412 19,865 -14,207 -28,069 -8,731 -19,338 2,480 26,996 208,992 2007 -28,104 -391 -27,713 17,840 -25,008 -20,545 17,804 -38,349 -1,613 29,298 234,546
2006 Q1 -2,745 -86 -2,659 6,984 -944 -8,700 -7,506 -1,194 -416 8,388 196,584
Q2 -6,867 -97 -6,770 7,494 -7,675 -6,589 2,323 -8,913 588 5,116 202,390 Q3 -9,708 -98 -9,610 856 -1,661 -8,805 -6,492 -2,314 2,005 4,006 205,096 Q4 -3,459 -87 -3,372 4,531 -3,927 -3,975 2,943 -6,918 303 9,487 208,992
2007 Q1 -13,212 -93 -13,119 10,691 1,638 -25,447 -13,899 -11,548 -175 1,515 208,876 Q2 -3,830 -97 -3,733 3,970 -1,282 -6,421 14,717 -21,137 -1,990 9,136 220,504 Q3 -11,206 -109 -11,097 3,135 -3,330 -10,902 4,776 -15,679 -1,027 6,031 226,290 Q4 144 -92 236 44 -22,033 22,225 12,210 10,015 1,579 12,615 234,546
2008 Q1 1,211 -101 1,312 3,418 -4,476 2,370 -5,891 8,261 826 11,965 244,904 Q2 -3,828 -98 -3,731 1,180 -8,148 3,238 -3,076 6,314 -400 4,291 240,418
Source: Singapore Department of Statistics/Monetary Authority of Singapore

100
Monetary Authority of Singapore
TABLE 11: EXCHANGE RATES
Singapore Dollar Per End of Period US
Dollar Pound
Sterling EURO 100 Swiss
Franc 100 Japanese
Yen Malaysian
Ringgit Hong Kong
Dollar 100 New
Taiwan Dollar 100 Korean
Won Australian
Dollar
2006 1.5336 3.0102 2.0176 125.56 1.2887 0.4343 0.1973 4.7071 0.1649 1.2132 2007 1.4412 2.8798 2.1252 128.32 1.2871 0.4359 0.1847 4.4404 0.1540 1.2707
2006 Q1 1.6183 2.8247 1.9683 124.71 1.3783 0.4390 0.2085 4.9877 0.1660 1.1592
Q2 1.5894 2.9132 2.0198 128.88 1.3818 0.4325 0.2046 4.9039 0.1667 1.1776 Q3 1.5869 2.9792 2.0168 127.32 1.3469 0.4307 0.2037 4.8016 0.1680 1.1862 Q4 1.5336 3.0102 2.0176 125.56 1.2887 0.4343 0.1973 4.7071 0.1649 1.2132
2007 Q1 1.5172 2.9780 2.0241 124.75 1.2880 0.4390 0.1942 4.5869 0.1613 1.2251 Q2 1.5326 3.0684 2.0595 124.32 1.2421 0.4437 0.1961 4.6654 0.1656 1.2998 Q3 1.4909 3.0180 2.1123 127.34 1.2936 0.4363 0.1921 4.5538 0.1625 1.3157 Q4 1.4412 2.8798 2.1252 128.32 1.2871 0.4359 0.1847 4.4404 0.1540 1.2707
2008 Q1 1.3799 2.7529 2.1807 138.43 1.3814 0.4326 0.1773 4.5375 0.1390 1.2658 Q2 1.3616 2.7142 2.1493 133.65 1.2819 0.4168 0.1745 4.4846 0.1304 1.3101 Q3 1.4314 2.5775 2.0558 130.71 1.3732 0.4140 0.1843 4.4343 0.1178 1.1445
Source: Monetary Authority of Singapore
TABLE 12: SINGAPORE DOLLAR NOMINAL EFFECTIVE EXCHANGE RATE INDEX Index (5 Apr 2007=100)
As at Week Ending
Index As at Week Ending
Index As at Week Ending
Index As at Week Ending
Index As at Week Ending
Index As at Week Ending
Index
2007 Apr 5 100.00 2007 Jul 6 98.94 2007 Oct 5 100.54 2008 Jan 4 101.83 2008 Apr 4 102.61 2008 J ul 4 105.38
13 99.57 13 98.88 12 100.99 11 101.68 11 104.10 11 105.12 20 99.72 20 98.94 19 100.87 18 101.44 18 104.62 18 105.36 27 99.36 27 99.13 26 101.14 25 102.07 25 104.31 25 105.09
May 4 99.32 Aug 3 98.89 Nov 2 101.35 Feb 1 102.07 May 2 104.63 Aug 1 104.80 11 99.08 10 98.90 9 101.26 6 102.05 9 104.46 8 103.71 18 98.72 17 98.64 16 101.17 15 102.19 16 104.52 15 103.57 25 98.46 24 99.01 23 101.57 22 102.33 23 104.95 22 103.91
Jun 1 98.39 31 99.04 30 101.37 29 102.27 30 104.85 29 103.98 8 98.25 Sep 7 98.75 Dec 7 101.51 Mar 7 102.34 Jun 6 104.98 Sep 5 103.63
15 98.22 14 99.24 14 101.59 14 102.54 13 104.69 12 104.07 22 98.21 21 99.00 21 101.29 20 102.31 20 105.25 19 103.77 29 98.53 28 99.76 28 101.52 28 102.67 27 105.05 26 103.60
Oct 3 103.49
Source: Monetary Authority of Singapore
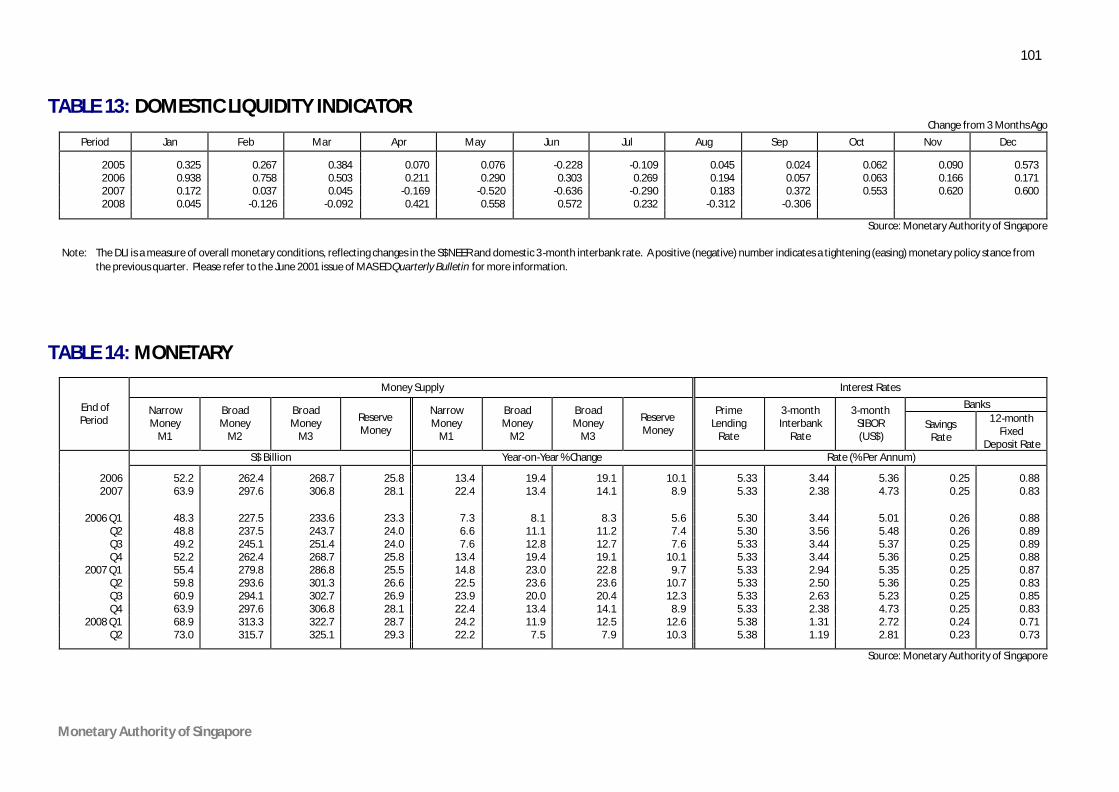
101
Monetary Authority of Singapore
TABLE 13: DOMESTIC LIQUIDITY INDICATOR Change from 3 Months Ago
Period Jan Feb Mar Apr May Jun Jul Aug Sep Oct Nov Dec
2005 0.325 0.267 0.384 0.070 0.076 -0.228 -0.109 0.045 0.024 0.062 0.090 0.573 2006 0.938 0.758 0.503 0.211 0.290 0.303 0.269 0.194 0.057 0.063 0.166 0.171 2007 0.172 0.037 0.045 -0.169 -0.520 -0.636 -0.290 0.183 0.372 0.553 0.620 0.600 2008 0.045 -0.126 -0.092 0.421 0.558 0.572 0.232 -0.312 -0.306
Source: Monetary Authority of Singapore
Note: The DLI is a measure of overall monetary conditions, reflecting changes in the S$NEER and domestic 3-month interbank rate. A positive (negative) number indicates a tightening (easing) monetary policy stance from
the previous quarter. Please refer to the June 2001 issue of MAS ED Quarterly Bulletin for more information.
TABLE 14: MONETARY
Money Supply Interest Rates
Banks End of Period
Narrow Money
M1
Broad Money
M2
Broad Money
M3
Reserve Money
Narrow Money
M1
Broad Money
M2
Broad Money
M3
Reserve Money
Prime Lending
Rate
3-month Interbank
Rate
3-month SIBOR (US$)
Savings Rate
12-month Fixed
Deposit Rate S$ Billion Year-on-Year % Change Rate (% Per Annum)
2006 52.2 262.4 268.7 25.8 13.4 19.4 19.1 10.1 5.33 3.44 5.36 0.25 0.88 2007 63.9 297.6 306.8 28.1 22.4 13.4 14.1 8.9 5.33 2.38 4.73 0.25 0.83
2006 Q1 48.3 227.5 233.6 23.3 7.3 8.1 8.3 5.6 5.30 3.44 5.01 0.26 0.88
Q2 48.8 237.5 243.7 24.0 6.6 11.1 11.2 7.4 5.30 3.56 5.48 0.26 0.89 Q3 49.2 245.1 251.4 24.0 7.6 12.8 12.7 7.6 5.33 3.44 5.37 0.25 0.89 Q4 52.2 262.4 268.7 25.8 13.4 19.4 19.1 10.1 5.33 3.44 5.36 0.25 0.88
2007 Q1 55.4 279.8 286.8 25.5 14.8 23.0 22.8 9.7 5.33 2.94 5.35 0.25 0.87 Q2 59.8 293.6 301.3 26.6 22.5 23.6 23.6 10.7 5.33 2.50 5.36 0.25 0.83 Q3 60.9 294.1 302.7 26.9 23.9 20.0 20.4 12.3 5.33 2.63 5.23 0.25 0.85 Q4 63.9 297.6 306.8 28.1 22.4 13.4 14.1 8.9 5.33 2.38 4.73 0.25 0.83
2008 Q1 68.9 313.3 322.7 28.7 24.2 11.9 12.5 12.6 5.38 1.31 2.72 0.24 0.71 Q2 73.0 315.7 325.1 29.3 22.2 7.5 7.9 10.3 5.38 1.19 2.81 0.23 0.73
Source: Monetary Authority of Singapore
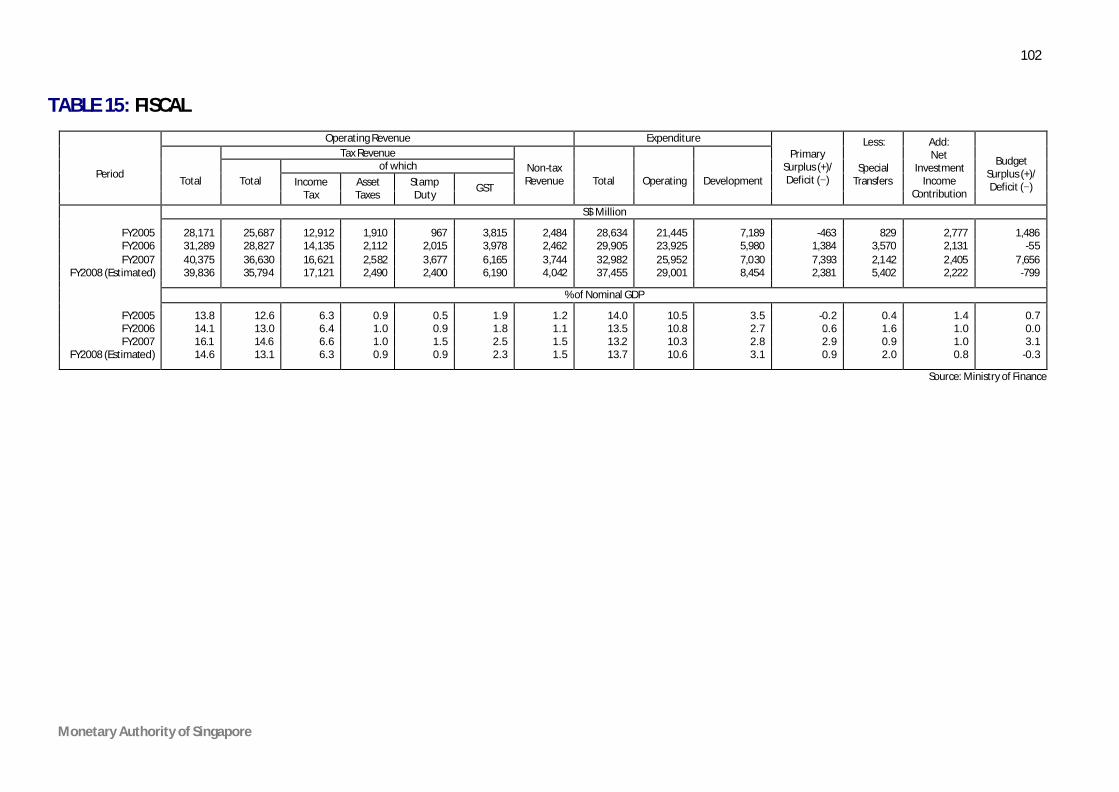
102
Monetary Authority of Singapore
TABLE 15: FISCAL
Operating Revenue Expenditure
Tax Revenue of which
Period Total Total Income
Tax Asset Taxes
Stamp Duty
GST
Non-tax Revenue
Total
Operating
Development
Primary Surplus (+)/ Deficit (−)
Less:
Special Transfers
Add: Net
Investment Income
Contribution
Budget
Surplus (+)/ Deficit (−)
S$ Million
FY2005 28,171 25,687 12,912 1,910 967 3,815 2,484 28,634 21,445 7,189 -463 829 2,777 1,486 FY2006 31,289 28,827 14,135 2,112 2,015 3,978 2,462 29,905 23,925 5,980 1,384 3,570 2,131 -55 FY2007 40,375 36,630 16,621 2,582 3,677 6,165 3,744 32,982 25,952 7,030 7,393 2,142 2,405 7,656
FY2008 (Estimated) 39,836 35,794 17,121 2,490 2,400 6,190 4,042 37,455 29,001 8,454 2,381 5,402 2,222 -799 % of Nominal GDP FY2005 13.8 12.6 6.3 0.9 0.5 1.9 1.2 14.0 10.5 3.5 -0.2 0.4 1.4 0.7
FY2006 14.1 13.0 6.4 1.0 0.9 1.8 1.1 13.5 10.8 2.7 0.6 1.6 1.0 0.0 FY2007 16.1 14.6 6.6 1.0 1.5 2.5 1.5 13.2 10.3 2.8 2.9 0.9 1.0 3.1
FY2008 (Estimated) 14.6 13.1 6.3 0.9 0.9 2.3 1.5 13.7 10.6 3.1 0.9 2.0 0.8 -0.3
Source: Ministry of Finance

List of Selected Publications 103
Monetary Authority of Singapore Economic Policy Department
List of Selected Publications
Title Frequency Online Links
Inflation Monthly Monthly http://www.mas.gov.sg/eco_research/eco_dev_ana/Inflation_ Monthly.html
Monthly Statistical Bulletin Monthly
http://www.mas.gov.sg/data_room/msb/Monthly_Statistical_ Bulletin.html
Recent Economic Developments Quarterly
http://www.mas.gov.sg/eco_research/eco_dev_ana/Recent_ Economic_Developments.html
Survey of Professional Forecasters Quarterly http://www.mas.gov.sg/eco_research/surveys/Survey.html
Macroeconomic Review Semi-annual http://www.mas.gov.sg/publications/macro_review/index.html
Monetary Policy Statements Semi-annual
http://www.mas.gov.sg/eco_research/policy_issues/Monetary_ Policy_Statements.html
Financial Stability Review Annual http://www.mas.gov.sg/publications/MAS_FSR.html
Economics Explorer Occasional
http://www.mas.gov.sg/eco_research/eco_education/Economic_ Explorer_Series.html
Monographs Occasional
http://www.mas.gov.sg/publications/monographs/Info_Papers_and_ Monographs.html#monographs
Staff Papers Occasional http://www.mas.gov.sg/publications/staff_papers/index.html
Monographs
Title Date Online Links
MAS’ Framework for Impact and Risk Assessment of Financial Institutions Apr 2007
http://www.mas.gov.sg/publications/monographs/Framework_for_ Impact_and_Risk_Assessment_of_Financial_Institutions.html
Monetary Policy Operations in Singapore Apr 2007
http://www.mas.gov.sg/publications/monographs/Monetary_Policy_ Operations_in_Singapore.html
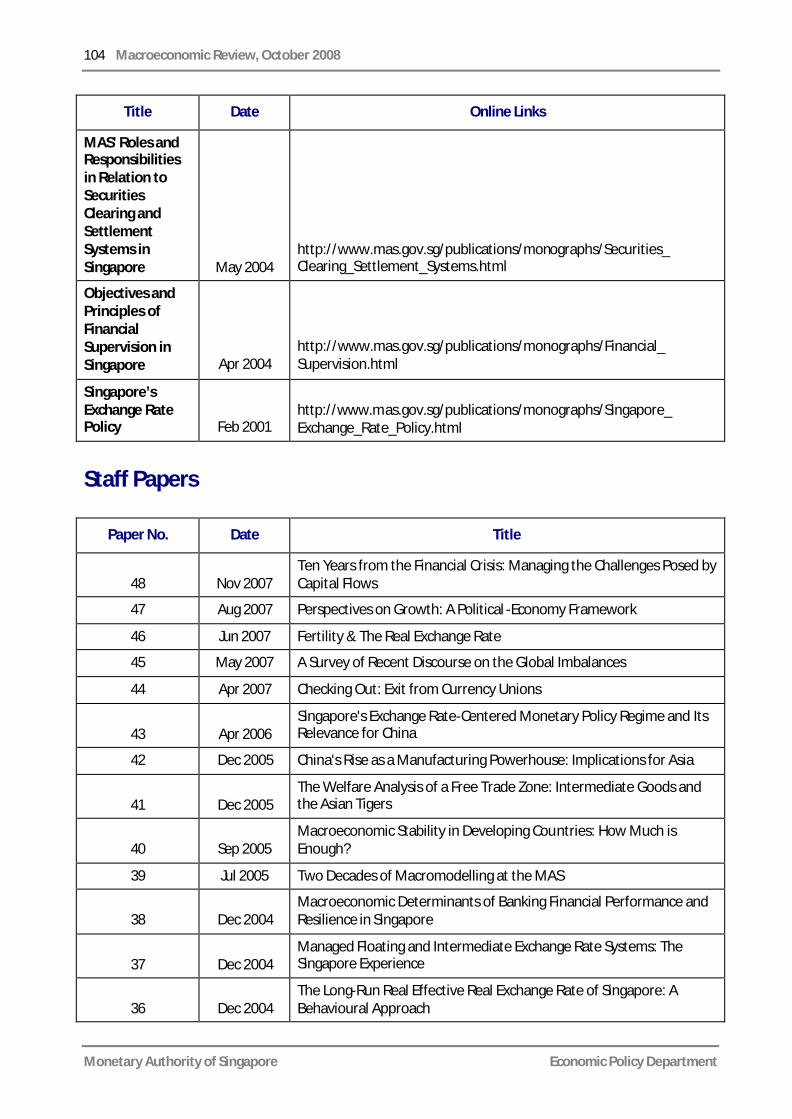
104 Macroeconomic Review, October 2008
Monetary Authority of Singapore Economic Policy Department
Title Date Online Links
MAS' Roles and Responsibilities in Relation to Securities Clearing and Settlement Systems in Singapore May 2004
http://www.mas.gov.sg/publications/monographs/Securities_ Clearing_Settlement_Systems.html
Objectives and Principles of Financial Supervision in Singapore Apr 2004
http://www.mas.gov.sg/publications/monographs/Financial_ Supervision.html
Singapore’s Exchange Rate Policy Feb 2001
http://www.mas.gov.sg/publications/monographs/Singapore_ Exchange_Rate_Policy.html
Staff Papers
Paper No. Date Title
48 Nov 2007 Ten Years from the Financial Crisis: Managing the Challenges Posed by Capital Flows
47 Aug 2007 Perspectives on Growth: A Political -Economy Framework
46 Jun 2007 Fertility & The Real Exchange Rate
45 May 2007 A Survey of Recent Discourse on the Global Imbalances
44 Apr 2007 Checking Out: Exit from Currency Unions
43 Apr 2006 Singapore's Exchange Rate-Centered Monetary Policy Regime and Its Relevance for China
42 Dec 2005 China's Rise as a Manufacturing Powerhouse: Implications for Asia
41 Dec 2005 The Welfare Analysis of a Free Trade Zone: Intermediate Goods and the Asian Tigers
40 Sep 2005 Macroeconomic Stability in Developing Countries: How Much is Enough?
39 Jul 2005 Two Decades of Macromodelling at the MAS
38 Dec 2004 Macroeconomic Determinants of Banking Financial Performance and Resilience in Singapore
37 Dec 2004 Managed Floating and Intermediate Exchange Rate Systems: The Singapore Experience
36 Dec 2004 The Long-Run Real Effective Real Exchange Rate of Singapore: A Behavioural Approach

List of Selected Publications 105
Monetary Authority of Singapore Economic Policy Department
Paper No. Date Title
35 Nov 2004 Review of Literature & Empirical Research: Is Board Diversity Important for Corporate Governance and Firm Value?
34 Aug 2004 FSAP Stress Testing: Singapore’s Experience
33 Aug 2004 Singapore’s Balance of Payments, 1965 to 2003: An Analysis
32 Jul 2004 Case Study on Pan-Electric Crisis
31 Jun 2004 Singapore’s Unique Monetary Policy: How Does It Work?
30 May 2004 Using Leading Indicators to Forecast the Singapore Electronics Industry
29 Mar 2004 Review of Literature & Empirical Research on Corporate Governance
28 Feb 2004 Why Has There Been Less Financial Integration In Asia Than In Europe?
27 Feb 2004 Does The WTO Make Trade More Stable?
26 Jan 2004 Education for Growth: The Premium on Education and Work Experience in Singapore
25 Jun 2003 Investigating the Relationship between Exchange Rate Volatility and Macroeconomic Volatility In Singapore
24 Sep 2002 Do We Really Know That The WTO Increases Trade?
23 Sep 2002 Assessing Singapore’s Export Competitiveness Through Dynamic Shift-Share Analysis
22 Aug 2002 The Effect of Common Currencies on International Trade: Where Do We Stand?
21 Dec 2000 Kicking the Habit and Turning Over A New Leaf: Monetary Policy in East Asia After the Currency Crisis
20 May 2000 Financial Market Integration in Singapore: The Narrow and the Broad Views
19 Feb 2000 Exchange Rate Policy in East Asia After The Fall: How Much Have Things Changed?
18 Jan 2000 A Survey of Singapore's Monetary History
17 Nov 1999
Extracting Market Expectations of Future Interest Rates from the Yield Curve: An Application Using Singapore Interbank and Interest Rate Swap Data
16 Sep 1999 Interbank Interest Rate Determination in Singapore and its Linkages to Deposit and Prime Rates
15 Jul 1999 Money, Interest Rates And Income In The Singapore Economy
14 Jun 1999 The Petrochemical Industry in Singapore
13 May 1999 How Well Did the Forward Market Anticipate the Asian Currency Crisis: The Case of Four ASEAN Currencies
12 May 1999 The Term Structure of Interest Rates, Inflationary Expectations and Economic Activity: Some Recent US Evidence

106 Macroeconomic Review, October 2008
Monetary Authority of Singapore Economic Policy Department
Paper No. Date Title
11 Mar 1999 Capital Account and Exchange Rate Management in a Surplus Economy: The Case of Singapore
10 Dec 1998 Measures of Core Inflation for Singapore
9 Oct 1998 Export Competition Among Asian NIEs, 1991-96: An Assessment
8 Oct 1998 The Impact of the Asian Crisis on China: An Assessment
7 Aug 1998 Singapore's Trade Linkages, 1992-96: Trends and Implications
6 May 1998 What Lies Behind Singapore's Real Exchange Rate? An Empirical Analysis of the Purchasing Power Parity Hypothesis
5 May 1998 Singapore’s Services Sector in Perspective: Trends and Outlook
4 Feb 1998 Growth in Singapore's Export Markets, 1991-96: A Shift-Share Analysis
3 Dec 1997 Whither the Renminbi?
2 Aug 1997 Quality of Employment Growth in Singapore: 1983-96
1 Jan 1997 Current Account Deficits in the ASEAN-3: Is there Cause for Concern?

MARKETASIA DISTRIBUTORS (S) PTE LTD601 Sims Drive #04-05 Pan-I Complex Singapore 387382 Tel: (65) 6744 8483 Fax: (65) 6744 3690
Email: [email protected] VISIT OUR WEBSITE @ http://www.marketasia.com.sg
Subscription Form Yes! I wish to subscribe to the Macroeconomic Review
SUBSCRIPTION RATES
Country 1 Year ( Vol VIII, Issues 1 & 2)
Singapore S$ 28.00
Name:
Company:
Address:
Job Title:
Postalcode:
Telephone: Fax:
E-mail:
Payment Options:Cheque/ Draft in Singapore Dollars (made payable to MarketAsia Distributors (S) Pte Ltd)
Credit Card Visa MasterCard Amex
Credit Card No:
Name (as appears on card):
Expiry Date: Signature:
I authorise the indicated amount to be charged to my credit card.
Please complete this subscription form and mail to:
Others S$ 75.00(Inclusive of GST)
(Inclusive of postage and handling)
GST REG No. M2-0077937-1