maryland poverty profiles - home - maryland alliance...
TRANSCRIPT
2018Maryland Poverty Profiles
MEMBER AGENCIESAdvocates for Children and YouthBaltimore Jewish CouncilBehavioral Health Systems Baltimore CASA of Maryland Inc.Catholic CharitiesFamily League of BaltimoreFuel Fund of MarylandHealthCare Access MarylandHealth Care for the HomelessHomeless Persons Representation ProjectInterfaith WorksJewish Community Relations Council of Greater WashingtonJob Opportunities Task ForceLeague of Women Voters of MarylandCASH Campaign MarylandMaryland Catholic ConferenceMaryland Center on Economic PolicyMaryland Community Action PartnershipMaryland Family NetworkMaryland Hunger SolutionsNational Council on Alcoholism & Drug Dependence — Maryland ChapterPaul’s PlacePublic Justice CenterSt. Vincent de Paul of BaltimoreWelfare Advocates
MARYLAND ALLIANCE FOR THE POORLisa Klingenmaier, Co-ChairP: 410/261-6783C: 443/931-8920E: [email protected]
Sarah Mersky, Co-ChairP: 410/542-4850C: 610-246-0075E: [email protected]
T: @MAPAdvocacyW: www.mapadvocacy.org
MAP would like to thank the Baltimore Jewish Council and Staiman Design for designing the 2018 Poverty Profiles
Maryland Poverty Profiles 1
Maryland at a GlanceFor the last 30 years, the Maryland Alliance for the Poor (MAP) has worked with many members of the General Assembly to create policies and programs that make things a little easier for families in our state who are struggling to make ends meet. Together, we have accomplished some great things!
In its early years, MAP would submit its own proposed budget driving the conversation about safety net funding in Maryland. We helped shape the conversation around welfare reform in the 1990s, which led to Maryland creating a more effective program than most other states. We have helped make Maryland’s Earned Income Tax Credit one of the strongest in the country. We were instrumental in the creation of the Service Linked Housing program, Maryland Meals for Achievement, and the Maryland Medicaid Advisory Committee, among others. And, we have helped ensure that the state maintained funding for our safety net programs during economic downturns, a time when people need help the most.
Because our legislature has been willing to consider the needs of people experiencing poverty and take action to improve state policies, Maryland is better off than many
other states. At the same time, we all know we have much more work to do as we fight the headwinds of federal policy changes and a rapidly changing economy.
The fact is, despite our best efforts, there are more people experiencing poverty now than there were 30 years ago. Maryland’s poverty rate is 19 percent higher than it was in 1990 – a year that the U.S. economy entered a recession – and there are nearly 200,000 more Marylanders trying to get by on incomes below the federal poverty line. Nearly every county in the state has a higher poverty rate than it had in 1990.
While unemployment rates have continued to decline since the Great Recession, wages often aren’t high enough to support a family. When Maryland’s minimum wage reaches $10.10 this summer, it will mean someone working full time can earn just one-third of the income needed to afford a two-bedroom apartment in Maryland.
As you will see in the following pages, many Marylanders also face additional hurdles because of their race, ethnicity, gender, or where they live. Black and Latino Marylanders have a much higher poverty rate than the state as a whole, as do women. And some Maryland communities face higher concentrations of poverty than others.
MAP has compiled the Maryland Poverty Profiles since 1990 as a way to reflect the daily challenges of these hundreds thousands of families in Maryland and each of its 24 local jurisdictions. As we reflect on MAP’s 30th anniversary, this year’s edition also includes poverty data from 1990 for each county. The Poverty Profiles also show how many state programs – like cash assistance, housing assistance, nutrition assistance, and child care vouchers – are essential tools that help people meet their basic needs. While these programs aren’t perfect, and often reach a fraction of the people who need them, the data show how important it is to maintain these services and build on their success.
We hope this information will help inform the ongoing conversations about how we can ensure that everyone in our state is able to have a roof over their heads, sufficient food on the table, and the opportunity to thrive. Maryland has a history of supporting effective programs that help lift people out of poverty. MAP believes that, working together, our state can do even better. We strongly support efforts to address the state’s many unmet needs and invest in the success of all Marylanders.
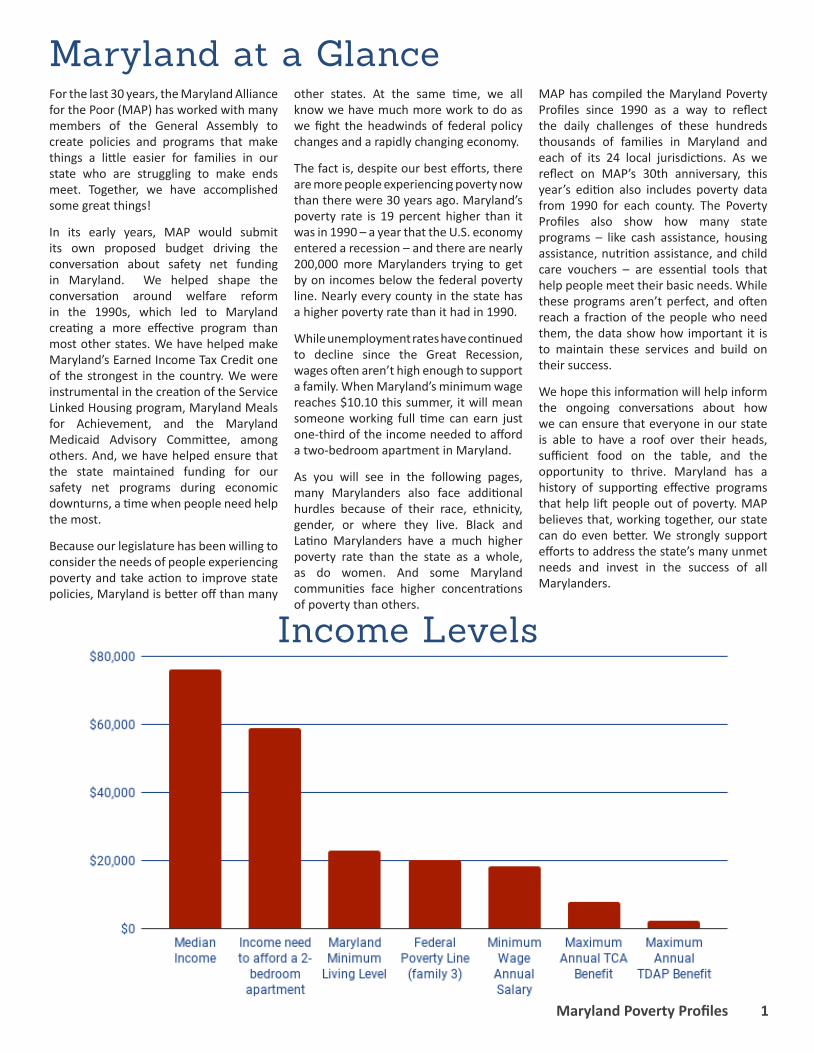
Income Levels
2
Income
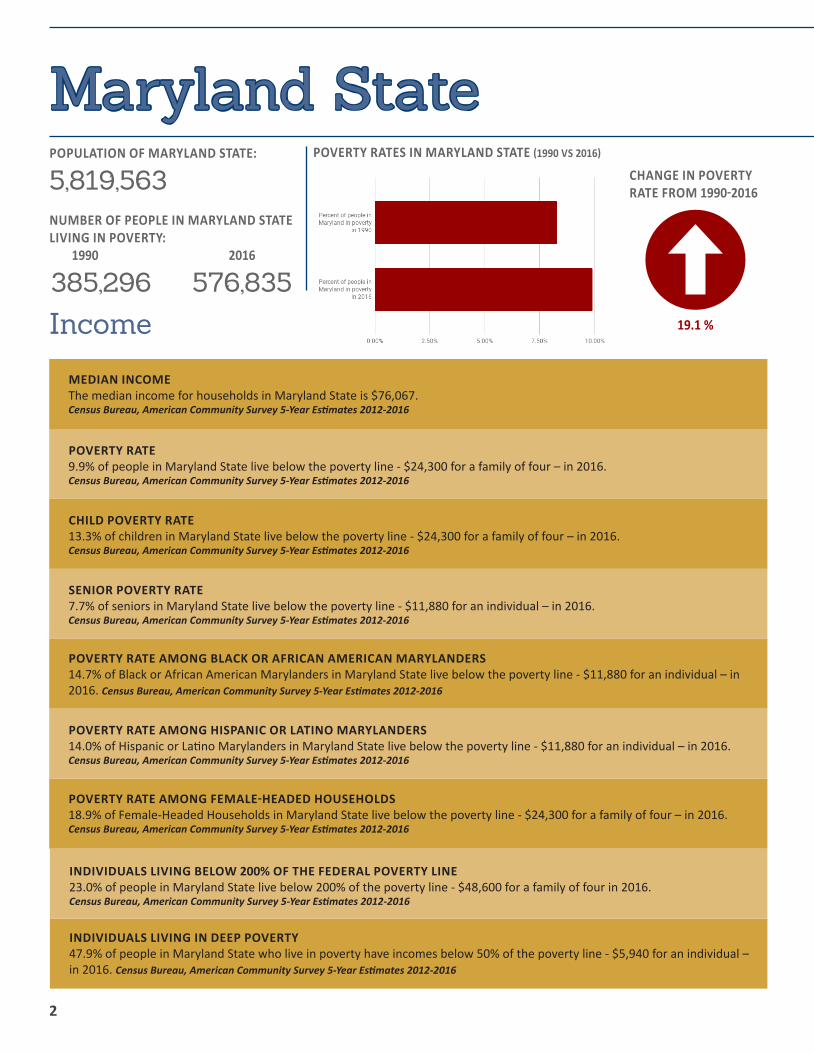
CHANGE IN POVERTY RATE FROM 1990-2016
19.1 %
POVERTY RATES IN MARYLAND STATE (1990 VS 2016)
INDIVIDUALS LIVING IN DEEP POVERTY47.9% of people in Maryland State who live in poverty have incomes below 50% of the poverty line - $5,940 for an individual – in 2016. Census Bureau, American Community Survey 5-Year Estimates 2012-2016
INDIVIDUALS LIVING BELOW 200% OF THE FEDERAL POVERTY LINE23.0% of people in Maryland State live below 200% of the poverty line - $48,600 for a family of four in 2016.Census Bureau, American Community Survey 5-Year Estimates 2012-2016
POVERTY RATE AMONG FEMALE-HEADED HOUSEHOLDS18.9% of Female-Headed Households in Maryland State live below the poverty line - $24,300 for a family of four – in 2016. Census Bureau, American Community Survey 5-Year Estimates 2012-2016
POVERTY RATE AMONG HISPANIC OR LATINO MARYLANDERS 14.0% of Hispanic or Latino Marylanders in Maryland State live below the poverty line - $11,880 for an individual – in 2016. Census Bureau, American Community Survey 5-Year Estimates 2012-2016
POVERTY RATE AMONG BLACK OR AFRICAN AMERICAN MARYLANDERS14.7% of Black or African American Marylanders in Maryland State live below the poverty line - $11,880 for an individual – in 2016. Census Bureau, American Community Survey 5-Year Estimates 2012-2016
SENIOR POVERTY RATE7.7% of seniors in Maryland State live below the poverty line - $11,880 for an individual – in 2016.Census Bureau, American Community Survey 5-Year Estimates 2012-2016
CHILD POVERTY RATE13.3% of children in Maryland State live below the poverty line - $24,300 for a family of four – in 2016.Census Bureau, American Community Survey 5-Year Estimates 2012-2016
POVERTY RATE9.9% of people in Maryland State live below the poverty line - $24,300 for a family of four – in 2016.Census Bureau, American Community Survey 5-Year Estimates 2012-2016
MEDIAN INCOMEThe median income for households in Maryland State is $76,067.Census Bureau, American Community Survey 5-Year Estimates 2012-2016
Maryland StatePOPULATION OF MARYLAND STATE:
5,819,563NUMBER OF PEOPLE IN MARYLAND STATE LIVING IN POVERTY: 1990 2016
385,296 576,835
Maryland Poverty Profiles 3
Income Supports
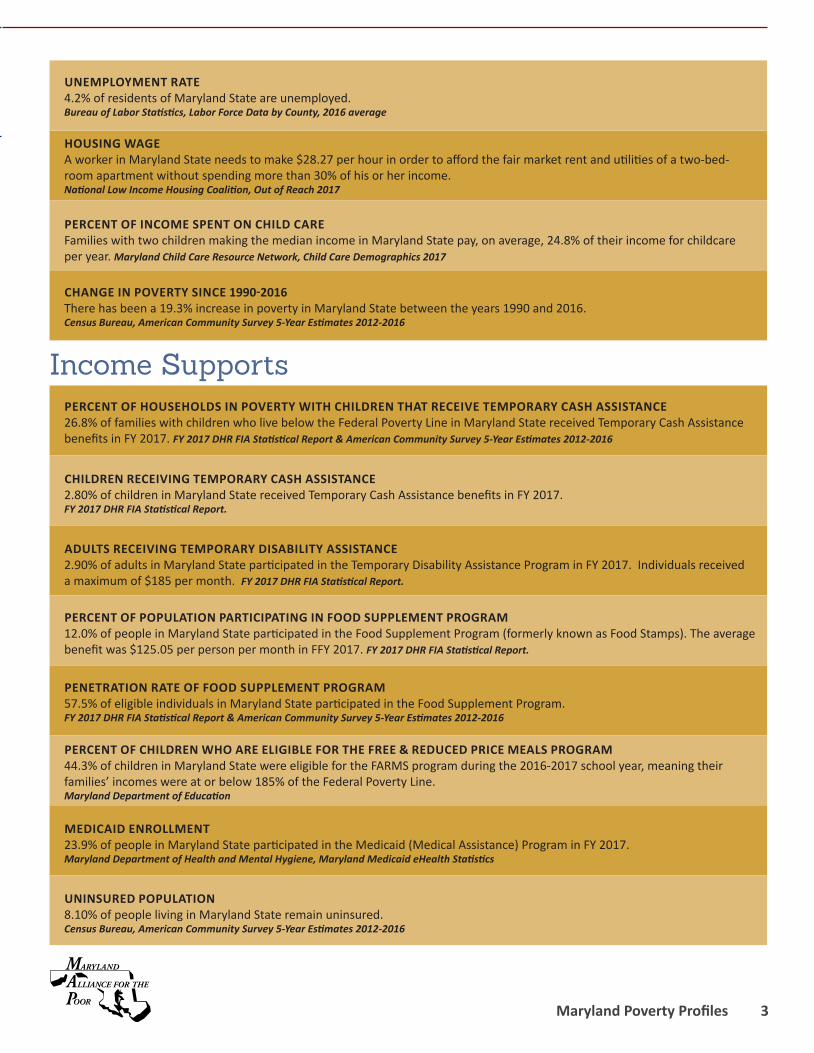
CHANGE IN POVERTY SINCE 1990-2016 There has been a 19.3% increase in poverty in Maryland State between the years 1990 and 2016. Census Bureau, American Community Survey 5-Year Estimates 2012-2016
UNINSURED POPULATION8.10% of people living in Maryland State remain uninsured. Census Bureau, American Community Survey 5-Year Estimates 2012-2016
MEDICAID ENROLLMENT23.9% of people in Maryland State participated in the Medicaid (Medical Assistance) Program in FY 2017.Maryland Department of Health and Mental Hygiene, Maryland Medicaid eHealth Statistics
PERCENT OF CHILDREN WHO ARE ELIGIBLE FOR THE FREE & REDUCED PRICE MEALS PROGRAM44.3% of children in Maryland State were eligible for the FARMS program during the 2016-2017 school year, meaning their families’ incomes were at or below 185% of the Federal Poverty Line. Maryland Department of Education
PENETRATION RATE OF FOOD SUPPLEMENT PROGRAM57.5% of eligible individuals in Maryland State participated in the Food Supplement Program.FY 2017 DHR FIA Statistical Report & American Community Survey 5-Year Estimates 2012-2016
PERCENT OF POPULATION PARTICIPATING IN FOOD SUPPLEMENT PROGRAM12.0% of people in Maryland State participated in the Food Supplement Program (formerly known as Food Stamps). The average benefit was $125.05 per person per month in FFY 2017. FY 2017 DHR FIA Statistical Report.
ADULTS RECEIVING TEMPORARY DISABILITY ASSISTANCE2.90% of adults in Maryland State participated in the Temporary Disability Assistance Program in FY 2017. Individuals received a maximum of $185 per month. FY 2017 DHR FIA Statistical Report.
CHILDREN RECEIVING TEMPORARY CASH ASSISTANCE2.80% of children in Maryland State received Temporary Cash Assistance benefits in FY 2017. FY 2017 DHR FIA Statistical Report.
PERCENT OF HOUSEHOLDS IN POVERTY WITH CHILDREN THAT RECEIVE TEMPORARY CASH ASSISTANCE26.8% of families with children who live below the Federal Poverty Line in Maryland State received Temporary Cash Assistance benefits in FY 2017. FY 2017 DHR FIA Statistical Report & American Community Survey 5-Year Estimates 2012-2016
PERCENT OF INCOME SPENT ON CHILD CARE Families with two children making the median income in Maryland State pay, on average, 24.8% of their income for childcare per year. Maryland Child Care Resource Network, Child Care Demographics 2017
HOUSING WAGEA worker in Maryland State needs to make $28.27 per hour in order to afford the fair market rent and utilities of a two-bed-room apartment without spending more than 30% of his or her income. National Low Income Housing Coalition, Out of Reach 2017
UNEMPLOYMENT RATE4.2% of residents of Maryland State are unemployed.Bureau of Labor Statistics, Labor Force Data by County, 2016 average

4
IncomeRanking*
CHANGE IN POVERTY RATE FROM 1990-2016
5.5 %
POVERTY RATES IN ALLEGANY COUNTY (1990 VS 2016)
21334235
23
INDIVIDUALS LIVING IN DEEP POVERTY44.2% of people in Allegany County who live in poverty have incomes below 50% of the poverty line - $5,940 for an individual – in 2016. Census Bureau, American Community Survey 5-Year Estimates 2012-2016
INDIVIDUALS LIVING BELOW 200% OF THE FEDERAL POVERTY LINE37.9% of people in Allegany County live below 200% of the poverty line - $48,600 for a family of four in 2016.Census Bureau, American Community Survey 5-Year Estimates 2012-2016
POVERTY RATE AMONG FEMALE-HEADED HOUSEHOLDS33.1% of Female-Headed Households in Allegany County live below the poverty line - $24,300 for a family of four – in 2016. Census Bureau, American Community Survey 5-Year Estimates 2012-2016
POVERTY RATE AMONG HISPANIC OR LATINO MARYLANDERS 29.9% of Hispanic or Latino Marylanders in Allegany County live below the poverty line - $11,880 for an individ-ual – in 2016. Census Bureau, American Community Survey 5-Year Estimates 2012-2016
POVERTY RATE AMONG BLACK OR AFRICAN AMERICAN MARYLANDERS41.6% of Black or African American Marylanders in Allegany County live below the poverty line - $11,880 for an individual – in 2016. Census Bureau, American Community Survey 5-Year Estimates 2012-2016
SENIOR POVERTY RATE9.0% of seniors in Allegany County live below the poverty line - $11,880 for an individual – in 2016.Census Bureau, American Community Survey 5-Year Estimates 2012-2016
CHILD POVERTY RATE24.7% of children in Allegany County live below the poverty line - $24,300 for a family of four – in 2016.Census Bureau, American Community Survey 5-Year Estimates 2012-2016
POVERTY RATE17.4% of people in Allegany County live below the poverty line - $24,300 for a family of four – in 2016.Census Bureau, American Community Survey 5-Year Estimates 2012-2016
MEDIAN INCOMEThe median income for households in Allegany County is $41,559.Census Bureau, American Community Survey 5-Year Estimates 2012-2016
POPULATION OF ALLEGANY COUNTY:
65,671NUMBER OF PEOPLE IN ALLEGANY COUNTY LIVING IN POVERTY: 1990 2016
11,865 11,430
Allegany County
3
Maryland Poverty Profiles 5
Income Supports
Ranking*
* Ranking - a ranking of 1 indicates the jurisdiction has the highest figure in the state in that category, and a ranking of 24 means the lowest figure in the state in that category. Therefore, being ranked 1 does not necessarily mean success in a given category.
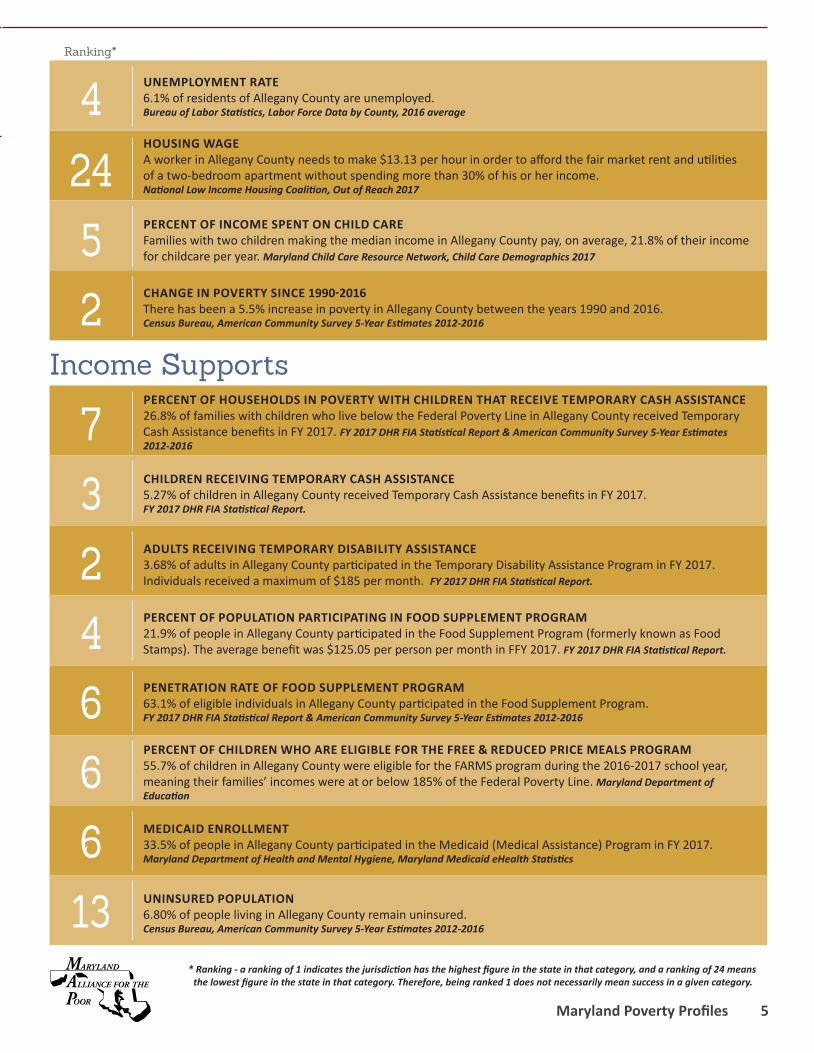
CHANGE IN POVERTY SINCE 1990-2016 There has been a 5.5% increase in poverty in Allegany County between the years 1990 and 2016. Census Bureau, American Community Survey 5-Year Estimates 2012-20162
136664237
5244
UNINSURED POPULATION6.80% of people living in Allegany County remain uninsured. Census Bureau, American Community Survey 5-Year Estimates 2012-2016
MEDICAID ENROLLMENT33.5% of people in Allegany County participated in the Medicaid (Medical Assistance) Program in FY 2017.Maryland Department of Health and Mental Hygiene, Maryland Medicaid eHealth Statistics
PERCENT OF CHILDREN WHO ARE ELIGIBLE FOR THE FREE & REDUCED PRICE MEALS PROGRAM55.7% of children in Allegany County were eligible for the FARMS program during the 2016-2017 school year, meaning their families’ incomes were at or below 185% of the Federal Poverty Line. Maryland Department of Education
PENETRATION RATE OF FOOD SUPPLEMENT PROGRAM63.1% of eligible individuals in Allegany County participated in the Food Supplement Program.FY 2017 DHR FIA Statistical Report & American Community Survey 5-Year Estimates 2012-2016
PERCENT OF POPULATION PARTICIPATING IN FOOD SUPPLEMENT PROGRAM21.9% of people in Allegany County participated in the Food Supplement Program (formerly known as Food Stamps). The average benefit was $125.05 per person per month in FFY 2017. FY 2017 DHR FIA Statistical Report.
ADULTS RECEIVING TEMPORARY DISABILITY ASSISTANCE3.68% of adults in Allegany County participated in the Temporary Disability Assistance Program in FY 2017. Individuals received a maximum of $185 per month. FY 2017 DHR FIA Statistical Report.
CHILDREN RECEIVING TEMPORARY CASH ASSISTANCE5.27% of children in Allegany County received Temporary Cash Assistance benefits in FY 2017. FY 2017 DHR FIA Statistical Report.
PERCENT OF HOUSEHOLDS IN POVERTY WITH CHILDREN THAT RECEIVE TEMPORARY CASH ASSISTANCE26.8% of families with children who live below the Federal Poverty Line in Allegany County received Temporary Cash Assistance benefits in FY 2017. FY 2017 DHR FIA Statistical Report & American Community Survey 5-Year Estimates 2012-2016
PERCENT OF INCOME SPENT ON CHILD CARE Families with two children making the median income in Allegany County pay, on average, 21.8% of their income for childcare per year. Maryland Child Care Resource Network, Child Care Demographics 2017
HOUSING WAGEA worker in Allegany County needs to make $13.13 per hour in order to afford the fair market rent and utilities of a two-bedroom apartment without spending more than 30% of his or her income. National Low Income Housing Coalition, Out of Reach 2017
UNEMPLOYMENT RATE6.1% of residents of Allegany County are unemployed.Bureau of Labor Statistics, Labor Force Data by County, 2016 average

6
IncomeRanking*
CHANGE IN POVERTY RATE FROM 1990-2016
35.6 %
POVERTY RATES IN ANNE ARUNDLE COUNTY (1990 VS 2016)
720232220212221
4
POPULATION OF ANNE ARUNDEL COUNTY:
543,203NUMBER OF PEOPLE IN ANNE ARUNDEL COUNTY LIVING IN POVERTY: 1990 2016
18,391 33,168
INDIVIDUALS LIVING IN DEEP POVERTY49.9% of people in Anne Arundel County who live in poverty have incomes below 50% of the poverty line - $5,940 for an individual – in 2016. Census Bureau, American Community Survey 5-Year Estimates 2012-2016
INDIVIDUALS LIVING BELOW 200% OF THE FEDERAL POVERTY LINE15.9% of people in Anne Arundel County live below 200% of the poverty line - $48,600 for a family of four in 2016. Census Bureau, American Community Survey 5-Year Estimates 2012-2016
POVERTY RATE AMONG FEMALE-HEADED HOUSEHOLDS12.2% of Female-Headed Households in Anne Arundel County live below the poverty line - $24,300 for a family of four – in 2016. Census Bureau, American Community Survey 5-Year Estimates 2012-2016
POVERTY RATE AMONG HISPANIC OR LATINO MARYLANDERS 9.5% of Hispanic or Latino Marylanders in Anne Arundel County live below the poverty line - $11,880 for an individual – in 2016. Census Bureau, American Community Survey 5-Year Estimates 2012-2016
POVERTY RATE AMONG BLACK OR AFRICAN AMERICAN MARYLANDERS9.7% of Black or African American Marylanders in Anne Arundel County live below the poverty line - $11,880 for an individual – in 2016. Census Bureau, American Community Survey 5-Year Estimates 2012-2016
SENIOR POVERTY RATE5.6% of seniors in Anne Arundel County live below the poverty line - $11,880 for an individual – in 2016.Census Bureau, American Community Survey 5-Year Estimates 2012-2016
CHILD POVERTY RATE7.1% of children in Anne Arundel County live below the poverty line - $24,300 for a family of four – in 2016.Census Bureau, American Community Survey 5-Year Estimates 2012-2016
POVERTY RATE6.1% of people in Anne Arundel County live below the poverty line - $24,300 for a family of four – in 2016.Census Bureau, American Community Survey 5-Year Estimates 2012-2016
MEDIAN INCOMEThe median income for households in Anne Arundel County is $91,918.Census Bureau, American Community Survey 5-Year Estimates 2012-2016
Anne Arundel County
Maryland Poverty Profiles 7
Income Supports
Ranking*
* Ranking - a ranking of 1 indicates the jurisdiction has the highest figure in the state in that category, and a ranking of 24 means the lowest figure in the state in that category. Therefore, being ranked 1 does not necessarily mean success in a given category.
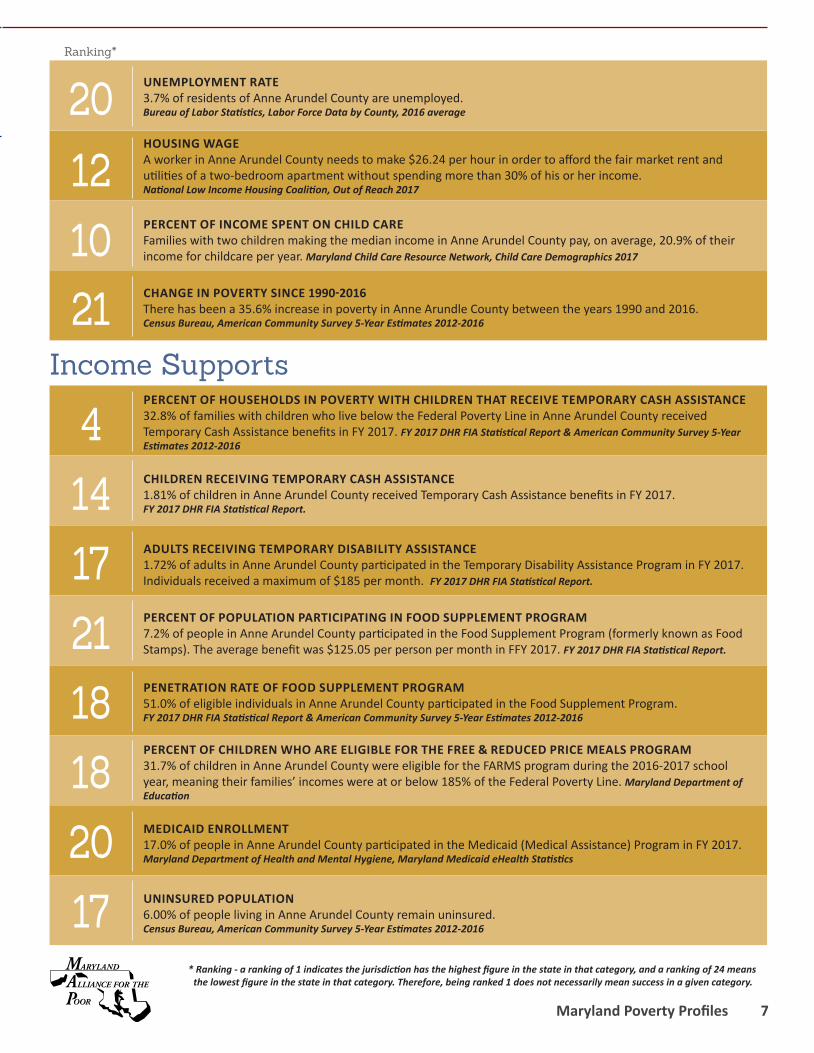
21 CHANGE IN POVERTY SINCE 1990-2016 There has been a 35.6% increase in poverty in Anne Arundle County between the years 1990 and 2016. Census Bureau, American Community Survey 5-Year Estimates 2012-2016
172018182117144
101220 UNEMPLOYMENT RATE
3.7% of residents of Anne Arundel County are unemployed.Bureau of Labor Statistics, Labor Force Data by County, 2016 average
HOUSING WAGEA worker in Anne Arundel County needs to make $26.24 per hour in order to afford the fair market rent and utilities of a two-bedroom apartment without spending more than 30% of his or her income. National Low Income Housing Coalition, Out of Reach 2017
PERCENT OF INCOME SPENT ON CHILD CARE Families with two children making the median income in Anne Arundel County pay, on average, 20.9% of their income for childcare per year. Maryland Child Care Resource Network, Child Care Demographics 2017
PERCENT OF HOUSEHOLDS IN POVERTY WITH CHILDREN THAT RECEIVE TEMPORARY CASH ASSISTANCE32.8% of families with children who live below the Federal Poverty Line in Anne Arundel County received Temporary Cash Assistance benefits in FY 2017. FY 2017 DHR FIA Statistical Report & American Community Survey 5-Year Estimates 2012-2016
CHILDREN RECEIVING TEMPORARY CASH ASSISTANCE1.81% of children in Anne Arundel County received Temporary Cash Assistance benefits in FY 2017. FY 2017 DHR FIA Statistical Report.
ADULTS RECEIVING TEMPORARY DISABILITY ASSISTANCE1.72% of adults in Anne Arundel County participated in the Temporary Disability Assistance Program in FY 2017.Individuals received a maximum of $185 per month. FY 2017 DHR FIA Statistical Report.
PERCENT OF POPULATION PARTICIPATING IN FOOD SUPPLEMENT PROGRAM7.2% of people in Anne Arundel County participated in the Food Supplement Program (formerly known as Food Stamps). The average benefit was $125.05 per person per month in FFY 2017. FY 2017 DHR FIA Statistical Report.
PENETRATION RATE OF FOOD SUPPLEMENT PROGRAM51.0% of eligible individuals in Anne Arundel County participated in the Food Supplement Program.FY 2017 DHR FIA Statistical Report & American Community Survey 5-Year Estimates 2012-2016
PERCENT OF CHILDREN WHO ARE ELIGIBLE FOR THE FREE & REDUCED PRICE MEALS PROGRAM31.7% of children in Anne Arundel County were eligible for the FARMS program during the 2016-2017 school year, meaning their families’ incomes were at or below 185% of the Federal Poverty Line. Maryland Department of Education
MEDICAID ENROLLMENT17.0% of people in Anne Arundel County participated in the Medicaid (Medical Assistance) Program in FY 2017.Maryland Department of Health and Mental Hygiene, Maryland Medicaid eHealth Statistics
UNINSURED POPULATION6.00% of people living in Anne Arundel County remain uninsured. Census Bureau, American Community Survey 5-Year Estimates 2012-2016
8
IncomeRanking*
CHANGE IN POVERTY RATE FROM 1990-2016
POVERTY RATES IN BALTIMORE CITY (1990 VS 2016)
5.5 %
82667122
22
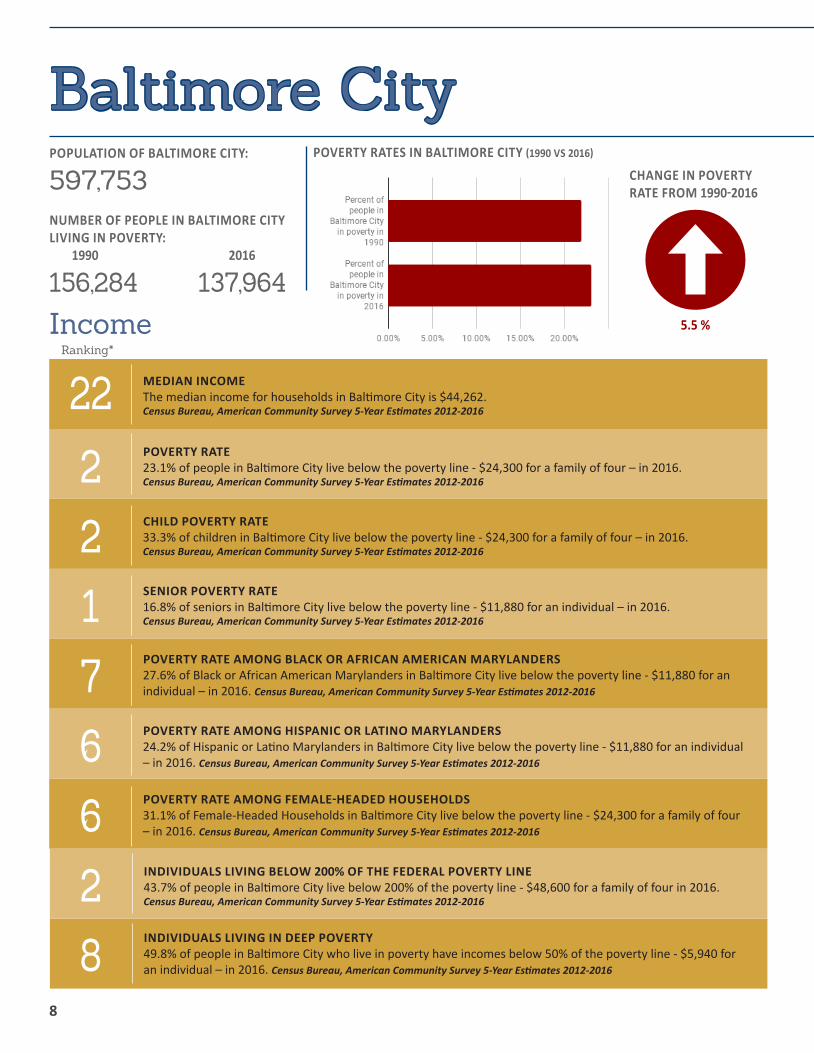
INDIVIDUALS LIVING IN DEEP POVERTY49.8% of people in Baltimore City who live in poverty have incomes below 50% of the poverty line - $5,940 for an individual – in 2016. Census Bureau, American Community Survey 5-Year Estimates 2012-2016
INDIVIDUALS LIVING BELOW 200% OF THE FEDERAL POVERTY LINE43.7% of people in Baltimore City live below 200% of the poverty line - $48,600 for a family of four in 2016.Census Bureau, American Community Survey 5-Year Estimates 2012-2016
POVERTY RATE AMONG FEMALE-HEADED HOUSEHOLDS31.1% of Female-Headed Households in Baltimore City live below the poverty line - $24,300 for a family of four – in 2016. Census Bureau, American Community Survey 5-Year Estimates 2012-2016
POVERTY RATE AMONG HISPANIC OR LATINO MARYLANDERS 24.2% of Hispanic or Latino Marylanders in Baltimore City live below the poverty line - $11,880 for an individual – in 2016. Census Bureau, American Community Survey 5-Year Estimates 2012-2016
POVERTY RATE AMONG BLACK OR AFRICAN AMERICAN MARYLANDERS27.6% of Black or African American Marylanders in Baltimore City live below the poverty line - $11,880 for an individual – in 2016. Census Bureau, American Community Survey 5-Year Estimates 2012-2016
SENIOR POVERTY RATE16.8% of seniors in Baltimore City live below the poverty line - $11,880 for an individual – in 2016.Census Bureau, American Community Survey 5-Year Estimates 2012-2016
CHILD POVERTY RATE33.3% of children in Baltimore City live below the poverty line - $24,300 for a family of four – in 2016.Census Bureau, American Community Survey 5-Year Estimates 2012-2016
POVERTY RATE23.1% of people in Baltimore City live below the poverty line - $24,300 for a family of four – in 2016.Census Bureau, American Community Survey 5-Year Estimates 2012-2016
MEDIAN INCOMEThe median income for households in Baltimore City is $44,262.Census Bureau, American Community Survey 5-Year Estimates 2012-2016
POPULATION OF BALTIMORE CITY:
597,753NUMBER OF PEOPLE IN BALTIMORE CITY LIVING IN POVERTY: 1990 2016
156,284 137,964
Baltimore City

Maryland Poverty Profiles 9
Income Supports
Ranking*
* Ranking - a ranking of 1 indicates the jurisdiction has the highest figure in the state in that category, and a ranking of 24 means the lowest figure in the state in that category. Therefore, being ranked 1 does not necessarily mean success in a given category.
CHANGE IN POVERTY SINCE 1990-2016 There has been a 5.5% increase in poverty in Baltimore City between the years 1990 and 2016. Census Bureau, American Community Survey 5-Year Estimates 2012-20161
62111111
163
UNINSURED POPULATION9.00% of people living in Baltimore City remain uninsured. Census Bureau, American Community Survey 5-Year Estimates 2012-2016
MEDICAID ENROLLMENT44.5% of people in Baltimore City participated in the Medicaid (Medical Assistance) Program in FY 2017.Maryland Department of Health and Mental Hygiene, Maryland Medicaid eHealth Statistics
PERCENT OF CHILDREN WHO ARE ELIGIBLE FOR THE FREE & REDUCED PRICE MEALS PROGRAM86.3% of children in Baltimore City were eligible for the FARMS program during the 2016-2017 school year, meaning their families’ incomes were at or below 185% of the Federal Poverty Line. Maryland Department of Education
PENETRATION RATE OF FOOD SUPPLEMENT PROGRAM77.5% of eligible individuals in Baltimore City participated in the Food Supplement Program.FY 2017 DHR FIA Statistical Report & American Community Survey 5-Year Estimates 2012-2016
PERCENT OF POPULATION PARTICIPATING IN FOOD SUPPLEMENT PROGRAM31.6% of people in Baltimore City participated in the Food Supplement Program (formerly known as Food Stamps). The average benefit was $125.05 per person per month in FFY 2017. FY 2017 DHR FIA Statistical Report.
ADULTS RECEIVING TEMPORARY DISABILITY ASSISTANCE7.07% of adults in Baltimore City participated in the Temporary Disability Assistance Program in FY 2017. Indi-viduals received a maximum of $185 per month. FY 2017 DHR FIA Statistical Report.
CHILDREN RECEIVING TEMPORARY CASH ASSISTANCE11.88% of children in Baltimore City received Temporary Cash Assistance benefits in FY 2017. FY 2017 DHR FIA Statistical Report.
PERCENT OF HOUSEHOLDS IN POVERTY WITH CHILDREN THAT RECEIVE TEMPORARY CASH ASSISTANCE47.0% of families with children who live below the Federal Poverty Line in Baltimore City received Temporary Cash Assistance benefits in FY 2017. FY 2017 DHR FIA Statistical Report & American Community Survey 5-Year Estimates 2012-2016
PERCENT OF INCOME SPENT ON CHILD CARE Families with two children making the median income in Baltimore City pay, on average, 29.7% of their income for childcare per year. Maryland Child Care Resource Network, Child Care Demographics 2017
HOUSING WAGEA worker in Baltimore City needs to make $26.46 per hour in order to afford the fair market rent and utilities of a two-bedroom apartment without spending more than 30% of his or her income. National Low Income Housing Coalition, Out of Reach 2017
UNEMPLOYMENT RATE6.3% of residents of Baltimore City are unemployed.Bureau of Labor Statistics, Labor Force Data by County, 2016 average
10
IncomeRanking*
CHANGE IN POVERTY RATE FROM 1990-2016
POVERTY RATES IN BALTIMORE COUNTY (1990 VS 2016)
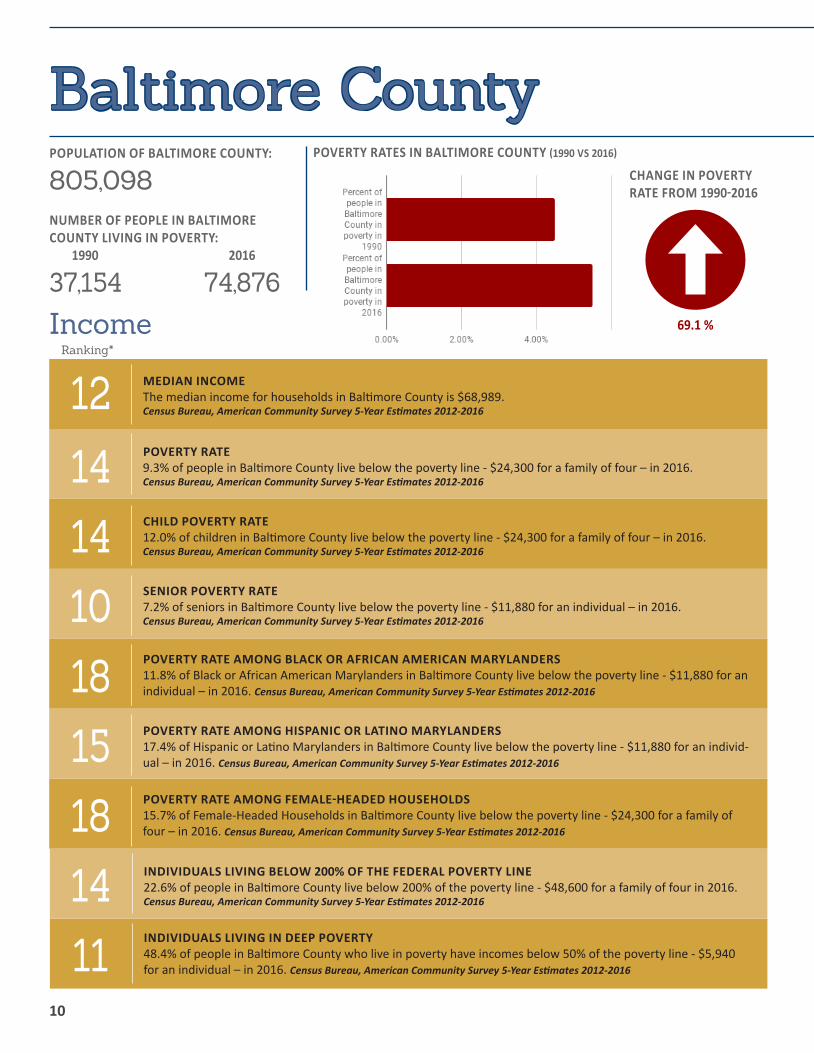
69.1 %
1114181518101414
12
INDIVIDUALS LIVING IN DEEP POVERTY48.4% of people in Baltimore County who live in poverty have incomes below 50% of the poverty line - $5,940 for an individual – in 2016. Census Bureau, American Community Survey 5-Year Estimates 2012-2016
INDIVIDUALS LIVING BELOW 200% OF THE FEDERAL POVERTY LINE22.6% of people in Baltimore County live below 200% of the poverty line - $48,600 for a family of four in 2016.Census Bureau, American Community Survey 5-Year Estimates 2012-2016
POVERTY RATE AMONG FEMALE-HEADED HOUSEHOLDS15.7% of Female-Headed Households in Baltimore County live below the poverty line - $24,300 for a family of four – in 2016. Census Bureau, American Community Survey 5-Year Estimates 2012-2016
POVERTY RATE AMONG HISPANIC OR LATINO MARYLANDERS 17.4% of Hispanic or Latino Marylanders in Baltimore County live below the poverty line - $11,880 for an individ-ual – in 2016. Census Bureau, American Community Survey 5-Year Estimates 2012-2016
POVERTY RATE AMONG BLACK OR AFRICAN AMERICAN MARYLANDERS11.8% of Black or African American Marylanders in Baltimore County live below the poverty line - $11,880 for an individual – in 2016. Census Bureau, American Community Survey 5-Year Estimates 2012-2016
SENIOR POVERTY RATE7.2% of seniors in Baltimore County live below the poverty line - $11,880 for an individual – in 2016.Census Bureau, American Community Survey 5-Year Estimates 2012-2016
CHILD POVERTY RATE12.0% of children in Baltimore County live below the poverty line - $24,300 for a family of four – in 2016.Census Bureau, American Community Survey 5-Year Estimates 2012-2016
POVERTY RATE9.3% of people in Baltimore County live below the poverty line - $24,300 for a family of four – in 2016.Census Bureau, American Community Survey 5-Year Estimates 2012-2016
MEDIAN INCOMEThe median income for households in Baltimore County is $68,989.Census Bureau, American Community Survey 5-Year Estimates 2012-2016
POPULATION OF BALTIMORE COUNTY:
805,098NUMBER OF PEOPLE IN BALTIMORE COUNTY LIVING IN POVERTY: 1990 2016
37,154 74,876
Baltimore County
Maryland Poverty Profiles 11
Income Supports
Ranking*
* Ranking - a ranking of 1 indicates the jurisdiction has the highest figure in the state in that category, and a ranking of 24 means the lowest figure in the state in that category. Therefore, being ranked 1 does not necessarily mean success in a given category.
CHANGE IN POVERTY SINCE 1990-2016 There has been a 69.1% increase in poverty in Baltimore County between the years 1990 and 2016. Census Bureau, American Community Survey 5-Year Estimates 2012-201616
10131112139118
3612
PERCENT OF INCOME SPENT ON CHILD CARE Families with two children making the median income in Baltimore County pay, on average, 22.9% of their income for childcare per year. Maryland Child Care Resource Network, Child Care Demographics 2017
HOUSING WAGEA worker in Baltimore County needs to make $26.46 per hour in order to afford the fair market rent and utilities of a two-bedroom apartment without spending more than 30% of his or her income. National Low Income Housing Coalition, Out of Reach 2017
UNEMPLOYMENT RATE4.5% of residents of Baltimore County are unemployed.Bureau of Labor Statistics, Labor Force Data by County, 2016 average
PERCENT OF HOUSEHOLDS IN POVERTY WITH CHILDREN THAT RECEIVE TEMPORARY CASH ASSISTANCE26.4% of families with children who live below the Federal Poverty Line in Baltimore County received Temporary Cash Assistance benefits in FY 2017. FY 2017 DHR FIA Statistical Report & American Community Survey 5-Year Estimates 2012-2016
CHILDREN RECEIVING TEMPORARY CASH ASSISTANCE2.51% of children in Baltimore County received Temporary Cash Assistance benefits in FY 2017. FY 2017 DHR FIA Statistical Report.
ADULTS RECEIVING TEMPORARY DISABILITY ASSISTANCE2.12% of adults in Baltimore County participated in the Temporary Disability Assistance Program in FY 2017. Individuals received a maximum of $185 per month. FY 2017 DHR FIA Statistical Report.
PERCENT OF POPULATION PARTICIPATING IN FOOD SUPPLEMENT PROGRAM12.0% of people in Baltimore County participated in the Food Supplement Program (formerly known as Food Stamps). The average benefit was $125.05 per person per month in FFY 2017. FY 2017 DHR FIA Statistical Report.
PENETRATION RATE OF FOOD SUPPLEMENT PROGRAM59.3% of eligible individuals in Baltimore County participated in the Food Supplement Program.FY 2017 DHR FIA Statistical Report & American Community Survey 5-Year Estimates 2012-2016
PERCENT OF CHILDREN WHO ARE ELIGIBLE FOR THE FREE & REDUCED PRICE MEALS PROGRAM45.1% of children in Baltimore County were eligible for the FARMS program during the 2016-2017 school year, meaning their families’ incomes were at or below 185% of the Federal Poverty Line. Maryland Department of Education
MEDICAID ENROLLMENT24.1% of people in Baltimore County participated in the Medicaid (Medical Assistance) Program in FY 2017.Maryland Department of Health and Mental Hygiene, Maryland Medicaid eHealth Statistics
UNINSURED POPULATION7.40% of people living in Baltimore County remain uninsured. Census Bureau, American Community Survey 5-Year Estimates 2012-2016

12
IncomeRanking*
CHANGE IN POVERTY RATE FROM 1990-2016
15.4 %
POVERTY RATES IN CALVERT COUNTY (1990 VS 2016)
222242323152322
3
INDIVIDUALS LIVING IN DEEP POVERTY55.8% of people in Calvert County who live in poverty have incomes below 50% of the poverty line - $5,940 for an individual – in 2016. Census Bureau, American Community Survey 5-Year Estimates 2012-2016
INDIVIDUALS LIVING BELOW 200% OF THE FEDERAL POVERTY LINE14.4% of people in Calvert County live below 200% of the poverty line - $48,600 for a family of four in 2016.Census Bureau, American Community Survey 5-Year Estimates 2012-2016
POVERTY RATE AMONG FEMALE-HEADED HOUSEHOLDS10.8% of Female-Headed Households in Calvert County live below the poverty line - $24,300 for a family of four – in 2016. Census Bureau, American Community Survey 5-Year Estimates 2012-2016
POVERTY RATE AMONG HISPANIC OR LATINO MARYLANDERS 7.5% of Hispanic or Latino Marylanders in Calvert County live below the poverty line - $11,880 for an individual – in 2016. Census Bureau, American Community Survey 5-Year Estimates 2012-2016
POVERTY RATE AMONG BLACK OR AFRICAN AMERICAN MARYLANDERS9.4% of Black or African American Marylanders in Calvert County live below the poverty line - $11,880 for an individual – in 2016. Census Bureau, American Community Survey 5-Year Estimates 2012-2016
SENIOR POVERTY RATE6.6% of seniors in Calvert County live below the poverty line - $11,880 for an individual – in 2016.Census Bureau, American Community Survey 5-Year Estimates 2012-2016
CHILD POVERTY RATE6.3% of children in Calvert County live below the poverty line - $24,300 for a family of four – in 2016.Census Bureau, American Community Survey 5-Year Estimates 2012-2016
POVERTY RATE6.0% of people in Calvert County live below the poverty line - $24,300 for a family of four – in 2016.Census Bureau, American Community Survey 5-Year Estimates 2012-2016
MEDIAN INCOMEThe median income for households in Calvert County is $96,808.Census Bureau, American Community Survey 5-Year Estimates 2012-2016
POPULATION OF CALVERT COUNTY:
89,555NUMBER OF PEOPLE IN CALVERT COUNTY LIVING IN POVERTY: 1990 2016
2,654 5,400
Calvert County

Maryland Poverty Profiles 13
Income Supports
Ranking*
* Ranking - a ranking of 1 indicates the jurisdiction has the highest figure in the state in that category, and a ranking of 24 means the lowest figure in the state in that category. Therefore, being ranked 1 does not necessarily mean success in a given category.
CHANGE IN POVERTY SINCE 1990-2016 There has been a 15.4% increase in poverty in Calvert County between the years 1990 and 2016. Census Bureau, American Community Survey 5-Year Estimates 2012-201617
1722231119162213
23118
UNINSURED POPULATION6.0% of people living in Calvert County remain uninsured. Census Bureau, American Community Survey 5-Year Estimates 2012-2016
MEDICAID ENROLLMENT16.0% of people in Calvert County participated in the Medicaid (Medical Assistance) Program in FY 2017.Maryland Department of Health and Mental Hygiene, Maryland Medicaid eHealth Statistics
PERCENT OF CHILDREN WHO ARE ELIGIBLE FOR THE FREE & REDUCED PRICE MEALS PROGRAM21.7% of children in Calvert County were eligible for the FARMS program during the 2016-2017 school year, meaning their families’ incomes were at or below 185% of the Federal Poverty Line. Maryland Department of Education
PENETRATION RATE OF FOOD SUPPLEMENT PROGRAM59.4% of eligible individuals in Calvert County participated in the Food Supplement Program.FY 2017 DHR FIA Statistical Report & American Community Survey 5-Year Estimates 2012-2016
PERCENT OF POPULATION PARTICIPATING IN FOOD SUPPLEMENT PROGRAM8.0% of people in Calvert County participated in the Food Supplement Program (formerly known as Food Stamps). The average benefit was $125.05 per person per month in FFY 2017. FY 2017 DHR FIA Statistical Report.
ADULTS RECEIVING TEMPORARY DISABILITY ASSISTANCE1.74% of adults in Calvert County participated in the Temporary Disability Assistance Program in FY 2017. Individuals received a maximum of $185 per month.wFY 2017 DHR FIA Statistical Report.
CHILDREN RECEIVING TEMPORARY CASH ASSISTANCE.84% of children in Calvert County received Temporary Cash Assistance benefits in FY 2017. FY 2017 DHR FIA Statistical Report.
PERCENT OF HOUSEHOLDS IN POVERTY WITH CHILDREN THAT RECEIVE TEMPORARY CASH ASSISTANCE21.1% of families with children who live below the Federal Poverty Line in Calvert County received Temporary Cash Assistance benefits in FY 2017. FY 2017 DHR FIA Statistical Report & American Community Survey 5-Year Estimates 2012-2016
PERCENT OF INCOME SPENT ON CHILD CARE Families with two children making the median income in Calvert County pay, on average, 17.3% of their income for childcare per year. Maryland Child Care Resource Network, Child Care Demographics 2017
HOUSING WAGEA worker in Calvert County needs to make $33.58 per hour in order to afford the fair market rent and utilities of a two-bedroom apartment without spending more than 30% of his or her income. National Low Income Housing Coalition, Out of Reach 2017
UNEMPLOYMENT RATE3.8% of residents of Calvert County are unemployed.Bureau of Labor Statistics, Labor Force Data by County, 2016 average

14
IncomeRanking*
CHANGE IN POVERTY RATE FROM 1990-2016
44.9 %
POVERTY RATES IN CAROLINE COUNTY (1990 VS 2016)
45226644
19
INDIVIDUALS LIVING IN DEEP POVERTY52.8% of people in Caroline County who live in poverty have incomes below 50% of the poverty line - $5,940 for an individual – in 2016. Census Bureau, American Community Survey 5-Year Estimates 2012-2016
INDIVIDUALS LIVING BELOW 200% OF THE FEDERAL POVERTY LINE35.5% of people in Caroline County live below 200% of the poverty line - $48,600 for a family of four in 2016.Census Bureau, American Community Survey 5-Year Estimates 2012-2016
POVERTY RATE AMONG FEMALE-HEADED HOUSEHOLDS33.7% of Female-Headed Households in Caroline County live below the poverty line - $24,300 for a family of four – in 2016. Census Bureau, American Community Survey 5-Year Estimates 2012-2016
POVERTY RATE AMONG HISPANIC OR LATINO MARYLANDERS 45.6% of Hispanic or Latino Marylanders in Caroline County live below the poverty line - $11,880 for an individ-ual – in 2016. Census Bureau, American Community Survey 5-Year Estimates 2012-2016
POVERTY RATE AMONG BLACK OR AFRICAN AMERICAN MARYLANDERS27.9% of Black or African American Marylanders in Caroline County live below the poverty line - $11,880 for an individual – in 2016. Census Bureau, American Community Survey 5-Year Estimates 2012-2016
SENIOR POVERTY RATE8.7% of seniors in Caroline County live below the poverty line - $11,880 for an individual – in 2016.Census Bureau, American Community Survey 5-Year Estimates 2012-2016
CHILD POVERTY RATE27.8% of children in Caroline County live below the poverty line - $24,300 for a family of four – in 2016.Census Bureau, American Community Survey 5-Year Estimates 2012-2016
POVERTY RATE52.9% of people in Caroline County live below the poverty line - $24,300 for a family of four – in 2016.Census Bureau, American Community Survey 5-Year Estimates 2012-2016
MEDIAN INCOMEThe median income for households in Caroline County is $50,830.Census Bureau, American Community Survey 5-Year Estimates 2012-2016
POPULATION OF CAROLINE COUNTY:
32,107NUMBER OF PEOPLE IN CAROLINE COUNTY LIVING IN POVERTY: 1990 2016
3,120 5,484
Caroline County

Maryland Poverty Profiles 15
Income Supports
Ranking*
* Ranking - a ranking of 1 indicates the jurisdiction has the highest figure in the state in that category, and a ranking of 24 means the lowest figure in the state in that category. Therefore, being ranked 1 does not necessarily mean success in a given category.
CHANGE IN POVERTY SINCE 1990-2016 There has been a 44.9% increase in poverty in Caroline County between the years 1990 and 2016. Census Bureau, American Community Survey 5-Year Estimates 2012-20166
24713614921
211910
UNINSURED POPULATION10.1% of people living in Caroline County remain uninsured. Census Bureau, American Community Survey 5-Year Estimates 2012-2016
MEDICAID ENROLLMENT36.9% of people in Caroline County participated in the Medicaid (Medical Assistance) Program in FY 2017.Maryland Department of Health and Mental Hygiene, Maryland Medicaid eHealth Statistics
PERCENT OF CHILDREN WHO ARE ELIGIBLE FOR THE FREE & REDUCED PRICE MEALS PROGRAM55.43% of children in Caroline County were eligible for the FARMS program during the 2016-2017 school year, meaning their families’ incomes were at or below 185% of the Federal Poverty Line. Maryland Department of Education
PENETRATION RATE OF FOOD SUPPLEMENT PROGRAM58.5% of eligible individuals in Caroline County participated in the Food Supplement Program.FY 2017 DHR FIA Statistical Report & American Community Survey 5-Year Estimates 2012-2016
PERCENT OF POPULATION PARTICIPATING IN FOOD SUPPLEMENT PROGRAM19.5% of people in Caroline County participated in the Food Supplement Program (formerly known as Food Stamps). The average benefit was $125.05 per person per month in FFY 2017. FY 2017 DHR FIA Statistical Report.
ADULTS RECEIVING TEMPORARY DISABILITY ASSISTANCE1.84% of adults in Caroline County participated in the Temporary Disability Assistance Program in FY 2017. Individuals received a maximum of $185 per month. FY 2017 DHR FIA Statistical Report.
CHILDREN RECEIVING TEMPORARY CASH ASSISTANCE3.50% of children in Caroline County received Temporary Cash Assistance benefits in FY 2017. FY 2017 DHR FIA Statistical Report.
PERCENT OF HOUSEHOLDS IN POVERTY WITH CHILDREN THAT RECEIVE TEMPORARY CASH ASSISTANCE15.8% of families with children who live below the Federal Poverty Line in Caroline County received Temporary Cash Assistance benefits in FY 2017. FY 2017 DHR FIA Statistical Report & American Community Survey 5-Year Estimates 2012-2016
PERCENT OF INCOME SPENT ON CHILD CARE Families with two children making the median income in Caroline County pay, on average, 17.9% of their income for childcare per year. Maryland Child Care Resource Network, Child Care Demographics 2017
HOUSING WAGEA worker in Caroline County needs to make $18.06 per hour in order to afford the fair market rent and utilities of a two-bedroom apartment without spending more than 30% of his or her income. National Low Income Housing Coalition, Out of Reach 2017
UNEMPLOYMENT RATE4.7% of residents of Caroline County are unemployed.Bureau of Labor Statistics, Labor Force Data by County, 2016 average
16
IncomeRanking*
CHANGE IN POVERTY RATE FROM 1990-2016
POVERTY RATES IN CARROLL COUNTY(1990 VS 2016)
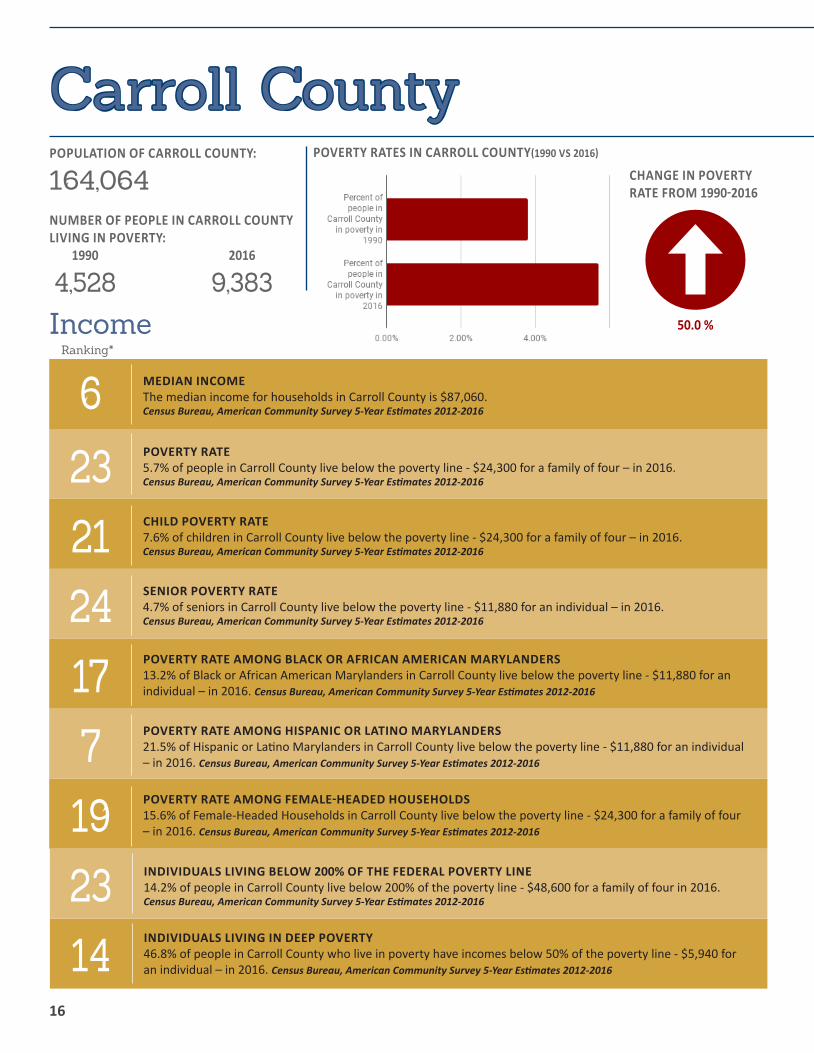
50.0 %
142319717242123
6
INDIVIDUALS LIVING IN DEEP POVERTY46.8% of people in Carroll County who live in poverty have incomes below 50% of the poverty line - $5,940 for an individual – in 2016. Census Bureau, American Community Survey 5-Year Estimates 2012-2016
INDIVIDUALS LIVING BELOW 200% OF THE FEDERAL POVERTY LINE14.2% of people in Carroll County live below 200% of the poverty line - $48,600 for a family of four in 2016.Census Bureau, American Community Survey 5-Year Estimates 2012-2016
POVERTY RATE AMONG FEMALE-HEADED HOUSEHOLDS15.6% of Female-Headed Households in Carroll County live below the poverty line - $24,300 for a family of four – in 2016. Census Bureau, American Community Survey 5-Year Estimates 2012-2016
POVERTY RATE AMONG HISPANIC OR LATINO MARYLANDERS 21.5% of Hispanic or Latino Marylanders in Carroll County live below the poverty line - $11,880 for an individual – in 2016. Census Bureau, American Community Survey 5-Year Estimates 2012-2016
POVERTY RATE AMONG BLACK OR AFRICAN AMERICAN MARYLANDERS13.2% of Black or African American Marylanders in Carroll County live below the poverty line - $11,880 for an individual – in 2016. Census Bureau, American Community Survey 5-Year Estimates 2012-2016
SENIOR POVERTY RATE4.7% of seniors in Carroll County live below the poverty line - $11,880 for an individual – in 2016.Census Bureau, American Community Survey 5-Year Estimates 2012-2016
CHILD POVERTY RATE7.6% of children in Carroll County live below the poverty line - $24,300 for a family of four – in 2016.Census Bureau, American Community Survey 5-Year Estimates 2012-2016
POVERTY RATE5.7% of people in Carroll County live below the poverty line - $24,300 for a family of four – in 2016.Census Bureau, American Community Survey 5-Year Estimates 2012-2016
MEDIAN INCOMEThe median income for households in Carroll County is $87,060.Census Bureau, American Community Survey 5-Year Estimates 2012-2016
POPULATION OF CARROLL COUNTY:
164,064NUMBER OF PEOPLE IN CARROLL COUNTY LIVING IN POVERTY: 1990 2016
4,528 9,383
Carroll County
Maryland Poverty Profiles 17
Income Supports
Ranking*
* Ranking - a ranking of 1 indicates the jurisdiction has the highest figure in the state in that category, and a ranking of 24 means the lowest figure in the state in that category. Therefore, being ranked 1 does not necessarily mean success in a given category.
CHANGE IN POVERTY SINCE 1990-2016 There has been a 50.0% increase in poverty in Carroll County between the years 1990 and 2016. Census Bureau, American Community Survey 5-Year Estimates 2012-201623
232424162272322
17622 UNEMPLOYMENT RATE
3.5% of residents of Carroll County are unemployed.Bureau of Labor Statistics, Labor Force Data by County, 2016 average
HOUSING WAGEA worker in Carroll County needs to make $26.46 per hour in order to afford the fair market rent and utilities of a two-bedroom apartment without spending more than 30% of his or her income. National Low Income Housing Coalition, Out of Reach 2017
PERCENT OF INCOME SPENT ON CHILD CARE Families with two children making the median income in Carroll County pay, on average, 19.3% of their income for childcare per year. Maryland Child Care Resource Network, Child Care Demographics 2017
PERCENT OF HOUSEHOLDS IN POVERTY WITH CHILDREN THAT RECEIVE TEMPORARY CASH ASSISTANCE15.6% of families with children who live below the Federal Poverty Line in Carroll County received Temporary Cash Assistance benefits in FY 2017. FY 2017 DHR FIA Statistical Report & American Community Survey 5-Year Estimates 2012-2016
CHILDREN RECEIVING TEMPORARY CASH ASSISTANCE0.84% of children in Carroll County received Temporary Cash Assistance benefits in FY 2017. FY 2017 DHR FIA Statistical Report.
ADULTS RECEIVING TEMPORARY DISABILITY ASSISTANCE2.28% of adults in Carroll County participated in the Temporary Disability Assistance Program in FY 2017. Indi-viduals received a maximum of $185 per month. FY 2017 DHR FIA Statistical Report.
PERCENT OF POPULATION PARTICIPATING IN FOOD SUPPLEMENT PROGRAM7.6% of people in Carroll County participated in the Food Supplement Program (formerly known as Food Stamps). The average benefit was $125.05 per person per month in FFY 2017. FY 2017 DHR FIA Statistical Report.
PENETRATION RATE OF FOOD SUPPLEMENT PROGRAM6.73% of eligible individuals in Carroll County participated in the Food Supplement Program.FY 2017 DHR FIA Statistical Report & American Community Survey 5-Year Estimates 2012-2016
PERCENT OF CHILDREN WHO ARE ELIGIBLE FOR THE FREE & REDUCED PRICE MEALS PROGRAM20.0% of children in Carroll County were eligible for the FARMS program during the 2016-2017 school year, meaning their families’ incomes were at or below 185% of the Federal Poverty Line. Maryland Department of Education
MEDICAID ENROLLMENT14.2% of people in Carroll County participated in the Medicaid (Medical Assistance) Program in FY 2017.Maryland Department of Health and Mental Hygiene, Maryland Medicaid eHealth Statistics
UNINSURED POPULATION4.4% of people living in Carroll County remain uninsured. Census Bureau, American Community Survey 5-Year Estimates 2012-2016

18
IncomeRanking*
CHANGE IN POVERTY RATE FROM 1990-2016
POVERTY RATES IN CECIL COUNTY (1990 VS 2016)
41.3 %
2212121012191011
13
INDIVIDUALS LIVING IN DEEP POVERTY43.1% of people in Cecil County who live in poverty have incomes below 50% of the poverty line - $5,940 for an individual – in 2016. Census Bureau, American Community Survey 5-Year Estimates 2012-2016
INDIVIDUALS LIVING BELOW 200% OF THE FEDERAL POVERTY LINE24.8% of people in Cecil County live below 200% of the poverty line - $48,600 for a family of four in 2016.Census Bureau, American Community Survey 5-Year Estimates 2012-2016
POVERTY RATE AMONG FEMALE-HEADED HOUSEHOLDS20.1% of Female-Headed Households in Cecil County live below the poverty line - $24,300 for a family of four – in 2016. Census Bureau, American Community Survey 5-Year Estimates 2012-2016
POVERTY RATE AMONG HISPANIC OR LATINO MARYLANDERS 19.4% of Hispanic or Latino Marylanders in Cecil County live below the poverty line - $11,880 for an individual – in 2016. Census Bureau, American Community Survey 5-Year Estimates 2012-2016
POVERTY RATE AMONG BLACK OR AFRICAN AMERICAN MARYLANDERS17.7% of Black or African American Marylanders in Cecil County live below the poverty line - $11,880 for an individual – in 2016. Census Bureau, American Community Survey 5-Year Estimates 2012-2016
SENIOR POVERTY RATE6.2% of seniors in Cecil County live below the poverty line - $11,880 for an individual – in 2016.Census Bureau, American Community Survey 5-Year Estimates 2012-2016
CHILD POVERTY RATE15.4% of children in Cecil County live below the poverty line - $24,300 for a family of four – in 2016.Census Bureau, American Community Survey 5-Year Estimates 2012-2016
POVERTY RATE10.6% of people in Cecil County live below the poverty line - $24,300 for a family of four – in 2016.Census Bureau, American Community Survey 5-Year Estimates 2012-2016
MEDIAN INCOMEThe median income for households in Cecil County is $67,938.Census Bureau, American Community Survey 5-Year Estimates 2012-2016
POPULATION OF CECIL COUNTY:
100,806NUMBER OF PEOPLE IN CECIL COUNTY LIVING IN POVERTY: 1990 2016
5,206 10,729
Cecil County
Maryland Poverty Profiles 19
Income Supports
Ranking*
* Ranking - a ranking of 1 indicates the jurisdiction has the highest figure in the state in that category, and a ranking of 24 means the lowest figure in the state in that category. Therefore, being ranked 1 does not necessarily mean success in a given category.
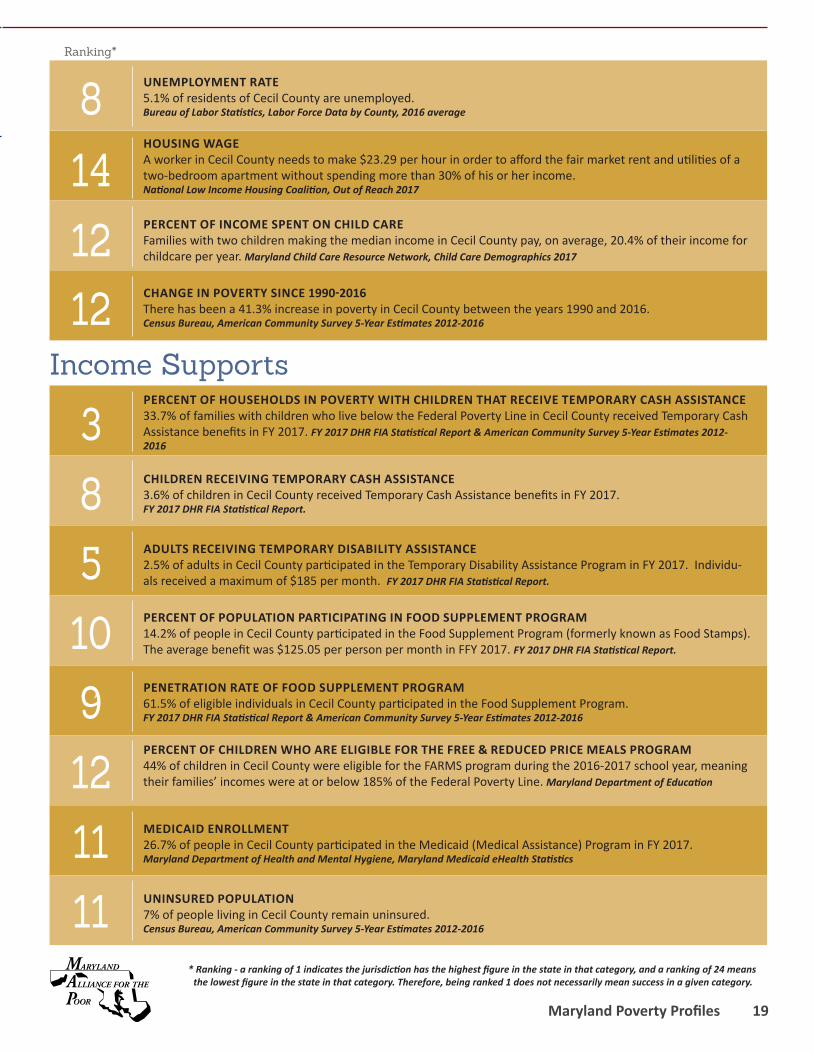
CHANGE IN POVERTY SINCE 1990-2016 There has been a 41.3% increase in poverty in Cecil County between the years 1990 and 2016. Census Bureau, American Community Survey 5-Year Estimates 2012-201612
111112910583
12148 UNEMPLOYMENT RATE
5.1% of residents of Cecil County are unemployed.Bureau of Labor Statistics, Labor Force Data by County, 2016 average
HOUSING WAGEA worker in Cecil County needs to make $23.29 per hour in order to afford the fair market rent and utilities of a two-bedroom apartment without spending more than 30% of his or her income. National Low Income Housing Coalition, Out of Reach 2017
PERCENT OF INCOME SPENT ON CHILD CARE Families with two children making the median income in Cecil County pay, on average, 20.4% of their income for childcare per year. Maryland Child Care Resource Network, Child Care Demographics 2017
PERCENT OF HOUSEHOLDS IN POVERTY WITH CHILDREN THAT RECEIVE TEMPORARY CASH ASSISTANCE33.7% of families with children who live below the Federal Poverty Line in Cecil County received Temporary Cash Assistance benefits in FY 2017. FY 2017 DHR FIA Statistical Report & American Community Survey 5-Year Estimates 2012-2016
CHILDREN RECEIVING TEMPORARY CASH ASSISTANCE3.6% of children in Cecil County received Temporary Cash Assistance benefits in FY 2017. FY 2017 DHR FIA Statistical Report.
ADULTS RECEIVING TEMPORARY DISABILITY ASSISTANCE2.5% of adults in Cecil County participated in the Temporary Disability Assistance Program in FY 2017. Individu-als received a maximum of $185 per month. FY 2017 DHR FIA Statistical Report.
PERCENT OF POPULATION PARTICIPATING IN FOOD SUPPLEMENT PROGRAM14.2% of people in Cecil County participated in the Food Supplement Program (formerly known as Food Stamps). The average benefit was $125.05 per person per month in FFY 2017. FY 2017 DHR FIA Statistical Report.
PENETRATION RATE OF FOOD SUPPLEMENT PROGRAM61.5% of eligible individuals in Cecil County participated in the Food Supplement Program.FY 2017 DHR FIA Statistical Report & American Community Survey 5-Year Estimates 2012-2016
PERCENT OF CHILDREN WHO ARE ELIGIBLE FOR THE FREE & REDUCED PRICE MEALS PROGRAM44% of children in Cecil County were eligible for the FARMS program during the 2016-2017 school year, meaning their families’ incomes were at or below 185% of the Federal Poverty Line. Maryland Department of Education
MEDICAID ENROLLMENT26.7% of people in Cecil County participated in the Medicaid (Medical Assistance) Program in FY 2017.Maryland Department of Health and Mental Hygiene, Maryland Medicaid eHealth Statistics
UNINSURED POPULATION7% of people living in Cecil County remain uninsured. Census Bureau, American Community Survey 5-Year Estimates 2012-2016

20
IncomeRanking*
CHANGE IN POVERTY RATE FROM 1990-2016
POVERTY RATES IN CHARLES COUNTY (1990 VS 2016)
54.0 %
161817192271516
5
INDIVIDUALS LIVING IN DEEP POVERTY46.0% of people in Charles County who live in poverty have incomes below 50% of the poverty line - $5,940 for an individual – in 2016. Census Bureau, American Community Survey 5-Year Estimates 2012-2016
INDIVIDUALS LIVING BELOW 200% OF THE FEDERAL POVERTY LINE17.4% of people in Charles County live below 200% of the poverty line - $48,600 for a family of four in 2016.Census Bureau, American Community Survey 5-Year Estimates 2012-2016
POVERTY RATE AMONG FEMALE-HEADED HOUSEHOLDS17.0% of Female-Headed Households in Charles County live below the poverty line - $24,300 for a family of four – in 2016. Census Bureau, American Community Survey 5-Year Estimates 2012-2016
POVERTY RATE AMONG HISPANIC OR LATINO MARYLANDERS 11.5% of Hispanic or Latino Marylanders in Charles County live below the poverty line - $11,880 for an individual – in 2016. Census Bureau, American Community Survey 5-Year Estimates 2012-2016
POVERTY RATE AMONG BLACK OR AFRICAN AMERICAN MARYLANDERS9.5% of Black or African American Marylanders in Charles County live below the poverty line - $11,880 for an individual – in 2016. Census Bureau, American Community Survey 5-Year Estimates 2012-2016
SENIOR POVERTY RATE8.1% of seniors in Charles County live below the poverty line - $11,880 for an individual – in 2016.Census Bureau, American Community Survey 5-Year Estimates 2012-2016
CHILD POVERTY RATE11.0% of children in Charles County live below the poverty line - $24,300 for a family of four – in 2016.Census Bureau, American Community Survey 5-Year Estimates 2012-2016
POVERTY RATE7.7% of people in Charles County live below the poverty line - $24,300 for a family of four – in 2016.Census Bureau, American Community Survey 5-Year Estimates 2012-2016
MEDIAN INCOMEThe median income for households in Charles County is $91,373.Census Bureau, American Community Survey 5-Year Estimates 2012-2016
POPULATION OF CHARLES COUNTY:
152,062NUMBER OF PEOPLE IN CHARLES COUNTY LIVING IN POVERTY: 1990 2016
5,007 11,637
Charles County
Maryland Poverty Profiles 21
Income Supports
Ranking*
* Ranking - a ranking of 1 indicates the jurisdiction has the highest figure in the state in that category, and a ranking of 24 means the lowest figure in the state in that category. Therefore, being ranked 1 does not necessarily mean success in a given category.
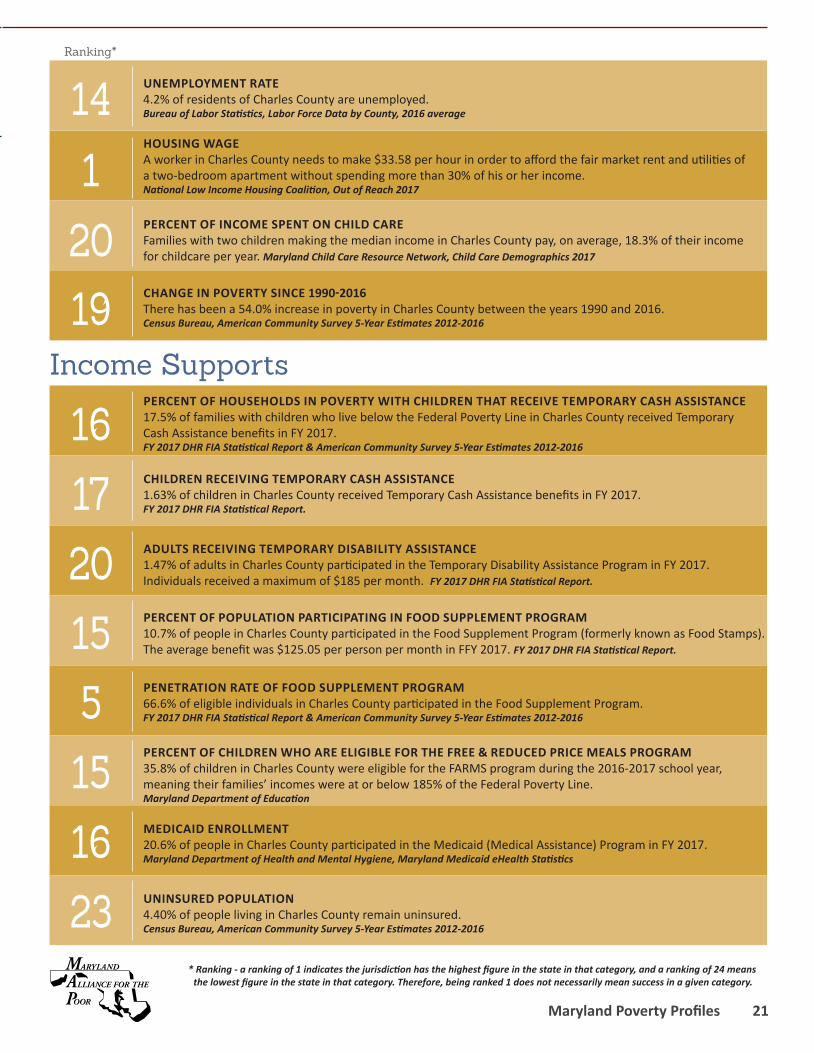
CHANGE IN POVERTY SINCE 1990-2016 There has been a 54.0% increase in poverty in Charles County between the years 1990 and 2016. Census Bureau, American Community Survey 5-Year Estimates 2012-201619
231615515201716
20114
PERCENT OF INCOME SPENT ON CHILD CARE Families with two children making the median income in Charles County pay, on average, 18.3% of their income for childcare per year. Maryland Child Care Resource Network, Child Care Demographics 2017
HOUSING WAGEA worker in Charles County needs to make $33.58 per hour in order to afford the fair market rent and utilities of a two-bedroom apartment without spending more than 30% of his or her income. National Low Income Housing Coalition, Out of Reach 2017
UNEMPLOYMENT RATE4.2% of residents of Charles County are unemployed.Bureau of Labor Statistics, Labor Force Data by County, 2016 average
PERCENT OF HOUSEHOLDS IN POVERTY WITH CHILDREN THAT RECEIVE TEMPORARY CASH ASSISTANCE17.5% of families with children who live below the Federal Poverty Line in Charles County received Temporary Cash Assistance benefits in FY 2017. FY 2017 DHR FIA Statistical Report & American Community Survey 5-Year Estimates 2012-2016
CHILDREN RECEIVING TEMPORARY CASH ASSISTANCE1.63% of children in Charles County received Temporary Cash Assistance benefits in FY 2017. FY 2017 DHR FIA Statistical Report.
ADULTS RECEIVING TEMPORARY DISABILITY ASSISTANCE1.47% of adults in Charles County participated in the Temporary Disability Assistance Program in FY 2017. Individuals received a maximum of $185 per month. FY 2017 DHR FIA Statistical Report.
PERCENT OF POPULATION PARTICIPATING IN FOOD SUPPLEMENT PROGRAM10.7% of people in Charles County participated in the Food Supplement Program (formerly known as Food Stamps). The average benefit was $125.05 per person per month in FFY 2017. FY 2017 DHR FIA Statistical Report.
PENETRATION RATE OF FOOD SUPPLEMENT PROGRAM66.6% of eligible individuals in Charles County participated in the Food Supplement Program.FY 2017 DHR FIA Statistical Report & American Community Survey 5-Year Estimates 2012-2016
PERCENT OF CHILDREN WHO ARE ELIGIBLE FOR THE FREE & REDUCED PRICE MEALS PROGRAM35.8% of children in Charles County were eligible for the FARMS program during the 2016-2017 school year, meaning their families’ incomes were at or below 185% of the Federal Poverty Line. Maryland Department of Education
MEDICAID ENROLLMENT20.6% of people in Charles County participated in the Medicaid (Medical Assistance) Program in FY 2017.Maryland Department of Health and Mental Hygiene, Maryland Medicaid eHealth Statistics
UNINSURED POPULATION4.40% of people living in Charles County remain uninsured. Census Bureau, American Community Survey 5-Year Estimates 2012-2016
22
IncomeRanking*
CHANGE IN POVERTY RATE FROM 1990-2016
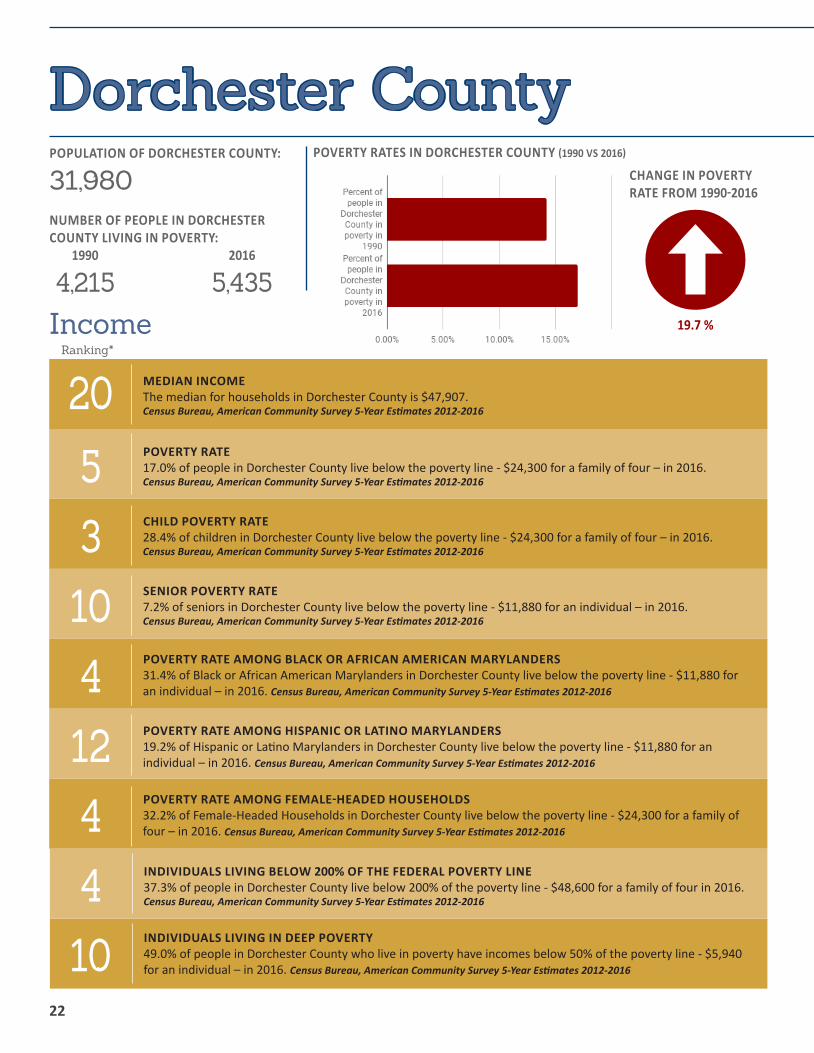
19.7 %
POVERTY RATES IN DORCHESTER COUNTY (1990 VS 2016)
10441241035
20
INDIVIDUALS LIVING IN DEEP POVERTY49.0% of people in Dorchester County who live in poverty have incomes below 50% of the poverty line - $5,940 for an individual – in 2016. Census Bureau, American Community Survey 5-Year Estimates 2012-2016
INDIVIDUALS LIVING BELOW 200% OF THE FEDERAL POVERTY LINE37.3% of people in Dorchester County live below 200% of the poverty line - $48,600 for a family of four in 2016. Census Bureau, American Community Survey 5-Year Estimates 2012-2016
POVERTY RATE AMONG FEMALE-HEADED HOUSEHOLDS32.2% of Female-Headed Households in Dorchester County live below the poverty line - $24,300 for a family of four – in 2016. Census Bureau, American Community Survey 5-Year Estimates 2012-2016
POVERTY RATE AMONG HISPANIC OR LATINO MARYLANDERS 19.2% of Hispanic or Latino Marylanders in Dorchester County live below the poverty line - $11,880 for an individual – in 2016. Census Bureau, American Community Survey 5-Year Estimates 2012-2016
POVERTY RATE AMONG BLACK OR AFRICAN AMERICAN MARYLANDERS31.4% of Black or African American Marylanders in Dorchester County live below the poverty line - $11,880 for an individual – in 2016. Census Bureau, American Community Survey 5-Year Estimates 2012-2016
SENIOR POVERTY RATE7.2% of seniors in Dorchester County live below the poverty line - $11,880 for an individual – in 2016.Census Bureau, American Community Survey 5-Year Estimates 2012-2016
CHILD POVERTY RATE28.4% of children in Dorchester County live below the poverty line - $24,300 for a family of four – in 2016.Census Bureau, American Community Survey 5-Year Estimates 2012-2016
POVERTY RATE17.0% of people in Dorchester County live below the poverty line - $24,300 for a family of four – in 2016.Census Bureau, American Community Survey 5-Year Estimates 2012-2016
MEDIAN INCOMEThe median for households in Dorchester County is $47,907.Census Bureau, American Community Survey 5-Year Estimates 2012-2016
POPULATION OF DORCHESTER COUNTY:
31,980NUMBER OF PEOPLE IN DORCHESTER COUNTY LIVING IN POVERTY: 1990 2016
4,215 5,435
Dorchester County

Maryland Poverty Profiles 23
Income Supports
Ranking*
* Ranking - a ranking of 1 indicates the jurisdiction has the highest figure in the state in that category, and a ranking of 24 means the lowest figure in the state in that category. Therefore, being ranked 1 does not necessarily mean success in a given category.
CHANGE IN POVERTY SINCE 1990-2016 There has been a 19.7% increase in poverty in Dorchester County between the years 1990 and 2016. Census Bureau, American Community Survey 5-Year Estimates 2012-20165
1533234411
13205
PERCENT OF INCOME SPENT ON CHILD CARE Families with two children making the median income in Dorchester County pay, on average, 20.1% of their income for childcare per year. Maryland Child Care Resource Network, Child Care Demographics 2017
HOUSING WAGEA worker in Dorchester County needs to make $17.17 per hour in order to afford the fair market rent and utilities of a two-bedroom apartment without spending more than 30% of his or her income. National Low Income Housing Coalition, Out of Reach 2017
UNEMPLOYMENT RATE6.0% of residents of Dorchester County are unemployed.Bureau of Labor Statistics, Labor Force Data by County, 2016 average
PERCENT OF HOUSEHOLDS IN POVERTY WITH CHILDREN THAT RECEIVE TEMPORARY CASH ASSISTANCE21.3% of families with children who live below the Federal Poverty Line in Dorchester County received Tem-porary Cash Assistance benefits in FY 2017. FY 2017 DHR FIA Statistical Report & American Community Survey 5-Year Estimates 2012-2016
CHILDREN RECEIVING TEMPORARY CASH ASSISTANCE5.10% of children in Dorchester County received Temporary Cash Assistance benefits in FY 2017. FY 2017 DHR FIA Statistical Report
ADULTS RECEIVING TEMPORARY DISABILITY ASSISTANCE2.59% of adults in Dorchester County participated in the Temporary Disability Assistance Program in FY 2017. Individuals received a maximum of $185 per month. FY 2017 DHR FIA Statistical Report
PERCENT OF POPULATION PARTICIPATING IN FOOD SUPPLEMENT PROGRAM26.1% of people in Dorchester County participated in the Food Supplement Program (formerly known as Food Stamps). The average benefit was $125.05 per person per month in FFY 2017. FY 2017 DHR FIA Statistical Report
PENETRATION RATE OF FOOD SUPPLEMENT PROGRAM76.3% of eligible individuals in Dorchester County participated in the Food Supplement Program.FY 2017 DHR FIA Statistical Report & American Community Survey 5-Year Estimates 2012-2016
PERCENT OF CHILDREN WHO ARE ELIGIBLE FOR THE FREE & REDUCED PRICE MEALS PROGRAM66.3% of children in Dorchester County were eligible for the FARMS program during the 2016-2017 school year, meaning their families’ incomes were at or below 185% of the Federal Poverty Line. Maryland Department of Education
MEDICAID ENROLLMENT40.6% of people in Dorchester County participated in the Medicaid (Medical Assistance) Program in FY 2017.Maryland Department of Health and Mental Hygiene, Maryland Medicaid eHealth Statistics
UNINSURED POPULATION6.50% of people living in Dorchester County remain uninsured. Census Bureau, American Community Survey 5-Year Estimates 2012-2016

24
IncomeRanking*
CHANGE IN POVERTY RATE FROM 1990-2016
POVERTY RATES IN FREDERICK COUNTY (1990 VS 2016)
47.9 %
2019141615151818
9
INDIVIDUALS LIVING IN DEEP POVERTY45.0% of people in Frederick County who live in poverty have incomes below 50% of the poverty line - $5,940 for an individual – in 2016. Census Bureau, American Community Survey 5-Year Estimates 2012-2016
INDIVIDUALS LIVING BELOW 200% OF THE FEDERAL POVERTY LINE17.3% of people in Frederick County live below 200% of the poverty line - $48,600 for a family of four in 2016.Census Bureau, American Community Survey 5-Year Estimates 2012-2016
POVERTY RATE AMONG FEMALE-HEADED HOUSEHOLDS18.2% of Female-Headed Households in Frederick County live below the poverty line - $24,300 for a family of four – in 2016. Census Bureau, American Community Survey 5-Year Estimates 2012-2016
POVERTY RATE AMONG HISPANIC OR LATINO MARYLANDERS 16.4% of Hispanic or Latino Marylanders in Frederick County live below the poverty line - $11,880 for an individual – in 2016. Census Bureau, American Community Survey 5-Year Estimates 2012-2016
POVERTY RATE AMONG BLACK OR AFRICAN AMERICAN MARYLANDERS15.4% of Black or African American Marylanders in Frederick County live below the poverty line - $11,880 for an individual – in 2016. Census Bureau, American Community Survey 5-Year Estimates 2012-2016
SENIOR POVERTY RATE6.6% of seniors in Frederick County live below the poverty line - $11,880 for an individual – in 2016.Census Bureau, American Community Survey 5-Year Estimates 2012-2016
CHILD POVERTY RATE9.7% of children in Frederick County live below the poverty line - $24,300 for a family of four – in 2016.Census Bureau, American Community Survey 5-Year Estimates 2012-2016
POVERTY RATE7.1% of people in Frederick County live below the poverty line - $24,300 for a family of four – in 2016.Census Bureau, American Community Survey 5-Year Estimates 2012-2016
MEDIAN INCOMEThe median income for households in Frederick County is $85,715.Census Bureau, American Community Survey 5-Year Estimates 2012-2016
POPULATION OF FREDERICK COUNTY:
238,673NUMBER OF PEOPLE IN FREDERICK COUNTY LIVING IN POVERTY: 1990 2016
7,055 16,995
Frederick County

Maryland Poverty Profiles 25
Income Supports
Ranking*
* Ranking - a ranking of 1 indicates the jurisdiction has the highest figure in the state in that category, and a ranking of 24 means the lowest figure in the state in that category. Therefore, being ranked 1 does not necessarily mean success in a given category.
CHANGE IN POVERTY SINCE 1990-2016 There has been a 47.9% increase in poverty in Frederick County between the years 1990 and 2016. Census Bureau, American Community Survey 5-Year Estimates 2012-201620
1621202020122019
161
20 UNEMPLOYMENT RATE3.7% of residents of Frederick County are unemployed.Bureau of Labor Statistics, Labor Force Data by County, 2016 average
HOUSING WAGEA worker in Frederick County needs to make $33.58 per hour in order to afford the fair market rent and utilities of a two-bedroom apartment without spending more than 30% of his or her income. National Low Income Housing Coalition, Out of Reach 2017
PERCENT OF INCOME SPENT ON CHILD CARE Families with two children making the median income in Frederick County pay, on average, 19.7% of their income for childcare per year. Maryland Child Care Resource Network, Child Care Demographics 2017
PERCENT OF HOUSEHOLDS IN POVERTY WITH CHILDREN THAT RECEIVE TEMPORARY CASH ASSISTANCE16.1% of families with children who live below the Federal Poverty Line in Frederick County received Temporary Cash Assistance benefits in FY 2017. FY 2017 DHR FIA Statistical Report & American Community Survey 5-Year Estimates 2012-2016
CHILDREN RECEIVING TEMPORARY CASH ASSISTANCE1.11% of children in Frederick County received Temporary Cash Assistance benefits in FY 2017. FY 2017 DHR FIA Statistical Report
ADULTS RECEIVING TEMPORARY DISABILITY ASSISTANCE1.89% of adults in Frederick County participated in the Temporary Disability Assistance Program in FY 2017. Individuals received a maximum of $185 per month. FY 2017 DHR FIA Statistical Report
PERCENT OF POPULATION PARTICIPATING IN FOOD SUPPLEMENT PROGRAM7.7% of people in Frederick County participated in the Food Supplement Program (formerly known as Food Stamps). The average benefit was $125.05 per person per month in FFY 2017. FY 2017 DHR FIA Statistical Report.
PENETRATION RATE OF FOOD SUPPLEMENT PROGRAM49.4% of eligible individuals in Frederick County participated in the Food Supplement Program.FY 2017 DHR FIA Statistical Report & American Community Survey 5-Year Estimates 2012-2016
PERCENT OF CHILDREN WHO ARE ELIGIBLE FOR THE FREE & REDUCED PRICE MEALS PROGRAM26.8% of children in Frederick County were eligible for the FARMS program during the 2016-2017 school year, meaning their families’ incomes were at or below 185% of the Federal Poverty Line. Maryland Department of Education
MEDICAID ENROLLMENT16.6% of people in Frederick County participated in the Medicaid (Medical Assistance) Program in FY 2017.Maryland Department of Health and Mental Hygiene, Maryland Medicaid eHealth Statistics
UNINSURED POPULATION6.10% of people living in Frederick County remain uninsured. Census Bureau, American Community Survey 5-Year Estimates 2012-2016
26
IncomeRanking*
CHANGE IN POVERTY RATE FROM 1990-2016
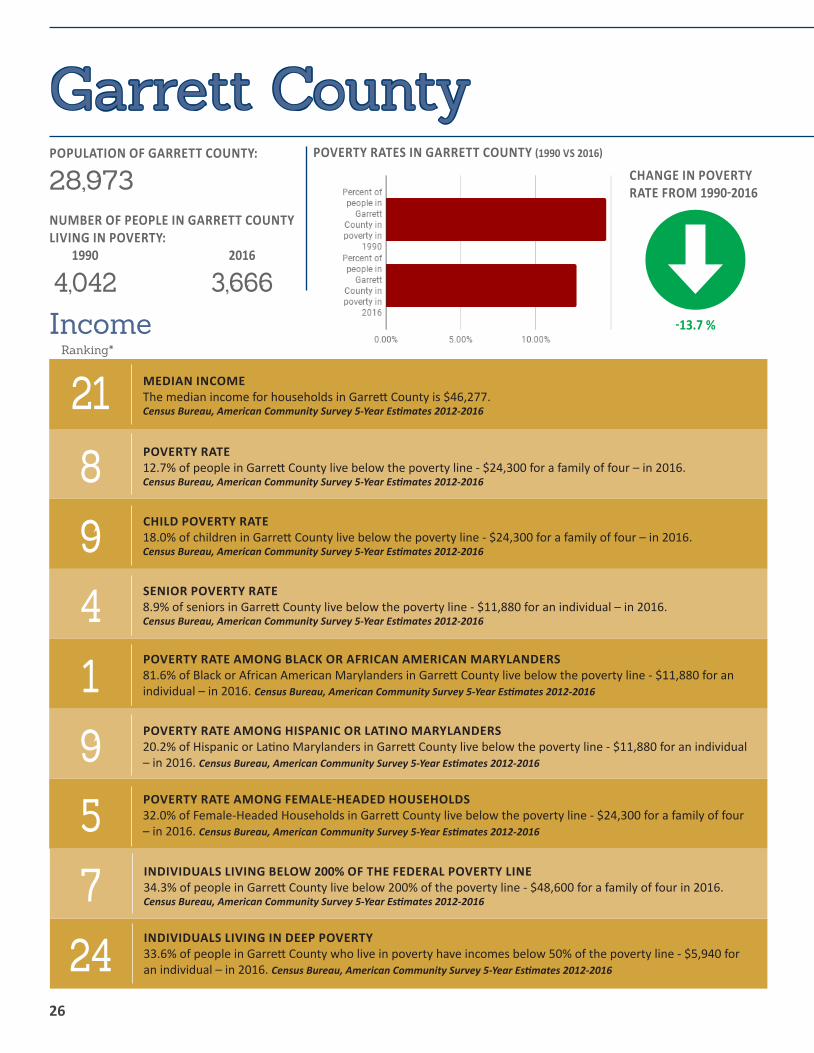
POVERTY RATES IN GARRETT COUNTY (1990 VS 2016)
-13.7 %
247591498
21
INDIVIDUALS LIVING IN DEEP POVERTY33.6% of people in Garrett County who live in poverty have incomes below 50% of the poverty line - $5,940 for an individual – in 2016. Census Bureau, American Community Survey 5-Year Estimates 2012-2016
INDIVIDUALS LIVING BELOW 200% OF THE FEDERAL POVERTY LINE34.3% of people in Garrett County live below 200% of the poverty line - $48,600 for a family of four in 2016.Census Bureau, American Community Survey 5-Year Estimates 2012-2016
POVERTY RATE AMONG FEMALE-HEADED HOUSEHOLDS32.0% of Female-Headed Households in Garrett County live below the poverty line - $24,300 for a family of four – in 2016. Census Bureau, American Community Survey 5-Year Estimates 2012-2016
POVERTY RATE AMONG HISPANIC OR LATINO MARYLANDERS 20.2% of Hispanic or Latino Marylanders in Garrett County live below the poverty line - $11,880 for an individual – in 2016. Census Bureau, American Community Survey 5-Year Estimates 2012-2016
POVERTY RATE AMONG BLACK OR AFRICAN AMERICAN MARYLANDERS81.6% of Black or African American Marylanders in Garrett County live below the poverty line - $11,880 for an individual – in 2016. Census Bureau, American Community Survey 5-Year Estimates 2012-2016
SENIOR POVERTY RATE8.9% of seniors in Garrett County live below the poverty line - $11,880 for an individual – in 2016.Census Bureau, American Community Survey 5-Year Estimates 2012-2016
CHILD POVERTY RATE18.0% of children in Garrett County live below the poverty line - $24,300 for a family of four – in 2016.Census Bureau, American Community Survey 5-Year Estimates 2012-2016
POVERTY RATE12.7% of people in Garrett County live below the poverty line - $24,300 for a family of four – in 2016.Census Bureau, American Community Survey 5-Year Estimates 2012-2016
MEDIAN INCOMEThe median income for households in Garrett County is $46,277.Census Bureau, American Community Survey 5-Year Estimates 2012-2016
POPULATION OF GARRETT COUNTY:
28,973NUMBER OF PEOPLE IN GARRETT COUNTY LIVING IN POVERTY: 1990 2016
4,042 3,666
Garrett County

Maryland Poverty Profiles 27
Income Supports
Ranking*
* Ranking - a ranking of 1 indicates the jurisdiction has the highest figure in the state in that category, and a ranking of 24 means the lowest figure in the state in that category. Therefore, being ranked 1 does not necessarily mean success in a given category.
CHANGE IN POVERTY SINCE 1990-2016 There has been a -13.7% decrease in poverty in Garrett County between the years 1990 and 2016. Census Bureau, American Community Survey 5-Year Estimates 2012-20164
781023981324
19227 UNEMPLOYMENT RATE
5.5% of residents of Garrett County are unemployed.Bureau of Labor Statistics, Labor Force Data by County, 2016 average
HOUSING WAGEA worker in Garrett County needs to make $14.60 per hour in order to afford the fair market rent and utilities of a two-bedroom apartment without spending more than 30% of his or her income. National Low Income Housing Coalition, Out of Reach 2017
PERCENT OF INCOME SPENT ON CHILD CARE Families with two children making the median income in Garrett County pay, on average, 18.7% of their income for childcare per year. Maryland Child Care Resource Network, Child Care Demographics 2017
PERCENT OF HOUSEHOLDS IN POVERTY WITH CHILDREN THAT RECEIVE TEMPORARY CASH ASSISTANCE11.2% of families with children who live below the Federal Poverty Line in Garrett County received Temporary Cash Assistance benefits in FY 2017. FY 2017 DHR FIA Statistical Report & American Community Survey 5-Year Estimates 2012-2016
CHILDREN RECEIVING TEMPORARY CASH ASSISTANCE1.92% of children in Garrett County received Temporary Cash Assistance benefits in FY 2017. FY 2017 DHR FIA Statistical Report
ADULTS RECEIVING TEMPORARY DISABILITY ASSISTANCE2.18% of adults in Garrett County participated in the Temporary Disability Assistance Program in FY 2017. Individuals received a maximum of $185 per month. FY 2017 DHR FIA Statistical Report
PERCENT OF POPULATION PARTICIPATING IN FOOD SUPPLEMENT PROGRAM14.5% of people in Garrett County participated in the Food Supplement Program (formerly known as Food Stamps). The average benefit was $125.05 per person per month in FFY 2017. FY 2017 DHR FIA Statistical Report.
PENETRATION RATE OF FOOD SUPPLEMENT PROGRAM45.5% of eligible individuals in Garrett County participated in the Food Supplement Program.FY 2017 DHR FIA Statistical Report & American Community Survey 5-Year Estimates 2012-2016
PERCENT OF CHILDREN WHO ARE ELIGIBLE FOR THE FREE & REDUCED PRICE MEALS PROGRAM48.8% of children in Garrett County were eligible for the FARMS program during the 2016-2017 school year, meaning their families’ incomes were at or below 185% of the Federal Poverty Line. Maryland Department of Education
MEDICAID ENROLLMENT30.5% of people in Garrett County participated in the Medicaid (Medical Assistance) Program in FY 2017.Maryland Department of Health and Mental Hygiene, Maryland Medicaid eHealth Statistics
UNINSURED POPULATION8.90% of people living in Garrett County remain uninsured. Census Bureau, American Community Survey 5-Year Estimates 2012-2016

28
IncomeRanking*
CHANGE IN POVERTY RATE FROM 1990-2016
POVERTY RATES IN HARFORD COUNTY (1990 VS 2016)
51.0 %
516121816181716
10
INDIVIDUALS LIVING IN DEEP POVERTY51.4% of people in Harford County who live in poverty have incomes below 50% of the poverty line - $5,940 for an individual – in 2016. Census Bureau, American Community Survey 5-Year Estimates 2012-2016
INDIVIDUALS LIVING BELOW 200% OF THE FEDERAL POVERTY LINE18.4% of people in Harford County live below 200% of the poverty line - $48,600 for a family of four in 2016.Census Bureau, American Community Survey 5-Year Estimates 2012-2016
POVERTY RATE AMONG FEMALE-HEADED HOUSEHOLDS20.0% of Female-Headed Households in Harford County live below the poverty line - $24,300 for a family of four – in 2016. Census Bureau, American Community Survey 5-Year Estimates 2012-2016
POVERTY RATE AMONG HISPANIC OR LATINO MARYLANDERS 11.6% of Hispanic or Latino Marylanders in Harford County live below the poverty line - $11,880 for an individual – in 2016. Census Bureau, American Community Survey 5-Year Estimates 2012-2016
POVERTY RATE AMONG BLACK OR AFRICAN AMERICAN MARYLANDERS14.8% of Black or African American Marylanders in Harford County live below the poverty line - $11,880 for an individual – in 2016. Census Bureau, American Community Survey 5-Year Estimates 2012-2016
SENIOR POVERTY RATE6.5% of seniors in Harford County live below the poverty line - $11,880 for an individual – in 2016.Census Bureau, American Community Survey 5-Year Estimates 2012-2016
CHILD POVERTY RATE9.8% of children in Harford County live below the poverty line - $24,300 for a family of four – in 2016.Census Bureau, American Community Survey 5-Year Estimates 2012-2016
POVERTY RATE7.7% of people in Harford County live below the poverty line - $24,300 for a family of four – in 2016.Census Bureau, American Community Survey 5-Year Estimates 2012-2016
MEDIAN INCOMEThe median income for households in Harford County is $81,052.Census Bureau, American Community Survey 5-Year Estimates 2012-2016
POPULATION OF HARFORD COUNTY:
247,472NUMBER OF PEOPLE IN HARFORD COUNTY LIVING IN POVERTY: 1990 2016
9,122 19,012
Harford County

Maryland Poverty Profiles 29
Income Supports
Ranking*
* Ranking - a ranking of 1 indicates the jurisdiction has the highest figure in the state in that category, and a ranking of 24 means the lowest figure in the state in that category. Therefore, being ranked 1 does not necessarily mean success in a given category.
CHANGE IN POVERTY SINCE 1990-2016 There has been a 51.0% increase in poverty in Harford County between the years 1990 and 2016. Census Bureau, American Community Survey 5-Year Estimates 2012-201618
2219191718181814
8615
UNINSURED POPULATION4.60% of people living in Harford County remain uninsured. Census Bureau, American Community Survey 5-Year Estimates 2012-2016
MEDICAID ENROLLMENT17.8% of people in Harford County participated in the Medicaid (Medical Assistance) Program in FY 2017.Maryland Department of Health and Mental Hygiene, Maryland Medicaid eHealth Statistics
PERCENT OF CHILDREN WHO ARE ELIGIBLE FOR THE FREE & REDUCED PRICE MEALS PROGRAM31.0% of children in Harford County were eligible for the FARMS program during the 2016-2017 school year, meaning their families’ incomes were at or below 185% of the Federal Poverty Line. Maryland Department of Education
PENETRATION RATE OF FOOD SUPPLEMENT PROGRAM51.2% of eligible individuals in Harford County participated in the Food Supplement Program.FY 2017 DHR FIA Statistical Report & American Community Survey 5-Year Estimates 2012-2016
PERCENT OF POPULATION PARTICIPATING IN FOOD SUPPLEMENT PROGRAM8.3% of people in Harford County participated in the Food Supplement Program (formerly known as Food Stamps). The average benefit was $125.05 per person per month in FFY 2017. FY 2017 DHR FIA Statistical Report
ADULTS RECEIVING TEMPORARY DISABILITY ASSISTANCE1.60% of adults in Harford County participated in the Temporary Disability Assistance Program in FY 2017. Individuals received a maximum of $185 per month. FY 2017 DHR FIA Statistical Report
CHILDREN RECEIVING TEMPORARY CASH ASSISTANCE1.48% of children in Harford County received Temporary Cash Assistance benefits in FY 2017. FY 2017 DHR FIA Statistical Report
PERCENT OF HOUSEHOLDS IN POVERTY WITH CHILDREN THAT RECEIVE TEMPORARY CASH ASSISTANCE18.6% of families with children who live below the Federal Poverty Line in Harford County received Temporary Cash Assistance benefits in FY 2017. FY 2017 DHR FIA Statistical Report & American Community Survey 5-Year Estimates 2012-2016
PERCENT OF INCOME SPENT ON CHILD CARE Families with two children making the median income in Harford County pay, on average, 21.2% of their income for childcare per year. Maryland Child Care Resource Network, Child Care Demographics 2017
HOUSING WAGEA worker in Harford County needs to make $26.46 per hour in order to afford the fair market rent and utilities of a two-bedroom apartment without spending more than 30% of his or her income. National Low Income Housing Coalition, Out of Reach 2017
UNEMPLOYMENT RATE4.1% of residents of Harford County are unemployed.Bureau of Labor Statistics, Labor Force Data by County, 2016 average
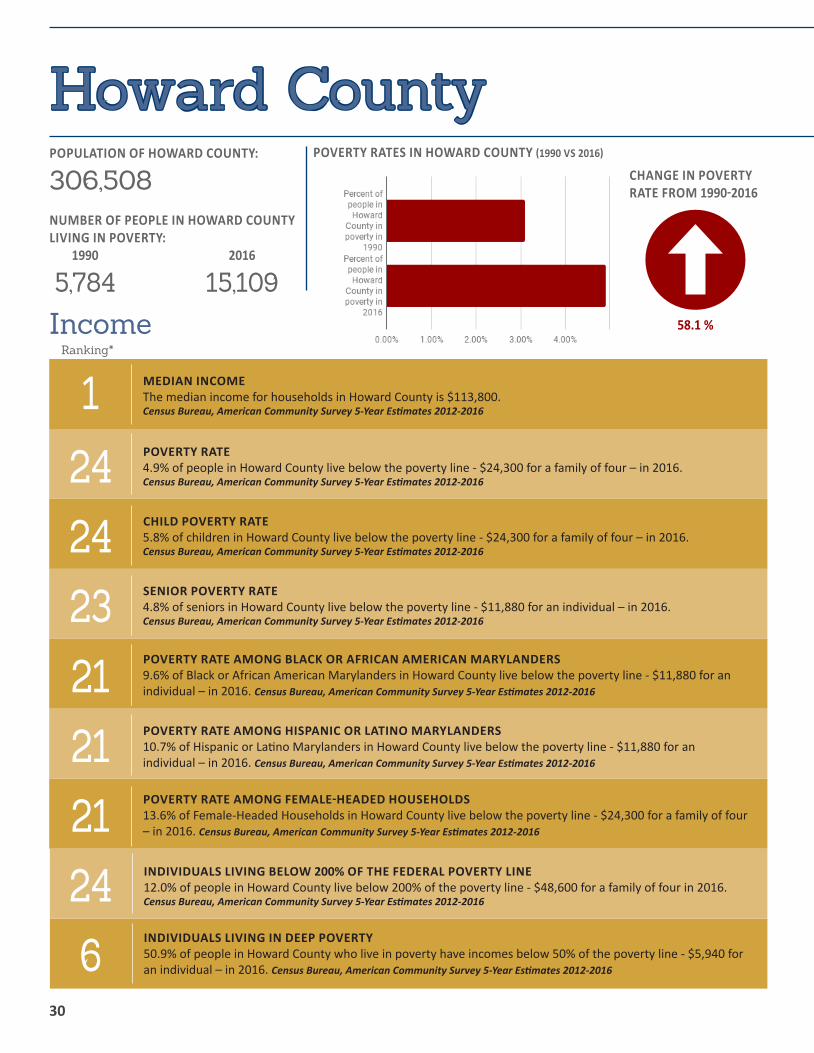
30
IncomeRanking*
CHANGE IN POVERTY RATE FROM 1990-2016
POVERTY RATES IN HOWARD COUNTY (1990 VS 2016)
58.1 %
624212121232424
1
INDIVIDUALS LIVING IN DEEP POVERTY50.9% of people in Howard County who live in poverty have incomes below 50% of the poverty line - $5,940 for an individual – in 2016. Census Bureau, American Community Survey 5-Year Estimates 2012-2016
INDIVIDUALS LIVING BELOW 200% OF THE FEDERAL POVERTY LINE12.0% of people in Howard County live below 200% of the poverty line - $48,600 for a family of four in 2016.Census Bureau, American Community Survey 5-Year Estimates 2012-2016
POVERTY RATE AMONG FEMALE-HEADED HOUSEHOLDS13.6% of Female-Headed Households in Howard County live below the poverty line - $24,300 for a family of four – in 2016. Census Bureau, American Community Survey 5-Year Estimates 2012-2016
POVERTY RATE AMONG HISPANIC OR LATINO MARYLANDERS 10.7% of Hispanic or Latino Marylanders in Howard County live below the poverty line - $11,880 for an individual – in 2016. Census Bureau, American Community Survey 5-Year Estimates 2012-2016
POVERTY RATE AMONG BLACK OR AFRICAN AMERICAN MARYLANDERS9.6% of Black or African American Marylanders in Howard County live below the poverty line - $11,880 for an individual – in 2016. Census Bureau, American Community Survey 5-Year Estimates 2012-2016
SENIOR POVERTY RATE4.8% of seniors in Howard County live below the poverty line - $11,880 for an individual – in 2016.Census Bureau, American Community Survey 5-Year Estimates 2012-2016
CHILD POVERTY RATE5.8% of children in Howard County live below the poverty line - $24,300 for a family of four – in 2016.Census Bureau, American Community Survey 5-Year Estimates 2012-2016
POVERTY RATE4.9% of people in Howard County live below the poverty line - $24,300 for a family of four – in 2016.Census Bureau, American Community Survey 5-Year Estimates 2012-2016
MEDIAN INCOMEThe median income for households in Howard County is $113,800.Census Bureau, American Community Survey 5-Year Estimates 2012-2016
POPULATION OF HOWARD COUNTY:
306,508NUMBER OF PEOPLE IN HOWARD COUNTY LIVING IN POVERTY: 1990 2016
5,784 15,109
Howard County
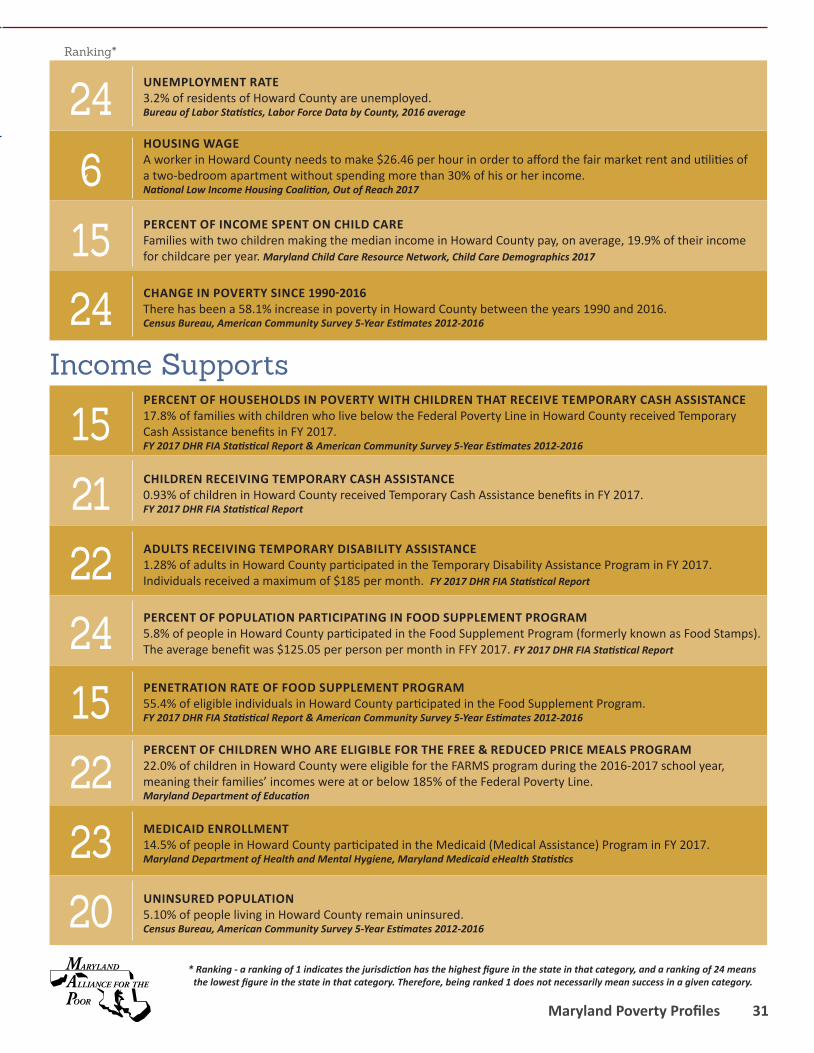
Maryland Poverty Profiles 31
Income Supports
Ranking*
* Ranking - a ranking of 1 indicates the jurisdiction has the highest figure in the state in that category, and a ranking of 24 means the lowest figure in the state in that category. Therefore, being ranked 1 does not necessarily mean success in a given category.
CHANGE IN POVERTY SINCE 1990-2016 There has been a 58.1% increase in poverty in Howard County between the years 1990 and 2016. Census Bureau, American Community Survey 5-Year Estimates 2012-201624
2023221524222115
15624 UNEMPLOYMENT RATE
3.2% of residents of Howard County are unemployed.Bureau of Labor Statistics, Labor Force Data by County, 2016 average
HOUSING WAGEA worker in Howard County needs to make $26.46 per hour in order to afford the fair market rent and utilities of a two-bedroom apartment without spending more than 30% of his or her income. National Low Income Housing Coalition, Out of Reach 2017
PERCENT OF INCOME SPENT ON CHILD CARE Families with two children making the median income in Howard County pay, on average, 19.9% of their income for childcare per year. Maryland Child Care Resource Network, Child Care Demographics 2017
PERCENT OF HOUSEHOLDS IN POVERTY WITH CHILDREN THAT RECEIVE TEMPORARY CASH ASSISTANCE17.8% of families with children who live below the Federal Poverty Line in Howard County received Temporary Cash Assistance benefits in FY 2017. FY 2017 DHR FIA Statistical Report & American Community Survey 5-Year Estimates 2012-2016
CHILDREN RECEIVING TEMPORARY CASH ASSISTANCE0.93% of children in Howard County received Temporary Cash Assistance benefits in FY 2017. FY 2017 DHR FIA Statistical Report
ADULTS RECEIVING TEMPORARY DISABILITY ASSISTANCE1.28% of adults in Howard County participated in the Temporary Disability Assistance Program in FY 2017. Individuals received a maximum of $185 per month. FY 2017 DHR FIA Statistical Report
PERCENT OF POPULATION PARTICIPATING IN FOOD SUPPLEMENT PROGRAM5.8% of people in Howard County participated in the Food Supplement Program (formerly known as Food Stamps). The average benefit was $125.05 per person per month in FFY 2017. FY 2017 DHR FIA Statistical Report
PENETRATION RATE OF FOOD SUPPLEMENT PROGRAM55.4% of eligible individuals in Howard County participated in the Food Supplement Program.FY 2017 DHR FIA Statistical Report & American Community Survey 5-Year Estimates 2012-2016
PERCENT OF CHILDREN WHO ARE ELIGIBLE FOR THE FREE & REDUCED PRICE MEALS PROGRAM22.0% of children in Howard County were eligible for the FARMS program during the 2016-2017 school year, meaning their families’ incomes were at or below 185% of the Federal Poverty Line. Maryland Department of Education
MEDICAID ENROLLMENT14.5% of people in Howard County participated in the Medicaid (Medical Assistance) Program in FY 2017.Maryland Department of Health and Mental Hygiene, Maryland Medicaid eHealth Statistics
UNINSURED POPULATION5.10% of people living in Howard County remain uninsured. Census Bureau, American Community Survey 5-Year Estimates 2012-2016

32
IncomeRanking*
CHANGE IN POVERTY RATE FROM 1990-2016
POVERTY RATES IN KENT COUNTY (1990 VS 2016)
4.3 %
19111492189
17
INDIVIDUALS LIVING IN DEEP POVERTY62.2% of people in Kent County who live in poverty have incomes below 50% of the poverty line - $5,940 for an individual – in 2016. Census Bureau, American Community Survey 5-Year Estimates 2012-2016
INDIVIDUALS LIVING BELOW 200% OF THE FEDERAL POVERTY LINE29.3% of people in Kent County live below 200% of the poverty line - $48,600 for a family of four in 2016.Census Bureau, American Community Survey 5-Year Estimates 2012-2016
POVERTY RATE AMONG FEMALE-HEADED HOUSEHOLDS22.8% of Female-Headed Households in Kent County live below the poverty line - $24,300 for a family of four – in 2016. Census Bureau, American Community Survey 5-Year Estimates 2012-2016
POVERTY RATE AMONG HISPANIC OR LATINO MARYLANDERS 17.5% of Hispanic or Latino Marylanders in Kent County live below the poverty line - $11,880 for an individual – in 2016. Census Bureau, American Community Survey 5-Year Estimates 2012-2016
POVERTY RATE AMONG BLACK OR AFRICAN AMERICAN MARYLANDERS23.6% of Black or African American Marylanders in Kent County live below the poverty line - $11,880 for an individual – in 2016. Census Bureau, American Community Survey 5-Year Estimates 2012-2016
SENIOR POVERTY RATE5.6% of seniors in Kent County live below the poverty line - $11,880 for an individual – in 2016.Census Bureau, American Community Survey 5-Year Estimates 2012-2016
CHILD POVERTY RATE18.9% of children in Kent County live below the poverty line - $24,300 for a family of four – in 2016.Census Bureau, American Community Survey 5-Year Estimates 2012-2016
POVERTY RATE12.0% of people in Kent County live below the poverty line - $24,300 for a family of four – in 2016.Census Bureau, American Community Survey 5-Year Estimates 2012-2016
MEDIAN INCOMEThe median income for households in Kent County is $55,028.Census Bureau, American Community Survey 5-Year Estimates 2012-2016
POPULATION OF KENT COUNTY:
18,284NUMBER OF PEOPLE IN KENT COUNTY LIVING IN POVERTY: 1990 2016
1,943 2,193
Kent County

Maryland Poverty Profiles 33
Income Supports
Ranking*
* Ranking - a ranking of 1 indicates the jurisdiction has the highest figure in the state in that category, and a ranking of 24 means the lowest figure in the state in that category. Therefore, being ranked 1 does not necessarily mean success in a given category.
CHANGE IN POVERTY SINCE 1990-2016 There has been a 4.3% increase in poverty in Kent County between the years 1990 and 2016. Census Bureau, American Community Survey 5-Year Estimates 2012-20168
14981482176
51610
PERCENT OF INCOME SPENT ON CHILD CARE Families with two children making the median income in Kent County pay, on average, 21.8% of their income for childcare per year. Maryland Child Care Resource Network, Child Care Demographics 2017
HOUSING WAGEA worker in Kent County needs to make $21.62 per hour in order to afford the fair market rent and utilities of a two-bedroom apartment without spending more than 30% of his or her income. National Low Income Housing Coalition, Out of Reach 2017
UNEMPLOYMENT RATE4.7% of residents of Kent County are unemployed.Bureau of Labor Statistics, Labor Force Data by County, 2016 average
PERCENT OF HOUSEHOLDS IN POVERTY WITH CHILDREN THAT RECEIVE TEMPORARY CASH ASSISTANCE27.3% of families with children who live below the Federal Poverty Line in Kent County received Temporary Cash Assistance benefits in FY 2017. FY 2017 DHR FIA Statistical Report & American Community Survey 5-Year Estimates 2012-2016
CHILDREN RECEIVING TEMPORARY CASH ASSISTANCE4.02% of children in Kent County received Temporary Cash Assistance benefits in FY 2017. FY 2017 DHR FIA Statistical Report
ADULTS RECEIVING TEMPORARY DISABILITY ASSISTANCE1.37% of adults in Kent County participated in the Temporary Disability Assistance Program in FY 2017. Individuals received a maximum of $185 per month. FY 2017 DHR FIA Statistical Report
PERCENT OF POPULATION PARTICIPATING IN FOOD SUPPLEMENT PROGRAM15.4% of people in Kent County participated in the Food Supplement Program (formerly known as Food Stamps). The average benefit was $125.05 per person per month in FFY 2017. FY 2017 DHR FIA Statistical Report
PENETRATION RATE OF FOOD SUPPLEMENT PROGRAM57.7% of eligible individuals in Kent County participated in the Food Supplement Program.FY 2017 DHR FIA Statistical Report & American Community Survey 5-Year Estimates 2012-2016
PERCENT OF CHILDREN WHO ARE ELIGIBLE FOR THE FREE & REDUCED PRICE MEALS PROGRAM53.0% of children in Kent County were eligible for the FARMS program during the 2016-2017 school year, meaning their families’ incomes were at or below 185% of the Federal Poverty Line. Maryland Department of Education
MEDICAID ENROLLMENT27.5% of people in Kent County participated in the Medicaid (Medical Assistance) Program in FY 2017.Maryland Department of Health and Mental Hygiene, Maryland Medicaid eHealth Statistics
UNINSURED POPULATION6.60% of people living in Kent County remain uninsured. Census Bureau, American Community Survey 5-Year Estimates 2012-2016
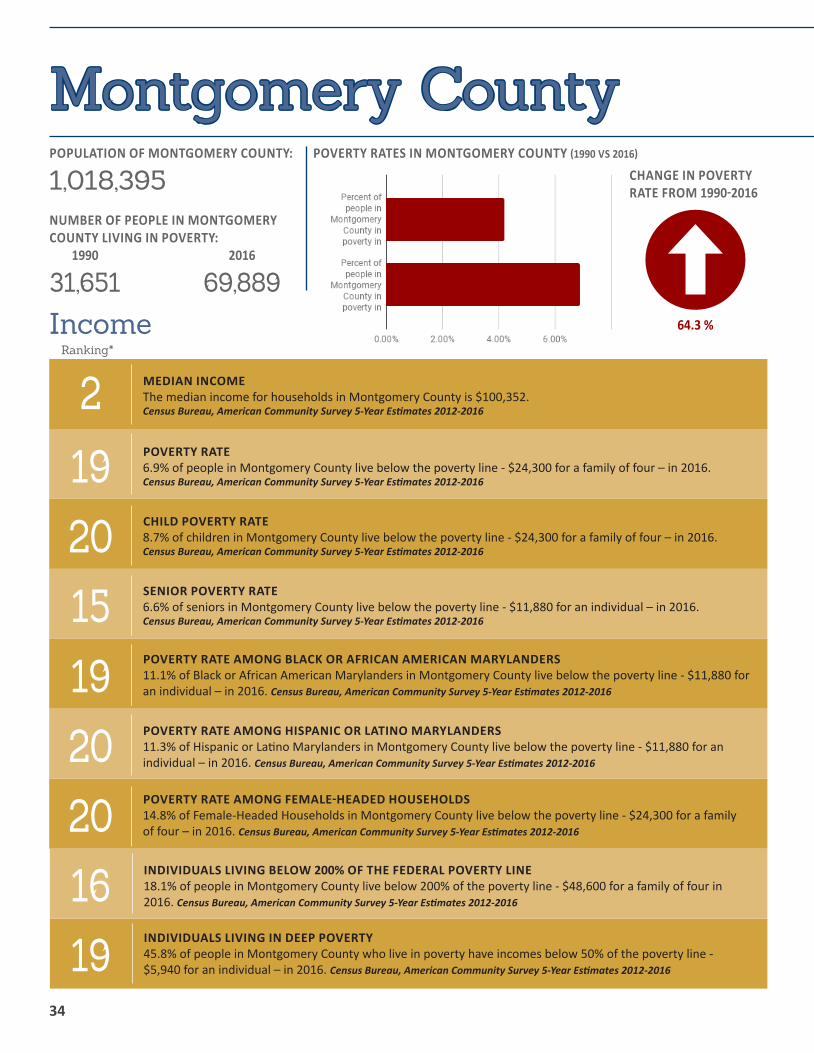
34
IncomeRanking*
CHANGE IN POVERTY RATE FROM 1990-2016
POVERTY RATES IN MONTGOMERY COUNTY (1990 VS 2016)
64.3 %
1916202019152019
2
INDIVIDUALS LIVING IN DEEP POVERTY45.8% of people in Montgomery County who live in poverty have incomes below 50% of the poverty line - $5,940 for an individual – in 2016. Census Bureau, American Community Survey 5-Year Estimates 2012-2016
INDIVIDUALS LIVING BELOW 200% OF THE FEDERAL POVERTY LINE18.1% of people in Montgomery County live below 200% of the poverty line - $48,600 for a family of four in 2016. Census Bureau, American Community Survey 5-Year Estimates 2012-2016
POVERTY RATE AMONG FEMALE-HEADED HOUSEHOLDS14.8% of Female-Headed Households in Montgomery County live below the poverty line - $24,300 for a family of four – in 2016. Census Bureau, American Community Survey 5-Year Estimates 2012-2016
POVERTY RATE AMONG HISPANIC OR LATINO MARYLANDERS 11.3% of Hispanic or Latino Marylanders in Montgomery County live below the poverty line - $11,880 for an individual – in 2016. Census Bureau, American Community Survey 5-Year Estimates 2012-2016
POVERTY RATE AMONG BLACK OR AFRICAN AMERICAN MARYLANDERS11.1% of Black or African American Marylanders in Montgomery County live below the poverty line - $11,880 for an individual – in 2016. Census Bureau, American Community Survey 5-Year Estimates 2012-2016
SENIOR POVERTY RATE6.6% of seniors in Montgomery County live below the poverty line - $11,880 for an individual – in 2016.Census Bureau, American Community Survey 5-Year Estimates 2012-2016
CHILD POVERTY RATE8.7% of children in Montgomery County live below the poverty line - $24,300 for a family of four – in 2016.Census Bureau, American Community Survey 5-Year Estimates 2012-2016
POVERTY RATE6.9% of people in Montgomery County live below the poverty line - $24,300 for a family of four – in 2016.Census Bureau, American Community Survey 5-Year Estimates 2012-2016
MEDIAN INCOMEThe median income for households in Montgomery County is $100,352.Census Bureau, American Community Survey 5-Year Estimates 2012-2016
POPULATION OF MONTGOMERY COUNTY:
1,018,395NUMBER OF PEOPLE IN MONTGOMERY COUNTY LIVING IN POVERTY: 1990 2016
31,651 69,889
Montgomery County

Maryland Poverty Profiles 35
Income Supports
Ranking*
* Ranking - a ranking of 1 indicates the jurisdiction has the highest figure in the state in that category, and a ranking of 24 means the lowest figure in the state in that category. Therefore, being ranked 1 does not necessarily mean success in a given category.
CHANGE IN POVERTY SINCE 1990-2016 There has been a 64.3% increase in poverty in Montgomery County between the years 1990 and 2016. Census Bureau, American Community Survey 5-Year Estimates 2012-201622
317162423232423
71
23
PERCENT OF INCOME SPENT ON CHILD CARE Families with two children making the median income in Montgomery County pay, on average, 21.5% of their income for childcare per year. Maryland Child Care Resource Network, Child Care Demographics 2017
HOUSING WAGEA worker in Montgomery County needs to make $33.58 per hour in order to afford the fair market rent and utilities of a two-bedroom apartment without spending more than 30% of his or her income. National Low Income Housing Coalition, Out of Reach 2017
UNEMPLOYMENT RATE3.3% of residents of Montgomery County are unemployed.Bureau of Labor Statistics, Labor Force Data by County, 2016 average
PERCENT OF HOUSEHOLDS IN POVERTY WITH CHILDREN THAT RECEIVE TEMPORARY CASH ASSISTANCE11.5% of families with children who live below the Federal Poverty Line in Montgomery County received Tempo-rary Cash Assistance benefits in FY 2017. FY 2017 DHR FIA Statistical Report & American Community Survey 5-Year Estimates 2012-2016
CHILDREN RECEIVING TEMPORARY CASH ASSISTANCE0.83% of children in Montgomery County received Temporary Cash Assistance benefits in FY 2017. FY 2017 DHR FIA Statistical Report
ADULTS RECEIVING TEMPORARY DISABILITY ASSISTANCE0.81% of adults in Montgomery County participated in the Temporary Disability Assistance Program in FY 2017. Individuals received a maximum of $185 per month. FY 2017 DHR FIA Statistical Report
PERCENT OF POPULATION PARTICIPATING IN FOOD SUPPLEMENT PROGRAM6.4% of people in Montgomery County participated in the Food Supplement Program (formerly known as Food Stamps). The average benefit was $125.05 per person per month in FFY 2017. FY 2017 DHR FIA Statistical Report
PENETRATION RATE OF FOOD SUPPLEMENT PROGRAM39.4% of eligible individuals in Montgomery County participated in the Food Supplement Program.FY 2017 DHR FIA Statistical Report & American Community Survey 5-Year Estimates 2012-2016
PERCENT OF CHILDREN WHO ARE ELIGIBLE FOR THE FREE & REDUCED PRICE MEALS PROGRAM34.5% of children in Montgomery County were eligible for the FARMS program during the 2016-2017 school year, meaning their families’ incomes were at or below 185% of the Federal Poverty Line. Maryland Department of Education
MEDICAID ENROLLMENT18.3% of people in Montgomery County participated in the Medicaid (Medical Assistance) Program in FY 2017.Maryland Department of Health and Mental Hygiene, Maryland Medicaid eHealth Statistics
UNINSURED POPULATION9.30% of people living in Montgomery County remain uninsured. Census Bureau, American Community Survey 5-Year Estimates 2012-2016

36
IncomeRanking*
CHANGE IN POVERTY RATE FROM 1990-2016
POVERTY RATES IN PRINCE GEORGE’S COUNTY (1990 VS 2016)
67.2 %
181322172491313
11
INDIVIDUALS LIVING IN DEEP POVERTY45.8% of people in Prince George’s County who live in poverty have incomes below 50% of the poverty line - $5,940 for an individual – in 2016. Census Bureau, American Community Survey 5-Year Estimates 2012-2016
INDIVIDUALS LIVING BELOW 200% OF THE FEDERAL POVERTY LINE24.2% of people in Prince George’s County live below 200% of the poverty line - $48,600 for a family of four in 2016. Census Bureau, American Community Survey 5-Year Estimates 2012-2016
POVERTY RATE AMONG FEMALE-HEADED HOUSEHOLDS13.5% of Female-Headed Households in Prince George’s County live below the poverty line - $24,300 for a family of four – in 2016. Census Bureau, American Community Survey 5-Year Estimates 2012-2016
POVERTY RATE AMONG HISPANIC OR LATINO MARYLANDERS 13.9% of Hispanic or Latino Marylanders in Prince George’s County live below the poverty line - $11,880 for an individual – in 2016. Census Bureau, American Community Survey 5-Year Estimates 2012-2016
POVERTY RATE AMONG BLACK OR AFRICAN AMERICAN MARYLANDERS8.7% of Black or African American Marylanders in Prince George’s County live below the poverty line - $11,880 for an individual – in 2016. Census Bureau, American Community Survey 5-Year Estimates 2012-2016
SENIOR POVERTY RATE7.3% of seniors in Prince George’s County live below the poverty line - $11,880 for an individual – in 2016.Census Bureau, American Community Survey 5-Year Estimates 2012-2016
CHILD POVERTY RATE13.7% of children in Prince George’s County live below the poverty line - $24,300 for a family of four – in 2016.Census Bureau, American Community Survey 5-Year Estimates 2012-2016
POVERTY RATE9.7% of people in Prince George’s County live below the poverty line - $24,300 for a family of four – in 2016.Census Bureau, American Community Survey 5-Year Estimates 2012-2016
MEDIAN INCOMEThe median income for households in Prince George’s County is $75,925.Census Bureau, American Community Survey 5-Year Estimates 2012-2016
POPULATION OF PRINCE GEORGE’S COUNTY:
877,560NUMBER OF PEOPLE IN PRINCE GEORGE’S COUNTY LIVING IN POVERTY: 1990 2016
41,282 84,744
Prince George’s County
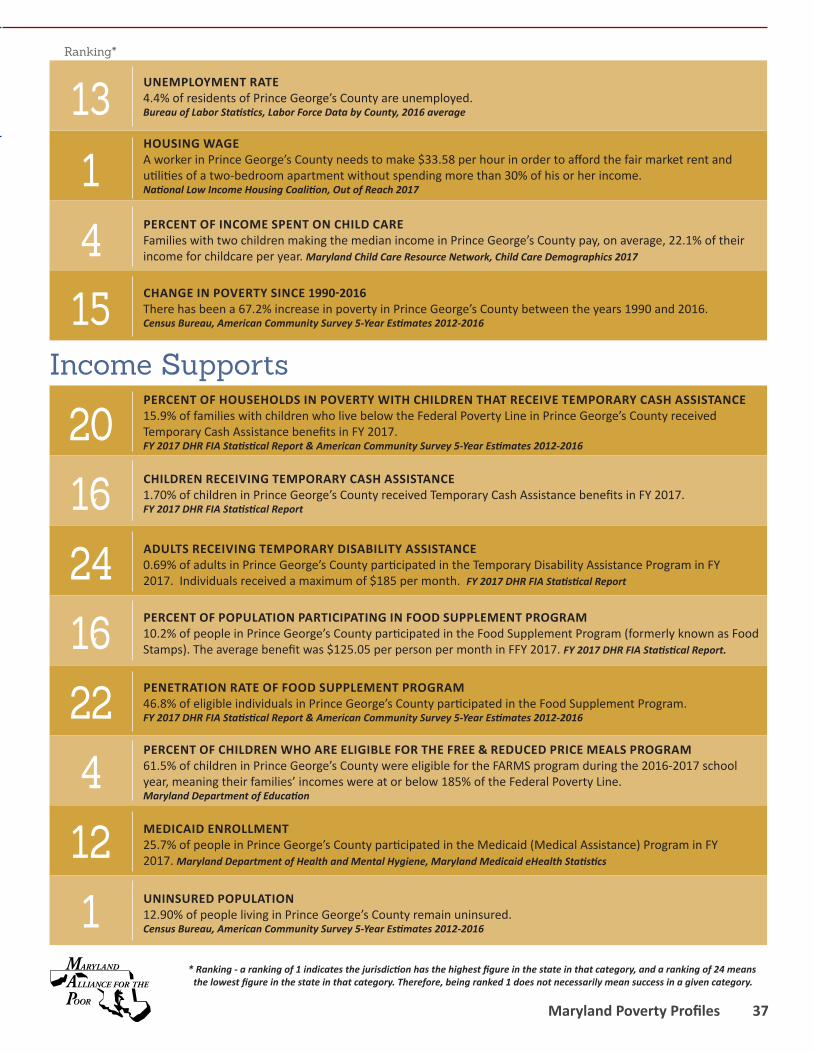
Maryland Poverty Profiles 37
Income Supports
Ranking*
* Ranking - a ranking of 1 indicates the jurisdiction has the highest figure in the state in that category, and a ranking of 24 means the lowest figure in the state in that category. Therefore, being ranked 1 does not necessarily mean success in a given category.
CHANGE IN POVERTY SINCE 1990-2016 There has been a 67.2% increase in poverty in Prince George’s County between the years 1990 and 2016. Census Bureau, American Community Survey 5-Year Estimates 2012-201615
11242216241620
4113
UNINSURED POPULATION12.90% of people living in Prince George’s County remain uninsured. Census Bureau, American Community Survey 5-Year Estimates 2012-2016
MEDICAID ENROLLMENT25.7% of people in Prince George’s County participated in the Medicaid (Medical Assistance) Program in FY 2017. Maryland Department of Health and Mental Hygiene, Maryland Medicaid eHealth Statistics
PERCENT OF CHILDREN WHO ARE ELIGIBLE FOR THE FREE & REDUCED PRICE MEALS PROGRAM61.5% of children in Prince George’s County were eligible for the FARMS program during the 2016-2017 school year, meaning their families’ incomes were at or below 185% of the Federal Poverty Line. Maryland Department of Education
PENETRATION RATE OF FOOD SUPPLEMENT PROGRAM46.8% of eligible individuals in Prince George’s County participated in the Food Supplement Program.FY 2017 DHR FIA Statistical Report & American Community Survey 5-Year Estimates 2012-2016
PERCENT OF POPULATION PARTICIPATING IN FOOD SUPPLEMENT PROGRAM10.2% of people in Prince George’s County participated in the Food Supplement Program (formerly known as Food Stamps). The average benefit was $125.05 per person per month in FFY 2017. FY 2017 DHR FIA Statistical Report.
ADULTS RECEIVING TEMPORARY DISABILITY ASSISTANCE0.69% of adults in Prince George’s County participated in the Temporary Disability Assistance Program in FY 2017. Individuals received a maximum of $185 per month. FY 2017 DHR FIA Statistical Report
CHILDREN RECEIVING TEMPORARY CASH ASSISTANCE1.70% of children in Prince George’s County received Temporary Cash Assistance benefits in FY 2017. FY 2017 DHR FIA Statistical Report
PERCENT OF HOUSEHOLDS IN POVERTY WITH CHILDREN THAT RECEIVE TEMPORARY CASH ASSISTANCE15.9% of families with children who live below the Federal Poverty Line in Prince George’s County received Temporary Cash Assistance benefits in FY 2017. FY 2017 DHR FIA Statistical Report & American Community Survey 5-Year Estimates 2012-2016
PERCENT OF INCOME SPENT ON CHILD CARE Families with two children making the median income in Prince George’s County pay, on average, 22.1% of their income for childcare per year. Maryland Child Care Resource Network, Child Care Demographics 2017
HOUSING WAGEA worker in Prince George’s County needs to make $33.58 per hour in order to afford the fair market rent and utilities of a two-bedroom apartment without spending more than 30% of his or her income. National Low Income Housing Coalition, Out of Reach 2017
UNEMPLOYMENT RATE4.4% of residents of Prince George’s County are unemployed.Bureau of Labor Statistics, Labor Force Data by County, 2016 average
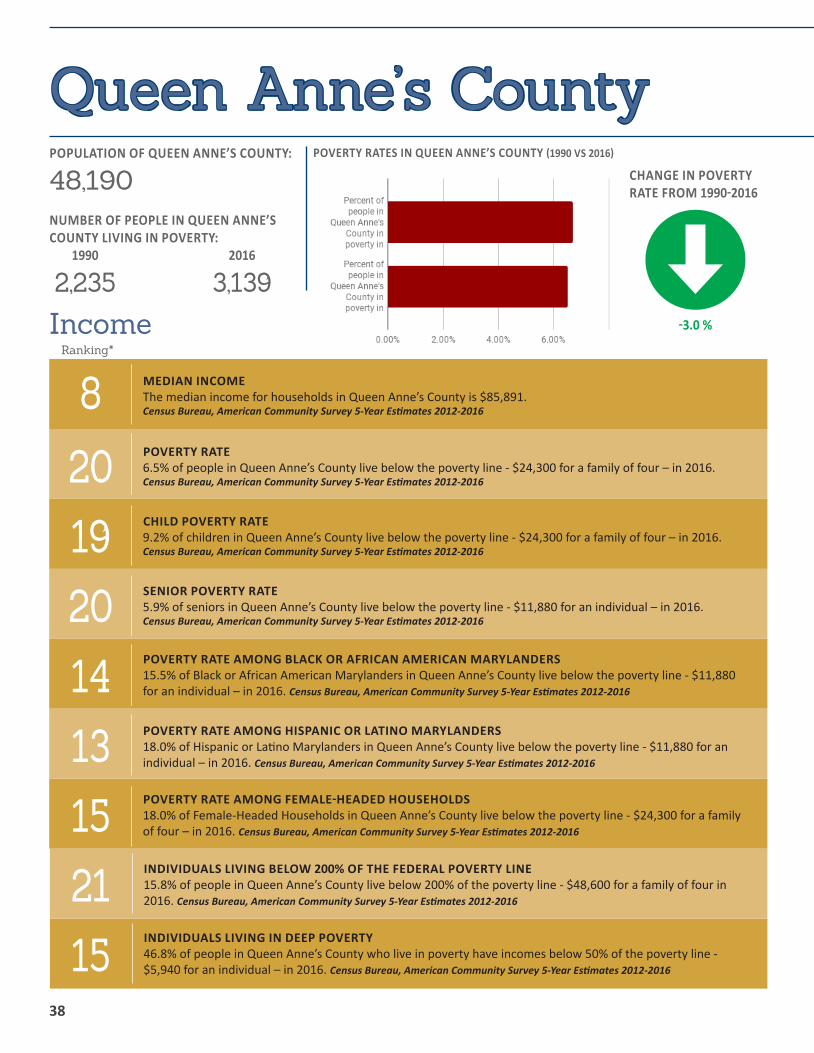
38
IncomeRanking*
CHANGE IN POVERTY RATE FROM 1990-2016
POVERTY RATES IN QUEEN ANNE’S COUNTY (1990 VS 2016)
-3.0 %
1521151314201920
8
INDIVIDUALS LIVING IN DEEP POVERTY46.8% of people in Queen Anne’s County who live in poverty have incomes below 50% of the poverty line - $5,940 for an individual – in 2016. Census Bureau, American Community Survey 5-Year Estimates 2012-2016
INDIVIDUALS LIVING BELOW 200% OF THE FEDERAL POVERTY LINE15.8% of people in Queen Anne’s County live below 200% of the poverty line - $48,600 for a family of four in 2016. Census Bureau, American Community Survey 5-Year Estimates 2012-2016
POVERTY RATE AMONG FEMALE-HEADED HOUSEHOLDS18.0% of Female-Headed Households in Queen Anne’s County live below the poverty line - $24,300 for a family of four – in 2016. Census Bureau, American Community Survey 5-Year Estimates 2012-2016
POVERTY RATE AMONG HISPANIC OR LATINO MARYLANDERS 18.0% of Hispanic or Latino Marylanders in Queen Anne’s County live below the poverty line - $11,880 for an individual – in 2016. Census Bureau, American Community Survey 5-Year Estimates 2012-2016
POVERTY RATE AMONG BLACK OR AFRICAN AMERICAN MARYLANDERS15.5% of Black or African American Marylanders in Queen Anne’s County live below the poverty line - $11,880 for an individual – in 2016. Census Bureau, American Community Survey 5-Year Estimates 2012-2016
SENIOR POVERTY RATE5.9% of seniors in Queen Anne’s County live below the poverty line - $11,880 for an individual – in 2016.Census Bureau, American Community Survey 5-Year Estimates 2012-2016
CHILD POVERTY RATE9.2% of children in Queen Anne’s County live below the poverty line - $24,300 for a family of four – in 2016.Census Bureau, American Community Survey 5-Year Estimates 2012-2016
POVERTY RATE6.5% of people in Queen Anne’s County live below the poverty line - $24,300 for a family of four – in 2016.Census Bureau, American Community Survey 5-Year Estimates 2012-2016
MEDIAN INCOMEThe median income for households in Queen Anne’s County is $85,891.Census Bureau, American Community Survey 5-Year Estimates 2012-2016
POPULATION OF QUEEN ANNE’S COUNTY:
48,190NUMBER OF PEOPLE IN QUEEN ANNE’S COUNTY LIVING IN POVERTY: 1990 2016
2,235 3,139
Queen Anne’s County
Maryland Poverty Profiles 39
Income Supports
Ranking*
* Ranking - a ranking of 1 indicates the jurisdiction has the highest figure in the state in that category, and a ranking of 24 means the lowest figure in the state in that category. Therefore, being ranked 1 does not necessarily mean success in a given category.
CHANGE IN POVERTY SINCE 1990-2016 There has been a -3.0% decrease in poverty in Queen Anne’s County between the years 1990 and 2016. Census Bureau, American Community Survey 5-Year Estimates 2012-201614
211821717131912
24618
UNINSURED POPULATION5.00% of people living in Queen Anne’s County remain uninsured. Census Bureau, American Community Survey 5-Year Estimates 2012-2016
MEDICAID ENROLLMENT18.0% of people in Queen Anne’s County participated in the Medicaid (Medical Assistance) Program in FY 2017.Maryland Department of Health and Mental Hygiene, Maryland Medicaid eHealth Statistics
PERCENT OF CHILDREN WHO ARE ELIGIBLE FOR THE FREE & REDUCED PRICE MEALS PROGRAM25.8% of children in Queen Anne’s County were eligible for the FARMS program during the 2016-2017 school year, meaning their families’ incomes were at or below 185% of the Federal Poverty Line. Maryland Department of Education
PENETRATION RATE OF FOOD SUPPLEMENT PROGRAM61.9% of eligible individuals in Queen Anne’s County participated in the Food Supplement Program.FY 2017 DHR FIA Statistical Report & American Community Survey 5-Year Estimates 2012-2016
PERCENT OF POPULATION PARTICIPATING IN FOOD SUPPLEMENT PROGRAM8.7% of people in Queen Anne’s County participated in the Food Supplement Program (formerly known as Food Stamps). The average benefit was $125.05 per person per month in FFY 2017. FY 2017 DHR FIA Statistical Report.
ADULTS RECEIVING TEMPORARY DISABILITY ASSISTANCE1.88% of adults in Queen Anne’s County participated in the Temporary Disability Assistance Program in FY 2017. Individuals received a maximum of $185 per month. FY 2017 DHR FIA Statistical Report
CHILDREN RECEIVING TEMPORARY CASH ASSISTANCE1.29% of children in Queen Anne’s County received Temporary Cash Assistance benefits in FY 2017. FY 2017 DHR FIA Statistical Report
PERCENT OF HOUSEHOLDS IN POVERTY WITH CHILDREN THAT RECEIVE TEMPORARY CASH ASSISTANCE21.3% of families with children who live below the Federal Poverty Line in Queen Anne’s County received Temporary Cash Assistance benefits in FY 2017. FY 2017 DHR FIA Statistical Report & American Community Survey 5-Year Estimates 2012-2016
PERCENT OF INCOME SPENT ON CHILD CARE Families with two children making the median income in Queen Anne’s County pay, on average, 16.1% of their income for childcare per year. Maryland Child Care Resource Network, Child Care Demographics 2017
HOUSING WAGEA worker in Queen Anne’s County needs to make $26.46 per hour in order to afford the fair market rent and utilities of a two-bedroom apartment without spending more than 30% of his or her income. National Low Income Housing Coalition, Out of Reach 2017
UNEMPLOYMENT RATE3.8% of residents of Queen Anne’s County are unemployed.Bureau of Labor Statistics, Labor Force Data by County, 2016 average
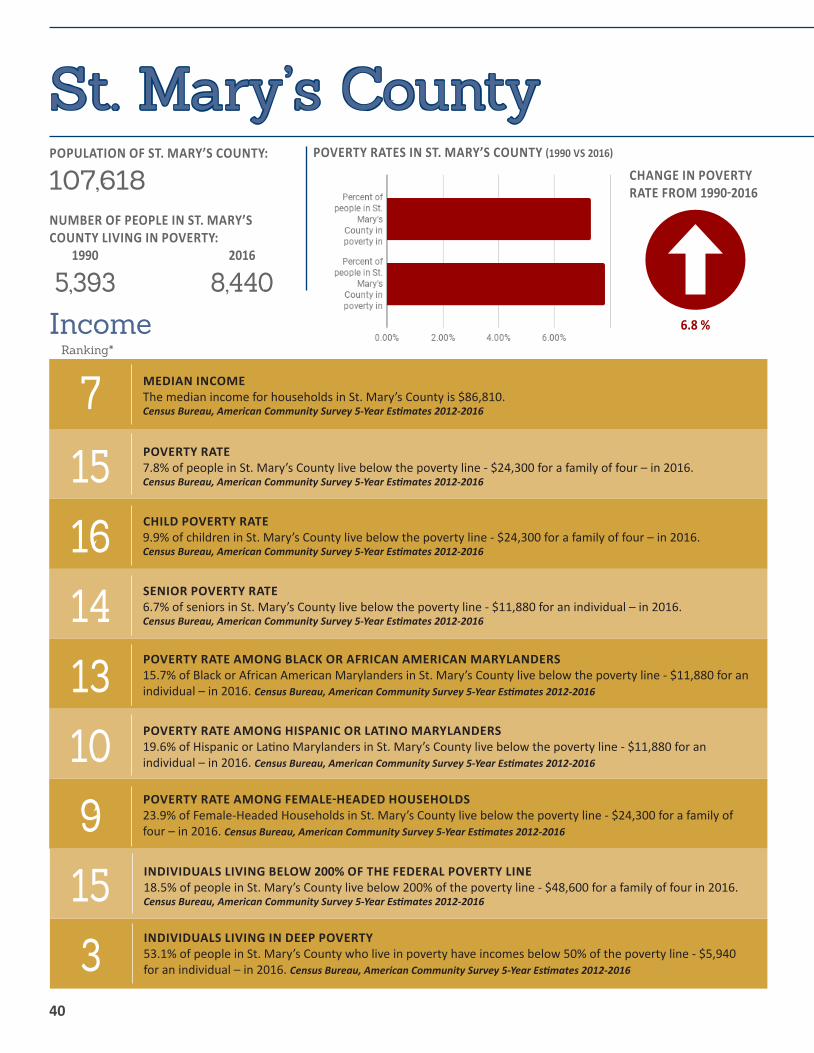
40
IncomeRanking*
CHANGE IN POVERTY RATE FROM 1990-2016
POVERTY RATES IN ST. MARY’S COUNTY (1990 VS 2016)
6.8 %
31591013141615
7
INDIVIDUALS LIVING IN DEEP POVERTY53.1% of people in St. Mary’s County who live in poverty have incomes below 50% of the poverty line - $5,940 for an individual – in 2016. Census Bureau, American Community Survey 5-Year Estimates 2012-2016
INDIVIDUALS LIVING BELOW 200% OF THE FEDERAL POVERTY LINE18.5% of people in St. Mary’s County live below 200% of the poverty line - $48,600 for a family of four in 2016.Census Bureau, American Community Survey 5-Year Estimates 2012-2016
POVERTY RATE AMONG FEMALE-HEADED HOUSEHOLDS23.9% of Female-Headed Households in St. Mary’s County live below the poverty line - $24,300 for a family of four – in 2016. Census Bureau, American Community Survey 5-Year Estimates 2012-2016
POVERTY RATE AMONG HISPANIC OR LATINO MARYLANDERS 19.6% of Hispanic or Latino Marylanders in St. Mary’s County live below the poverty line - $11,880 for an individual – in 2016. Census Bureau, American Community Survey 5-Year Estimates 2012-2016
POVERTY RATE AMONG BLACK OR AFRICAN AMERICAN MARYLANDERS15.7% of Black or African American Marylanders in St. Mary’s County live below the poverty line - $11,880 for an individual – in 2016. Census Bureau, American Community Survey 5-Year Estimates 2012-2016
SENIOR POVERTY RATE6.7% of seniors in St. Mary’s County live below the poverty line - $11,880 for an individual – in 2016.Census Bureau, American Community Survey 5-Year Estimates 2012-2016
CHILD POVERTY RATE9.9% of children in St. Mary’s County live below the poverty line - $24,300 for a family of four – in 2016.Census Bureau, American Community Survey 5-Year Estimates 2012-2016
POVERTY RATE7.8% of people in St. Mary’s County live below the poverty line - $24,300 for a family of four – in 2016.Census Bureau, American Community Survey 5-Year Estimates 2012-2016
MEDIAN INCOMEThe median income for households in St. Mary’s County is $86,810.Census Bureau, American Community Survey 5-Year Estimates 2012-2016
POPULATION OF ST. MARY’S COUNTY:
107,618NUMBER OF PEOPLE IN ST. MARY’S COUNTY LIVING IN POVERTY: 1990 2016
5,393 8,440
St. Mary’s County

Maryland Poverty Profiles 41
Income Supports
Ranking*
* Ranking - a ranking of 1 indicates the jurisdiction has the highest figure in the state in that category, and a ranking of 24 means the lowest figure in the state in that category. Therefore, being ranked 1 does not necessarily mean success in a given category.
13 CHANGE IN POVERTY SINCE 1990-2016 There has been a 6.8% increase in poverty in St. Mary’s County between the years 1990 and 2016. Census Bureau, American Community Survey 5-Year Estimates 2012-2016
1715173123102
101315
UNINSURED POPULATION6.00% of people living in St. Mary’s County remain uninsured. Census Bureau, American Community Survey 5-Year Estimates 2012-2016
MEDICAID ENROLLMENT21.2% of people in St. Mary’s County participated in the Medicaid (Medical Assistance) Program in FY 2017.Maryland Department of Health and Mental Hygiene, Maryland Medicaid eHealth Statistics
PERCENT OF CHILDREN WHO ARE ELIGIBLE FOR THE FREE & REDUCED PRICE MEALS PROGRAM32.3% of children in St. Mary’s County were eligible for the FARMS program during the 2016-2017 school year, meaning their families’ incomes were at or below 185% of the Federal Poverty Line. Maryland Department of Education
PENETRATION RATE OF FOOD SUPPLEMENT PROGRAM73.9% of eligible individuals in St. Mary’s County participated in the Food Supplement Program.FY 2017 DHR FIA Statistical Report & American Community Survey 5-Year Estimates 2012-2016
PERCENT OF POPULATION PARTICIPATING IN FOOD SUPPLEMENT PROGRAM12.1% of people in St. Mary’s County participated in the Food Supplement Program (formerly known as Food Stamps). The average benefit was $125.05 per person per month in FFY 2017. FY 2017 DHR FIA Statistical Report
ADULTS RECEIVING TEMPORARY DISABILITY ASSISTANCE3.10% of adults in St. Mary’s County participated in the Temporary Disability Assistance Program in FY 2017. Individuals received a maximum of $185 per month. FY 2017 DHR FIA Statistical Report
CHILDREN RECEIVING TEMPORARY CASH ASSISTANCE3.41% of children in St. Mary’s County received Temporary Cash Assistance benefits in FY 2017. FY 2017 DHR FIA Statistical Report.
PERCENT OF HOUSEHOLDS IN POVERTY WITH CHILDREN THAT RECEIVE TEMPORARY CASH ASSISTANCE41.6% of families with children who live below the Federal Poverty Line in St. Mary’s County received Temporary Cash Assistance benefits in FY 2017. FY 2017 DHR FIA Statistical Report & American Community Survey 5-Year Estimates 2012-2016
PERCENT OF INCOME SPENT ON CHILD CARE Families with two children making the median income in St. Mary’s County pay, on average, 20.9% of their income for childcare per year. Maryland Child Care Resource Network, Child Care Demographics 2017
HOUSING WAGEA worker in St. Mary’s County needs to make $24.23 per hour in order to afford the fair market rent and utilities of a two-bedroom apartment without spending more than 30% of his or her income. National Low Income Housing Coalition, Out of Reach 2017
UNEMPLOYMENT RATE4.1% of residents of St. Mary’s County are unemployed.Bureau of Labor Statistics, Labor Force Data by County, 2016 average
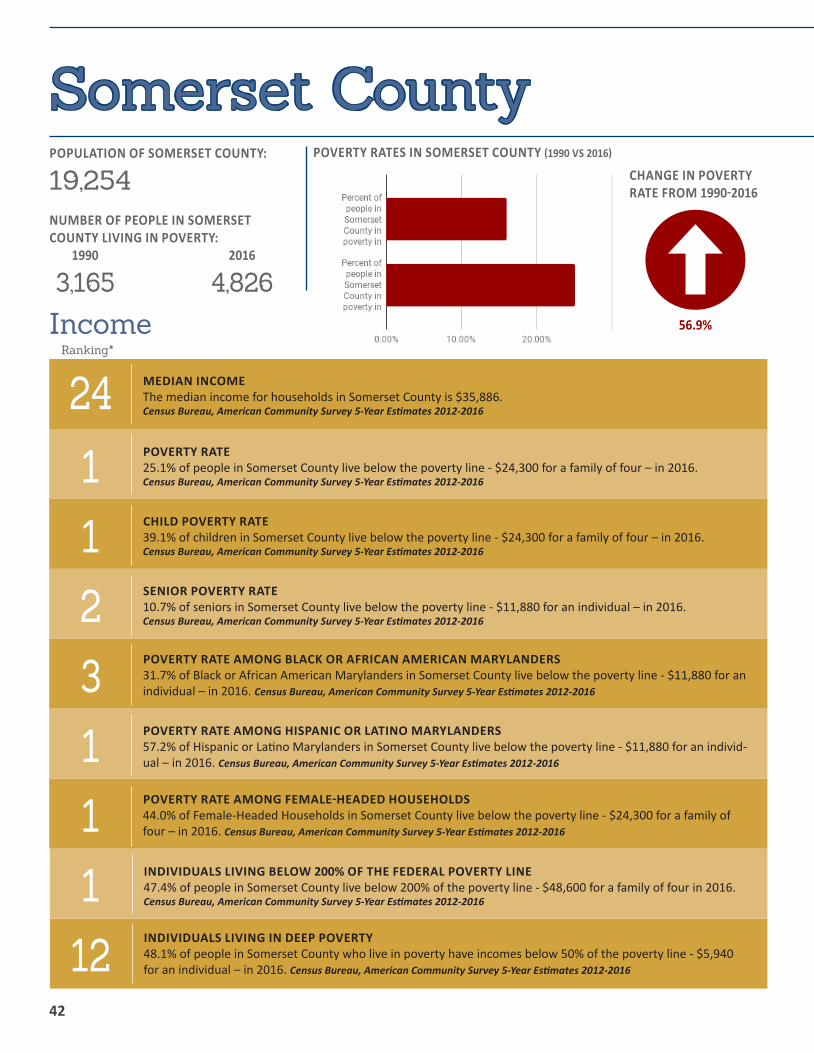
42
IncomeRanking*
CHANGE IN POVERTY RATE FROM 1990-2016
POVERTY RATES IN SOMERSET COUNTY (1990 VS 2016)
56.9%
121113211
24
INDIVIDUALS LIVING IN DEEP POVERTY48.1% of people in Somerset County who live in poverty have incomes below 50% of the poverty line - $5,940 for an individual – in 2016. Census Bureau, American Community Survey 5-Year Estimates 2012-2016
INDIVIDUALS LIVING BELOW 200% OF THE FEDERAL POVERTY LINE47.4% of people in Somerset County live below 200% of the poverty line - $48,600 for a family of four in 2016.Census Bureau, American Community Survey 5-Year Estimates 2012-2016
POVERTY RATE AMONG FEMALE-HEADED HOUSEHOLDS44.0% of Female-Headed Households in Somerset County live below the poverty line - $24,300 for a family of four – in 2016. Census Bureau, American Community Survey 5-Year Estimates 2012-2016
POVERTY RATE AMONG HISPANIC OR LATINO MARYLANDERS 57.2% of Hispanic or Latino Marylanders in Somerset County live below the poverty line - $11,880 for an individ-ual – in 2016. Census Bureau, American Community Survey 5-Year Estimates 2012-2016
POVERTY RATE AMONG BLACK OR AFRICAN AMERICAN MARYLANDERS31.7% of Black or African American Marylanders in Somerset County live below the poverty line - $11,880 for an individual – in 2016. Census Bureau, American Community Survey 5-Year Estimates 2012-2016
SENIOR POVERTY RATE10.7% of seniors in Somerset County live below the poverty line - $11,880 for an individual – in 2016.Census Bureau, American Community Survey 5-Year Estimates 2012-2016
CHILD POVERTY RATE39.1% of children in Somerset County live below the poverty line - $24,300 for a family of four – in 2016.Census Bureau, American Community Survey 5-Year Estimates 2012-2016
POVERTY RATE25.1% of people in Somerset County live below the poverty line - $24,300 for a family of four – in 2016.Census Bureau, American Community Survey 5-Year Estimates 2012-2016
MEDIAN INCOMEThe median income for households in Somerset County is $35,886.Census Bureau, American Community Survey 5-Year Estimates 2012-2016
POPULATION OF SOMERSET COUNTY:
19,254NUMBER OF PEOPLE IN SOMERSET COUNTY LIVING IN POVERTY: 1990 2016
3,165 4,826
Somerset County
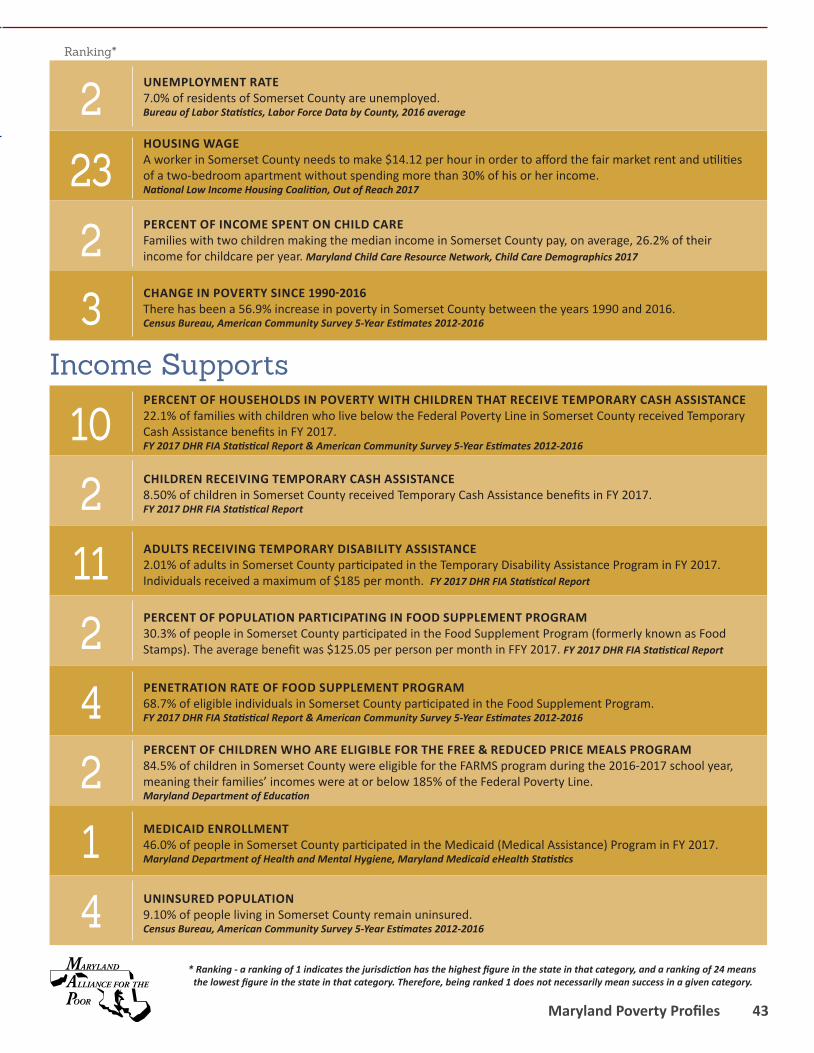
Maryland Poverty Profiles 43
Income Supports
Ranking*
* Ranking - a ranking of 1 indicates the jurisdiction has the highest figure in the state in that category, and a ranking of 24 means the lowest figure in the state in that category. Therefore, being ranked 1 does not necessarily mean success in a given category.
CHANGE IN POVERTY SINCE 1990-2016 There has been a 56.9% increase in poverty in Somerset County between the years 1990 and 2016. Census Bureau, American Community Survey 5-Year Estimates 2012-20163
4124211210
2232
PERCENT OF INCOME SPENT ON CHILD CARE Families with two children making the median income in Somerset County pay, on average, 26.2% of their income for childcare per year. Maryland Child Care Resource Network, Child Care Demographics 2017
HOUSING WAGEA worker in Somerset County needs to make $14.12 per hour in order to afford the fair market rent and utilities of a two-bedroom apartment without spending more than 30% of his or her income. National Low Income Housing Coalition, Out of Reach 2017
UNEMPLOYMENT RATE7.0% of residents of Somerset County are unemployed.Bureau of Labor Statistics, Labor Force Data by County, 2016 average
PERCENT OF HOUSEHOLDS IN POVERTY WITH CHILDREN THAT RECEIVE TEMPORARY CASH ASSISTANCE22.1% of families with children who live below the Federal Poverty Line in Somerset County received Temporary Cash Assistance benefits in FY 2017. FY 2017 DHR FIA Statistical Report & American Community Survey 5-Year Estimates 2012-2016
CHILDREN RECEIVING TEMPORARY CASH ASSISTANCE8.50% of children in Somerset County received Temporary Cash Assistance benefits in FY 2017. FY 2017 DHR FIA Statistical Report
ADULTS RECEIVING TEMPORARY DISABILITY ASSISTANCE2.01% of adults in Somerset County participated in the Temporary Disability Assistance Program in FY 2017. Individuals received a maximum of $185 per month. FY 2017 DHR FIA Statistical Report
PERCENT OF POPULATION PARTICIPATING IN FOOD SUPPLEMENT PROGRAM30.3% of people in Somerset County participated in the Food Supplement Program (formerly known as Food Stamps). The average benefit was $125.05 per person per month in FFY 2017. FY 2017 DHR FIA Statistical Report
PENETRATION RATE OF FOOD SUPPLEMENT PROGRAM68.7% of eligible individuals in Somerset County participated in the Food Supplement Program.FY 2017 DHR FIA Statistical Report & American Community Survey 5-Year Estimates 2012-2016
PERCENT OF CHILDREN WHO ARE ELIGIBLE FOR THE FREE & REDUCED PRICE MEALS PROGRAM84.5% of children in Somerset County were eligible for the FARMS program during the 2016-2017 school year, meaning their families’ incomes were at or below 185% of the Federal Poverty Line. Maryland Department of Education
MEDICAID ENROLLMENT46.0% of people in Somerset County participated in the Medicaid (Medical Assistance) Program in FY 2017.Maryland Department of Health and Mental Hygiene, Maryland Medicaid eHealth Statistics
UNINSURED POPULATION9.10% of people living in Somerset County remain uninsured. Census Bureau, American Community Survey 5-Year Estimates 2012-2016
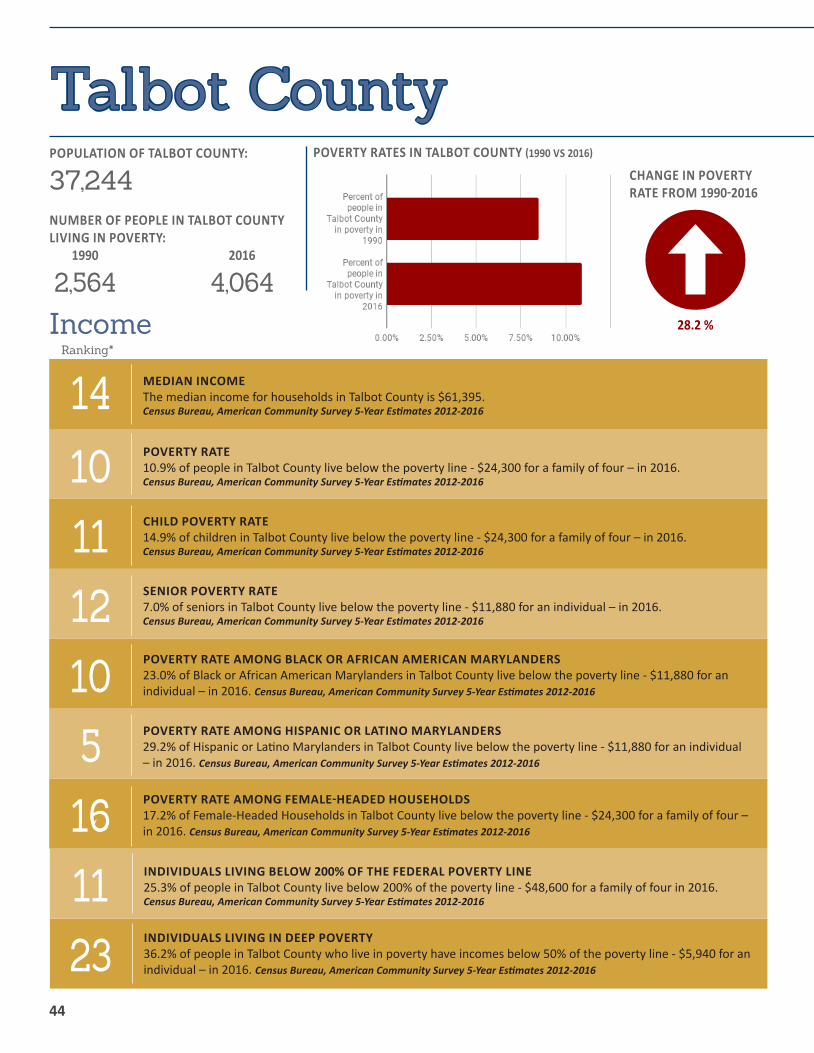
44
IncomeRanking*
CHANGE IN POVERTY RATE FROM 1990-2016
POVERTY RATES IN TALBOT COUNTY (1990 VS 2016)
28.2 %
231116510121110
14
INDIVIDUALS LIVING IN DEEP POVERTY36.2% of people in Talbot County who live in poverty have incomes below 50% of the poverty line - $5,940 for an individual – in 2016. Census Bureau, American Community Survey 5-Year Estimates 2012-2016
INDIVIDUALS LIVING BELOW 200% OF THE FEDERAL POVERTY LINE25.3% of people in Talbot County live below 200% of the poverty line - $48,600 for a family of four in 2016.Census Bureau, American Community Survey 5-Year Estimates 2012-2016
POVERTY RATE AMONG FEMALE-HEADED HOUSEHOLDS17.2% of Female-Headed Households in Talbot County live below the poverty line - $24,300 for a family of four – in 2016. Census Bureau, American Community Survey 5-Year Estimates 2012-2016
POVERTY RATE AMONG HISPANIC OR LATINO MARYLANDERS 29.2% of Hispanic or Latino Marylanders in Talbot County live below the poverty line - $11,880 for an individual – in 2016. Census Bureau, American Community Survey 5-Year Estimates 2012-2016
POVERTY RATE AMONG BLACK OR AFRICAN AMERICAN MARYLANDERS23.0% of Black or African American Marylanders in Talbot County live below the poverty line - $11,880 for an individual – in 2016. Census Bureau, American Community Survey 5-Year Estimates 2012-2016
SENIOR POVERTY RATE7.0% of seniors in Talbot County live below the poverty line - $11,880 for an individual – in 2016.Census Bureau, American Community Survey 5-Year Estimates 2012-2016
CHILD POVERTY RATE14.9% of children in Talbot County live below the poverty line - $24,300 for a family of four – in 2016.Census Bureau, American Community Survey 5-Year Estimates 2012-2016
POVERTY RATE10.9% of people in Talbot County live below the poverty line - $24,300 for a family of four – in 2016.Census Bureau, American Community Survey 5-Year Estimates 2012-2016
MEDIAN INCOMEThe median income for households in Talbot County is $61,395.Census Bureau, American Community Survey 5-Year Estimates 2012-2016
POPULATION OF TALBOT COUNTY:
37,244NUMBER OF PEOPLE IN TALBOT COUNTY LIVING IN POVERTY: 1990 2016
2,564 4,064
Talbot County

Maryland Poverty Profiles 45
Income Supports
Ranking*
* Ranking - a ranking of 1 indicates the jurisdiction has the highest figure in the state in that category, and a ranking of 24 means the lowest figure in the state in that category. Therefore, being ranked 1 does not necessarily mean success in a given category.
CHANGE IN POVERTY SINCE 1990-2016 There has been a 28.2% increase in poverty in Talbot County between the years 1990 and 2016. Census Bureau, American Community Survey 5-Year Estimates 2012-201611
1214132114191218
221515 UNEMPLOYMENT RATE
4.1% of residents of Talbot County are unemployed.Bureau of Labor Statistics, Labor Force Data by County, 2016 average
HOUSING WAGEA worker in Talbot County needs to make $23.04 per hour in order to afford the fair market rent and utilities of a two-bedroom apartment without spending more than 30% of his or her income. National Low Income Housing Coalition, Out of Reach 2017
PERCENT OF INCOME SPENT ON CHILD CARE Families with two children making the median income in Talbot County pay, on average, 17.8% of their income for childcare per year. Maryland Child Care Resource Network, Child Care Demographics 2017
PERCENT OF HOUSEHOLDS IN POVERTY WITH CHILDREN THAT RECEIVE TEMPORARY CASH ASSISTANCE16.5% of families with children who live below the Federal Poverty Line in Talbot County received Temporary Cash Assistance benefits in FY 2017. FY 2017 DHR FIA Statistical Report & American Community Survey 5-Year Estimates 2012-2016
CHILDREN RECEIVING TEMPORARY CASH ASSISTANCE2.02% of children in Talbot County received Temporary Cash Assistance benefits in FY 2017. FY 2017 DHR FIA Statistical Report
ADULTS RECEIVING TEMPORARY DISABILITY ASSISTANCE1.48% of adults in Talbot County participated in the Temporary Disability Assistance Program in FY 2017. Individuals received a maximum of $185 per month. FY 2017 DHR FIA Statistical Report
PERCENT OF POPULATION PARTICIPATING IN FOOD SUPPLEMENT PROGRAM11.1% of people in Talbot County participated in the Food Supplement Program (formerly known as Food Stamps). The average benefit was $125.05 per person per month in FFY 2017. FY 2017 DHR FIA Statistical Report.
PENETRATION RATE OF FOOD SUPPLEMENT PROGRAM47.1% of eligible individuals in Talbot County participated in the Food Supplement Program.FY 2017 DHR FIA Statistical Report & American Community Survey 5-Year Estimates 2012-2016
PERCENT OF CHILDREN WHO ARE ELIGIBLE FOR THE FREE & REDUCED PRICE MEALS PROGRAM43.7% of children in Talbot County were eligible for the FARMS program during the 2016-2017 school year, meaning their families’ incomes were at or below 185% of the Federal Poverty Line. Maryland Department of Education
MEDICAID ENROLLMENT22.7% of people in Talbot County participated in the Medicaid (Medical Assistance) Program in FY 2017.Maryland Department of Health and Mental Hygiene, Maryland Medicaid eHealth Statistics
UNINSURED POPULATION6.90% of people living in Talbot County remain uninsured. Census Bureau, American Community Survey 5-Year Estimates 2012-2016
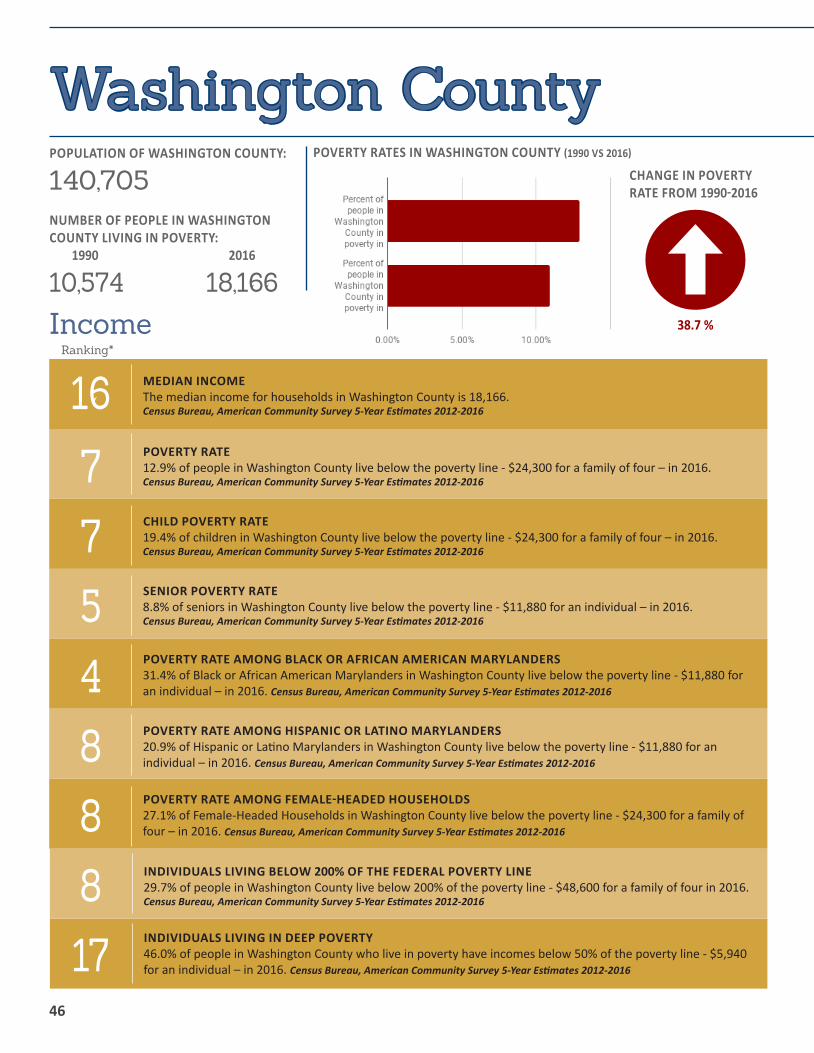
46
IncomeRanking*
CHANGE IN POVERTY RATE FROM 1990-2016
POVERTY RATES IN WASHINGTON COUNTY (1990 VS 2016)
38.7 %
178884577
16
INDIVIDUALS LIVING IN DEEP POVERTY46.0% of people in Washington County who live in poverty have incomes below 50% of the poverty line - $5,940 for an individual – in 2016. Census Bureau, American Community Survey 5-Year Estimates 2012-2016
INDIVIDUALS LIVING BELOW 200% OF THE FEDERAL POVERTY LINE29.7% of people in Washington County live below 200% of the poverty line - $48,600 for a family of four in 2016. Census Bureau, American Community Survey 5-Year Estimates 2012-2016
POVERTY RATE AMONG FEMALE-HEADED HOUSEHOLDS27.1% of Female-Headed Households in Washington County live below the poverty line - $24,300 for a family of four – in 2016. Census Bureau, American Community Survey 5-Year Estimates 2012-2016
POVERTY RATE AMONG HISPANIC OR LATINO MARYLANDERS 20.9% of Hispanic or Latino Marylanders in Washington County live below the poverty line - $11,880 for an individual – in 2016. Census Bureau, American Community Survey 5-Year Estimates 2012-2016
POVERTY RATE AMONG BLACK OR AFRICAN AMERICAN MARYLANDERS31.4% of Black or African American Marylanders in Washington County live below the poverty line - $11,880 for an individual – in 2016. Census Bureau, American Community Survey 5-Year Estimates 2012-2016
SENIOR POVERTY RATE8.8% of seniors in Washington County live below the poverty line - $11,880 for an individual – in 2016.Census Bureau, American Community Survey 5-Year Estimates 2012-2016
CHILD POVERTY RATE19.4% of children in Washington County live below the poverty line - $24,300 for a family of four – in 2016.Census Bureau, American Community Survey 5-Year Estimates 2012-2016
POVERTY RATE12.9% of people in Washington County live below the poverty line - $24,300 for a family of four – in 2016.Census Bureau, American Community Survey 5-Year Estimates 2012-2016
MEDIAN INCOMEThe median income for households in Washington County is 18,166.Census Bureau, American Community Survey 5-Year Estimates 2012-2016
POPULATION OF WASHINGTON COUNTY:
140,705NUMBER OF PEOPLE IN WASHINGTON COUNTY LIVING IN POVERTY: 1990 2016
10,574 18,166
Washington County
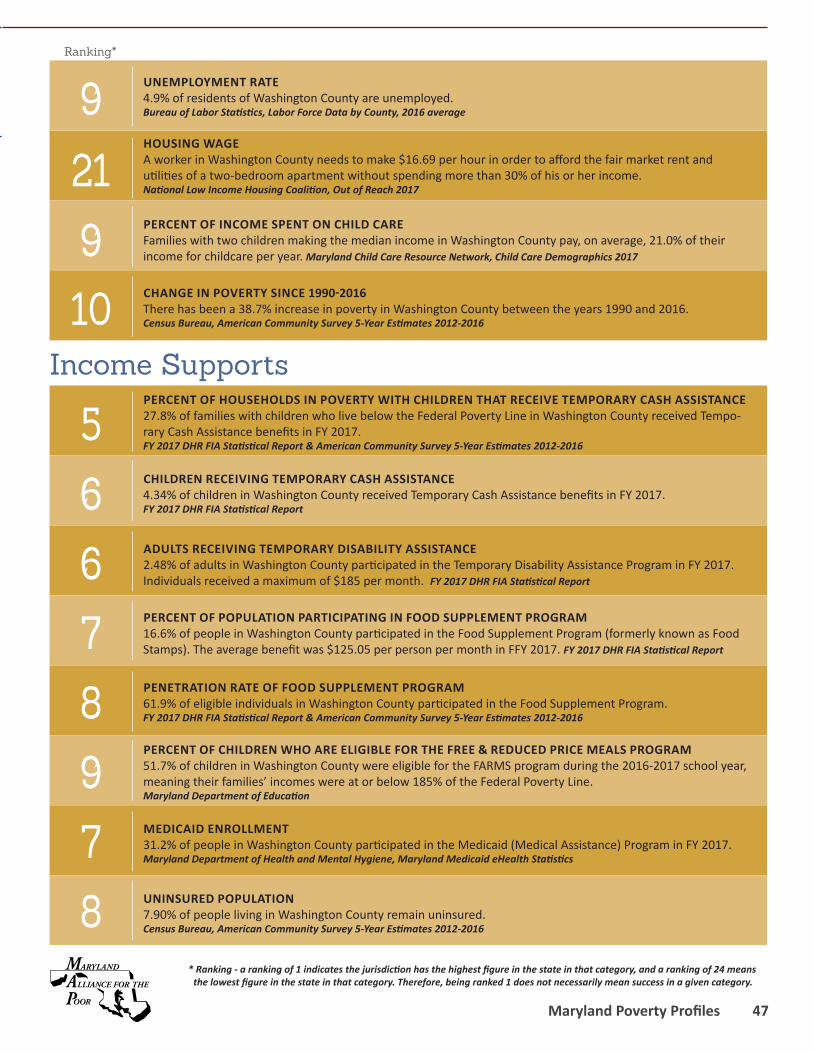
Maryland Poverty Profiles 47
Income Supports
Ranking*
* Ranking - a ranking of 1 indicates the jurisdiction has the highest figure in the state in that category, and a ranking of 24 means the lowest figure in the state in that category. Therefore, being ranked 1 does not necessarily mean success in a given category.
CHANGE IN POVERTY SINCE 1990-2016 There has been a 38.7% increase in poverty in Washington County between the years 1990 and 2016. Census Bureau, American Community Survey 5-Year Estimates 2012-201610
87987665
9219
PERCENT OF INCOME SPENT ON CHILD CARE Families with two children making the median income in Washington County pay, on average, 21.0% of their income for childcare per year. Maryland Child Care Resource Network, Child Care Demographics 2017
HOUSING WAGEA worker in Washington County needs to make $16.69 per hour in order to afford the fair market rent and utilities of a two-bedroom apartment without spending more than 30% of his or her income. National Low Income Housing Coalition, Out of Reach 2017
UNEMPLOYMENT RATE4.9% of residents of Washington County are unemployed.Bureau of Labor Statistics, Labor Force Data by County, 2016 average
CHILDREN RECEIVING TEMPORARY CASH ASSISTANCE4.34% of children in Washington County received Temporary Cash Assistance benefits in FY 2017. FY 2017 DHR FIA Statistical Report
PERCENT OF HOUSEHOLDS IN POVERTY WITH CHILDREN THAT RECEIVE TEMPORARY CASH ASSISTANCE27.8% of families with children who live below the Federal Poverty Line in Washington County received Tempo-rary Cash Assistance benefits in FY 2017. FY 2017 DHR FIA Statistical Report & American Community Survey 5-Year Estimates 2012-2016
ADULTS RECEIVING TEMPORARY DISABILITY ASSISTANCE2.48% of adults in Washington County participated in the Temporary Disability Assistance Program in FY 2017. Individuals received a maximum of $185 per month. FY 2017 DHR FIA Statistical Report
PERCENT OF POPULATION PARTICIPATING IN FOOD SUPPLEMENT PROGRAM16.6% of people in Washington County participated in the Food Supplement Program (formerly known as Food Stamps). The average benefit was $125.05 per person per month in FFY 2017. FY 2017 DHR FIA Statistical Report
PENETRATION RATE OF FOOD SUPPLEMENT PROGRAM61.9% of eligible individuals in Washington County participated in the Food Supplement Program.FY 2017 DHR FIA Statistical Report & American Community Survey 5-Year Estimates 2012-2016
PERCENT OF CHILDREN WHO ARE ELIGIBLE FOR THE FREE & REDUCED PRICE MEALS PROGRAM51.7% of children in Washington County were eligible for the FARMS program during the 2016-2017 school year, meaning their families’ incomes were at or below 185% of the Federal Poverty Line. Maryland Department of Education
MEDICAID ENROLLMENT31.2% of people in Washington County participated in the Medicaid (Medical Assistance) Program in FY 2017.Maryland Department of Health and Mental Hygiene, Maryland Medicaid eHealth Statistics
UNINSURED POPULATION7.90% of people living in Washington County remain uninsured. Census Bureau, American Community Survey 5-Year Estimates 2012-2016

48
IncomeRanking*
CHANGE IN POVERTY RATE FROM 1990-2016
POVERTY RATES IN WICOMICO COUNTY (1990 VS 2016)
40.5 %
967311866
18
INDIVIDUALS LIVING IN DEEP POVERTY49.5% of people in Wicomico County who live in poverty have incomes below 50% of the poverty line - $5,940 for an individual – in 2016. Census Bureau, American Community Survey 5-Year Estimates 2012-2016
INDIVIDUALS LIVING BELOW 200% OF THE FEDERAL POVERTY LINE35.4% of people in Wicomico County live below 200% of the poverty line - $48,600 for a family of four in 2016.Census Bureau, American Community Survey 5-Year Estimates 2012-2016
POVERTY RATE AMONG FEMALE-HEADED HOUSEHOLDS29.4% of Female-Headed Households in Wicomico County live below the poverty line - $24,300 for a family of four – in 2016. Census Bureau, American Community Survey 5-Year Estimates 2012-2016
POVERTY RATE AMONG HISPANIC OR LATINO MARYLANDERS 33.7% of Hispanic or Latino Marylanders in Wicomico County live below the poverty line - $11,880 for an individual – in 2016. Census Bureau, American Community Survey 5-Year Estimates 2012-2016
POVERTY RATE AMONG BLACK OR AFRICAN AMERICAN MARYLANDERS19.1% of Black or African American Marylanders in Wicomico County live below the poverty line - $11,880 for an individual – in 2016. Census Bureau, American Community Survey 5-Year Estimates 2012-2016
SENIOR POVERTY RATE7.5% of seniors in Wicomico County live below the poverty line - $11,880 for an individual – in 2016.Census Bureau, American Community Survey 5-Year Estimates 2012-2016
CHILD POVERTY RATE21.1% of children in Wicomico County live below the poverty line - $24,300 for a family of four – in 2016.Census Bureau, American Community Survey 5-Year Estimates 2012-2016
POVERTY RATE16.3% of people in Wicomico County live below the poverty line - $24,300 for a family of four – in 2016.Census Bureau, American Community Survey 5-Year Estimates 2012-2016
MEDIAN INCOMEThe median income for households in Wicomico County is $53,508.Census Bureau, American Community Survey 5-Year Estimates 2012-2016
POPULATION OF WICOMICO COUNTY:
97,657NUMBER OF PEOPLE IN WICOMICO COUNTY LIVING IN POVERTY: 1990 2016
8,279 15,924
Wicomico County
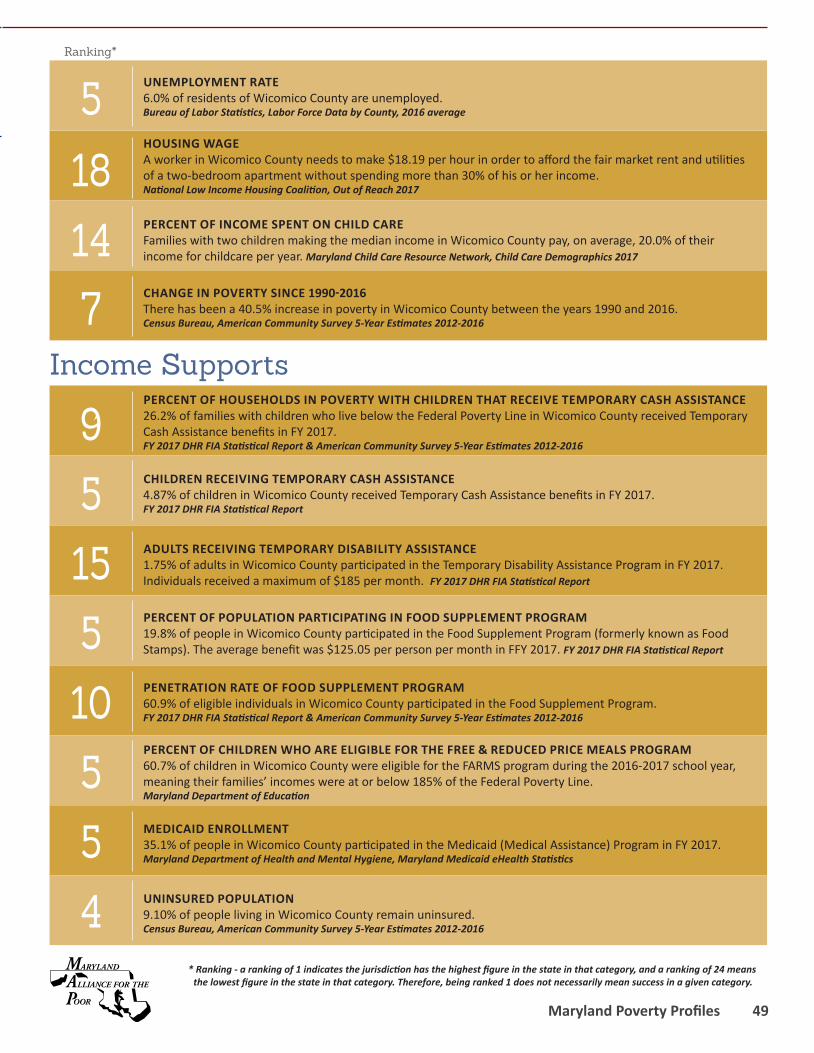
Maryland Poverty Profiles 49
Income Supports
Ranking*
* Ranking - a ranking of 1 indicates the jurisdiction has the highest figure in the state in that category, and a ranking of 24 means the lowest figure in the state in that category. Therefore, being ranked 1 does not necessarily mean success in a given category.
CHANGE IN POVERTY SINCE 1990-2016 There has been a 40.5% increase in poverty in Wicomico County between the years 1990 and 2016. Census Bureau, American Community Survey 5-Year Estimates 2012-20167
4551051559
14185 UNEMPLOYMENT RATE
6.0% of residents of Wicomico County are unemployed.Bureau of Labor Statistics, Labor Force Data by County, 2016 average
HOUSING WAGEA worker in Wicomico County needs to make $18.19 per hour in order to afford the fair market rent and utilities of a two-bedroom apartment without spending more than 30% of his or her income. National Low Income Housing Coalition, Out of Reach 2017
PERCENT OF INCOME SPENT ON CHILD CARE Families with two children making the median income in Wicomico County pay, on average, 20.0% of their income for childcare per year. Maryland Child Care Resource Network, Child Care Demographics 2017
PERCENT OF HOUSEHOLDS IN POVERTY WITH CHILDREN THAT RECEIVE TEMPORARY CASH ASSISTANCE26.2% of families with children who live below the Federal Poverty Line in Wicomico County received Temporary Cash Assistance benefits in FY 2017. FY 2017 DHR FIA Statistical Report & American Community Survey 5-Year Estimates 2012-2016
CHILDREN RECEIVING TEMPORARY CASH ASSISTANCE4.87% of children in Wicomico County received Temporary Cash Assistance benefits in FY 2017. FY 2017 DHR FIA Statistical Report
ADULTS RECEIVING TEMPORARY DISABILITY ASSISTANCE1.75% of adults in Wicomico County participated in the Temporary Disability Assistance Program in FY 2017. Individuals received a maximum of $185 per month. FY 2017 DHR FIA Statistical Report
PERCENT OF POPULATION PARTICIPATING IN FOOD SUPPLEMENT PROGRAM19.8% of people in Wicomico County participated in the Food Supplement Program (formerly known as Food Stamps). The average benefit was $125.05 per person per month in FFY 2017. FY 2017 DHR FIA Statistical Report
PENETRATION RATE OF FOOD SUPPLEMENT PROGRAM60.9% of eligible individuals in Wicomico County participated in the Food Supplement Program.FY 2017 DHR FIA Statistical Report & American Community Survey 5-Year Estimates 2012-2016
PERCENT OF CHILDREN WHO ARE ELIGIBLE FOR THE FREE & REDUCED PRICE MEALS PROGRAM60.7% of children in Wicomico County were eligible for the FARMS program during the 2016-2017 school year, meaning their families’ incomes were at or below 185% of the Federal Poverty Line. Maryland Department of Education
MEDICAID ENROLLMENT35.1% of people in Wicomico County participated in the Medicaid (Medical Assistance) Program in FY 2017.Maryland Department of Health and Mental Hygiene, Maryland Medicaid eHealth Statistics
UNINSURED POPULATION9.10% of people living in Wicomico County remain uninsured. Census Bureau, American Community Survey 5-Year Estimates 2012-2016

50
IncomeRanking*
CHANGE IN POVERTY RATE FROM 1990-2016
POVERTY RATES IN WORCESTER COUNTY (1990 VS 2016)
-7.3 %
131010248131212
15
INDIVIDUALS LIVING IN DEEP POVERTY47.5% of people in Worcester County who live in poverty have incomes below 50% of the poverty line - $5,940 for an individual – in 2016. Census Bureau, American Community Survey 5-Year Estimates 2012-2016
INDIVIDUALS LIVING BELOW 200% OF THE FEDERAL POVERTY LINE27.8% of people in Worcester County live below 200% of the poverty line - $ 48,600 for a family of four in 2016.Census Bureau, American Community Survey 5-Year Estimates 2012-2016
POVERTY RATE AMONG FEMALE-HEADED HOUSEHOLDS22.9% of Female-Headed Households in Worcester County live below the poverty line - $24,300 for a family of four – in 2016. Census Bureau, American Community Survey 5-Year Estimates 2012-2016
POVERTY RATE AMONG HISPANIC OR LATINO MARYLANDERS 3.5% of Hispanic or Latino Marylanders in Worcester County live below the poverty line - $11,880 for an individ-ual – in 2016. Census Bureau, American Community Survey 5-Year Estimates 2012-2016
POVERTY RATE AMONG BLACK OR AFRICAN AMERICAN MARYLANDERS26.0% of Black or African American Marylanders in Worcester County live below the poverty line - $11,880 for an individual – in 2016. Census Bureau, American Community Survey 5-Year Estimates 2012-2016
SENIOR POVERTY RATE6.9% of seniors in Worcester County live below the poverty line - $11,880 for an individual – in 2016.Census Bureau, American Community Survey 5-Year Estimates 2012-2016
CHILD POVERTY RATE13.9% of children in Worcester County live below the poverty line - $24,300 for a family of four – in 2016.Census Bureau, American Community Survey 5-Year Estimates 2012-2016
POVERTY RATE10.2% of people in Worcester County live below the poverty line - $24,300 for a family of four – in 2016.Census Bureau, American Community Survey 5-Year Estimates 2012-2016
MEDIAN INCOMEThe median income for households in Worcester County is $57,227.Census Bureau, American Community Survey 5-Year Estimates 2012-2016
POPULATION OF WORCESTER COUNTY:
50,731NUMBER OF PEOPLE IN WORCESTER COUNTY LIVING IN POVERTY: 1990 2016
3,783 5,162
Worcester County

Maryland Poverty Profiles 51
Income Supports
Ranking*
* Ranking - a ranking of 1 indicates the jurisdiction has the highest figure in the state in that category, and a ranking of 24 means the lowest figure in the state in that category. Therefore, being ranked 1 does not necessarily mean success in a given category.
CHANGE IN POVERTY SINCE 1990-2016 There has been a -7.3% decrease in poverty in Worcester County between the years 1990 and 2016. Census Bureau, American Community Survey 5-Year Estimates 2012-20169
910141911101517
18171
UNINSURED POPULATION7.80% of people living in Worcester County remain uninsured. Census Bureau, American Community Survey 5-Year Estimates 2012-2016
MEDICAID ENROLLMENT26.8% of people in Worcester County participated in the Medicaid (Medical Assistance) Program in FY 2017.Maryland Department of Health and Mental Hygiene, Maryland Medicaid eHealth Statistics
PERCENT OF CHILDREN WHO ARE ELIGIBLE FOR THE FREE & REDUCED PRICE MEALS PROGRAM42.4% of children in Worcester County were eligible for the FARMS program during the 2016-2017 school year, meaning their families’ incomes were at or below 185% of the Federal Poverty Line. Maryland Department of Education
PENETRATION RATE OF FOOD SUPPLEMENT PROGRAM50.5% of eligible individuals in Worcester County participated in the Food Supplement Program.FY 2017 DHR FIA Statistical Report & American Community Survey 5-Year Estimates 2012-2016
PERCENT OF POPULATION PARTICIPATING IN FOOD SUPPLEMENT PROGRAM12.5% of people in Worcester County participated in the Food Supplement Program (formerly known as Food Stamps). The average benefit was $125.05 per person per month in FFY 2017. FY 2017 DHR FIA Statistical Report.
ADULTS RECEIVING TEMPORARY DISABILITY ASSISTANCE2.09% of adults in Worcester County participated in the Temporary Disability Assistance Program in FY 2017. Individuals received a maximum of $185 per month. FY 2017 DHR FIA Statistical Report
CHILDREN RECEIVING TEMPORARY CASH ASSISTANCE1.71% of children in Worcester County received Temporary Cash Assistance benefits in FY 2017. FY 2017 DHR FIA Statistical Report
PERCENT OF HOUSEHOLDS IN POVERTY WITH CHILDREN THAT RECEIVE TEMPORARY CASH ASSISTANCE16.6% of families with children who live below the Federal Poverty Line in Worcester County received Temporary Cash Assistance benefits in FY 2017. FY 2017 DHR FIA Statistical Report & American Community Survey 5-Year Estimates 2012-2016
PERCENT OF INCOME SPENT ON CHILD CARE Families with two children making the median income in Worcester County pay, on average, 18.8% of their income for childcare per year. Maryland Child Care Resource Network, Child Care Demographics 2017
HOUSING WAGEA worker in Worcester County needs to make $18.38 per hour in order to afford the fair market rent and utilities of a two-bedroom apartment without spending more than 30% of his or her income. National Low Income Housing Coalition, Out of Reach 2017
UNEMPLOYMENT RATE9.0% of residents of Worcester County are unemployed.Bureau of Labor Statistics, Labor Force Data by County, 2016 average

52
#
Appendix:
THE FOLLOWING IS A RANKED LIST OF COUNTIES, SUCH THAT THE JURISDICTION WITH THE HIGHEST FIGURE IS FIRST, AND THE COUNTY WITH THE LOWEST FIGURE IN THE STATE IS RANKED 24.
Percent of population living below the Federal Poverty Line
1 Somerset2 Baltimore City3 Allegany4 Caroline5 Dorchester6 Wicomico7 Washington8 Garrett9 Kent10 Talbot11 Cecil12 Worcester
Maryland State13 Prince George's14 Baltimore Co.15 St. Mary's16 Charles17 Harford18 Frederick19 Montgomery20 Queen Anne's21 Anne Arundel22 Calvert23 Carroll24 Howard
Median Income
1 Howard2 Montgomery3 Calvert4 Anne Arundel5 Charles6 Carroll7 St. Mary's8 Queen Anne's9 Frederick10 Harford
Maryland State11 Prince George's12 Baltimore Co.13 Cecil14 Talbot15 Worcester16 Washington17 Kent18 Wicomico19 Caroline20 Dorchester21 Garrett22 Baltimore City23 Allegany24 Somerset
Percent of population living below the Federal Poverty Line in 1990
1 Baltimore City2 Allegany3 Somerset4 Garrett5 Dorchester6 Caroline7 Wicomico8 Kent9 Worcester10 Washington11 Talbot
Maryland State12 Cecil13 St. Mary's14 Queen Anne's15 Prince George's16 Baltimore Co.17 Calvert18 Harford19 Charles20 Frederick21 Anne Arundel22 Montgomery23 Carroll24 Howard
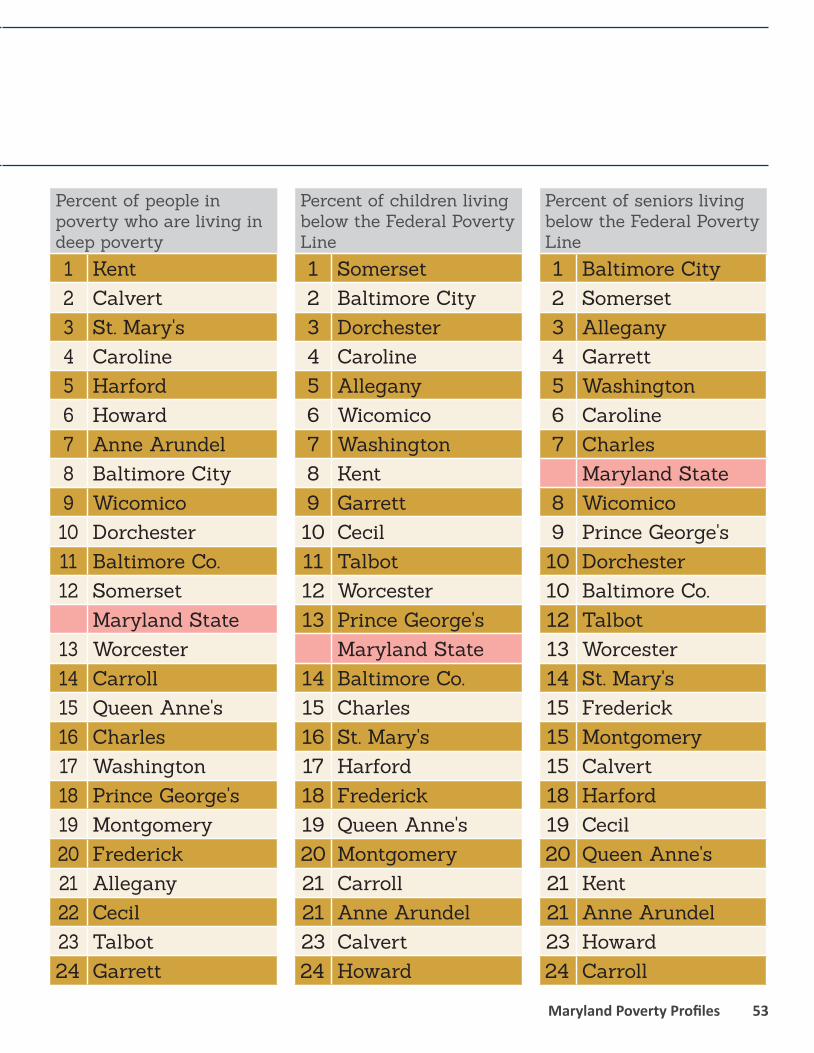
Maryland Poverty Profiles 53
Percent of seniors living below the Federal Poverty Line
1 Baltimore City2 Somerset3 Allegany4 Garrett5 Washington6 Caroline7 Charles
Maryland State8 Wicomico9 Prince George's10 Dorchester10 Baltimore Co.12 Talbot13 Worcester14 St. Mary's15 Frederick15 Montgomery15 Calvert18 Harford19 Cecil20 Queen Anne's21 Kent21 Anne Arundel23 Howard24 Carroll
Percent of children living below the Federal Poverty Line
1 Somerset2 Baltimore City3 Dorchester4 Caroline5 Allegany6 Wicomico7 Washington8 Kent9 Garrett10 Cecil11 Talbot12 Worcester13 Prince George's
Maryland State14 Baltimore Co.15 Charles16 St. Mary's17 Harford18 Frederick19 Queen Anne's20 Montgomery21 Carroll21 Anne Arundel23 Calvert24 Howard
Percent of people in poverty who are living in deep poverty
1 Kent2 Calvert3 St. Mary's4 Caroline5 Harford6 Howard7 Anne Arundel8 Baltimore City9 Wicomico10 Dorchester11 Baltimore Co.12 Somerset
Maryland State13 Worcester14 Carroll15 Queen Anne's16 Charles17 Washington18 Prince George's19 Montgomery20 Frederick21 Allegany22 Cecil23 Talbot24 Garrett

54
#
Appendix:
THE FOLLOWING IS A RANKED LIST OF COUNTIES, SUCH THAT THE JURISDICTION WITH THE HIGHEST FIGURE IS FIRST, AND THE COUNTY WITH THE LOWEST FIGURE IN THE STATE IS RANKED 24.
Percent of female-headed households living below the Federal Poverty Line
1 Somerset2 Caroline3 Allegany4 Dorchester5 Garrett6 Baltimore City7 Wicomico8 Washington9 St. Mary's10 Worcester11 Kent12 Cecil13 Harford
Maryland State14 Frederick15 Queen Anne's16 Talbot17 Charles18 Baltimore Co.19 Carroll20 Montgomery21 Howard22 Prince George's23 Anne Arundel24 Calvert
Percent of Hispanic or Latino Marylanders living below the Federal Poverty Line
1 Somerset2 Caroline3 Wicomico4 Allegany5 Talbot6 Baltimore City7 Carroll8 Washington9 Garrett10 St. Mary's10 Cecil12 Dorchester13 Queen Anne's14 Kent14 Baltimore Co.16 Frederick
Maryland State17 Prince George's18 Harford19 Charles20 Montgomery21 Howard22 Anne Arundel23 Calvert24 Worcester
Percent of Black or African-American Marylanders living below the Federal Poverty Line
1 Garrett2 Allegany3 Somerset4 Washington4 Dorchester6 Caroline7 Baltimore City7 Worcester9 Kent10 Talbot11 Wicomico12 Cecil13 St. Mary's14 Queen Anne's15 Frederick16 Harford
Maryland State17 Carroll18 Baltimore Co.19 Montgomery20 Anne Arundel21 Howard22 Charles23 Calvert24 Prince George's
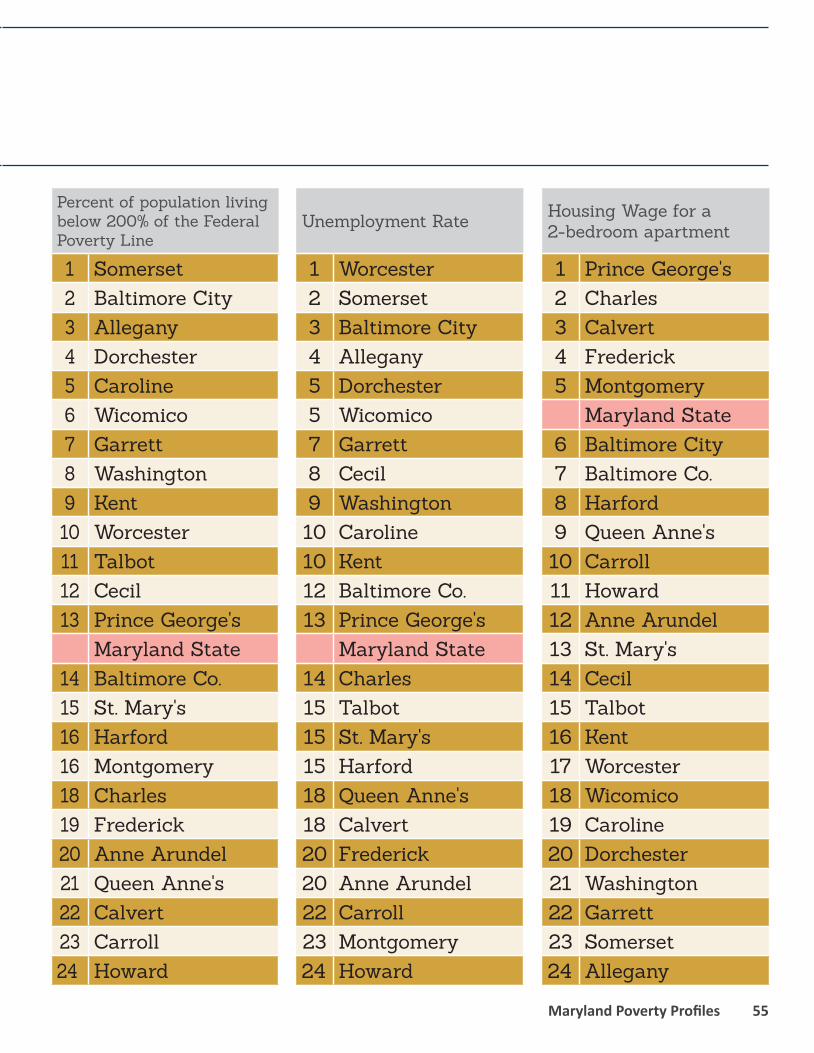
Maryland Poverty Profiles 55
Housing Wage for a 2-bedroom apartment
1 Prince George's2 Charles3 Calvert4 Frederick5 Montgomery
Maryland State6 Baltimore City7 Baltimore Co.8 Harford9 Queen Anne's10 Carroll11 Howard12 Anne Arundel13 St. Mary's14 Cecil15 Talbot16 Kent17 Worcester18 Wicomico19 Caroline20 Dorchester21 Washington22 Garrett23 Somerset24 Allegany
Unemployment Rate
1 Worcester2 Somerset3 Baltimore City4 Allegany5 Dorchester5 Wicomico7 Garrett8 Cecil9 Washington10 Caroline10 Kent12 Baltimore Co.13 Prince George's
Maryland State14 Charles15 Talbot15 St. Mary's15 Harford18 Queen Anne's18 Calvert20 Frederick20 Anne Arundel22 Carroll23 Montgomery24 Howard
Percent of population living below 200% of the Federal Poverty Line
1 Somerset2 Baltimore City3 Allegany4 Dorchester5 Caroline6 Wicomico7 Garrett8 Washington9 Kent10 Worcester11 Talbot12 Cecil13 Prince George's
Maryland State14 Baltimore Co.15 St. Mary's16 Harford16 Montgomery18 Charles19 Frederick20 Anne Arundel21 Queen Anne's22 Calvert23 Carroll24 Howard
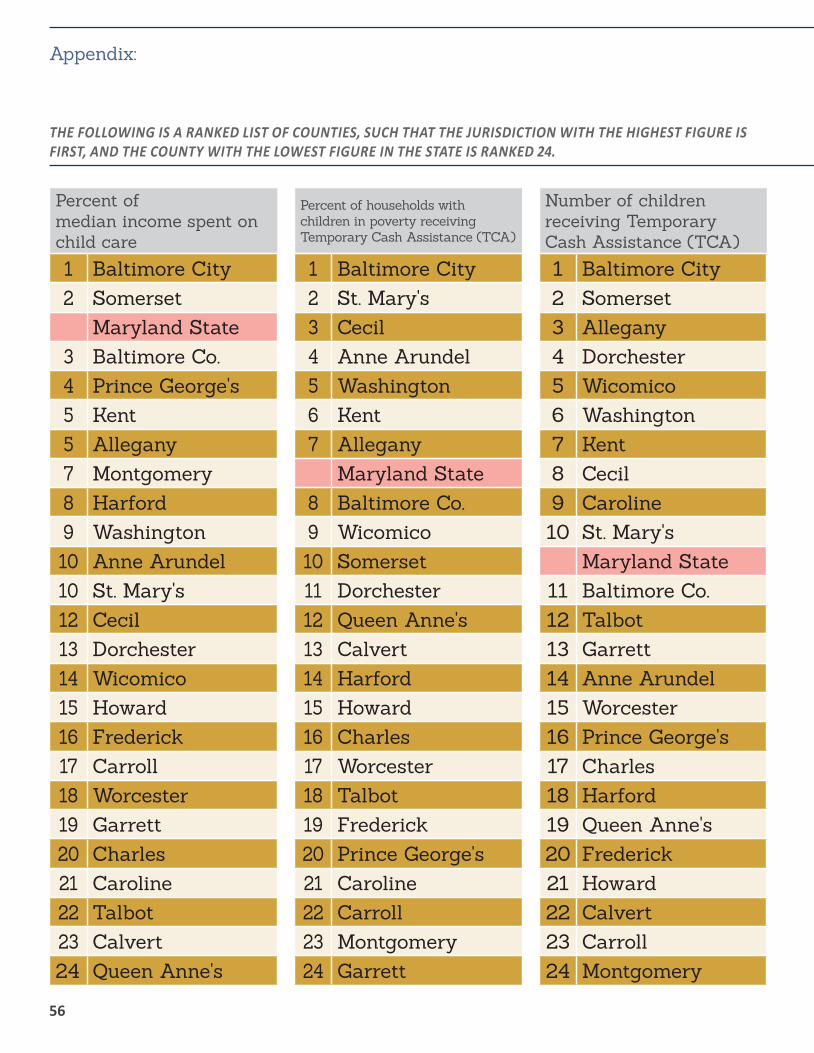
56
#
Appendix:
THE FOLLOWING IS A RANKED LIST OF COUNTIES, SUCH THAT THE JURISDICTION WITH THE HIGHEST FIGURE IS FIRST, AND THE COUNTY WITH THE LOWEST FIGURE IN THE STATE IS RANKED 24.
Number of children receiving Temporary Cash Assistance (TCA)
1 Baltimore City2 Somerset3 Allegany4 Dorchester5 Wicomico6 Washington7 Kent8 Cecil9 Caroline10 St. Mary's
Maryland State11 Baltimore Co.12 Talbot13 Garrett14 Anne Arundel15 Worcester16 Prince George's17 Charles18 Harford19 Queen Anne's20 Frederick21 Howard22 Calvert23 Carroll24 Montgomery
Percent of households with children in poverty receiving Temporary Cash Assistance (TCA)
1 Baltimore City2 St. Mary's3 Cecil4 Anne Arundel5 Washington6 Kent7 Allegany
Maryland State8 Baltimore Co.9 Wicomico10 Somerset11 Dorchester12 Queen Anne's13 Calvert14 Harford15 Howard16 Charles17 Worcester18 Talbot19 Frederick20 Prince George's21 Caroline22 Carroll23 Montgomery24 Garrett
Percent of median income spent on child care
1 Baltimore City2 Somerset
Maryland State3 Baltimore Co.4 Prince George's5 Kent5 Allegany7 Montgomery8 Harford9 Washington10 Anne Arundel10 St. Mary's12 Cecil13 Dorchester14 Wicomico15 Howard16 Frederick17 Carroll18 Worcester19 Garrett20 Charles21 Caroline22 Talbot23 Calvert24 Queen Anne's
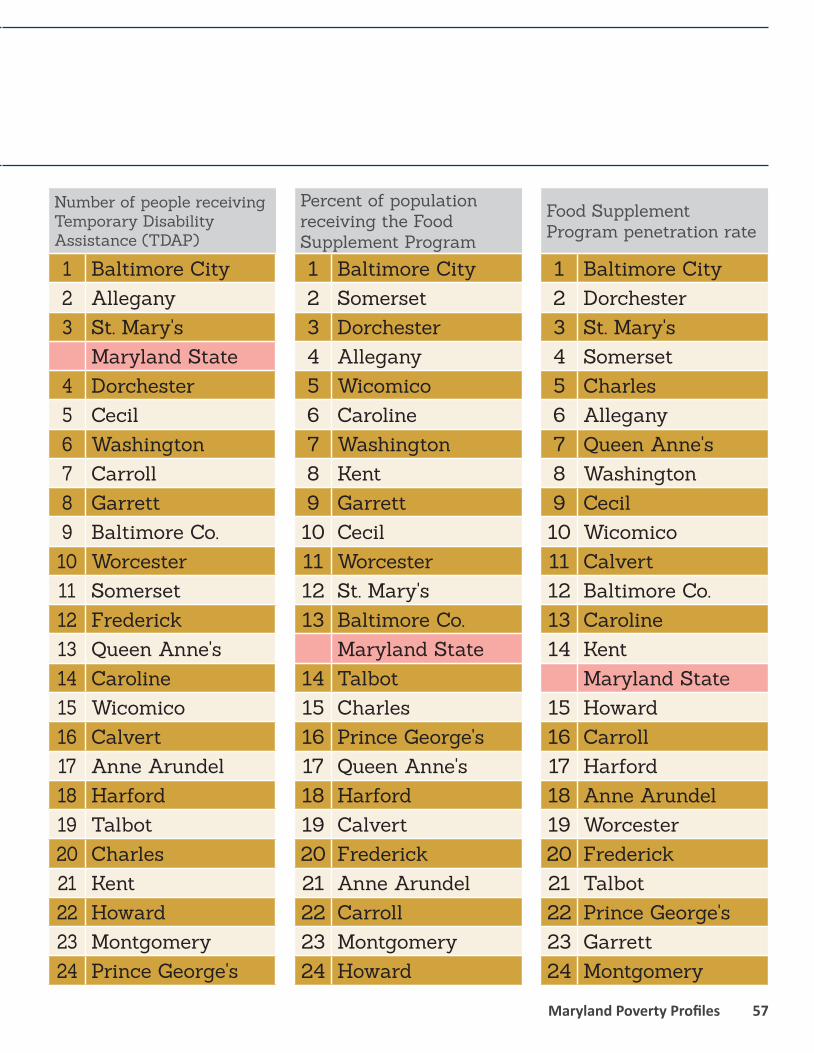
Maryland Poverty Profiles 57
Food Supplement Program penetration rate
1 Baltimore City2 Dorchester3 St. Mary's4 Somerset5 Charles6 Allegany7 Queen Anne's8 Washington9 Cecil10 Wicomico11 Calvert12 Baltimore Co.13 Caroline14 Kent
Maryland State15 Howard16 Carroll17 Harford18 Anne Arundel19 Worcester20 Frederick21 Talbot22 Prince George's23 Garrett24 Montgomery
Percent of population receiving the Food Supplement Program
1 Baltimore City2 Somerset3 Dorchester4 Allegany5 Wicomico6 Caroline7 Washington8 Kent9 Garrett10 Cecil11 Worcester12 St. Mary's13 Baltimore Co.
Maryland State14 Talbot15 Charles16 Prince George's17 Queen Anne's18 Harford19 Calvert20 Frederick21 Anne Arundel22 Carroll23 Montgomery24 Howard
Number of people receiving Temporary Disability Assistance (TDAP)
1 Baltimore City2 Allegany3 St. Mary's
Maryland State4 Dorchester5 Cecil6 Washington7 Carroll8 Garrett9 Baltimore Co.10 Worcester11 Somerset12 Frederick13 Queen Anne's14 Caroline15 Wicomico16 Calvert17 Anne Arundel18 Harford19 Talbot20 Charles21 Kent22 Howard23 Montgomery24 Prince George's

58
#
Appendix:
THE FOLLOWING IS A RANKED LIST OF COUNTIES, SUCH THAT THE JURISDICTION WITH THE HIGHEST FIGURE IS FIRST, AND THE COUNTY WITH THE LOWEST FIGURE IN THE STATE IS RANKED 24.
Percent of population that remains uninsured
1 Prince George's2 Caroline3 Montgomery4 Somerset4 Wicomico6 Baltimore City7 Garrett
Maryland State8 Washington9 Worcester10 Baltimore Co.11 Cecil12 Talbot13 Allegany14 Kent15 Dorchester16 Frederick17 St. Mary's17 Anne Arundel17 Calvert20 Howard21 Queen Anne's22 Harford23 Charles23 Carroll
Percent of population enrolled in Medicaid
1 Somerset2 Baltimore City3 Dorchester4 Caroline5 Wicomico6 Allegany7 Washington8 Garrett9 Kent10 Worcester11 Cecil12 Prince George's13 Baltimore Co.
Maryland State14 Talbot15 St. Mary's16 Charles17 Montgomery18 Queen Anne's19 Harford20 Anne Arundel21 Frederick22 Calvert23 Howard24 Carroll
Percent of children eligible for Free and Reduced-Price Meals (FARMS)
1 Baltimore City2 Somerset3 Dorchester4 Prince George's5 Wicomico6 Allegany7 Caroline8 Kent9 Washington10 Garrett11 Baltimore Co.
Maryland State12 Cecil13 Talbot14 Worcester15 Charles16 Montgomery17 St. Mary's18 Anne Arundel19 Harford20 Frederick21 Queen Anne's22 Howard23 Calvert24 Carroll

Maryland Poverty Profiles 59
Change in Poverty since 1990-2016
1 Baltimore Co.2 Prince George's3 Montgomery4 Howard5 Somerset6 Charles7 Harford8 Carroll9 Frederick10 Caroline11 Cecil12 Wicomico13 Washington14 Anne Arundel15 Talbot16 Dorchester
Maryland State17 Calvert18 St. Mary's19 Baltimore City19 Allegany21 Kent22 Queen Anne's23 Worcester24 Garrett