maryland arts and entertainment districts impact analysis ... · pdf filemaryland arts and...
TRANSCRIPT
Maryland Arts and Entertainment Districts Impact Analysis FY 2014
Prepared for Maryland State Arts Council
Daraius Irani, Ph.D., Chief Economist Jessica Grimm, Senior Research Associate
April 1, 2015
Towson, Maryland 21252 | 410-704-3326 | www.towson.edu/resi
Maryland Arts and Entertainment Districts Impact Analysis FY 2014 RESI of Towson University
2
Table of Contents 1.0 Executive Summary .............................................................................................................. 4
1.1 Overview .......................................................................................................................... 4 1.2 Summary of Findings ........................................................................................................ 4
2.0 Introduction ......................................................................................................................... 6 3.0 Findings ................................................................................................................................ 6
3.1 Economic Impacts ............................................................................................................ 6 3.2 Fiscal Impacts ................................................................................................................. 11
4.0 Literature Review ............................................................................................................... 13 5.0 Conclusion .......................................................................................................................... 14 6.0 References ......................................................................................................................... 16 Appendix A—Methodology .......................................................................................................... 22
A.1 IMPLAN Model Overview ............................................................................................... 22 A.2 Input Assumptions ......................................................................................................... 22 A.3 Modeling Assumptions ................................................................................................... 27 A.4 Exclusions ....................................................................................................................... 28 A.5 Limitations of the Data Provided ................................................................................... 29
Appendix B—Glossary ................................................................................................................... 30 Appendix C—MSAC Annual Report .............................................................................................. 31 Appendix D—A&E District Websites ............................................................................................. 39
Maryland Arts and Entertainment Districts Impact Analysis FY 2014 RESI of Towson University
3
Table of Figures Figure 1: Economic Impact Summary ............................................................................................. 7 Figure 2: Total Employment Impacts .............................................................................................. 8 Figure 3: Total State GDP Impacts .................................................................................................. 9 Figure 4: Total Wage Impacts ....................................................................................................... 10 Figure 5: Total Fiscal Impacts ........................................................................................................ 12 Figure 6: Summary of Similar Studies ........................................................................................... 14 Figure 7: Event Spending Data Summary ..................................................................................... 24 Figure 8: IMPLAN Industry Sectors ............................................................................................... 27 Figure 9: Glossary of Terms .......................................................................................................... 30 Figure 10: A&E District Websites .................................................................................................. 39

Maryland Arts and Entertainment Districts Impact Analysis FY 2014 RESI of Towson University
4
1.0 Executive Summary 1.1 Overview The Maryland State Arts Council (MSAC) sought a report detailing the economic and fiscal impacts of the 22 Maryland Arts and Entertainment Districts (A&E districts) in existence during the study period, fiscal year (FY) 2014, on Maryland’s economy. As one of the first states to develop this designation, Maryland’s A&E districts serve as a case study and leading example for other states. Other states have since created similar designations based on Maryland’s program. To achieve the project objective, the Regional Economic Studies Institute (RESI) of Towson University conducted an economic and fiscal impact analysis. To quantify the economic and fiscal impact of the A&E districts, RESI used the IMPLAN input/output model. For more information regarding IMPLAN and RESI’s methodology (assumptions, exclusions, etc.), please refer to Appendix A. A glossary of terms can be found in Appendix B. This analysis answers the following questions:
1. How many direct, indirect, and induced jobs have the districts created? 2. How much direct, indirect, and induced state GDP have the districts generated? 3. How much in tax revenues have the districts generated for the State of Maryland?
1.2 Summary of Findings Below are RESI’s key findings in regard to the economic and fiscal impacts of the A&E districts for FY 2014.1 Economic Impacts
The A&E districts’ operations supported an estimated 6,000 direct, indirect, and induced jobs during the period.
o Approximately 1,211 of these jobs were generated by new businesses formed within A&E districts’ boundaries during the period.
o The other 4,766 jobs were supported by visitor spending at events supported by the A&E districts during the period.
Nearly $571.4 million in total state GDP were supported by the A&E districts during the period.
o Approximately $136.9 million were generated by new businesses formed within A&E districts’ boundaries during the period.
o The other $434.4 million were supported by visitor spending at events supported by the A&E districts during the period.
More than $198.5 million in total wages were supported by the A&E districts during the period.
1 While this analysis takes into account as many variables as possible, it is important to note that a number of assumptions and exclusions were made as a result of missing data and other factors.
Maryland Arts and Entertainment Districts Impact Analysis FY 2014 RESI of Towson University
5
o Approximately $50.1 million were generated by new businesses formed within A&E districts’ boundaries during the period.
o The other $148.4 million were supported by visitor spending at events supported by the A&E districts during the period.
Fiscal Impacts
New businesses formed within A&E districts’ boundaries during the study period generated nearly $7.9 million in tax revenues.2
Visitor spending at events supported by the A&E districts supported more than $30.6 million in tax revenues during the study period.
The total tax revenue impact of the A&E districts came to approximately $38.5 million during the study period.
2 Total tax revenues refer to property, income, sales, payroll, and other tax revenues supported on the state and local levels.
Maryland Arts and Entertainment Districts Impact Analysis FY 2014 RESI of Towson University
6
2.0 Introduction The Maryland State Arts Council (MSAC) sought a report detailing the economic and fiscal impacts of the 22 Maryland Arts and Entertainment Districts (A&E districts) in existence during the study period, fiscal year (FY) 2014, on Maryland’s economy. As one of the first states to develop this designation, Maryland’s A&E districts serve as a case study and leading example for other states. Other states have since created similar designations based on Maryland’s program. To achieve the project objective, the Regional Economic Studies Institute (RESI) of Towson University estimated job creation, state GDP (also referred to as output), and wages attributable to the A&E districts in 2014.3 These results were broken down by type of impact (direct, indirect, and induced). RESI also estimated the fiscal impacts associated with the program. Fiscal impacts were then compared against estimated tax revenue losses associated with the tax incentives available to and used by districts. The project team considered grants where applicable. This analysis answers the following questions:
1. How many direct, indirect, and induced jobs have the districts created? 2. How much direct, indirect, and induced state GDP has the project generated? 3. How much in tax revenues have the districts generated for the State of Maryland?
To quantify the economic and fiscal impact of the project, RESI used the IMPLAN input/output model. For more information regarding IMPLAN, please refer to Appendix A.
3.0 Findings 3.1 Economic Impacts To determine the economic impacts, RESI used A&E district application materials and annual reports provided by MSAC. For a list of the annual report data provided, please refer to Appendix A. A summary of the total economic impacts generated by both new businesses and supported by visitor spending at events supported by the A&E districts can be found in Figure 1.
3 For definitions of terms, please refer to Appendix B.

Maryland Arts and Entertainment Districts Impact Analysis FY 2014 RESI of Towson University
7
Figure 1: Economic Impact Summary4
District Designation Year Employment State GDP Wages
Annapolis 2008 62.1 $6,221,185 $2,386,226 Bel Air 2010 522.0 $51,533,976 $17,317,867 Berlin 2005 198.8 $18,960,288 $6,349,766 Bethesda 2002 632.4 $61,385,195 $20,787,939 Bromo Tower 2013 14.0 $2,410,358 $846,162 Cambridge 2003 98.2 $9,739,339 $3,582,335 Cumberland 2002 363.7 $37,309,615 $12,873,199 Denton 2005 38.4 $3,399,364 $1,176,631 Elkton 2006 87.0 $8,092,239 $2,742,363 Frederick 2003 931.6 $83,212,430 $28,903,939 Frostburg 2009 43.8 $4,638,991 $1,485,007 Gateway 2002 52.4 $4,951,084 $1,744,527 Hagerstown 2002 298.4 $26,785,925 $9,235,623 Havre de Grace 2008 152.0 $13,808,946 $4,775,061 Highlandtown 2003 95.3 $9,114,963 $3,284,303 Leonardtown 2014 198.4 $18,734,666 $6,501,109 Salisbury 2007 254.5 $26,194,148 $9,141,512 Silver Spring 2002 1395.3 $136,562,196 $48,285,894 Snow Hill 2006 18.3 $1,782,591 $607,955 Station North 2002 340.5 $29,704,697 $10,321,727 Stevensville 2014 6.0 $476,566 $164,909 Wheaton 2006 174.1 $16,338,678 $5,991,571
Total 5977.1 $571,357,436 $198,505,625
Sources: IMPLAN, RESI According to RESI’s analysis, the A&E districts collectively supported approximately 6,000 jobs and have generated nearly $571.4 million and $198.5 million in state GDP and wages, respectively, during FY 2014 based on provided data. The direct, indirect, induced, and total economic impacts broken out by source (new businesses and event spending) can be found in Figures 2 through 4. For information regarding RESI’s methodology, please refer to Appendix A. Please note that direct employment figures associated with event spending throughout the report refer to the jobs supported by event attendees’ spending money outside a given event but within the A&E district for the duration of the event. For more information regarding RESI’s assumptions, please refer to Section A.2 in Appendix A.
4 Summed figures throughout the report may not add up exactly to totals due to rounding.
Maryland Arts and Entertainment Districts Impact Analysis FY 2014 RESI of Towson University
8
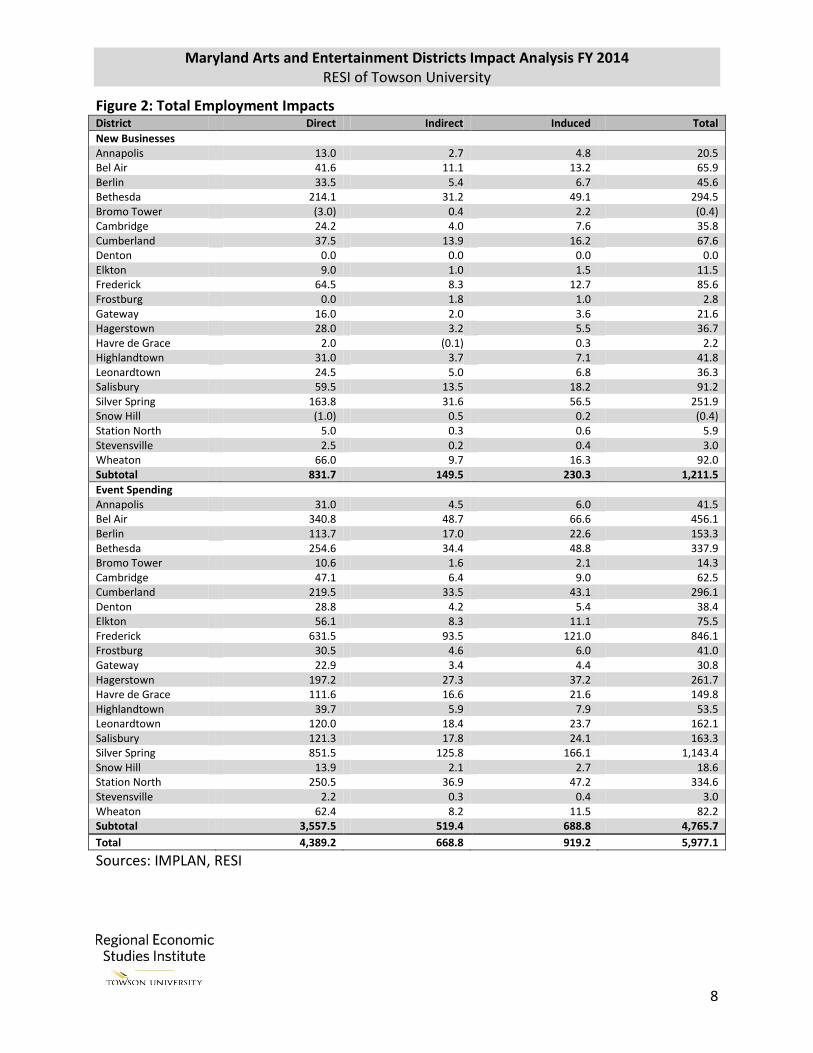
Figure 2: Total Employment Impacts District Direct Indirect Induced Total
New Businesses Annapolis 13.0 2.7 4.8 20.5 Bel Air 41.6 11.1 13.2 65.9 Berlin 33.5 5.4 6.7 45.6 Bethesda 214.1 31.2 49.1 294.5 Bromo Tower (3.0) 0.4 2.2 (0.4) Cambridge 24.2 4.0 7.6 35.8 Cumberland 37.5 13.9 16.2 67.6 Denton 0.0 0.0 0.0 0.0 Elkton 9.0 1.0 1.5 11.5 Frederick 64.5 8.3 12.7 85.6 Frostburg 0.0 1.8 1.0 2.8 Gateway 16.0 2.0 3.6 21.6 Hagerstown 28.0 3.2 5.5 36.7 Havre de Grace 2.0 (0.1) 0.3 2.2 Highlandtown 31.0 3.7 7.1 41.8 Leonardtown 24.5 5.0 6.8 36.3 Salisbury 59.5 13.5 18.2 91.2 Silver Spring 163.8 31.6 56.5 251.9 Snow Hill (1.0) 0.5 0.2 (0.4) Station North 5.0 0.3 0.6 5.9 Stevensville 2.5 0.2 0.4 3.0 Wheaton 66.0 9.7 16.3 92.0 Subtotal 831.7 149.5 230.3 1,211.5
Event Spending Annapolis 31.0 4.5 6.0 41.5 Bel Air 340.8 48.7 66.6 456.1 Berlin 113.7 17.0 22.6 153.3 Bethesda 254.6 34.4 48.8 337.9 Bromo Tower 10.6 1.6 2.1 14.3 Cambridge 47.1 6.4 9.0 62.5 Cumberland 219.5 33.5 43.1 296.1 Denton 28.8 4.2 5.4 38.4 Elkton 56.1 8.3 11.1 75.5 Frederick 631.5 93.5 121.0 846.1 Frostburg 30.5 4.6 6.0 41.0 Gateway 22.9 3.4 4.4 30.8 Hagerstown 197.2 27.3 37.2 261.7 Havre de Grace 111.6 16.6 21.6 149.8 Highlandtown 39.7 5.9 7.9 53.5 Leonardtown 120.0 18.4 23.7 162.1 Salisbury 121.3 17.8 24.1 163.3 Silver Spring 851.5 125.8 166.1 1,143.4 Snow Hill 13.9 2.1 2.7 18.6 Station North 250.5 36.9 47.2 334.6 Stevensville 2.2 0.3 0.4 3.0 Wheaton 62.4 8.2 11.5 82.2 Subtotal 3,557.5 519.4 688.8 4,765.7
Total 4,389.2 668.8 919.2 5,977.1
Sources: IMPLAN, RESI

Maryland Arts and Entertainment Districts Impact Analysis FY 2014 RESI of Towson University
9
Figure 3: Total State GDP Impacts District Direct Indirect Induced Total
New Businesses Annapolis $1,285,740 $358,888 $662,910 $2,307,537 Bel Air $5,192,694 $1,806,856 $1,801,417 $8,800,966 Berlin $2,775,398 $896,731 $914,804 $4,586,932 Bethesda $19,370,106 $4,941,893 $6,725,226 $31,037,225 Bromo Tower $728,454 $69,509 $298,977 $1,096,940 Cambridge $2,436,892 $598,998 $1,038,911 $4,074,801 Cumberland $5,931,470 $2,277,747 $2,216,679 $10,425,897 Denton $0 $0 $0 $0 Elkton $609,183 $171,240 $206,507 $986,930 Frederick $4,563,099 $1,365,545 $1,743,795 $7,672,440 Frostburg $403,153 $296,494 $138,348 $837,995 Gateway $1,407,356 $297,542 $498,186 $2,203,084 Hagerstown $1,983,971 $532,019 $747,338 $3,263,328 Havre de Grace $32,388 -$5,594 $40,514 $67,308 Highlandtown $2,442,330 $589,232 $966,183 $3,997,745 Leonardtown $2,168,105 $699,211 $926,528 $3,793,843 Salisbury $6,790,789 $2,052,184 $2,491,491 $11,334,463 Silver Spring $18,401,612 $4,735,654 $7,743,838 $30,881,105 Snow Hill $25,542 $22,388 $20,630 $68,560 Station North $165,779 $34,557 $82,158 $282,495 Stevensville $125,515 $25,029 $48,861 $199,405 Wheaton $5,228,387 $1,539,349 $2,229,282 $8,997,018 Subtotal $82,067,962 $23,305,471 $31,542,584 $136,916,016
Event Spending Annapolis $2,387,849 $702,776 $823,023 $3,913,648 Bel Air $26,036,562 $7,572,880 $9,123,567 $42,733,009 Berlin $8,711,451 $2,571,087 $3,090,818 $14,373,356 Bethesda $18,351,126 $5,307,819 $6,689,025 $30,347,970 Bromo Tower $788,986 $230,394 $294,038 $1,313,418 Cambridge $3,436,813 $989,915 $1,237,809 $5,664,537 Cumberland $16,097,143 $4,881,416 $5,905,159 $26,883,718 Denton $2,033,155 $621,444 $744,766 $3,399,364 Elkton $4,318,523 $1,269,512 $1,517,273 $7,105,308 Frederick $45,229,544 $13,738,690 $16,571,756 $75,539,990 Frostburg $2,295,971 $687,788 $817,238 $3,800,996 Gateway $1,641,763 $500,166 $606,071 $2,748,000 Hagerstown $14,233,527 $4,193,585 $5,095,485 $23,522,597 Havre de Grace $8,293,551 $2,487,902 $2,960,186 $13,741,638 Highlandtown $3,125,387 $914,877 $1,076,953 $5,117,217 Leonardtown $8,985,328 $2,707,190 $3,248,305 $14,940,823 Salisbury $8,922,203 $2,633,596 $3,303,886 $14,859,685 Silver Spring $63,907,346 $19,027,438 $22,746,307 $105,681,091 Snow Hill $1,033,545 $309,423 $371,063 $1,714,031 Station North $17,564,883 $5,387,630 $6,469,688 $29,422,202 Stevensville $167,459 $49,536 $60,166 $277,161 Wheaton $4,462,730 $1,297,195 $1,581,734 $7,341,660 Subtotal $262,024,845 $78,082,260 $94,334,315 $434,441,420
Total $344,092,807 $101,387,730 $125,876,899 $571,357,436
Sources: IMPLAN, RESI

Maryland Arts and Entertainment Districts Impact Analysis FY 2014 RESI of Towson University
10
Figure 4: Total Wage Impacts District Direct Indirect Induced Total
New Businesses Annapolis $718,151 $141,236 $214,982 $1,074,369 Bel Air $1,663,972 $622,149 $584,235 $2,870,357 Berlin $895,927 $289,992 $296,671 $1,482,590 Bethesda $6,542,085 $1,616,914 $2,181,469 $10,340,468 Bromo Tower $270,078 $26,703 $97,036 $393,816 Cambridge $1,098,232 $208,771 $336,953 $1,643,957 Cumberland $2,212,327 $785,209 $718,762 $3,716,298 Denton $0 $0 $0 $0 Elkton $216,296 $50,713 $66,971 $333,980 Frederick $1,847,865 $430,833 $565,499 $2,844,197 Frostburg $39,501 $105,931 $44,893 $190,325 Gateway $535,853 $99,729 $161,570 $797,152 Hagerstown $808,364 $166,069 $242,357 $1,216,790 Havre de Grace $53,745 $8,231 $13,131 $75,107 Highlandtown $1,057,148 $188,499 $313,340 $1,558,987 Leonardtown $875,264 $234,592 $300,551 $1,410,407 Salisbury $2,491,648 $710,702 $808,009 $4,010,359 Silver Spring $8,308,051 $1,639,617 $2,511,404 $12,459,072 Snow Hill $4,524 $10,804 $6,700 $22,028 Station North $89,041 $13,241 $26,648 $128,930 Stevensville $46,083 $8,239 $15,853 $70,175 Wheaton $2,241,341 $520,458 $723,065 $3,484,865 Subtotal $32,015,497 $7,878,634 $10,230,099 $50,124,230
Event Spending Annapolis $818,478 $226,454 $266,925 $1,311,857 Bel Air $9,039,411 $2,449,038 $2,959,060 $14,447,510 Berlin $3,024,619 $840,085 $1,002,472 $4,867,176 Bethesda $6,567,966 $1,709,921 $2,169,584 $10,447,470 Bromo Tower $281,029 $75,940 $95,377 $452,345 Cambridge $1,218,851 $318,048 $401,479 $1,938,378 Cumberland $5,638,641 $1,602,869 $1,915,391 $9,156,901 Denton $732,445 $202,632 $241,553 $1,176,631 Elkton $1,502,544 $413,745 $492,094 $2,408,383 Frederick $16,195,094 $4,489,761 $5,374,887 $26,059,742 Frostburg $804,664 $224,963 $265,055 $1,294,682 Gateway $586,778 $164,019 $196,578 $947,375 Hagerstown $5,020,513 $1,345,651 $1,652,668 $8,018,833 Havre de Grace $2,928,031 $811,853 $960,070 $4,699,953 Highlandtown $1,078,399 $297,644 $349,273 $1,725,316 Leonardtown $3,147,525 $889,606 $1,053,571 $5,090,702 Salisbury $3,193,729 $865,786 $1,071,638 $5,131,153 Silver Spring $22,259,668 $6,189,655 $7,377,500 $35,826,823 Snow Hill $364,333 $101,246 $120,349 $585,927 Station North $6,337,527 $1,756,906 $2,098,363 $10,192,796 Stevensville $58,978 $16,242 $19,514 $94,734 Wheaton $1,582,075 $411,627 $513,005 $2,506,707 Subtotal $92,381,297 $25,403,693 $30,596,406 $148,381,395
Total $124,396,793 $33,282,327 $40,826,505 $198,505,625
Sources: IMPLAN, RESI

Maryland Arts and Entertainment Districts Impact Analysis FY 2014 RESI of Towson University
11
Previous studies have yielded results comparable to RESI’s findings. For a summary of results from past impact analyses, please refer to Section 4.0.5 3.2 Fiscal Impacts RESI also estimated the fiscal impacts associated with the A&E districts. The fiscal impacts of the A&E districts can be found in Figure 5. Input data were provided in application materials and annual reports provided by MSAC. Fiscal impacts—specifically, property tax revenues—would traditionally be compared against estimated tax revenue losses associated with the property tax incentives available to and used by A&E districts. Data from the A&E district annual reports did indicate that one property submitted applications for the tax incentive, but neither the annual reports nor information from the State Department of Assessments and Taxation indicated that this application was approved. As a result, RESI omitted this consideration for the analysis. For more information regarding RESI’s reasoning, please refer to Appendix A.
5 Data may not available for every report and every category of interest as impact analyses vary in terms of objective and methodology.
Maryland Arts and Entertainment Districts Impact Analysis FY 2014 RESI of Towson University
12
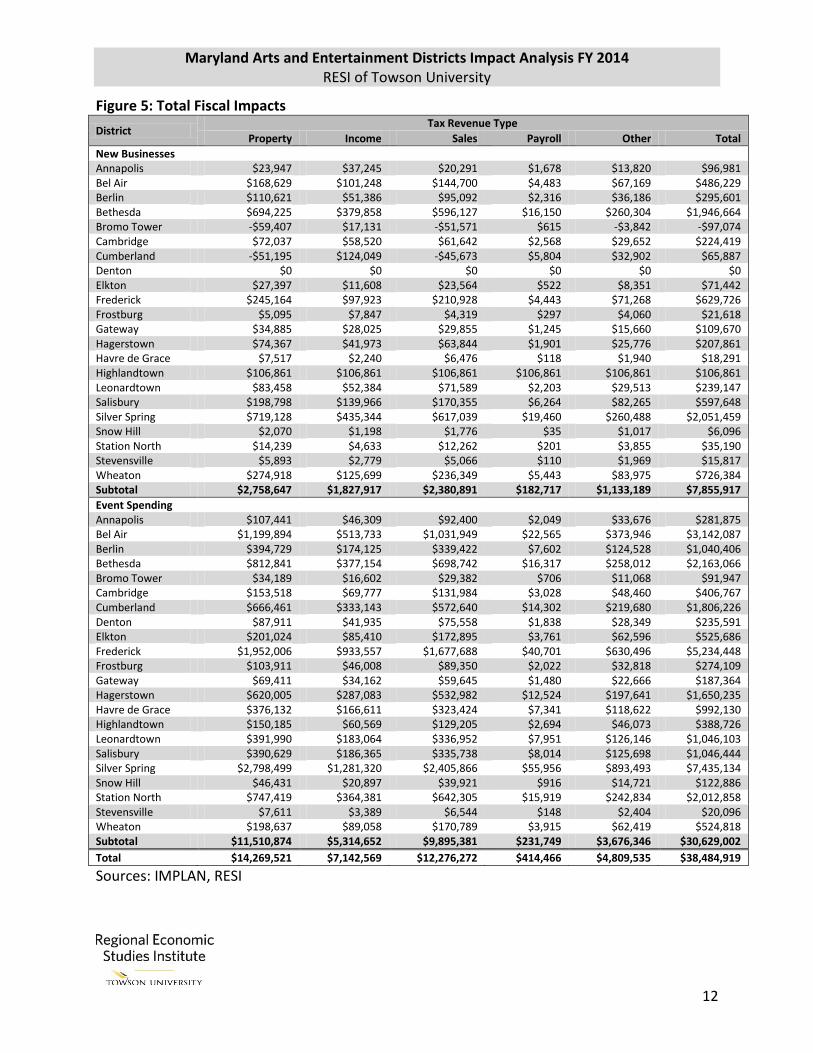
Figure 5: Total Fiscal Impacts
District Tax Revenue Type
Property Income Sales Payroll Other Total
New Businesses Annapolis $23,947 $37,245 $20,291 $1,678 $13,820 $96,981 Bel Air $168,629 $101,248 $144,700 $4,483 $67,169 $486,229 Berlin $110,621 $51,386 $95,092 $2,316 $36,186 $295,601 Bethesda $694,225 $379,858 $596,127 $16,150 $260,304 $1,946,664 Bromo Tower -$59,407 $17,131 -$51,571 $615 -$3,842 -$97,074 Cambridge $72,037 $58,520 $61,642 $2,568 $29,652 $224,419 Cumberland -$51,195 $124,049 -$45,673 $5,804 $32,902 $65,887 Denton $0 $0 $0 $0 $0 $0 Elkton $27,397 $11,608 $23,564 $522 $8,351 $71,442 Frederick $245,164 $97,923 $210,928 $4,443 $71,268 $629,726 Frostburg $5,095 $7,847 $4,319 $297 $4,060 $21,618 Gateway $34,885 $28,025 $29,855 $1,245 $15,660 $109,670 Hagerstown $74,367 $41,973 $63,844 $1,901 $25,776 $207,861 Havre de Grace $7,517 $2,240 $6,476 $118 $1,940 $18,291 Highlandtown $106,861 $106,861 $106,861 $106,861 $106,861 $106,861 Leonardtown $83,458 $52,384 $71,589 $2,203 $29,513 $239,147 Salisbury $198,798 $139,966 $170,355 $6,264 $82,265 $597,648 Silver Spring $719,128 $435,344 $617,039 $19,460 $260,488 $2,051,459 Snow Hill $2,070 $1,198 $1,776 $35 $1,017 $6,096 Station North $14,239 $4,633 $12,262 $201 $3,855 $35,190 Stevensville $5,893 $2,779 $5,066 $110 $1,969 $15,817 Wheaton $274,918 $125,699 $236,349 $5,443 $83,975 $726,384 Subtotal $2,758,647 $1,827,917 $2,380,891 $182,717 $1,133,189 $7,855,917
Event Spending Annapolis $107,441 $46,309 $92,400 $2,049 $33,676 $281,875 Bel Air $1,199,894 $513,733 $1,031,949 $22,565 $373,946 $3,142,087 Berlin $394,729 $174,125 $339,422 $7,602 $124,528 $1,040,406 Bethesda $812,841 $377,154 $698,742 $16,317 $258,012 $2,163,066 Bromo Tower $34,189 $16,602 $29,382 $706 $11,068 $91,947 Cambridge $153,518 $69,777 $131,984 $3,028 $48,460 $406,767 Cumberland $666,461 $333,143 $572,640 $14,302 $219,680 $1,806,226 Denton $87,911 $41,935 $75,558 $1,838 $28,349 $235,591 Elkton $201,024 $85,410 $172,895 $3,761 $62,596 $525,686 Frederick $1,952,006 $933,557 $1,677,688 $40,701 $630,496 $5,234,448 Frostburg $103,911 $46,008 $89,350 $2,022 $32,818 $274,109 Gateway $69,411 $34,162 $59,645 $1,480 $22,666 $187,364 Hagerstown $620,005 $287,083 $532,982 $12,524 $197,641 $1,650,235 Havre de Grace $376,132 $166,611 $323,424 $7,341 $118,622 $992,130 Highlandtown $150,185 $60,569 $129,205 $2,694 $46,073 $388,726 Leonardtown $391,990 $183,064 $336,952 $7,951 $126,146 $1,046,103 Salisbury $390,629 $186,365 $335,738 $8,014 $125,698 $1,046,444 Silver Spring $2,798,499 $1,281,320 $2,405,866 $55,956 $893,493 $7,435,134 Snow Hill $46,431 $20,897 $39,921 $916 $14,721 $122,886 Station North $747,419 $364,381 $642,305 $15,919 $242,834 $2,012,858 Stevensville $7,611 $3,389 $6,544 $148 $2,404 $20,096 Wheaton $198,637 $89,058 $170,789 $3,915 $62,419 $524,818 Subtotal $11,510,874 $5,314,652 $9,895,381 $231,749 $3,676,346 $30,629,002
Total $14,269,521 $7,142,569 $12,276,272 $414,466 $4,809,535 $38,484,919
Sources: IMPLAN, RESI
Maryland Arts and Entertainment Districts Impact Analysis FY 2014 RESI of Towson University
13
4.0 Literature Review RESI analyzed findings from similar studies conducted for comparable programs and/or designations. Across the nation, there has been an increased interest in establishing arts, culture, and entertainment districts. According to the National Assembly of State Arts Agencies, twelve states had “established 156 unique cultural districts across the country” as of 2012.6 In addition to Maryland, Arkansas, Colorado, Indiana, Iowa, Kentucky, Louisiana, Massachusetts, New Mexico, Rhode Island, Texas, and West Virginia have cultural or similar district designations.7 Since 2012, Oklahoma and South Carolina have also established cultural districts.8 Americans for the Arts, a nonprofit organization, focuses on promoting and advancing the arts in the United States.9 In recent years, American for the Arts has performed extensive research into the economic impacts of the nonprofit arts and culture industry on both individual states and the United States as a whole.10 Most recently, in 2012, Americans for the Arts released the Arts & Economic Prosperity IV summary report, the fourth in its series.11 This report details the economic and fiscal impacts of the nonprofit arts and cultural industry in 2010 at a national, state, and, in some cases, regional level. Nationally, the 2010 economic impact of the nonprofit arts and culture industry was determined to have generated $135.2 billion in total direct expenditures, supported 4.1 million full-time equivalent jobs, and to have generated $86.7 billion in resident household income, $12.7 billion in local and state government income, and $9.6 billion in federal tax revenue.12 In late 2013, the U.S. Bureau of Economic Analysis and the National Endowment for the Arts announced that in arts and cultural production accounted for 3.2 percent of total gross domestic product in 2011—a total of more than $500 billion.13 Arts and cultural production has
6 National Assembly of State Arts Agencies, “State Policy Briefs: Tools for Arts Decision Making,” 1, 2012, accessed January 31, 2014, http://www.nasaa-arts.org/Research/Key-Topics/Creative-Economic-Development/StateCulturalDistrictsPolicyBrief.pdf. 7 National Assembly of State Arts Agencies, “State Arts Agency Creative Economy Initiates,” accessed January 31, 2014, http://www.nasaa-arts.org/Research/Key-Topics/Creative-Economic-Development/State-Arts-Agency-Creative-Economy-Initiatives.php. 8 Ibid. 9 Americans for the Arts, “About Americans for the Arts,” accessed January 31, 2014, http://www.americansforthearts.org/about-americans-for-the-arts. 10 Americans for the Arts, “Reports and Data,” accessed January 31, 2014, http://www.americansforthearts.org/by-program/reports-and-dat. 11 Americans for the Arts, “Arts & Economic Prosperity IV: The Economic Impact of Nonprofit Arts and Cultural Organizations and Their Audiences Summary Report,” May 14, 2012, accessed January 28, 2013, http://www.artsusa.org/pdf/information_services/research/services/economic_impact/aepiv/AEP4_NationalSummaryReport.pdf. 12 Ibid, 3. 13 “U.S. Bureau of Economic Analysis and National Endowment for the Arts Release Preliminary Report on Impact of Arts and Culture on U.S. Economy,” National Endowment for the Arts, December 5, 2013, accessed January 30, 2015, http://arts.gov/news/2013/us-bureau-economic-analysis-and-national-endowment-arts-release-preliminary-report-impact#sthash.AumRPyaS.dpuf.

Maryland Arts and Entertainment Districts Impact Analysis FY 2014 RESI of Towson University
14
consistently accounted for 3.2 to 3.7 percent of total gross domestic product for more than a decade.14 Even more impressive than the vast national impacts of the nonprofit arts and cultural industry are the impacts the industry has on individual regions and states. While the Arts & Economic Prosperity IV summary report detailed statewide impacts, several states have released independent studies regarding the state-level economic impacts of the arts since the last Americans for the Arts release. RESI compiled a sample of state reports for comparison purposes. A summary of these impacts can be found in Figure 6. Figure 6: Summary of Similar Studies15
State State GDP Employment Wages State and Local
Revenue
Arizona $581,318,224 56,112 N/A N/A California $273,500,000,000 1,400,000 $99,300,000,000 $13,000,000,000 District of Columbia
$334,000,000 4,970 $141,800,000 $7,300,000
Michigan N/A 74,049 $4,554,832,145 N/A New Mexico $5,591,991,000 76,756 $2,213,248,000 $137,131,457
Source: Various16 At present, initial reported figures regarding impacts associated with arts, culture, and entertainment industries may not be as specific and in depth as needed to compare directly to RESI’s analysis. For example, Arts and Economic Prosperity IV considered only the direct industry expenditures to determine the economic impacts, whereas RESI considers event-related spending and business openings and closings when determining the economic impacts. Additionally, definitions of the industry may vary—whether referred to as the “arts industry,” “cultural industry,” or “creative industry.” While there are limitations associated with comparing other research with RESI’s findings, this comparison can serve as a starting point for consideration. As more and more A&E districts and similar designations are created, more research and analysis regarding the specific economic impacts associated with such designations and/or programs will become available.
5.0 Conclusion The existence of cultural districts has a positive impact on the local economy. In the case of Maryland’s A&E districts, operations supported an estimated total of 6,000 jobs during FY 2014.
14 “U.S. Bureau of Economic Analysis and National Endowment for the Arts Release Preliminary Report on Impact of Arts and Culture on U.S. Economy,” National Endowment for the Arts. 15 Sources presented in the literature review mainly reported employment and other impact figures. RESI generally reports employment, state GDP, and wage impact figures. For more information regarding IMPLAN and its output, please refer to Appendix A. 16 For a full list of the references used, please refer to Section 6.0.
Maryland Arts and Entertainment Districts Impact Analysis FY 2014 RESI of Towson University
15
Approximately 1,211 of these jobs were generated by new businesses; the remaining 4,766 jobs were supported by visitor spending at events. In addition, nearly $571.4 million in total state GDP were supported by the A&E districts during the period—$136.9 million by new businesses and $434.4 million by visitor spending. Moreover, total wages of more than $198.5 million were supported by the A&E districts during the period. Approximately $50.1 million in wages were generated by new businesses and $148.4 million were supported by visitor spending at events. New businesses formed within the A&E districts’ boundaries during the study period generated nearly $7.9 million in state and local tax revenues.17 Visitor spending at events supported by the A&E districts supported more than $30.6 million in state and local tax revenues. The total tax revenue impact of the A&E districts came to approximately $38.5 million during the study period. As a result of approved property tax incentive applications, the total net property tax revenue for the average A&E district property would be less than the estimated generated property taxes provided when exemptions are taken into consideration.
17 Total tax revenues refer to property, income, sales, payroll, and other tax revenues supported on the state and local level.

Maryland Arts and Entertainment Districts Impact Analysis FY 2014 RESI of Towson University
16
6.0 References “2013 Otis Report on the Creative Economy.” Otis College of Art and Design. February 2014.
Accessed January 30, 2015. http://www.otis.edu/sites/default/files/2013-Otis_Report_on_the_Creative_Economy-2.pdf.
Agursa, Jerry. “Front Street, Lahaina Halloween Festival Economic Impact Report for 2007, 2008
& 2009.” Accessed August 18, 2011. http://www.northbeachmaui.org/pdf/Halloween_Impact_Study_final.pdf.
Americans for the Arts. “About Americans for the Arts.” Accessed January 31, 2014.
http://www.americansforthearts.org/about-americans-for-the-arts. Americans for the Arts. “Arts & Economic Prosperity IV: The Economic Impact of Nonprofit Arts
and Cultural Organizations and Their Audiences Summary Report.” May 14, 2012. Accessed January 28, 2013. http://www.artsusa.org/pdf/information_services/research/services/economic_impact/aepiv/AEP4_NationalSummaryReport.pdf.
Americans for the Arts. “Arts & Economic Prosperity IV: The Economic Impact of Nonprofit Arts
and Cultural Organizations and Their Audiences National Statistics Report.” Accessed May 14, 2012. http://www.americansforthearts.org/sites/default/files/pdf/information_services/research/services/economic_impact/aepiv/NationalStatisticalReport.pdf.
Americans for the Arts. “Reports and Data.” Accessed January 31, 2014.
http://www.americansforthearts.org/by-program/reports-and-dat. Anderson, Matthew S. and Scott Nagel. “Economic Impact of Fiesta San Antonio.” Birchhill
Enterprises, April 2007. Accessed August 16, 2011. http://www.fiesta-sa.org/wp-content/uploads/2010/09/fiesta-2007-economic-impact-report.pdf.
Ballantyne, Rachel. “The Economic Impact Study of the 2009 Durango Independent Film
Festival.” Fort Lewis College. Accessed August 18, 2011. http://www.fortlewis.edu/portals/157/docs/eis/EIS_DIFF_2009.pdf.
Bauer, Nathaniel, Brad Caldwell and Stephanie Waechter. “The Economic Impact on Dolores
Colorado Dolores River Festival.” Fort Lewis College. June 2011. Accessed May 14, 2012. http://www.fortlewis.edu/Portals/157/Docs/2011/Economic%20Impact%20of%20the%20Dolores%20River%20Festival%20-%20FINAL.pdf.
Maryland Arts and Entertainment Districts Impact Analysis FY 2014 RESI of Towson University
17
Boley, Bynum and Norma Nickerson. “Big Sky Documentary Film Study.” Institute for Tourism & Recreation Research, University of Montana. March 2009. Accessed May 14, 2012. http://scholarworks.umt.edu/cgi/viewcontent.cgi?article=1257&context=itrr_pubs.
California Department of Food and Agriculture. “California’s Fairs: Striking Gold at the Lodi
Grape Festival & Harvest Fair.” KPMG LLP Economic Consulting Services, 2003. Accessed August 16, 2011. http://www.cdfa.ca.gov/fe/Documents/Economic_Impact/2003_Reports/SJO/SJO_DetailedReport2003.pdf.
Callison, Trevor, Jeremiah Foose, Elias Pfeifer, Ryan Riebau, Elizabeth Stone, and Stephanie
Waechter. “The Economic Impact on La Plata County the Four Corners Motorcycle Rally.” Fort Lewis College. 2010. Accessed January 7, 2015. http://www.fortlewis.edu/Portals/157/Docs/2010/Motorcycle%20Rally%20-%202010.pdf.
Carter, Rachel and Al Myles. “Economic Impact of the 32nd Annual Peter Anderson Arts and
Crafts Festival, Ocean Springs, Mississippi.” Mississippi State University Extension Service. Accessed May 14, 2012. http://ageconsearch.umn.edu/bitstream/119050/2/Peter%20Anderson_7_25_2011.pdf.
Carter, Rachel D. and Jeannie W. Zieren. “Measuring the Economic Impact of Special Events.”
Main Street Now. May/June 2012. Accessed May 14, 2012. http://mrsc.org/getmedia/9DB6D033-A676-4E99-B92F-4AE4A957AF22/m58festivals.aspx.
Cela, Ariana and Sam Lankford. “A Study of Place Based Food Tourism in Northeast Iowa
Communities.” Sustainable Tourism and Environment Program, University of Northern Iowa. 2005. Accessed August 16, 2011. http://www.uni.edu/step/reports/place_based_food.pdf.
Cici, Kristen. “Twin Cities Pride Festival & Parade Attendee Profile.” Center for Urban and
Regional Affairs, University of Minnesota. 2010. Accessed August 16, 2011. http://www.cura.umn.edu/sites/cura.advantagelabs.com/files/publications/NPCR-1319.pdf.
“Creative Economy Strategy.” District of Columbia. Accessed January 30, 2014.
http://dmped.dc.gov/sites/default/files/dc/sites/dmped/publication/attachments/Creative%20Economy%20Strategy%20of%20the%20District%20of%20Columbia%20Full%20Report_0626.pdf.
Maryland Arts and Entertainment Districts Impact Analysis FY 2014 RESI of Towson University
18
Daniels, Jessica. “An Analysis of the Economic Impact of Ithaca's Light in Winter Festival.” Cornell University. August 2007. Accessed August 16, 2011. https://www.sri.cornell.edu/sri/projects.project.cfm?projid=123401.
“Economic Impacts and Visitor Profile Sisters Folk Festival.” Dean Runyon Associates. November
2014. Accessed January 7, 2015. https://www.sistersfolkfestival.org/wp-content/uploads/2013/12/Economic-Impact-Study-November-2014.pdf.
“The Economic Impact of the Farm Show Complex & Expo Center, Harrisburg.” Penn State
Center for Economic & Community Study. Accessed January 7, 2015. http://aese.psu.edu/research/centers/cecd/publications/economic-impact/economic-impact-of-farm-show-complex-expo-center-harrisburg.
“Economic Impact Study: Electric Daisy Carnival Las Vegas 2011.” Beacon Economics. November
2011. Accessed January 28, 2013. http://insomniac.com/reports/EDC_Las_Vegas_2011.pdf.
Forward Analytics, Inc. “Audience Research and Economic Impact Study Albuquerque
International Balloon Fiesta.” 2009. Accessed January 28, 2013. http://www.balloonfiesta.com/uploads/pdfs/2009%20Economic%20Impact%20Study.pdf.
Forward Analytics, Inc. “Audience Research and Economic Impact Study of Artscape 2009:
America’s Largest Free Arts Festival.” November 30, 2009. Accessed August 16, 2011. http://www.artscape.org/artscape/uploads/File/Audience_Research_and_Economic_Impact_Study_ARTSCAPE_09.pdf.
Forward Analytics, Inc. “Baltimore Book Festival.” Accessed January 7, 2015.
https://www.baltimorebookfestival.com/baltimorebookfestival/uploads/File/2012Report_ForwardAnalytics.pdf
Halebie, Maya, Gregory L. Hamilton, and Alison Wiley. “Riverfest 2009 Survey Findings and
Economic Impact Study.” Institute for Economic Advancement, University of Arkansas at Little Rock. 2009. Accessed January 28, 2013. http://www.iea.ualr.edu/pubs/2009/09-10%20Riverfest%20Report.pdf.
Hill, Steven, Ashley M. Hooper, Gillian Joyce, and Jeffrey Mitchell. “Building on the Past, Facing
the Future: Renewing the Creative Economy of New Mexico.” University of New Mexico Bureau of Business & Economic Research. 2014. Accessed January 30, 2015. http://www.newmexicoculture.org/impact/.
Maryland Arts and Entertainment Districts Impact Analysis FY 2014 RESI of Towson University
19
Holloway, Herb, Abul Jamal, and William Joubert. “Estimated Economic Impact of the 2013 Bogalusa Blues & Heritage Festival on Washington Parish. November 2013. Accessed January 7, 2015. https://www.southeastern.edu/admin/sbrc/publications/economic_reporter_pd/BogBH2013.pdf.
Hoogasian, Alan, David W. Marcouiller, and Tedi Winnett. “A Country Music Festival and its
Local Community Economic Impacts: the Case Study of Country Thunder 2012 and Kenosha County, Wisconsin.” Department of Urban and Regional Planning, University of Wisconsin. February 11, 2013. Accessed January 7, 2015. http://urpl.wisc.edu/people/marcouiller/publications/13countrythunder.pdf.
“Impact: Arts & Culture Enriching Arizona Lives & Economies.” Arizona Cultural Data Project.
2013. Accessed January 30, 2015. http://www.azarts.gov/wp-content/uploads/2013/02/Impact_Arts-and-Culture-in-Arizona_12-March-2013.pdf.
Jefferson Convention & Visitors Bureau and the University of New Orleans. “The Economic
Impact of Family Gras Weekend in Jefferson Parish 2011.” April 2011. Accessed August 16, 2011. http://media.nola.com/mardigras_impact/other/2011%20Economic%20Impact%20Summary.pdf.
“Michigan 2014 Creative Industries Report.” Creative State. 2014. Accessed January 30, 2015.
http://www.creativemany.org/wp-content/uploads/2014/09/Creative-State-Michigan-2014-Creative-Industries-Report-20140127-E.pdf.
Nagel, Scott. “Economic Impact of Main St. Fort Worth Arts Festival.” Birchhill Enterprises. April
2006. Accessed January 28, 2013. http://www.praguefringe.com/2007/data/FortWorthArtsEconStudy06.pdf.
National Assembly of State Arts Agencies. “State Arts Agency Creative Economy Initiates.”
Accessed January 31, 2014. http://www.nasaa-arts.org/Research/Key-Topics/Creative-Economic-Development/State-Arts-Agency-Creative-Economy-Initiatives.php.
National Assembly of State Arts Agencies. “State Policy Briefs: Tools for Arts Decision Making.”
2012. Accessed January 31, 2014. http://www.nasaa-arts.org/Research/Key-Topics/Creative-Economic-Development/StateCulturalDistrictsPolicyBrief.pdf.
Nelson, Arthur C. Planner’s Estimating Guide: Projecting Land-use and Facility Needs. Chicago:
APA Planners Press, 2004.
Maryland Arts and Entertainment Districts Impact Analysis FY 2014 RESI of Towson University
20
“Oregon Brewers Fest Economic Impact.” Oregon Craft Beer. September 23, 2014. Accessed January 7, 2015. http://oregoncraftbeer.org/oregon-brewers-fest-economic-impact-numbers/.
Pennsylvania Horticultural Society, The. “Economic Impact Analysis for the 2010 and 2011
Philadelphia International Flower Shows.” February 7, 2011. Accessed August 19, 2011. http://www.theflowershow.com/ShowInfo/2011press/EconomicImpact.pdf.
Robbers Cave Fall Festival. “Robbers Cave Fall Festival 2010 Economic Impact.” Wilburton
Chamber of Commerce, May 2011. Accessed August 2011. http://robberscavefallfestival.com/economic_impact.pdf.
Sabrier, Marianne Hawkins and Jimmy Valdiviezo. “Bayou Boogaloo Festival 2011 Visitor Survey
Results.” The University of New Orleans Hospitality Research Center. July 2011. Accessed August 16, 2011. http://mothershipfoundation.files.wordpress.com/2011/11/economicdevelopmentreport1.pdf.
Schneider, Ingrid and Andrew Oftedal. “Irish Fair of Minnesota Profile of Attendees 2011.”
University of Minnesota Tourism Center. 2011. Accessed January 7, 2015. http://www.tourism.umn.edu/prod/groups/cfans/@pub/@cfans/@tourism/documents/asset/cfans_asset_357328.pdf.
Stambro, Jan Elise. “The Economic Impacts of the 2013 Sundance Film Festival Held in Utah
from January 17, 2013 to January 27, 2013.” Bureau of Economic and Business Research, University of Utah. April 2013. Accessed January 7, 2015. http://www.sundance.org/pdf/press-releases/Economic_Activity_Report_Sundance_Film_Festival_2013.pdf.
University of Northern Iowa Sustainable Tourism and the Environment Program. “Economic
Impact and Visitor Study of the Eugene International Film Festival.” December 2007. Accessed August 16, 2011. http://www.uni.edu/step/reports/eugene_film_festival.pdf.
“U.S. Bureau of Economic Analysis and National Endowment for the Arts Release Preliminary
Report on Impact of Arts and Culture on U.S. Economy.” National Endowment for the Arts. December 5, 2013. Accessed January 30, 2015. http://arts.gov/news/2013/us-bureau-economic-analysis-and-national-endowment-arts-release-preliminary-report-impact#sthash.AumRPyaS.dpuf.
Maryland Arts and Entertainment Districts Impact Analysis FY 2014 RESI of Towson University
21
Warnick, Rodney B., David C. Bojanic, Atul Sheel, Apurv Mather, and Deepak Ninan. “Economic Impact and Market Analysis of a Special Event: The Great New England Air Show.” Proceedings of the 2009 Northeastern Recreation Research Symposium. July 2010. Accessed August 16, 2011. http://www.nrs.fs.fed.us/pubs/gtr/gtr-nrs-p-66papers/35-warnick-p-66.pdf.
Maryland Arts and Entertainment Districts Impact Analysis FY 2014 RESI of Towson University
22
Appendix A—Methodology A.1 IMPLAN Model Overview To quantify the economic and fiscal impacts of the A&E districts on Maryland, RESI utilized the IMPLAN input/output model. This model enumerates the employment and fiscal impact of each dollar earned and spent by the following: employees of the district, other supporting vendors (business services, retail, etc.), each dollar spent by these vendors on other firms and each dollar spent by the households’ employees, other vendors' employees, and other businesses' employees. Economists measure three types of economic impacts: direct, indirect, and induced impacts. The direct economic effects are generated as the districts create jobs and hires workers to support the district activities. The indirect economic impacts occur as the vendors purchase goods and services from other firms. In either case the increases in employment generate an increase in household income, as new job opportunities are created and income levels rise. This drives the induced economic impacts that result from households increasing their purchases at local businesses. Consider the following example. A new firm opens in a region and directly employs 100 workers. The firm purchases supplies, both from outside the region as well as from local suppliers, which leads to increased business for local firms, thereby hypothetically creating jobs for another 100 workers. This is called the indirect effect. The workers at the firm and at suppliers spend their income mostly in the local area, hypothetically creating jobs for another 50 workers. This is the induced effect. The direct, indirect and induced effects add up to 250 jobs created from the original 100 jobs. Thus, in terms of employment, the total economic impact of the firm in our example is 250.18 A.2 Input Assumptions The project team extracted all useable data from A&E district application materials, annual reports, and relevant county tax ordinances. In addition, RESI made assumptions regarding A&E district operations where actual data were not available. Economic impacts were determined based on two main factors: (1) estimated new direct employment occurring after A&E district designation as the attraction of new firms could primarily be attributed to the designation and (2) estimated spending at events for which attendance was provided. For the most part, this information was provided by the A&E districts. However, in some cases, these data were not provided in the annual reports. RESI researched figures for square footage per employee and spending for different event types from past studies to estimate these inputs.
18 Total economic impact is defined as the sum of direct, indirect, and induced effects.
Maryland Arts and Entertainment Districts Impact Analysis FY 2014 RESI of Towson University
23
In cases of missing building data, RESI used proxy estimators in regard to size of businesses and commercial real estate based on application data. Historical buildings at times may be exempt from zoning restrictions due to size or being “grandfathered” into clauses in current legislation. The project team used average square footage as some businesses have a larger space than those that have originated in the last 20 to 30 years. The project team then used these square footage estimates and applied them to research regarding average square footage per employee to determine estimated direct employment where the data were not provided. Square footage, when reported by A&E districts, refers to the enclosed square footage of the buildings in the A&E districts. In cases where square footage was not reported, gross square footage was calculated from property records. Using floor area ratio (FAR) estimates based on the population of an area, the project team calculated the maximum enclosed square footage possible. Enclosed square footage for districts missing this data was defined as gross square footage multiplied by FAR estimates.19 To determine event spending inputs, RESI researched comparable events and the associated visitor spending figures and attendance to determine percentage spending levels for hotels, transportation, food and beverage, retail, entertainment, and other spending. Where districts did not provide attendance levels for events, attendance was estimated. In these cases, event attendance was estimated based on average attendance for similar events. A summary of the findings from RESI’s literature review can be found in Figure 7.
19 Nelson, Arthur C. Planner’s Estimating Guide: Projecting Land-use and Facility Needs. Chicago: American Planning Association, 2004. Print.

Maryland Arts and Entertainment Districts Impact Analysis FY 2014 RESI of Towson University
24
Figure 7: Event Spending Data Summary20
Events Hotels Transportation Food and Beverage
Retail Entertainment Other Total
Spending Total
Attendance
Community 2011 Dolores River Festival (CO) $935 $8,121 $36,957 $13,995 N/A n/a $40,400,000 2,225 2011 Family Gras Weekend in Jefferson Parish (LA)
$892,516 $91,708 $2,741,058 $656,871 $2,191,123 N/A $6,573,276 85,000
2010 Robbers Cave Fall Festival (OK)
$152,600 $536,300 $505,400 $1,083,600 $123,200 $35,000 $2,436,100 70,000
2010 Market Street Festival in Ocean Springs (MS)
$2,182,532 $1,899,124 $6,003,997 $2,388,666 $2,309,157 N/A $14,783,475 34,000
Average $19.32 $17.06 $58.17 $24.94 $31.82 $0.50 Culture
2011 Irish Fair (MN) $305,820 $523,800 $2,798,660 $1,193,010 N/A $154,380 $4,975,670
100,000 2011 Bayou Boogaloo Festival (LA)
$150,413 $47,070 $285,080 $62,808 $197,934 N/A $743,305 27,000
2010 Twin Cities Pride Festival & Parade (MN)
$4,488,242 $1,037,402 $10,374,925 $2,297,011 $1,267,616 $2,285,680 $21,750,875 400,000
2009 Albuquerque Balloon Fiesta (NM)
$36,679,120 $11,745,796 $23,272,837 $21,731,943 $10,638,712 $2,082,327 $106,150,735 761,864
Average $17.00 $6.25 $23.76 $12.13 $8.15 $3.33 Film 2013 Sundance Film Festival (UT) $24,232,762 $4,561,026 $16,020,042 $7,583,367 $4,328,889 n/a $56,726,086 45,947 2009 Durango Film Fest (CO) $7,921 $3,993 $19,064 $5,545 N/A $1,792 $38,315 425 2009 Big Sky Documentary Film Festival (MT)
$2,167,340 $216,734 $11,582,802 $464,156 $186,046 $310,716 $14,927,794 9,590
2007 Eugene International Film Festival (IA)
$190,368 $11,340 $80,220 $61,320 $57,540 $22,680 $423,468 32,457
Average $194.48 $32.90 $400.95 $57.10 $28.85 $12.44 Fine Art 2010 Columbus Arts Festival (OH) $1,564,500 $675,500 $4,564,000 $2,569,000 N/A $612,500 $9,985,500 350,000 2010 Peter Anderson (MS) $3,744,387 $1,270,196 $2,735,131 $9,224,279 n/a $5,691,227 $14,783,475 104,562 2009 Artscape (MD) $275,699 $1,300,406 $2,370,143 $1,738,376 $1,334,380 N/A $7,019,004 350,000
20 “Average” refers to the average weighted spending per capita for each spending category.

Maryland Arts and Entertainment Districts Impact Analysis FY 2014 RESI of Towson University
25
Events Hotels Transportation Food and Beverage
Retail Entertainment Other Total
Spending Total
Attendance
2006 Fort Worth Arts Festival (TX)
$665,047 $2,181,367 $901,356 $139,391 $45,995 $109,991 $4,043,147 198,811
Average $11.10 $7.19 $12.63 $25.31 $2.02 $18.91 Food 2014 Brewers Fest (OR) $9,100,000 n/a $8,200,000 n/a n/a n/a $17,300,000 25,668 2007 Fiesta Oyster Bake (TX) $519,181 $541,622 $2,245,156 $163,114 $8,642 $171,938 $3,649,653 52,189 2005 Food Festivals (IA) $589,514 $227,027 $579,703 $270,402 N/A N/A $1,666,645 22,806 2003 Lodi Grape Festival & Harvest Fair (CA)
$1,928,321 $164,428 N/A $1,305,689 $3,204,549 $1,328,723 $7,931,710 173,850
Average $15.63 $7.09 $129.30 $7.50 $9.30 $5.47 Holiday 2012 Christmas Craft and Gift Show (PA)
$104,912 $107,571 $197,532 $205,636 n/a $8,837 $624,488 24,710
2009 Lahaina Halloween Festival (HI)
$855,258 n/a $283,419 $398,411 n/a n/a $1,537,088 5,264
2009 Riverfest (AR) $30,026,653 $13,284,169 $43,249,399 $17,896,496 $13,142,710 $6,784,475 $124,383,902 186,131 2007 Light in Winter Festival (NY) $26,055 $12,711 $18,564 $38,319 $6,384 N/A $102,033 3,000 Average $84.18 $2.86 $75.10 $48.23 $1.06 $0.18 Performing Arts 2014 Sisters Folk Festival (OR) $211,000 $118,000 $351,000 $121,000 $414,000 N/A $1,215,000 3,676 2013 Bogalusa Blues & Heritage Festival (LA)
$40,600 $81,300 $189,750 $34,400 n/a $169,600 $515,650 5,000
2012 Country Thunder music festival (WI)
$1,029,718 $1,824,674 $2,289,572 $571,649 n/a n/a $5,715,613 30,879
2011 Electric Daisy Festival Las Vegas (NV)
$1,000,232 $542,726 $865,634 $371,754 $477,949 $400,075 $3,658,370 12,000
Average $45.55 $38.17 $69.93 $22.32 $76.23 $33.63 Other 2012 Baltimore Book Festival (MD)
$211,200 $201,800 $572,800 $220,800 $95,900 N/A $1,302,500 47,000
2010 Four Corners Motorcycle Rally (CO)
$509,220 $485,100 $996,480 $559,980 $350,460 N/A $2,901,240 18,000
2010 Philadelphia International Flower Show (PA)
$2,929,687 $1,401,099 $6,374,807 N/A N/A $8,092,861 $18,798,454 231,924

Maryland Arts and Entertainment Districts Impact Analysis FY 2014 RESI of Towson University
26
Events Hotels Transportation Food and Beverage
Retail Entertainment Other Total
Spending Total
Attendance
2009 The Great New England Air Show (MA)
$1,121,936 $2,239,297 $3,481,114 $1,714,018 $192,175 $219,628 $8,968,168 345,000
Average $12.17 $10.94 $26.28 $13.59 $7.36 $17.77
Sources: Various21
21 For a full list of the references used, please refer to Section 6.0.
Maryland Arts and Entertainment Districts Impact Analysis FY 2014 RESI of Towson University
27
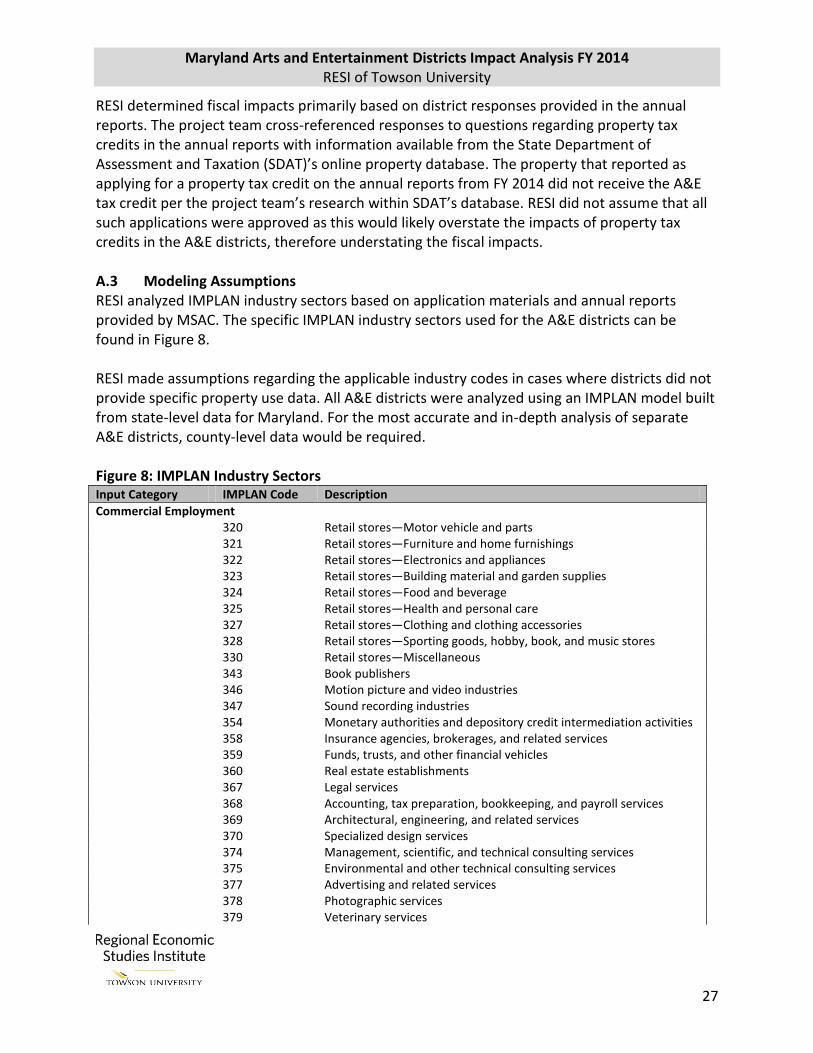
RESI determined fiscal impacts primarily based on district responses provided in the annual reports. The project team cross-referenced responses to questions regarding property tax credits in the annual reports with information available from the State Department of Assessment and Taxation (SDAT)’s online property database. The property that reported as applying for a property tax credit on the annual reports from FY 2014 did not receive the A&E tax credit per the project team’s research within SDAT’s database. RESI did not assume that all such applications were approved as this would likely overstate the impacts of property tax credits in the A&E districts, therefore understating the fiscal impacts. A.3 Modeling Assumptions RESI analyzed IMPLAN industry sectors based on application materials and annual reports provided by MSAC. The specific IMPLAN industry sectors used for the A&E districts can be found in Figure 8. RESI made assumptions regarding the applicable industry codes in cases where districts did not provide specific property use data. All A&E districts were analyzed using an IMPLAN model built from state-level data for Maryland. For the most accurate and in-depth analysis of separate A&E districts, county-level data would be required. Figure 8: IMPLAN Industry Sectors Input Category IMPLAN Code Description
Commercial Employment 320 Retail stores—Motor vehicle and parts
321 Retail stores—Furniture and home furnishings 322 Retail stores—Electronics and appliances 323 Retail stores—Building material and garden supplies 324 Retail stores—Food and beverage 325 Retail stores—Health and personal care 327 Retail stores—Clothing and clothing accessories 328 Retail stores—Sporting goods, hobby, book, and music stores 330 Retail stores—Miscellaneous 343 Book publishers 346 Motion picture and video industries 347 Sound recording industries 354 Monetary authorities and depository credit intermediation activities 358 Insurance agencies, brokerages, and related services 359 Funds, trusts, and other financial vehicles 360 Real estate establishments 367 Legal services 368 Accounting, tax preparation, bookkeeping, and payroll services 369 Architectural, engineering, and related services 370 Specialized design services 374 Management, scientific, and technical consulting services 375 Environmental and other technical consulting services 377 Advertising and related services 378 Photographic services 379 Veterinary services
Maryland Arts and Entertainment Districts Impact Analysis FY 2014 RESI of Towson University
28
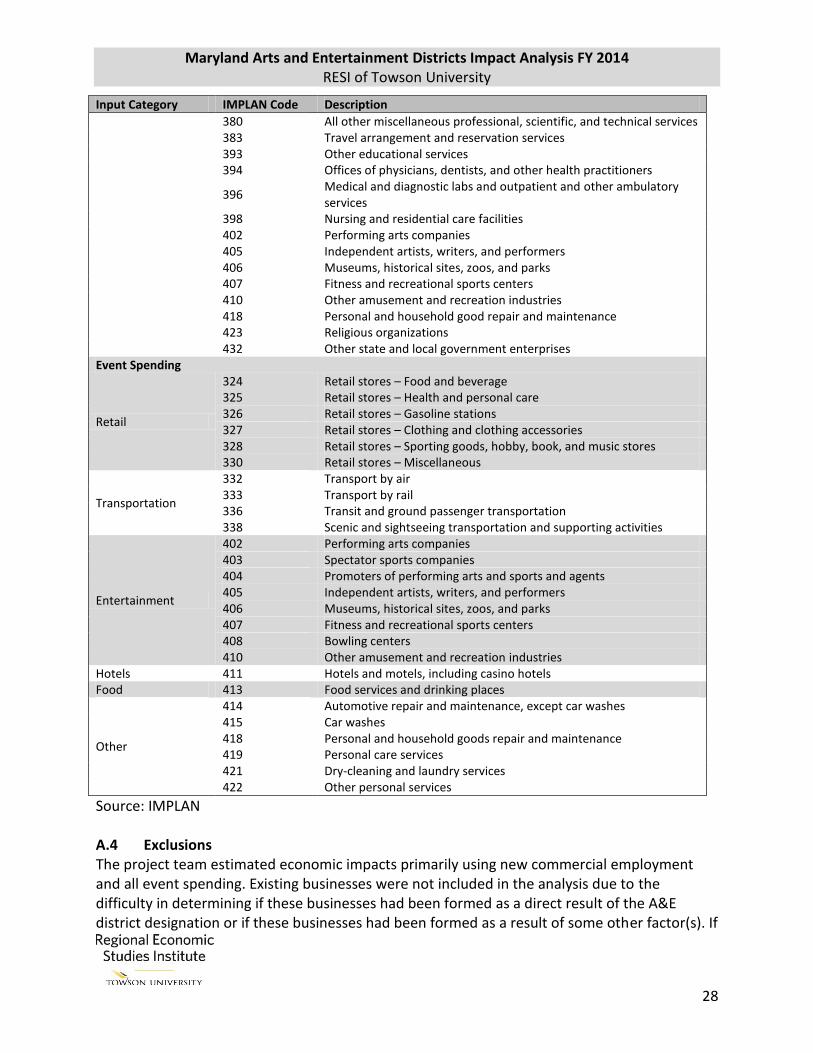
Input Category IMPLAN Code Description
380 All other miscellaneous professional, scientific, and technical services 383 Travel arrangement and reservation services 393 Other educational services 394 Offices of physicians, dentists, and other health practitioners
396 Medical and diagnostic labs and outpatient and other ambulatory services
398 Nursing and residential care facilities 402 Performing arts companies 405 Independent artists, writers, and performers 406 Museums, historical sites, zoos, and parks 407 Fitness and recreational sports centers 410 Other amusement and recreation industries 418 Personal and household good repair and maintenance 423 Religious organizations 432 Other state and local government enterprises
Event Spending
Retail
324 Retail stores – Food and beverage 325 Retail stores – Health and personal care 326 Retail stores – Gasoline stations 327 Retail stores – Clothing and clothing accessories 328 Retail stores – Sporting goods, hobby, book, and music stores 330 Retail stores – Miscellaneous
Transportation
332 Transport by air 333 Transport by rail 336 Transit and ground passenger transportation 338 Scenic and sightseeing transportation and supporting activities
Entertainment
402 Performing arts companies 403 Spectator sports companies 404 Promoters of performing arts and sports and agents 405 Independent artists, writers, and performers 406 Museums, historical sites, zoos, and parks 407 Fitness and recreational sports centers 408 Bowling centers 410 Other amusement and recreation industries
Hotels 411 Hotels and motels, including casino hotels Food 413 Food services and drinking places
Other
414 Automotive repair and maintenance, except car washes 415 Car washes 418 Personal and household goods repair and maintenance 419 Personal care services 421 Dry-cleaning and laundry services 422 Other personal services
Source: IMPLAN A.4 Exclusions The project team estimated economic impacts primarily using new commercial employment and all event spending. Existing businesses were not included in the analysis due to the difficulty in determining if these businesses had been formed as a direct result of the A&E district designation or if these businesses had been formed as a result of some other factor(s). If

Maryland Arts and Entertainment Districts Impact Analysis FY 2014 RESI of Towson University
29
the analysis included the impacts of businesses falling under the latter case, the findings would likely be overstated. Due to the difficulty in determining if A&E district enterprises had been formed as a direct result of the A&E district designation or if these businesses had been formed as a result of some other factor(s), attendance data for A&E district enterprises was excluded. To avoid overstating the impact of property tax exemptions and therefore understating the fiscal impacts of the A&E districts, RESI excluded property tax exemptions, as no applications were shown to be approved when cross-referenced with SDAT’s database. Other A&E district operations that would contribute to positive economic impact were excluded in the analysis due to data gaps. Such factors include the new art sales for artists and galleries, ticket/entry expenditures for arts enterprises, rental income from artists’ space, and awarded grants. These were not included in the analysis for a variety of reasons including but not limited to lack of data. Due to the limitations in this study, RESI recommends that MSAC consider the following for the next designation period:
Require uniform building inventories, including address, zoning type, square footage, land area, last sale date, last sale value, assessment value, age of building, and other pertinent details.
Require detailed building data for new businesses in annual reports.
Require detailed employment data for new and closing businesses in annual report.
Require detailed enterprise and event data, including name, address, attendance, and ticket sales (where applicable), in annual reports.
A.5 Limitations of the Data Provided A&E districts are expected to complete annual reports to provide information regarding goals, accomplishments, new establishments, events and promotions, attendance figures, and awards and grants for the fiscal year. These reports were provided by MSAC and cover FY 2014. All A&E districts submitted reports for this period. While each A&E district received identically formatted questions, not all reports were completed in the same way. For instance, all of the A&E districts did not provide a response for every question. In most cases, these differences did not require RESI to make additional assumptions. The use of an updated, standardized survey tool would help in improving uniformity of responses across A&E districts, allowing for increased analytical precision.

Maryland Arts and Entertainment Districts Impact Analysis FY 2014 RESI of Towson University
30
Appendix B—Glossary A glossary of economic and fiscal impact terminology frequently used throughout this report can be found in Figure 9. Figure 9: Glossary of Terms
Term Definition
Economic Impact This term refers to the changes in the economy resulting from an event. RESI typically reports employment, state GDP/output, and wage impacts.
Employment This term refers to the number of new full-time equivalent (FTE) jobs created as a result of district activity which has been modeled in IMPLAN.
Fiscal Impact This term refers to the change in tax revenues resulting from an event. RESI typically reports state and local tax revenues, which are combined in IMPLAN.
IMPLAN This term refers to the input/output modeling software used to model changes in the economy in a particular region. The user builds a model based on prepackaged economic data from IMPLAN (typically at the state or county level), then enters input figures—an industry change of employment or sales, a household change of income, and/or several other input types—for the industry sectors expected to be impacted as a “scenario.” IMPLAN runs the scenario created in the model and produces the economic and fiscal outputs.
New Businesses This term refers to all of the businesses which were newly created within an A&E district during the study period according to data provided in the A&E district annual reports. These businesses may include both for-profit and nonprofit entities. The number of for-profit and nonprofit businesses cannot be precisely determined from the data provided.
Output This term refers to the economic activity created as a result of district activity which has been modeled in IMPLAN. It is synonymous with “state GDP.” In other words, it is the market value of all goods and services produced by the economy of the region being modeled.
State GDP This term refers to the change in market value of all goods and services produced by the economy of the region which has been modeled in IMPLAN. It is synonymous with “output.”
Wage Impact This term refers to the change in employee compensation (including all salaries and wages) associated with the job and state GDP/output creation resulting from district activity which has been modeled in IMPLAN.
Source: RESI
Maryland Arts and Entertainment Districts Impact Analysis FY 2014 RESI of Towson University
31
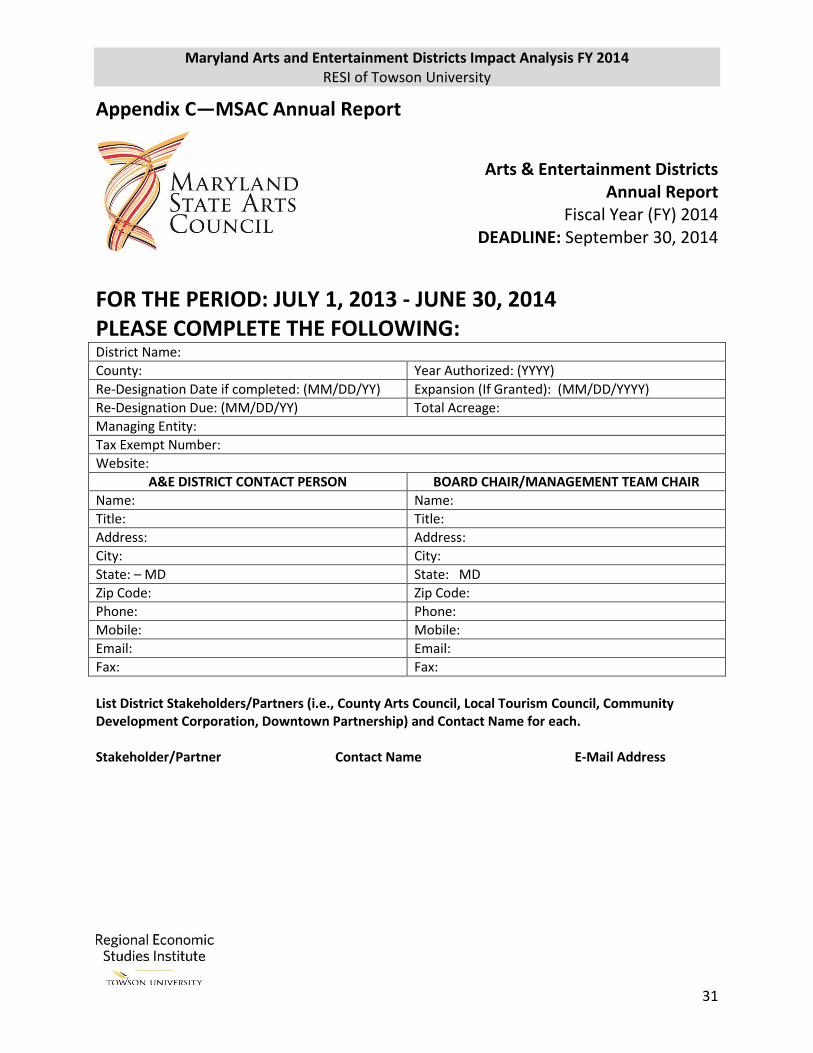
Appendix C—MSAC Annual Report
Arts & Entertainment Districts Annual Report
Fiscal Year (FY) 2014 DEADLINE: September 30, 2014
FOR THE PERIOD: JULY 1, 2013 - JUNE 30, 2014 PLEASE COMPLETE THE FOLLOWING: District Name:
County: Year Authorized: (YYYY)
Re-Designation Date if completed: (MM/DD/YY) Expansion (If Granted): (MM/DD/YYYY)
Re-Designation Due: (MM/DD/YY) Total Acreage:
Managing Entity:
Tax Exempt Number:
Website:
A&E DISTRICT CONTACT PERSON BOARD CHAIR/MANAGEMENT TEAM CHAIR
Name: Name:
Title: Title:
Address: Address:
City: City:
State: – MD State: MD
Zip Code: Zip Code:
Phone: Phone:
Mobile: Mobile:
Email: Email:
Fax: Fax:
List District Stakeholders/Partners (i.e., County Arts Council, Local Tourism Council, Community Development Corporation, Downtown Partnership) and Contact Name for each. Stakeholder/Partner Contact Name E-Mail Address

Maryland Arts and Entertainment Districts Impact Analysis FY 2014 RESI of Towson University
32
Please answer all questions adhering to word limits. SECTION I: DISTRICT ACCOMPLISHMENTS DURING FY 2014
In SECTION I, please identify only the new initiatives, events, festivals, projects, or enterprises during FY 2014.
Accomplishments may include, but are not limited to, new initiatives undertaken by district management (programming or administrative), new events, new festivals, new public art projects, new capital projects, new retailers, new businesses, new restaurants, and/or organizations newly located in the district.
A. Provide a narrative overview. (750 words or less) B. How many new initiatives were undertaken by district management during FY 2014? If none use
0. If yes, list each separately. (500 words or less)
C. How many new events occurred in the district during FY 2014? If none use 0. If yes, list each separately. Indicate which were arts events. (New events that are presented by organizations or enterprises other than the management of the A&E district should also be included but it must be a new public event. For example, ABC Arts Organization presents a new Halloween Lantern Parade that takes place in the district.)
D. How many new festivals occurred in the district during FY 2014? If none use 0. If yes, list each
separately. Indicate which were arts festivals. (New festivals that are presented by organizations or enterprises other than the management of the A&E district should also be included but it must be a new public festival. For example, ABC Community Organization presents a new holiday festival of trees that takes place in the district.)
E. How many new public art projects were initiated or completed in the district during FY 2014? If
none use 0. If yes, list the name/location of each separately and indicate if the project is complete. (New public art projects that are produced by organizations or enterprises other than the management of the A&E district should be included.)
F. How many new capital projects were initiated or completed in the district during FY 2014? If none use 0. If yes, list the name/address of each separately and indicate if the project is complete. (New capital projects that are undertaken by organizations or enterprises other than the management of the A&E district should also be included.)
G. How many new retailers opened in the district during FY 2014? If none use 0.
If yes, list each separately and indicate the number of full/part time jobs gained.
H. How many new businesses opened in the district during FY 2014? If none use 0. If yes, list each separately and indicate the number of full/part time jobs gained:
Maryland Arts and Entertainment Districts Impact Analysis FY 2014 RESI of Towson University
33
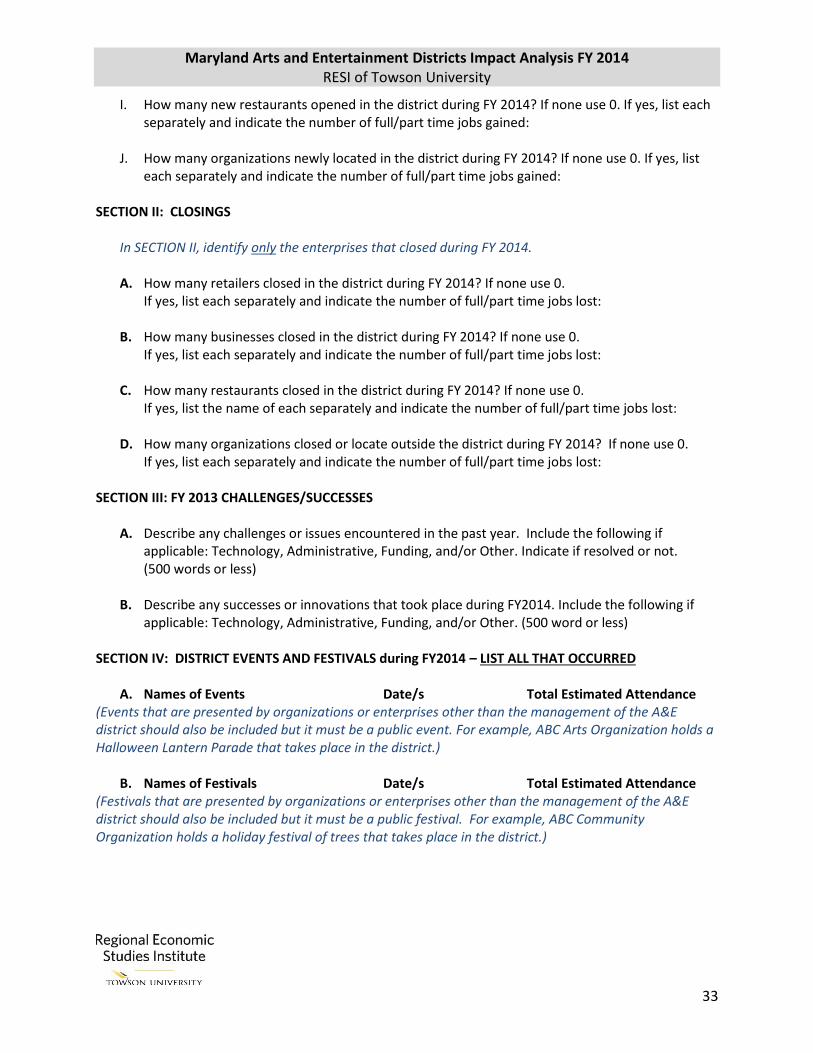
I. How many new restaurants opened in the district during FY 2014? If none use 0. If yes, list each separately and indicate the number of full/part time jobs gained:
J. How many organizations newly located in the district during FY 2014? If none use 0. If yes, list each separately and indicate the number of full/part time jobs gained:
SECTION II: CLOSINGS
In SECTION II, identify only the enterprises that closed during FY 2014. A. How many retailers closed in the district during FY 2014? If none use 0.
If yes, list each separately and indicate the number of full/part time jobs lost:
B. How many businesses closed in the district during FY 2014? If none use 0. If yes, list each separately and indicate the number of full/part time jobs lost:
C. How many restaurants closed in the district during FY 2014? If none use 0.
If yes, list the name of each separately and indicate the number of full/part time jobs lost:
D. How many organizations closed or locate outside the district during FY 2014? If none use 0. If yes, list each separately and indicate the number of full/part time jobs lost:
SECTION III: FY 2013 CHALLENGES/SUCCESSES
A. Describe any challenges or issues encountered in the past year. Include the following if applicable: Technology, Administrative, Funding, and/or Other. Indicate if resolved or not. (500 words or less)
B. Describe any successes or innovations that took place during FY2014. Include the following if
applicable: Technology, Administrative, Funding, and/or Other. (500 word or less)
SECTION IV: DISTRICT EVENTS AND FESTIVALS during FY2014 – LIST ALL THAT OCCURRED
A. Names of Events Date/s Total Estimated Attendance (Events that are presented by organizations or enterprises other than the management of the A&E district should also be included but it must be a public event. For example, ABC Arts Organization holds a Halloween Lantern Parade that takes place in the district.)
B. Names of Festivals Date/s Total Estimated Attendance (Festivals that are presented by organizations or enterprises other than the management of the A&E district should also be included but it must be a public festival. For example, ABC Community Organization holds a holiday festival of trees that takes place in the district.)
Maryland Arts and Entertainment Districts Impact Analysis FY 2014 RESI of Towson University
34
SECTION V: DISTRICT ASSETS
A. DISTRICT ARTS AND ENTERTAINMENT ENTERPRISES – LIST ALL For those organizations that perform, exhibit, or provide services outside of the district, only include attendance that occurs within the district under Total Estimated Annual Attendance. Type of Enterprise Names Total Annual Attendance of Each Number of Galleries/Co-ops: Number of Performance Venues: Number of Museums: Number of Arts Organizations: Number of Arts Education Organizations: Number of Public Art Pieces: Number of Art Suppliers/Services: Other:
B. ARTIST HOUSING Please list in this format: Name Number of Units Developer
C. OCCUPANCY RATE Mixed Use is defined as a combination of residential, commercial, industrial, office, institutional, or other land uses on the same site.
Estimate the Occupancy Rate for each during FY 2013:
Storefront/Commercial % N/A
Residential (live/work) % N/A
Industrial/Manufacturing % N/A
Mixed Use % N/A
Estimate the Occupancy Rate for each during FY 2014:
Storefront/Commercial % N/A
Residential (live/work) % N/A
Industrial/Manufacturing % N/A
Mixed Use % N/A
SECTION VI: DISTRICT BENEFIT INFORMATION
A. If the district maintains an artist registry, answer the following: What is the total number of registered artists working in the district? Of those, what is the total number of new artists registered in FY 2014? Estimate the number of artists working in the district that are not registered.

Maryland Arts and Entertainment Districts Impact Analysis FY 2014 RESI of Towson University
35
B. If the district does not maintain an artist registry, estimate the number of artists working in the district.
C. If the district has an artist relocation program, provide the number of artists relocating to the district during FY 2014 as a result of the program.
D. How many businesses in the district are eligible for an abatement of the Admission and
Amusement Tax? If applicable, list each:
E. How many property tax credits were applied for during FY 2014? If applicable, list each developer:
F. Other than the state tax incentives, list all additional incentives provided by city/county.
G. Communication tools: check all that apply.
Website
Media page
On-line events calendar
Artist registry
Other – specify: SECTION VII: PUBLIC FUNDING
A. Indicate any federal or national funding applications/awards/grants during FY 2014:
ENTITY
APPLICATION SUBMITTED
AWARD/GRANT AMOUNT
National Endowment for the Arts Yes $
National Trust for Historic Preservation Yes $
ArtPlace America Yes $
Other – Specify: Yes $

Maryland Arts and Entertainment Districts Impact Analysis FY 2014 RESI of Towson University
36
B. If a Maryland State Arts Council grant was awarded to the A&E District during FY 2014 identify the Program (for example, A&E Technical Assistance, GFO)and grant amount:
MSAC PROGRAM AWARD/GRANT
AMOUNT
$
$
$
C. Indicate any other state funding awards/grants to the A&E District during FY 2014:
ENTITY
APPLICATION SUBMITTED
AWARD/GRANT AMOUNT
Maryland Main Street Yes $
Heritage Areas Authority/Planning Yes $
Department of Transportation Yes $
Department of Planning Yes $
Capital Bond Yes $
Other – Specify: Yes $
Other – Specify: Yes $
D. Indicate any local awards/grants to the A&E District in FY 2014.
ENTITY AWARD/GRANT
AMOUNT
$
$
$
$
Maryland Arts and Entertainment Districts Impact Analysis FY 2014 RESI of Towson University
37
E. If your district receives operating support, indicate who provides the operating support and how much.
ENTITY
AMOUNT
$
$
F. If your district receives in-kind support, (for example, office space, administrative support) indicate who provides the in-kind support and the value.
ENTITY
AMOUNT
$
$
$
$
SECTION VIII: FY 2014 (JULY 1, 2014 – JUNE 30, 2014) GOALS AND WORK PLAN
A. Identify your district’s FY 2014 goals. (500 words or less)
B. Summarize your district’s FY 2014 work plan to achieve these goals. (500 words or less) SECTION IX: MSAC TECHNICAL ASSISTANCE
A. What type of technical assistance would serve to strengthen your A&E District? (500 words or less) E.g., Board Development, Financial Management, Fundraising, Funding Opportunities, Other
SECTION X. CERTIFICATION The A&E District Representative agrees to complete and submit this application by electronic means, including the use of an electronic signature.
Name
Title
Date
Checking this box verifies that the name typed above is authorized to sign this Maryland State Arts Council A&E Districts Annual Report on behalf of the A&E District and certifies that all information contained in this report is true and accurate to the best of the signatory’s knowledge. Checking this box

Maryland Arts and Entertainment Districts Impact Analysis FY 2014 RESI of Towson University
38
verifies that the applicant agrees to complete and submit this report by electronic means, including the use of an electronic signature.
Maryland Arts and Entertainment Districts Impact Analysis FY 2014 RESI of Towson University
39
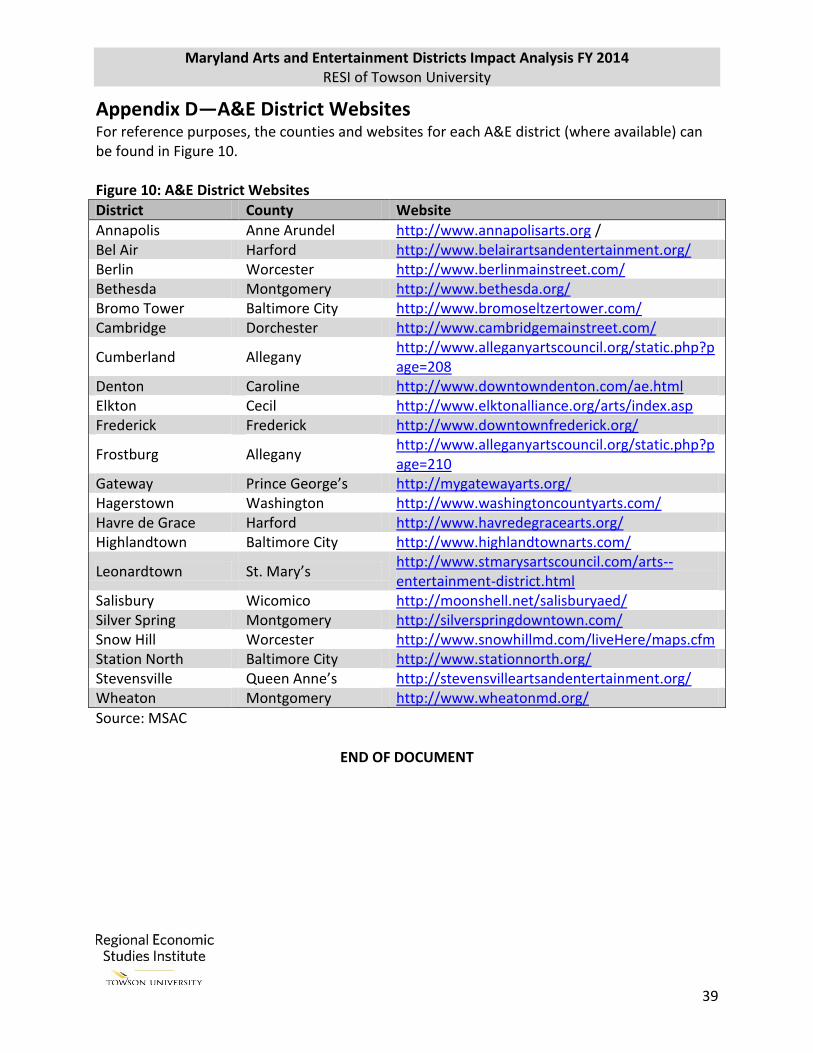
Appendix D—A&E District Websites For reference purposes, the counties and websites for each A&E district (where available) can be found in Figure 10. Figure 10: A&E District Websites
District County Website
Annapolis Anne Arundel http://www.annapolisarts.org / Bel Air Harford http://www.belairartsandentertainment.org/ Berlin Worcester http://www.berlinmainstreet.com/ Bethesda Montgomery http://www.bethesda.org/ Bromo Tower Baltimore City http://www.bromoseltzertower.com/ Cambridge Dorchester http://www.cambridgemainstreet.com/
Cumberland Allegany http://www.alleganyartscouncil.org/static.php?page=208
Denton Caroline http://www.downtowndenton.com/ae.html Elkton Cecil http://www.elktonalliance.org/arts/index.asp Frederick Frederick http://www.downtownfrederick.org/
Frostburg Allegany http://www.alleganyartscouncil.org/static.php?page=210
Gateway Prince George’s http://mygatewayarts.org/ Hagerstown Washington http://www.washingtoncountyarts.com/ Havre de Grace Harford http://www.havredegracearts.org/ Highlandtown Baltimore City http://www.highlandtownarts.com/
Leonardtown St. Mary’s http://www.stmarysartscouncil.com/arts--entertainment-district.html
Salisbury Wicomico http://moonshell.net/salisburyaed/ Silver Spring Montgomery http://silverspringdowntown.com/ Snow Hill Worcester http://www.snowhillmd.com/liveHere/maps.cfm Station North Baltimore City http://www.stationnorth.org/ Stevensville Queen Anne’s http://stevensvilleartsandentertainment.org/ Wheaton Montgomery http://www.wheatonmd.org/
Source: MSAC
END OF DOCUMENT