mars global reference atmospheric model 2000 version … · · 2013-08-30mars global reference...
TRANSCRIPT

NASA / TM--2000-210279
Mars Global Reference Atmospheric
Model 2000 Version (Mars-GRAM 2000):
Users Guide
C.G. Justus
Computer Sciences Corporation, Huntsville, Alabama
B.F. James
Marshall Space Flight Center, Marshall Space Flight Center, Alabama
May 2000
https://ntrs.nasa.gov/search.jsp?R=20000070728 2018-06-16T10:57:32+00:00Z

The NASA STI Program Office...in Profile
Since its founding, NASA has been dedicated to
the advancement of aeronautics and spacescience. The NASA Scientific and Technical
Information (STI) Program Office plays a key
part in helping NASA maintain this importantrole.
The NASA STI Program Office is operated byLangley Research Center, the lead center forNASA's scientific and technical information. The
NASA STI Program Office provides access to the
NASA STI Database, the largest collection of
aeronautical and space science STI in the world. TheProgram Office is also NASA's institutional
mechanism for disseminating the results of its
research and development activities. These results
are published by NASA in the NASA STI Report
Series, which includes the following report types:
TECHNICAL PUBLICATION. Reports of
completed research or a major significant phase
of research that present the results of NASAprograms and include extensive data or
theoretical analysis. Includes compilations ofsignificant scientific and technical data and
information deemed to be of continuing reference
value. NASA's counterpart of peer-reviewed
formal professional papers but has less stringent
limitations on manuscript length and extent ofgraphic presentations.
TECHNICAL MEMORANDUM. Scientific and
technical findings that are preliminary or of
specialized interest, e.g., quick release reports,
working papers, and bibliographies that containminimal annotation. Does not contain extensive
analysis.
CONTRACTOR REPORT. Scientific and
technical findings by NASA-sponsored
contractors and grantees.
CONFERENCE PUBLICATION. Collected
papers from scientific and technical conferences,
symposia, seminars, or other meetings sponsoredor cosponsored by NASA.
SPECIAL PUBLICATION. Scientific, technical,
or historical information from NASA programs,projects, and mission, often concerned with
subjects having substantial public interest.
TECHNICAL TRANSLATION.
English-language translations of foreign scientificand technical material pertinent to NASA'smission.
Specialized services that complement the STI
Program Office's diverse offerings include creatingcustom thesauri, building customized databases,
organizing and publishing research results...even
providing videos.
For more information about the NASA STI ProgramOffice, see the following:
• Access the NASA STI Program Home Page athttp ://www.sti.nasa.gov
• E-mail your question via the Internet [email protected]
• Fax your question to the NASA Access HelpDesk at (301) 621-0134
• Telephone the NASA Access Help Desk at (301)621-0390
Write to:
NASA Access Help Desk
NASA Center for AeroSpace Information7121 Standard Drive
Hanover, MD 21076-1320
7.
E
|w.
|m
,ira
mE
P_
_=
z
iE

NASA / TM_2000-210279
Mars Global Reference AtmosphericModel 2000 Version (Mars-GRAM 2000):Users Guide
C. G. Justus
Computer Sciences Corporation, Huntsville, Alabama
B.F. James
Marshall Space Flight Center, Marshall Space Flight Center, Alabama
National Aeronautics and
Space Administration
Marshall Space Flight Center • MSFC, Alabama 35812
I
May 2000

Acknowledgments
The authors thank James Campbell, NASA Jet Propulsion Laboratory, for support provided through the Mars Characteriza-tion for Future Missions Program. We gratefully acknowledge Dr. R.M. Haberle and Jim Schaefer, NASA Ames Research
Center, for assistance in running their Mars General Circulation Model (MGCM), Dr. S.W. Bougher and Steffi Engel,
University of Arizona, for model runs and special analysis of their Mars Thermospheric General Circulation Model
(MTGCM), and to Dr. A.EC. Bridger, San Jose State University, and Dr. J.R. Murphy, New Mexico State University, for
special post-processing and analysis with the NASA Ames MGCM. We also express thanks to the National Science Founda-
tion and the National Center for Atmospheric Research for supercomputing facilities support to the University of Arizona for
running MTGCM. Special thanks also go to Belinda Hardin, Computer Sciences Corporation, for her expert assistance in
preparing this report and to Margaret Alexander, MSFC Environments Group, for skillfully editing the draft.
Available from:
NASA Center for AeroSpace Information7121 Standard Drive
Hanover, MD 21076-1320
(301 ) 621-0390
National Technical Information Service
5285 Port Royal Road
Springfield, VA 22161
(703) 487-4650
ii
PREFACE
These improvements to the NASA/MSFC Mars Global Reference Atmospheric Model
(Mars-GRAM 2000) were sponsored by the Environments Group, Engineering Systems
Department, Engineering Directorate of the NASA Marshall Space Flight Center.
For those unfamiliar with earlier versions of Mars-GRAM, NASA Technical
Memorandum 108509 "Mars Global Reference Atmospheric Model (Mars-GRAM 3.34)
Programmer's Guide", and NASA TM 108513 "A Revised Thermosphere for the Mars Global
Reference Atmospheric Model (Mars-GRAM Version 3.4)" and NASA/TM-I999-209629 "Mars
Global Reference Atmospheric Model (Mars-GRAM) Version 3.8: Users Guide" are
recommended. These reports are available electronically from the NASA Marshall Space FlightCenter Technical Report Server at
http://intl's.msfc,nasa.govlmtrs/
or from the Marshall Space Flight Center area of the NASA Technical Report Server at Internetaddress
http://techreports.larc.nasa.gov/cgi-bin/NTRS
For information on obtaining Mars-GRAM 2000 (or earlier) code and data, as well asadditional copies of this report, contact
Environments GroupMail Code ED44
Marshall Space Flight Center, AL 35812
Attn: Ms. Bonnie James
Phone: (256) 544-6985
E-mail: bonnie.[[email protected], gov
Examples of output from the University of Arizona Mars Thermospheric General
Circulation Model (MTGCM) are available for browsing by interested readers at the followingweb site:
http.'//www.lpl, arizona, edu/_sengel/thermo, html
This web site has a constantly-changing archive of available MTGCM case runs for use by thescientific community at large.
iii


Table of Contents
Section Title Page
1. Introduction .............................................................................................................. 1
New Features of Mars-GRAM 2000 ........................................................................ 2
Mars General Circulation Model Input Data ........................................................ 2
2.1. I Introduction to MGCM and MTGCM Data .............................................................. 2
2.1.2 Evaluation of MGCM and MTGCM Tidal Components" ........................................... 2
2.1.3 Interpolation Methods ............................................................................................... 3
2.2 Longitude-Dependent (Terrain-Fixed) Wave Model ............................................ 4
2.3 Earlier Mars-GRAM Versions and Climate Factors ............................................. 4
2.4 Simplified Perturbation Model ............................................................................. 5
2.5 Background Dust Level and Dust Storm Conditions ............................................ 5
2.6 Choice of West or East Longitude ........................................................................ 5
2.7 New File Name Input Options .............................................................................. 6
3. How to Run Mars-GRAM ............................................................................................... 7
3.1 How to Obtain the Program .................................................................................. 7
3.2 Running the Program ............................................................................................ 7
3.3 Program Input ....................................................................................................... 8
3.4 Program Output ................................................................................................... 12
4. Sample Results ............................................................................................................... 13
4.1 Model Variations with Latitude, Season, Height, and Time of Day ................... 13
4.2 Comparisons with Observations ......................................................................... 15
5. References ...................................................................................................................... 20
Appendices
A°
B.
C.
D.
E.
F.
Headers for Mars-GRAM 2000 Output Files ..................................................... 22
Example NAMELIST Format Input File ............................................................ 25
Sample Output LIST File .................................................................................... 28
Summary of Files Provided with Mars-GRAM 2000 ......................................... 37
Example Application of Mars-GRAM in a Trajectory Code .............................. 39
Details of MGCM and MTGCM Data Files ....................................................... 41

List of Illustrations
4.2
4.3
4.4
4.5
4.6
4.7
4.8
4.9
4.10
Title Pa_gg__
Variation of daily average atmospheric density with latitude
and season (Ls angle) at 100 km altitude ................................................... 13
Temperature at 3 AM local solar time at Ls 270 ° versus
height and latitude ...................................................................................... 14
Temperature at 3 PM local solar time at Ls 270 ° versus
height and latitude .... '".ii_._'..i(i' ............ i.......... . .......................................... 14
Eastward wind at 3 AM local solar time at Ls 270 ° versus
height and latitude ...................................................................................... 15
Eastward wind at 3 PM local sol_ time at Ls 270 ° versus
height and latitude ...................................................................................... ! 6
Atmospheric density measured during entry and descent by
Mars Pathfinder, and modeled by Mars-GRAM 2000 for
the same date and time ................................................. , ............................. 16
Average temperature observed at l-m height by Mars
Pathfinder lander compared with Mars-GRAM 2000 values
near beginning and end of Pathfinder operations ....................................... 17
Observed average daily maximum, minimum, and average
surface air temperature (1.6-m level) from Viking 2 lander
and Mars-GRAM 2000 modeled surface air temperature for
a full Mars year .......................................................................................... 17
Gradient of atmospheric density with latitude (% per
degree) as measured by Mars Global Surveyoraccelerometer at 130-kin altitude on inbound and outbound
legs of each periapsis pass during phase 1 aerobraking ............................. 18
Atmospheric density at periapsis measured by Mars Global
Surveyor accelerometer during phase 2 aerobraking,
compared with modeled density from Mars-GRAM 3.8 and
Mars-GRAM 2000 ..................................................................................... 19
vi
|i!
ik
|

Mars Global Reference Atmospheric Model
2000 Version (Mars-GRAM 2000): Users Guide
1. Introduction
The Mars Global Reference Atmospheric Model (Mars-GRAM) is an engineering -
oriented model of the atmosphere of Mars. Recent documented applications of Mars-GRAM
include aerobraking operations of Mars Global Surveyor, 1 prediction and validation of Mars
Pathfinder hypersonic aerodynamics, 2 and aerothermodynamic and entry dynamics studies for
Mars Polar Lander, 3 among others.
Earlier Mars-GRAM versions 48 were based on ad-hoc parameterizations to data
observed by the Mariner and Viking missions. The current Mars-GRAM version (Mars-GRAM
2000) is based on input data tables of output from the NASA Ames Mars General Circulation
Model (MGCM) 9,f° and the University of Arizona Mars Thermospheric General Circulation
Model (MTGCM). II'12 Fully global in scope, and based o11 first-principles physics (e.g.
atmospheric thermodynamics and equations of atmospheric motion), both MGCM and MTGCM
have been somewhat "tuned" to insure that they represent Mariner and Viking results at thelocations and times for which these data are available. Work on MGCM and MTGCM
continues, to ensure that these models agree as well as possible with recent results from Mars
Pathfinder and Mars Global Surveyor.
Section 2 of this report describes the MGCM and MTGCM data and how they are
applied in Mars-GRAM 2000. Other new Mars-GRAM features are also described in section 2.
Section 3 explains how to obtain the Mars-GRAM code and data files, and how to set up and run
the program. Sample results are presented in section 4. Appendices A through F provide
additional details of Mars-GRAM 2000 input and output files and how to interpret programresults.

2. New Features of Mars-GRAM 2000
2.1 Mars General Circulation Model Input Data
2.1.1 Introduction to MGCM and MTGCM Data
Earlier Mars-GRAM versions used ad-hoc parameterizations, derived from Mariner and
Viking data, to represent temperature versus height, latitude, longitude, time of day, and Ls, and
to prescribe surface pressure versus latitude, longitude, time of day, and Ls. Ls is celestial
longitude of the Sun, as viewed from Mars. It gives time of year and Mars season. Ls = 0 is
Northern spring equinox; Ls = 90 ° is Northern summer solstice, etc. In Mars-GRAM 2000, all
data-derived parameterization relations are replaced by input data tables, based on informationfrom the NASA Ames Mars General Circulation Model (MGCM) 9'I° and the University of
Arizona Mars Thermospheric General Circulation Model (MTGCM). tl'u These tables give
variation of temperature, density, pressure and wind components with height, latitude, time of
day, and Ls. The tables also provide boundary layer data at 5 m and 30 m above the surface as a
function of longitude, latitude, time of day, and Ls. MGCM data tables cover altitudes rangingfrom the surface to 80 km. MTGCM data tables cover 80 to 170 km-altitude. A modified
(latitude-longitude dependent) Stewart-type thermospheric ,nodel 6 is still used for altitudes
above 170 km, and for dependence on solar activity. The Stewart-type thermosphere model
starts at a lower boundary condition at the height of the 1.26 nbar pressure level (height ZF).
Between 80 km and height ZF (which is typically at about 125 km), MTGCM data are used
directly. Above 170 km, modified Stewart-type thermosphere model data are used directly.Between height ZF and 170 kin a fairing process is used that smoothly transitions from MTGCM
values to Stewart-type model values.Details and formats of Mars-GRAM's MGCM and MTGCM data files are given in
Appendix F. To make file transfer easy, these files are provided in ASCII format. For run-time
speed it is best to read the files in binary form. A program (discussed in Appendix F) is providedto convert ASCII format MGCM and MTGCM data files to binary files on the user's machine.
2.1.2 Evaluation of MGCM and MTGCM Tidal Components
For each atmospheric parameter (temperature, pressure, densityl wind components)
MGCM and MTGCM data tables provide a diurnal (daily) mean value, and amplitudes and
phases of diurnal and semi-diurnal tidal components. Tidal values for each parameter are
computed from the relation
Tide = A 0 + A t • Cos[ _ (t - _bl) / 12] + A 2 • Cos[r_ (t - _b2)/ 6 ] (2.1)
where t is local solar time in hours, A 0 is diurnal mean value of the given parameter, A I is
amplitude of the diurnal tide component, d_l is phase (local time in hours) of the diurnal
component, A 2 is amplitude of the semi-diurnal tide component, and dp2 is phase (local time in
hours) of the semi-diurnal cornponent.MGCM and MTGCM tidal coefficients are provided at 5 kin-height increments [starting
at 0 km relative to datum level, and going to 80 km (MGCM) or 170 km (MTGCM)]. MGCM
coefficient data are provided at 7.5 degree-latitude spacing, while MTGCM data have 5-degree
2
latitudespacing. BothMGCM andMTGCMdataareat every30 degreesof Ls angle,andincludethreelevelsof dustopticaldepth(tau= 0.3, l, and 3). MGCM tidal coefficients are also
provided at heights of 5 m and 30 m above local topographic height level at 9 degree-longitude
spacing (for the same latitudes, Ls values, and dust optical depths).
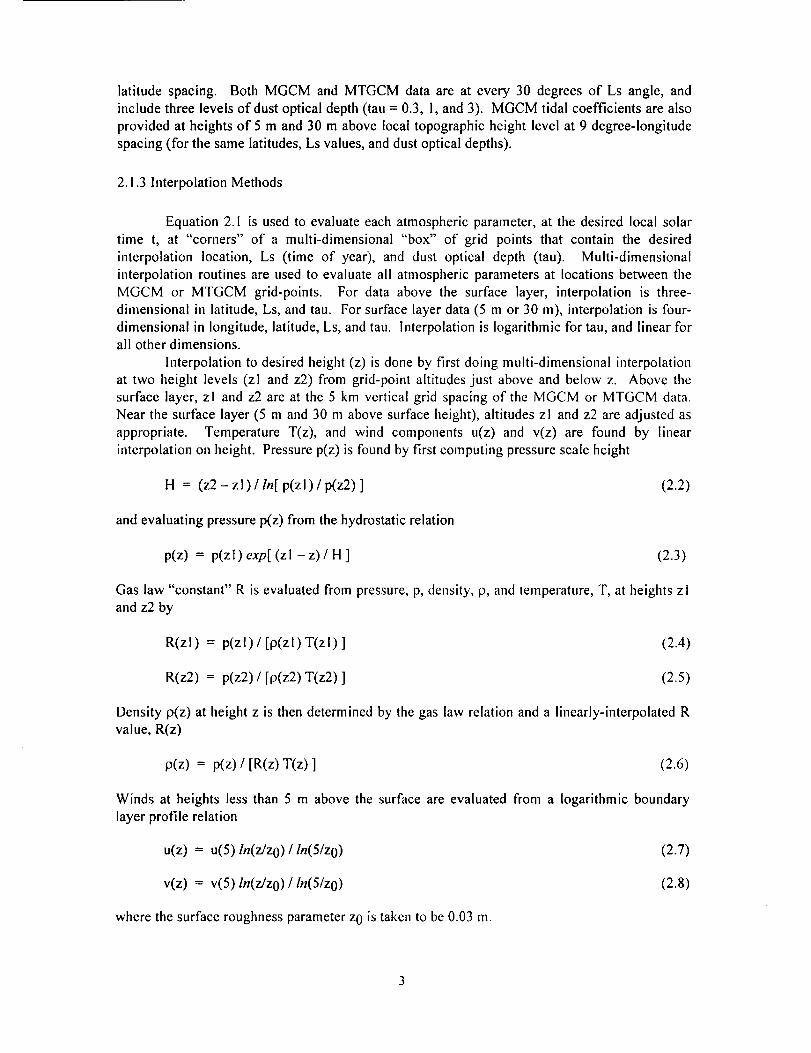
2.1.3 Interpolation Methods
Equation 2.1 is used to evaluate each atmospheric parameter, at the desired local solar
time t, at "corners" of a multi-dimensional "box" of grid points that contain the desired
interpolation location, Ls (time of year), and dust optical depth (tau). Multi-dimensional
interpolation routines are used to evaluate all atmospheric parameters at locations between the
MGCM or MTGCM grid-points. For data above the surface layer, interpolation is three-
dimensional in latitude, Ls, and tau. For surface layer data (5 m or 30 m), interpolation is four-
dimensional in longitude, latitude, Ls, and tau. Interpolation is logarithmic for tau, and linear forall other dimensions.
Interpolation to desired height (z) is done by first doing multi-dimensional interpolation
at two height levels (zl and z2) from grid-point altitudes just above and below z. Above the
surface layer, zl and z2 are at the 5 kin vertical grid spacing of the MGCM or MTGCM data.
Near the surface layer (5 m and 30 m above surface height), altitudes zl and z2 are adjusted as
appropriate. Temperature T(z), and wind components u(z) and v(z) are found by linear
interpolation on height. Pressure p(z) is found by first computing pressure scale height
H = (z2 - zl) / In[ p(zl) / p(z2) ] (2.2)
and evaluating pressure p(z) from the hydrostatic relation
p(z) = p(z I ) exp[ (z I - z) / H ] (2.3)
Gas law "constant" R is evaluated from pressure, p, density, p, and temperature, T, at heights zl
and z2 by
R(zl ) = p(z I) / [p(z I ) T(z I) ] (2.4)
R(z2) = p(z2) / [p(z2) T(z2) ] (2.5)
Density p(z) at height z is then determined by the gas law relation and a linearly-interpolated Rvalue, R(z)
p(z) = p(z) / [R(z) T(z) ] (2.6)
Winds at heights less than 5 m above the surface are evaluated from a logarithmic boundary
layer profile relation
u(z) = u(5) Zn(z/z0) / tn(5/zo) (2.7)
v(z) = v(5) In(z/z0) / tn(5/zo) (2.8)
where the surface roughness parameter z0 is taken to be 0.03 m.

2.2 Longitude-Dependent (Terrain-Fixed) Wave Model
Tide components evaluated by equation (2.1) depend only on local solar time.
Implicitly, this equation also depends on longitude. At any given instant, solar time varies at a
rate of one hour for every 15° of longitude. During aerobraking operations, accelerometer
measurements by Mars Global Surveyor 13 revealed large-amplitude longitude-dependent wave
patterns for atmospheric density. Being in a sun-synchronous orbit, Mars Global Surveyorpassed through each periapsis at essentially the same local solar time. Nevertheless, it found
large-amplitude variatigns that tended to repeat as a function of periapsis longitude. The density
variations were of the form of longitude-dependent (i.e., terrain-fixed) wave patterns. Mars-
GRAM 2000 includes a model for these longitude-dependent waves (LDW) of the form
LDW = B0 + B 1 Cos[ rc (;_ - _ 1) / ! 80] + B2 Cos[ n (_. - _2) / 90 ]
+ B3 Cos[ 7_(k - @3)/60 ] (2.9)
where _, is longitude (in degrees), B 0 is a mean wave perturbation offset, B I, B2, and B 3 are
amplitudes and _1, _2, and q_3 are phases (longitudes) for wave-l, wave-2, and wave-3
components. The term wave-n means the wave component has n peaks and troughs through 360
degrees of longitude. LDW perturbations computed by equation (2.9) are applied as a multiplier
to the mean density and pressure computed from MGCM and MTGCM data, as interpolated by
methods described in section 2.1.3. Wave model coefficients for equation (2.9) can be input
from the NAMELIST format input file (see Appendix B), or from an auxiliary file of time-
dependent wave model coefficients (see sections 3.2 and 3.3). Values of LDW coefficients may
be determined empirically, such as by accelerometer observations, _3or theoretically from wave
characteristics of Mars General Circulation Models. _4
For altitudes below I00 km, LDW perturbations are assumed to diminish in magnitude at
an exponential rate, namely,
LDW(z) = LDW(100) exp[ ( z - 100) / S ] (2.10)
where S is the wave scale parameter Wscale, from the NAMEL1ST format input file.
2.3 Earlier Mars-GRAM Versions and Climate Factors
Previous versions of Mars-GRAM allowed model output profiles to be adjusted (e.g., to
better fit data profiles provided from MGCM output). These adjustments were accomplished
with "climate factors" (CF0 through CF75 to adjust temperature fro,n 0- to 75-kin altitude, CFp
to adjust surface pressure, deltaTF to adjust temperature at 1.26-nbar level, deltaZF to adjust
height of the 1.26-nbar level (height ZF), and deltaTEX to adjust exospheric temperature. With
Mars:GRAM 2000 based directly on MGCM and MTGCM output (below 170 kin), none of
these climate factors are needed any longer (except deltaTEX, which still allows adjustment of
exospheric temperature).
Adjustment of Mars-GRAM 2000 model output can still be affected by choice of dust
optical depth (input parameter Dusttau), and by longitude-dependent wave parameters (discussed
in section 2.2).

2.4 Simplified Perturbation Model
In previous Mars-GRAM versions, a perturbation model, based on terrain-influenced
gravity waves 5 was used. In the previous model, perturbation magnitudes are proportional to
terrain relief (height above surrounding topographic heights), and depend on temperature
gradients (through the Brunt-Vaisala frequency), and on tile ratio of surface air density to local
air density. In addition to being complicated to evaluate, the previous model was found to
produce perturbation magnitudes that appear to change too rapidly from place to place in
response to changes in topography and temperature gradients. For Mars-GRAM 2000 a
simplified perturbation model is introduced that does not require evaluation of surface density or
temperature gradients. Perturbation magnitude (standard deviation, aD) in the new model (as a
fraction of mean density) is given as a function of height, z, (km) and topographic surface
height, zs, (km) by the relation
crD = 0.0l (25+Zs)exp[(z-100)/40] l)
A maximum value of 0.3 is imposed on crD.
2.5 Background Dust Level and Dust Storm Conditions
Background (nondust storm) dust optical depth (tau) can be specified by the input
parameter, Dusttau (see section 3.2). Interpolation routines (discussed in section 2.1.3)
interpolate logarithmically between tau values for both MGCM and MTGCM input data. If
Dusttau = 0 is input, a prescribed Viking-like seasonal variation of dust optical depth is used, in
which case variation oftau with Ls (in degrees) is specified by
tau = 0.65 - 0.35 Sin(n Ls/180) (2.12)
A model for global or local-scale dust storms _ is retained. In Mars-GRAM 2000, input
value for dust storm intensity (input parameter, INTENS) is equivalent to peak dust optical depthfor the storm. The program does all necessary interpolations on dust optical depth as it varies
with time (Ls, and as it varies with space, for local storms).
2.6 Choice of West or East Longitude
The astronomical community (and "official" US Geological Survey maps of Mars) use
West longitude positive (0 to 360°). Engineers and spacecraft navigation teams tend to use East
longitude positive (0 to 360°). A program switch (input parameter, LonEW) allows Mars-
GRAM 2000 users to select either East Longitude positive, or West Longitude positive. Default
(LonEW=0) is West Longitude positive. The LonEW switch also determines if the longitude-dependent wave model phase values (_1 through • 3 in equation 2.9) are in West or East
Longitude.
2.7 New File Name Input Options
Options are now provided whereby the user can specify a name for the NAMELIST
format input file, for the (optional) trajectory input file, and for the (optional) file of longitude-
dependent wave parameters. Users can also specify path names to the directories where the
MGCM, MTGCM, and other input data reside. Upon executing the program, the user is
prompted-to enter a name for the NAMELIST input file. Trajectory file name is specified by
input parameter, TRAJFL. Name for thelongitude-dependent wave parameter file is given by
input parameter, WaveFile. Path names for COSPAR and topographic data and for MGCM and
MTGCM data are parameters, DATADIR and GCMDIR, respectively. See details in AppendixB.
=
|
!B
i
=
z
=
i
z

3. How to Run Mars-GRAM
3.1 How to Obtain the Program
All source code and required data files are available from a file transfer protocol (tip)
server at NASA Marshall Space Flight Center. The ftp site also contains example input and
output files and "readme" files. To obtain the program source code and data files by ftp, see
contact information in the preface. See Appendices D and F for summaries of the program and
data files available on the tip site.
3.2 Running the Program
There are two ways to run Mars-GRAM: (1) as a subroutine in a (user-provided) main
driver program (such as a trajectory program) and (2) as a stand alone program, using a
NAMELIST format input file, in which values for all input options are provided. To use Mars-GRAM as a subroutine, see discussion in Appendix E and use example file dttmytraj.f (available
in the ftp file distribution) as a guide. File README2.txt (available in the ftp file distribution)
also discusses use ofdumytraj.fas an example for using Mars-GRAM as a subroutine.
The steps involved in setting up and running Mars-GRAM in stand-alone mode are the
following:
• Compile and link the three FORTRAN source code files marsgram.f, marssubs.f, and setup.f,
into an executable program (assumed to be called marsgram)
Make sure that necessary data files ARCHGTS.DAT (topographic height information) and
COSPAR.DAT (COSPAR model atmosphere data) are in an appropriate directory (whose
pathname is specified by parameter DATADIR in the NAMELIST format input file)
Compile and run the makebin.f program (see Appendix F) and convert the ASCII format
MGCM and MTGCM data files provided to binary form (see Appendix D); this conversion
process needs to be done only once on each user's machine
Make sure that the binary format MGCM and MTGCM data files (see Appendices D and F)
are in an appropriate directory (whose pathname is specified by parameter GCMDIR in the
NAMELIST format input file)
• Prepare a NAMELIST format input file (whose name is specified at run time) with the
desired values of all input options (example in Appendix B)
If trajectory input mode (rather than automatic profile mode) is desired, prepare a trajectory
input file (whose name is set by parameter TRAJFL in the NAMELIST input file) containing
time, height, latitude, and longitude (further discussion below)
• If time-dependent coefficients for the longitude-dependent wave model are to be used,
prepare a file (whose name is specified by parameter WaveFile in the NAMELIST format
input file); this file contains one set of coefficients per line: time (seconds from start time)
and wave model coefficients (B0 through (I)3, defined in section 2.2; further discussion
below)
Run the program by entering its executable name (e.g., marsgram); the program
automatically opens and reads the NAMELIST input file (and the TRAJFL file, if trajectory
mode is used), the data files, ARCHGTS,DAT and COSPAR.DAT, all MGCM and MTGCM
binary data files, and the WaveFile file (if time-dependent coefficients are used)
If the program is run in profile mode, the user provides (in the NAMELIST format input
file) fixed values for increments of time, height, latitude, and longitude, in this mode, the
program automatically increments position until the desired number of positions (NPOS) are
evaluated. In trajectory mode, Mars-GRAM reads time and position information from theTRAJFL file.
If constant values of longitude-dependent wave model coefficients are used, values for
these are read in as part of the NAMELIST input file (section 3.3). For time-dependent
coefficients, values are read from the WaveFile file. Each set of coefficients applies from the
time given with the coefficient data, until a new time and set of coefficients are given (on the
next line of WaveFile). The last set of coefficients in WaveFile applies indefinitely, beginning
with its given time.
3.3 Program Input
Appendix B gives a sample of NAMEL1ST format input file for Mars-GRAM 2000.Whether the subroutine or stand alone version is used, input variables whose values must be
supplied in the INPUT file are as foIIows:
LSTFL Name of LIST file (example LIST file in Appendix C); for a listing to theconsole in the stand alone version enter filename CON.
OUTFL Name of OUTPUT file (discussion of this file in Appendix A)
TRAJFL (Optional) trajectory input file name; file contains time (seconds) relative to
start time, height (kin), latitude (degrees), longitude (degrees West if
LonEW=0 or degrees East if LonEW= I; see below)
WaveFile (Optional) file for time-dependent wave coefficient data (file description
under parameter iuwave, below)
DATADIR Pathname to directory for the COSPAR data and topographic height data
GCMDIR Pathname to directory for MGCM and MTGCM binary data files
MONTH Month (1 through 12) for initial time
MDAY Day of month for initial time

MYEAR
NPOS
IHR
IMIN
SEC
LonEW
Dusttau
ALSO
INTENS
RADMAX
DUSTLAT
DU STLON
F107
STDL
Year for starting time, a 4-digit number; alternately years 1970-2069 can be
input as a 2-digit number
Maximum number of positions to evaluate, if an automatically-generated
profile is to be produced; use 0 if trajectory positions are to be read in from aTRAJFL file
Initial time, hour of day UTC (GMT)
Initial time, minute of hour
Initial time, seconds of minute
Longitude switch, 0 for input and output with West longitude positive
(default) or 1 for East longitude positive
Optical depth of background dust level (no time-developing dust storm, just
uniformly mixed dust), 0.3 to 3.0 (if 0.0 is input, a Viking-like annual
variation of background dust is assumed)
Value of areocentric longitude of the Sun (Ls, in degrees) at which a dust
storm is to start; use a value of 0 if no dust storm is to be simulated; dust
storm can be simulated only during the season of the Mars year for which Ls
is between 180 and 320 degrees
Dust storm intensity, measured as peak dust optical depth of the storm, with
allowable values ranging from 0.0 (no dust storm) to 3.0 (maximum intensity
dust storm); intensity value (if> 0) must be greater than Dusttau
Maximum radius (km) a dust storm can attain, developing according to the
parameterized space and time profile of build-up and decay in the program; ifa value of 0 or more than 10 000 km is used, the storm is taken to be of global
dimensions (uniformly covering the planet), but still assumed to build tip and
decay in intensity according to the same temporal profile
Latitude (degrees, North positive) for center of dust storm
Longitude (degrees, West positive if LonEW=0, or East positive otherwise)for center of dust storm
-2210.7 cm solar flux in its usual units of 10 W/cm 2 at average Earth orbit
position (! AU); solar flux is automatically converted by the program to its
value at the position of Mars in its orbit
Standard deviation parameter for short-term variations in Stewart nlodel
thermosphere; normal value is 0; allowable range is from -3.0 to +3.0

NR1
NVARX
NVARY
LOGSCALE
FLAT
FLON
FHGT
DELHGT
DELLAT
DELLON
DELTIME
deltaTEX
rpscale
Seedvalue(integer)for randomnumbergenerator;allowablerangeis 1to29999;to doMonte-Carlosimulationswithavarietyof perturbations,useadifferent randomnumberseedon each model run; to repeata givenperturbationsequenceon a latermodelrun,usethe samerandomnumberseedvalue
x-codefor theplotableoutput(x-y pairsfor linegraphsor x-y-z tripletsforcontourplots);AppendixA lists thevariablesassociatedwith the x-code(e.g.,if NVARX = 1, x outputfor plotting is heightabovethe referenceellipsoid)
y-codefor contourplotoutput(x-y-ztriplets);useay-codevalueof 0 for linegraph(x-y pair) plots; AppendixA lists y-codevaluesand parametersrepresented
Parameterto controlunitsof outputvaluesof densityandpressureonoutputplot files;a valueof 0 meansuseregulardensityandpressureunits(kg/m3andN/m2); 1 meansto outputlogarithm(base-10)of the regularunits;2meansto outputpercentagedeviationfrom COSPARvaluesof densityandpressure
Latitudeof initial pointto simulate (degrees, Noah positive)
Longitude of initial point to simulate (degrees, West positive if LonEW=0;
East positive otherwise)
Height (km) of initial point to simulate above the reference ellipsoid
Height increment (km) between successive steps in an automatically
generated profile (positive upward)
Latitude increment (degrees, Northward positive) between successive steps in
an automatically generated profile
Longitude increment (degrees, Westward positive if LonEW=0; Eastward
positive otherwise) between successive steps in an automatically generated
profile
Time increment (seconds) between steps in an automatically generated profile
Additive adjustment to modify temperature (K) of the exosphere (asymptotic
temperature approached at very high altitudes), nominal = 0
Multiplicative factor for density and wind perturbation magnitude (I =
nominal)
10

NMONTE Number of Monte Carlo runs during one executionof the program;
new/different starting random numbers are automatically generated for each
of the Monte Carlo profiles (or trajectories)
iup Option controlling output of LIST file and graphics output files (0 = none,
other than 0 (default) indicates generate these flies)
WaveA0 Mean term of longitude-dependent wave multiplier for density
WaveA 1 Amplitude of wave-1 component of longitude-dependent wave multiplier for
density
Waveph i I Phase of wave-1 component of longitude-dependent wave multiplier
(longitude, with West positive if LonEW = O, East positive otherwise)
WaveA2 Amplitude of wave-2 component of longitude-dependent wave multiplier for
density
Wavephi2 Phase of wave-2 component of longitude-dependent wave multiplier
(longitude, with West positive if LonEW = 0, East positive otherwise)
WaveA3 Amplitude of wave-3 component of longitude-dependent wave multiplier for
density
Wavephi3 Phase of wave-3 component of longitude-dependent wave multiplier
(longitude, with West positive if LonEW = O, East positive otherwise)
iuwave Unit number for (Optional) time-dependent wave coefficient data file
"WaveFile" (or 0 for none); WaveFile contains time (sec) relative to start
time, and wave model coefficients (WaveA0 through Wavephi3) from giventime to next time in the data file
Wscale Vertical scale (km) of longitude-dependent wave damping at altitudes below
100 km (10<=Wscale<=10 000 kin)
Two auxiliary input files are required (in addition to the MGCM and MTGCM input data
fifes). Auxiliary file ARCHGTS.DAT contains topographic height data (height, kin, above the
reference ellipsoid datum level). File COSPAR.DAT contains COSPAR reference wflues of
temperature, density, and pressure as a function of height.
If the (pre-computed) trajectory mode is used (NPOS=0), trajectory data must be read
from a file (whose name is specified by the input parameter TRAJFL). Each line of TRAJFL is a
position and time for which to compute atmospheric parameters. TRAJFL input lines contain
time (seconds, from initial time), height (kin, relative to reference ellipsoid), latitude (degrees,
North positive), and longitude (degrees, West positive if input switch LonEW=0, or East
longitude if LonEW=l). For automatically-generated profiles, output is generated until the
maximum number of positions (NPOS) is reached. For trajectory positions read in from
TRAJFL file, output is generated until end of file is reached.
I1

If time-dependentwaveparameters(WaveA0throughWavephi3)aredesired,theseareinput from the file whosepathnameis specifiedby parameterWavefileon theNAMELISTformatinputfile. Parameteriuwavedetermineswhethertime-dependentWaveFilevaluesarereadornot(iuwave= 0meannoWaveFitedata;otherwiseiuwaveistheWaveFileunit number).Eachdataline in the WaveFile file contains time (seconds) relative to start time, and wave model
coefficients (WaveA0 through Wavephi3). Wave parameter values apply from the given time on
each data line until the time given on the subsequent data line. Time-dependent wave parameters
read in from WaveFile supercede any values given in the NAMELIST format input file.
3.4 Program Output
There are three general types of program output: (1) a "LIST" file (name specified by
LSTFL parameter) containing header and descriptor information, suitable for printing or viewing
by an analyst (example LIST file in Appendix C), (2) an "OUTPUT" file (name specified by
OUTFL parameter) containing one header line and one line per output position, suitable for
reading into another program for additional analysis (description in Appendix A), and (3) a set of
"plotable" output files, or graphics output files, i.e., text files suitable for input to a graphics
program (descriptions in Appendix A).The graphics output files contain either x-y data pairs or x-y-z data triplets, determined
by the selected values for the x-code (NVARX) and y-code (NVARY). If line-graph (x-y pair)
data is the selected plot output option, then y-code = 0 is input. If contour plot (x-y-z triplet)
data is the selected plot output option, then a non-zero value of y-code is input. See the list of
codes for x-code and y-code in Appendix A.
If the user desires to suppress the LIST, OUTPUT and graphics output files (so that
output can be handled in a user-provided program), setLIST file unit number (iup) to 0 in the
NAMELIST format input file. The unit number associated with the "screen" output (iu0 or
iustdout), normaIly 6 in the stand alo,le version, can be set to any other value, by changing the
assigned value of iustdout at program code line MGRM 15, and re-compiling the program.
12

4. Sample Results
4.1 Model Variations with Latitude, Season, Height, and Time of Day
Because of its small mass, the atmosphere of Mars has low heat capacity and little
physical inertia. Therefore, it responds dramatically to changes in heat input (such as diurnal and
seasonal changes in solar radiation) and mechanical forcing (such as winds flowing over strong
topographic relief). This fact is illustrated by Figure 4.1, which shows seasonal and latitudinal
variations of daily average atmospheric density at 100-kin altitude. This figure shows seasonal
variation by almost a factor of 30 between southern winter solstice (Ls = 90 °) and southern
summer solstice (Ls = 270 °) in the south polar region at this altitude.
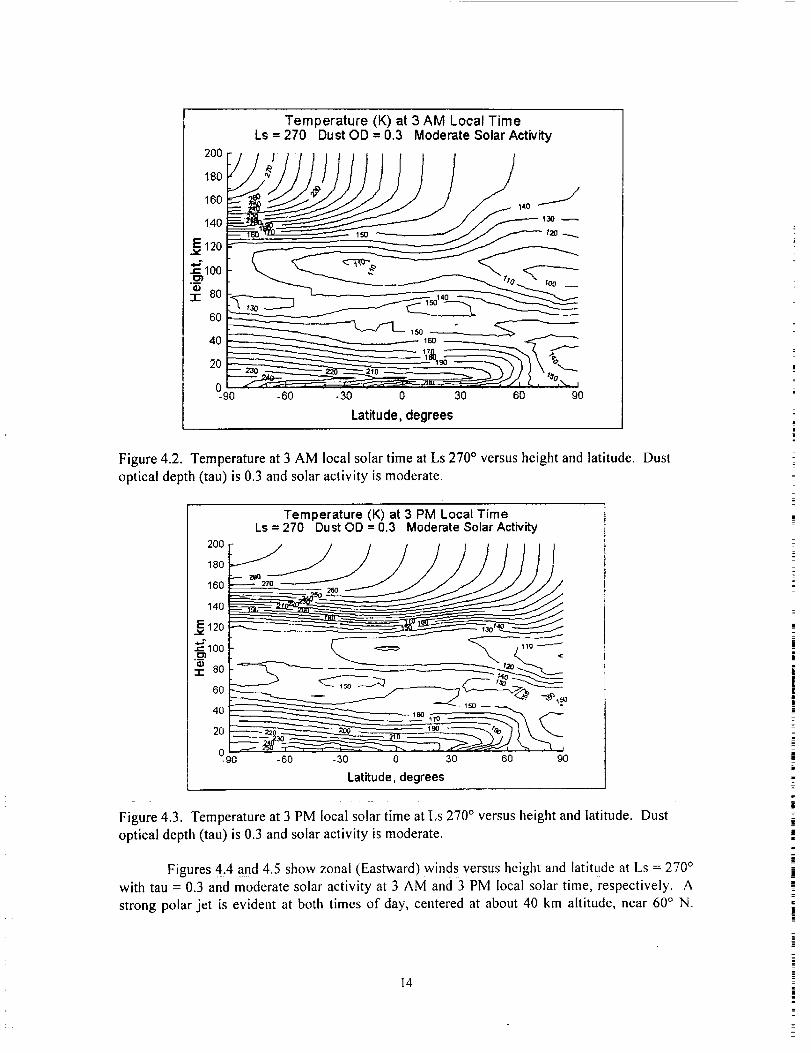
Figures 4.2 and 4.3 illustrate temperature versus height and latitude at Ls = 270 °, with
tau = 0.3 and moderate solar activity, at 3 AM and 3 PM local solar time, respectively. Near-
surface temperatures at 3 AM show strong inversion. Near-surface temperature inversions
between about 30 ° and 60 ° N latitude are also evident at 3 PM. Sharp north-south temperature
gradients are seen from the surface to about 40-km altitude near the north polar cap edge (about
60 ° N). Strong diurnal changes in temperature (differences between 3 PM and 3 AM values) areseen in northern latitudes above about 150 km and in southern latitudes near the surface.
DailyAverage Denslly (kg/km"3) at 100 km
tau = 03, , I , , I , , 1 , , I,, l , ; | i ; I , , I ' 1 I ' ' I l ' I l l
90 IE'lll_\ ",,o..._..///tlllNk\\k l.,--" \ ,o 1' /
30-
-30
-60
°o ./,r?,,.-7.,. .,.,,..,,-, .7 ,0 30 60 90 120 150 1.80 210 240 270 300 330 360
Ls, degrees
Figure 4. i. Variation of daily average atmospheric density with latitude and season (Ls angle) at100 km altitude. Density units are kg/km 3. Dust optical depth (tau) is 0.3.
13
Temperature (K) at 3 AM Local TimeLs = 270 Dust OD = 0.3 Moderate Solar Activity
40 17
%0 -so -3o o 30 60 _o
Latitude, degrees
Figure 4.2. Temperature at 3 AM local solar time at Ls 270 ° versus height and latitude.
optical depth (tau) is 0.3 and solar activity is moderate.
Temperature (K) at 3 PM Local TimeLs = 270 Dust OD = 0.3 Moderate Solar Activity
180 _
160 _ J
140
E120
%6 - -co -3o o 30 60 ooLatitude, degrees
Dust
Figure 4.3. Temperature at 3 PM local solar time at Ls 270 ° versus height and latitude. Dust
optical depth (tau) is 0.3 and solar activity is moderate.
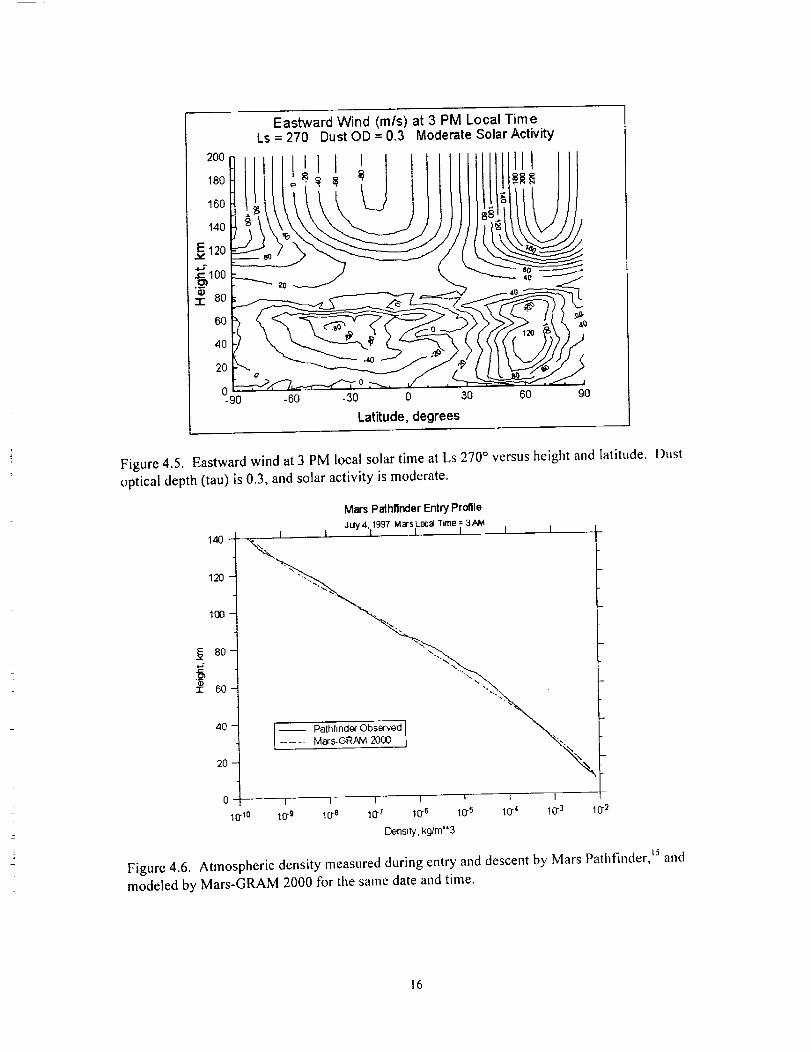
Figures 4.4 and 4.5 show zonal (Eastward) winds versus height and latitude at Ls = 270 °with tau = 0.3 and moderate solar activity at 3 AM and 3 PM local solar time, respectively. A
strong polar jet is evident at both times of day, centered at about 40 km altitude, near 60 ° N.
14
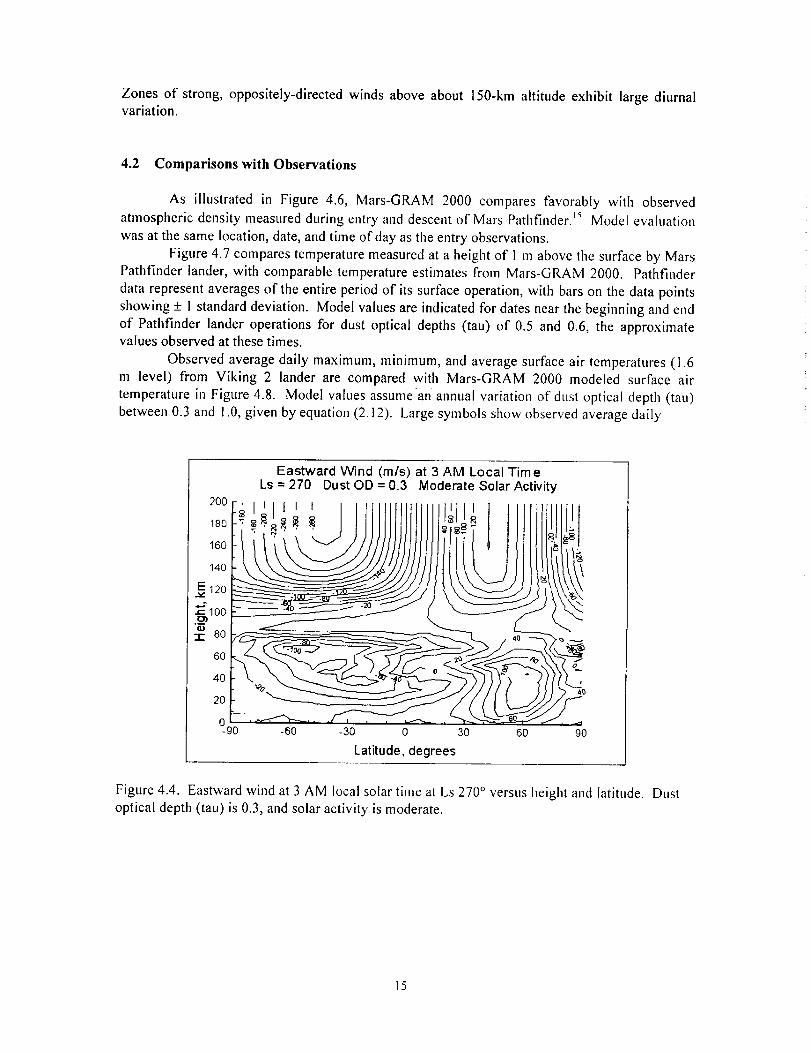
Zonesof strong,oppositely-directedwindsaboveabout150-kmaltitudeexhibit largediurnalvariation.
4.2 Comparisons with Observations
As illustrated in Figure 4.6, Mars-GRAM 2000 compares favorably with observed
atmospheric density measured during entry and descent of Mars Pathfinder._5 Model evaluation
was at the same location, date, and time of day as the entry observations.
Figure 4.7 compares temperature rneasured at a height of I m above the surface by MarsPathfinder lander, with comparable temperature estimates from Mars-GRAM 2000. Pathfinder
data represent averages of the entire period of its surface operation, with bars on the data points
showing + I standard deviation. Model values are indicated for dates near the beginning and end
of Pathfinder lander operations for dust optical depths (tau) of 0.5 and 0.6, the approximatevalues observed at these times.
Observed average daily maximum, minimum, and average surface air temperatures (1.6m level) from Viking 2 lander are compared with Mars-GRAM 2000 modeled surface air
temperature in Figure 4.8. Model values assume an annual variation of dust optical depth (tau)
between 0.3 and 1.0, given by equation (2.12). Large symbols show observed average daily
200
180
160
140
._E.120
_:100
80
60
40
20
0-90
Eastward Wind (m/s) at 3 AM Local Tim eLs = 270 Dust OD = 0.3 Moderate Solar Activity
'i II t
-60 -30 0 30 60 90
Latitude, degrees
Figure 4.4. Eastward wind at 3 AM local solar time at Ls 270 ° versus height and latitude. Dustoptical depth (tau) is 0.3, and solar activity is moderate.
15
200
180
160
140
120
._100I1)-1- 80
60
4o
20
0-go
Eastward Wind (m/s) at 3 PM Local Time
Ls = 270 Dust OD = 0.3 Moderate Solar Activity
-60 -30 0 30 60 90
Latitude, degrees
Figure 4.5, Eastward wind at 3 PM local solar time at Ls 270 ° versus height and latitude. Dust
optical depth (tau) is 0.3, and solar activity is moderate.
14o
12o
lOO
__ 8o
&
I 60
4O
2O
o
lO-iO
Mars PathfinderEntryProfile
I I July 4'11997 Mars ILO(aJ Time =[3AM I [
Pathfinde_ Observed
...... Mars-GRAM2000 l
10g 10e 10-r 10-6 10-5 10-4 10-3 10-2
Censily,kg/m*'3
Figure 4.6. Atmospheric density measured during entry and descent by Mars Pathfinder, t5 and
modeled by Mars-GRAM 2000 for the same date and time.
16

270
2601
_250
240
_o.230
E220
I_o_210
200
t_ 190
180
1700
Mars Pathfinder Site
• , I , , I , , I 1 • , = _ ] I n , I = = I
3 6 9 12 15 18 21 24
Local Time, Mars Hours
Figure 4.7. Average temperature observed at l-m height by Mars Pathfinder lander comparedwith Mars-GRAM 2000 values near beginning and end of Pathfinder operations. Bars onPathfinder data points indicate _+l standard deviation.
250
240
_, 2301
220
"_210
_.-200
_. 190
8 180
_170
160
150
140
Viking 2 Lander SiteVV'_hModel Seasonal tau Variation
• A A .A
'Q_,.,',.. ,_==e
...... .....,.,• ,=',_ .4
_._.._:.,._ • qg,,-,
• X4.20b_ Daily Max "• X4_20_ O_ly Avg• "4.2 Oh= Deily M_
i , , i , , I , , I , , i , , i , , i , . i • , | , , I , , I , = i
30 60 90 120 150 180 210 240 270 300 330 360
Solar Longitude Ls, degrees
Figure 4.8. Observed average daily maximum, minimum, and average surface air temperature
(l.6-m level) from Viking 2 lander and Mars-GRAM 2000 mode]ed surface air temperature for afull Mars year. Model values assume an annual variation of dust optical depth (tau) between 0.3and 1.0, given by equation (2.12).
17

maximum,daily mean,anddaily minimumby 30degreeLs intervals.SmalldotsshowMars-GRAM2000temperatureeveryfewhoursfor theentireMarsyear,fromwhichtheenvelopeofdaily maximumanddaily minimumcanbe inferred.BetweenaboutLs= 200andLs = 330,observeddataareinfluencedby two global-scaleduststormsthatoccurredduringtheVikingobservationperiod.Noduststormeffectsareincludedin theMars-GRAM2000simulationsinFigure4.8.
Figure4.9 showsgradientof atmosphericdensitywith latitude(% per degree)asmeasuredbyMarsGlobalSurveyor(MGS)accelerometer13at 130-kinaltitudeon inboundandoutboundlegsof eachperiapsispassduringphase1 aerobraking,comparedwith modeleddensitygradientfromMars-GRAM3.8andMars-GRAM2000.This figure shows that usage of
MTGCM data input in Mars-GRAM 2000 results in considerable improvement in density
gradient estimates over that of Mars-GRAM 3.8.
Atmospheric density at periapsis measured by MGS accelerometer 13 during phase 2
aerobraking is compared in Figure 4.10 with modeled density from Mars-GRAM 3.8 and Mars-
GRAM 2000. As evidenced by the "sawtooth" pattern in modeled values, particularly noticeable
between orbits 700 and 900, much of the density variation with orbit is due to altitude changes
from orbit-to-orbit. Additional large variations in observed density from orbit-to-orbit are due to
observed longitude-dependent waves, _3 not represented in the model results, except by
application of the mean coefficient (B 0 in equation (2.9)). Values of B 0 used in Figure 4.10 are1.5 for Mars-GRAM 3.8 and 1.7 for Mars-GRAM 2000 results. At about the time of orbit 1200,
MGS made its closet pass to the south (winter) pole. Figure 4.10 shows considerable
improvement in representation of density near this zone for Mars-GRAM 2000 versus that forMars-GRAM 3.8.
Mars Global Surveyor Phase 1 Aerobraking
_10_ ' ' ' ' ' ' ' " ' ' ' ' ' ' " " ' ' " ' ' ' " " '" " ' ' " ' ' ' ' ' " ' " ' "i
5 o
o o
_0.°..___ °00o° o 000 ° o° o o o0 _,_ _' ._ oO cO ,_v 0 0 o o
_ "......._-,_---_-_.-_-. o o o o o_, o ---_,.. _-_o oo.. oOoO-"_oOoo o _ _ _ _ ,
0 "_.0 0 _0 _ (][:;L,_ "0 "Or, (_ 0
O O o0 %_0 -- " - -
o Accelerometer Observed "- ' _.------ M_'s-GRAM 38
-- Mars-GRAM 2000
...s-15 ' ' ' I ' ' ' I ' ' " I ' ' * t ' ' ' I ' ' ' I ' ' ' I ' ' ' I ' ' ' I ' ' '
0 20 40 60 80 100 120 140 160 180 200
MGS Orbit Number
Figure 4.9. Gradient of atmospheric density with latitude (% per degree) as measured by Mars
Global Surveyor accelerometer 13at 130-km altitude on inbound and outbound legs of each
periapsis pass during phase 1 aerobraking, compared with modeled density gradient from Mars-GRAM 3.8 and Mars-GRAM 2000.
18

g,
$O
8
100
10
Mars Global Surveyor Phase 2 Aerobraklng
I I I I I t 1 k
o :_ <_o /
--- M_-GRAMZ8 1.S _l_ _'!x
Mars-GRAM 2000x 17 " T_',' __F"
i i I I I 1 I
500 600 700 800 900 1.000 1.100 1.200 1.300
MGS Orbit Number
Figure 4.10. Atmospheric density at periapsis measured by Mars Global Surveyor
accelerometer _3during phase 2 aerobraking, compared with modeled density from Mars-GRAM3.8 and Mars-GRAM 2000.
19
5. References
L
a
|
°
.
,
,
.
°
,
10.
11.
12.
Lyons, D. T., Beerer, J. G., Esposito, P., and Johnson, M. D.: "'Mars Global Surveyor:
Aerobraking Overview." Journal of Spacecraft and Rockets, Vol. 36, No. 3, pp. 307-313,1999.
Gnoffo, P. A., Braun, R. D., Weilmuenster, K. J., et ai.: "Prediction and Validation of Mars
Pathfinder Hypersonic Aerodynamic Database." Journal of Spacecraft and Rockets, Vol. 36,
No. 3, pp. 367-373, 1999.
Queen, E. M., Cheatwood, F. M., Powell, R. W., and Braun, R. D.: "Mars Polar Lander
Aerothermodynamic and Entry Dispersion Analysis." Journal of Spacecraft and Rockets,
Vol. 36, No. 3, pp. 421-428, 1999.
Justus, C. G.: "Mars Global Reference Atmospheric Model for Mission Planning and
Analysis." Journal of Spacecraft and Rockets, Vol. 28, No. 2, pp. 216-221, 1991.
Justus, C. G., James, B. F., and D. L. Johnson: "Mars Global Reference Atmospheric Model
(Mars-GRAM 3.34): Programmer's Guide." NASA Technical Memorandum 108509, 1996.
Justus, C. G., Johnson, D. L., and James, B. F.: "A Revised Thermosphere for the Mars
Global Reference Atmospheric Model (Mars-GRAM Version 3.4)." NASA TechnicalMemorandum 108513, 1996.
Justus, C. G., James, B. F., and Johnson, D. L.: "Recent and Planned Improvements in the
Mars Global Reference Atmospheric Model (Mars-GRAM)." Advances in Space Research,
Vol.19, No.8, pp.1223-1231, 1997.
Justus, C. G. and James, B. F.: "Mars Global Reference Atmospheric Model (Mars-GRAM)
Version 3.8: Users Guide." NASA Technical Memorandum 1999-209629, 1999.
Haberle, R. M., Pollack, J. B., Barnes, J. R., et al.: "Mars Atmospheric Dynamics as
Simulated by the NASA Ames General Circulation Model 1. The Zonal-Mean Circulation."
Journal of Geophysical Research, Vol. 98, No. E2, pp. 3093-3123, 1993.
Barnes, J. R., Pollack, J. B., Haberle, R. M., et al.: "Mars Atmospheric Dynamics asSimulated by the NASA Ames General Circulation Model 2. Transient Baroclinic Eddies."
Journal of Geophysical Research, Vol. 98, No. E2, pp. 3125-3148, 1993.
Bougher, S. W., Roble, R. G,, Ridley, E. C., et al.: "The Mars Tllermosphere: 2. General
Circulation with Coupled Dynamics and Composition." Journal of Geophysical Research,
Vol. 95, No. B9, pp. 14,81 I- !4,827, 1990.
Bougher, S. W., Engel, S., Roble, R. G., and Foster, B.: "Comparative Terrestrial Planet
Thermospheres. 2. Solar Cycle Variation of Global Structure and Winds at Equinox."
Journal of Geophysical Research, Vol. 104, No. E7, pp. 16,591 - 16,611, 1999.
20
13.Keating, G. M. et al.: "The Structure of the Upper Atmosphere of Mars: In Situ
Accelerometer Measurements from Mars Global Surveyor." Science, Vol. 279, No. 5357, pp.1672-1676, 1998.
14. Bridger, A. F. C.: "Stationary Wave Activity Simulated by the NASA Ames MGCM
Incorporating New MOLA Topography Data." Fifth International Conference on Mars,
Pasadena, California, July 18-23, 1999.
15. Schofield, J. T., Barnes, J. R., Crisp, D., Haberle, R. M., Larsen, S., Magalhaes, J. A.,
Murphy, J. R., Seiff, A., and Wilson, G.: "The Mars Pathfinder Atmospheric Structure
Investigation/Meteorology (ASI/MET) Experiment." Science, Vol. 278, pp. 1752-1758,1997.
21
Appendix A
Headers for Mars-GRAM 2000 Output Files
Mars-GRAM 2000 produces several output files suitable for passing to a graphics
program for plotting and further analysis. Several of these files allow run-time selection from
among several piotable parameters as the "X' parameter in an X-Y graph, or the "X and Y"
parameters in an X-Y-Z graph. See the list of parameter selection codes at the end of this
appendix. The graphics output file names and their descriptive headers are:
File = Output.txt (or other name, as prescribed in the NAMELIST INPUT file)
Time = time at_er initial input time (sec)
Height = altitude above reference ellipsoid (kin)
Lat = latitude (degrees, North positive)
LonW/LonE = longitude (degrees, West positive or East Positive)
DensAV = average (mean plus wave-perturbed) density (kg/m 3 or
Log-10 ifLOGSCALE = 1 or % from COSPAR if LOGSCALE = 2)
Temp = average temperature (K)EWind = eastward wind component (m/s, positive toward East)
NWind = northward wind component (m/s, positive toward North)
sigD = standard deviation for density perturbations (% of
unperturbed mean)
Ls = areocentrie longitude of Sun from Mars (degrees)
Dust = dust optical depth
File = DayData.txt (Daily averages for heights below 1.26 nbar level)
Var_X = user-selected plot variable (determined by NVARX value)
Var_Y = (Optional) user-selected plot variable (from NVARY value)
TempDay = Local daily average temperature (K)PresDay = Local daily average pressure (N/m 2)
DensDay = Local daily average density (kg/m 3)
EWwnDay = Local daily average Eastward wind (m/s)
NSwnDay = Local daily average Northward wind (m/s)
File = Density.txt
Var_X = user-selected plot variable (determined by NVARX value)
Var_Y = (Optional) user-selected plot variable (from NVARY value)DENSLO = low (N average - 1 standard deviation) density (kg/m 3 or
Log-10 or % from COSPAR, controlled by LOGSCALE)
DENSAV = average (mean plus wave-perturbed) density (kg/m 3 or
Log- 10 or % from COSPAR, controlled by LOGSCALE)
22

DENSHI= high(- average+ 1 standard deviation) density (kg/m 3 or
Log-10 or % from COSPAR, controlled by LOGSCALE)DENSTOT = total (mean plus perturbed) density (kg/m 3 or
Log-10 or % from COSPAR, controlled by LOGSCALE)
DustOD = dust optical depth
File = Perturb.txt
Var_X = user-selected plot variable (determined by NVARX value)
Var_Y = (Optional) user-selected plot variable (from NVARY value)
SigD -- standard deviation of density perturbations (% of unperturbed mean)
DensRand = density perturbation from random model (% of unperturbed mean)
DensWave = density perturbation from wave model (% of unperturbed mean)
DensP = total density perturbation value (% of unperturbed mean)
corlim = fraction of minimum step size for accuracy of perturbations
(should be > i for insured accuracy of perturbations)
SigU = standard deviation of wind perturbations (m/s)
File = Thrmdata.txt (Thermospheric parameters for heights above 80 km)
Var_X = user-selected plot variable (determined by NVARX value)
Var._Y = (Optional) user-selected plot variable (from NVARY value)
Tbase = temperature at 1.26 nbar level (K)
Zbase = altitude of 1.26 nbar level (kin)
F lpeak = altitude of F1 ionization peak (kin)
MolWgt = mean molecular weight (kg/kg.mole)
Texos = exospheric temperature (K)
File = Tpreshgt.txt
Var_X = user-selected plot variable (determined by NVARX value)
Var_Y = (Optional) user-selected plot variable (from NVARY value)
Temp = mean temperature (K)
Pres = mean (plus wave-perturbed) pressure (N/m 2)
TdegC = mean temperature (degrees C)
Pres_mb = mean (plus wave-perturbed) pressure (rob)
Hrho = density scale height (kin)
File = Winds.txt
Var_X = user-selected plot variable (determined by NVARX value)
Var_Y = (Optional) user-selected plot variable (from NVARY value)
EWmean = mean eastward wind component (m/s, positive eastward)
EWpert = eastward wind perturbation (m/s)
EWtot = total (mean plus perturbed) eastward wind (m/s)
23
NSmean= meannorthwardwindcomponent(m/s,positivenorthward)NSpert= northwardwindperturbation(m/s)NStot= total(meanplusperturbed)northwardwind(m/s)
Modelinputcodesusedtoselecttheplotablex andy parameters(VarX andVarY) areasfollows:
Code
123456789
Parameter.... ow ............. _ .................................
Height (above reference ellipsoid, kin)
Height (above local terrain, km)
Latitude (deg.)
Longitude (deg.) West+ if LonEW = 0, East+ if LonEW = 1Time from start (Earth seconds)
Time from start (Martian Sols)
Areoeentric Longitude of Sun, Ls (deg.)
Local Solar Time (Mars hours)
Pressure (mb)
Run-time selection of these plotable parameters is made by the input variables NVARX and
NVARY on the NAMELIST format input file (see section 3.3 and Appendix B).
24

Appendix B
Example NAMELIST Format Input File
Following is an example of the NAMELIST format input file required by Mars-GRAM
2000. Values given are the default values assigned by the program. Only values that differ from
the defaults actually have to be included in the NAMELIST file.
$INPUT
LSTFL = 'LIST.txt'
OUTFL = 'OUTPUT.txt'
TRAJFL = 'TRAJDATA.txt'
WaveFile = 'null'
DATADIR = 'C:\Mars\Mars2OOO\MGbindat\'
GCMDIR = 'C:\Mars\Mars2000\MGbindat\'
MONTH = 7
MDAY = 20
MYEAR = 76
NPOS = 41
IHR = 12
IMIN = 30
SEC = 0.0
LonEW = 0
Dusttau = 0.3
ALSO = 0.0
INTENS = 0.0
RADMAX = 0.0
DUSTLAT = 0.0
DUSTLON = 0.0
FI07 = 68.0
STDL = 0.0
NRI = 1234
NVARX = 1
NVARY = 0
LOGSCALE = 0
FLAT = 22.48
FLON = 47.97
FHGT = -5.
DELHGT = 5.0
DELLAT = 0.5
DELLON = 0.5
DELTIME = 500.0
deltaTEX = 0.0
rpscale = 1.0NMONTE = 1
iup = 13WaveA0 = 1.0
WaveAl = 0.0
Wavephil = 0.0WaveA2 = 0.0
Wavephi2 = 0.0WaveA3 = 0.0
Wavephi3 = 0.0iuwave = 0
Wscale = 20.
25

SEND
Explanation of variables:
LSTFL = List file name (CON for console listing)
OUTFL - Output file name
TRAJFL - (Optional) Trajectory input file. File contains time (sec)
relative to start time, height (km), latitude (deg),
longitude (deg W if LonEW=0, deg E if LonEW=l, see below)
WaveFile = (Optional) file for time-dependent wave coefficient data.
See file description under parameter iuwave, below.
DATADIR = Directory for COSPAR data and topographic height data
GCMDIR = Directory for GCM binary data files
MONTH _ month of year
MDAY = day of month
MYEAR = year (4-digit; 1970-2069 can be 2-digit)
NPOS = max # positions to evaluate (0 = read data from trajectory
input file)
IHR = UTC (GMT) hour of day
IMIN = minute of hour
SEC _ second of minute (for initial position)
LonEW = 0 for input and output West longitudes positive; 1 for East
longitudes positive
Dusttau = Optical depth of background dust level (no time-developing
dust storm, just uniformly mixed dust), 0.3 to 3.0, or use
0 for a Viking-like annual variation of background dust
ALSO _ starting Ls value (degrees) for dust storm (0 = none)
INTENS = dust storm intensity (0.0 - 3.0). Storm intensity (>0) must
be larger than Dusttau.
RADMAX = max. radius (km) of dust storm (0 or >i0000 = global)
DUSTLAT = Latitude (degrees) for center of dust storm
DUSTLON = Longitude (degrees) (West positive if LonEW=0 ,or East
positive if LonEW = i) for center of dust storm
FI07 = 10.7 cm solar flux (10"*-22 W/cm**2 at 1AU)
STDL _ std. dev. for thermosphere variation (-3.0 to +3.0)
NRI = starting random number (0 < NRI < 30000)
NVARX = x-code for plotable output (l=hgt above ref. ellipse).
See file xycodes.txt
NVARY = y-code for 3-D plotable output (0 for 2-D plots)
LOGSCALE = 0=regular linear scale, l=log-base-10 scale, 2=percentage
deviations from COSPAR model
FLAT = initial latitude (N positive), degrees
FLON = initial longitude (West positive if LowEW = 0 or East
positive if LonEW = i), degrees
FHGT = initial height (km), above ref. ellipsoid
DELHGT = height increment (km) between steps
DELLAT = Latitude increment (deg) between steps (Northward positive)
DELLON = Longitude increment (deg) between steps (Westward positive
if LonEW = 0, Eastward positive if LonEW = i)
DELTIME = time increment (sec) betweensteps
deltaTEX = adjustment for exospheric temperature (K)
rpscale = random perturbation scale'factor (0-2)
NMONTE = number of Monte Carlo runs
iup = 0 for no LIST and graphics output, or unit number for output
WaveA0 = Mean term of longitude-dependent wave multiplier for density
WaveAl = Amplitude of wave-i component of longitude-dependent wave
multiplier for density
Wavephil = Phase of wave-I component of longitude-dependent wave
multiplier (longitude, with West positive if LonEW = 0,
East positive if LonEW = I)
WaveA2 = Amplitude of wave-2 component of longitude-dependent wave
multiplier for density
Wavephi2 = Phase of wave-2 component of longitude-dependent wave
multiplier (longitude, with West positive if LonEW = 0,
East positive if LonEW = i)
WaveA3 = Amplitude of wave-3 component of longitude-dependent wave
multiplier for density
26
Wavephi3= Phaseof wave-3componentof longitude-dependentwavemultiplier (longitude, with Westpositive if LonEW= 0,East positive if LonEW= i)
iuwave - Unit number for (Optional) time-dependent wave coefficient
data file "WaveFile" (or 0 for none).
WaveFile contains time (sec) relative to start time, and
wave model coefficients (WaveA0 thru Wavephi3) from the
given time to the next time in the data file.
Wscale = Vertical scale (km) of longitude-dependent wave damping
at altitudes below i00 km (10<=Wscale<=10,000 km)
27

Appendix C
Sample Output LIST File
Following is LIST file output produced by standard input parameters given in Appendix
B. Standard input is also provided to users (along with the program code and other data files) as
file "input.std". Output data given here are provided as file "listmg2k.txt". Availability of these
files allows users to make a test run after compiling Mars-GRAM on their own machine, and to
electronically check their output by a file-compare process (e.g. the "diff" command in UNIX or
the "fc" command in DOS). Note that, due to machine-dependent or compiler-dependent
rounding differences, some output values may differ slightly from those shown here. These
differences are usually no more than one unit in the last significant digit displayed. As shown
here, the listing gives numbers in the DOS convention of not displaying zero-valued leading
digits before the decimal place. Leading zeroes are given in the UNIX version of listmg2k.txt
provided. If necessary for performing the output test, changes from UNIX format to DOS format
can be accomplished with an editing program (e.g. changing all character strings " 0." to " ."
and changing all "-0." to "_-.", where "_" indicates a blank space)
Mars-GRAM 2000 (Version i) March, 2000
LIST file= LIST.txt OUTPUT file= OUTPUT.txt
Data directory= C:\Mars\Mars2000\MGbindat\
GCM directory= C:\MarskMars2000\MGbindat\
Date - 7/20/1976 Julian Date = 2442980.0 UTC Time _ 12:30: .0
deltaTEX= .0
FI0.7 flux = 68.0 (I AU) 25.0 (Mars), standard deviation =
Random seed = 1234 Scale factor = 1.0
A0,Al,phil,A2,phi2,A3,phi3 = 1.000 .000 .0 .000 .0 .000
Wave Scale - 20.0 km.
Time (rel. to TO) =
.0
.0
Wave phases are in degrees of West Longitude
.0 sec. ( .000 Sols) Ls = 97.0 Dust = .30
Scale Hgt H(p) = 11.75 H(rho) = 13.27 km
Longitude = 47.97 W ( 312.03 E) degrees
Mars Orbital Radius = 1.649 AU
Local Time = 16.05 Mars hours
Pressure = 8.484E+02 N/m**2
i. 873E-02 i. 911E-02 1. 950E-02 kg/m** 3
4.7 % 6.8 % 8.9 %
Dens. Pert. - -.25% Wave -- .00% of mean
(Mean, Perturbed, Total) = 7.6 2.1 9.8 m/s
(Mean, Perturbed, Total) = -3.0 -1.4 -4.4 m/s
Height - -1.54 km ( .00 km)
Latitude = 22.48 degrees
Sun Latitude = 25.00 deg.
Sun Longitude = 108.77 deg.
Temperature = 234.9 K
Density (Low, Avg., High) =
Departure, COSPAR NH Mean
Tot. Dens. - 1.907E-02 kg/m**3
Eastward Wind
Northward Wind
Time (rel. to TO) = 500.0 sec. ( .006 sols) Ls = 97.0 Dust 3 .30
Height m .00 km ( 1.33 km) Scale Hgt H(p) = 11.31 H(rho) = 13.25 km
Latitude = 22.98 degrees Longitude = 48.47 W ( 311.53 E) degrees
Sun Latitude z 25.00 deg. Mars Orbital Radius = 1.649 AU
Sun Longitude = 110.80 deg. Local Time = 16.16 Mars hours
Temperature _ 230.7 K Pressure = 7.437E+02 N/m**2
Density (Low, Avg., High) = 1.672E-02 1.706E-02 1.740E-02 kg/m**3
Departure, COSPAR NH Mean _ 7.9 % I0.i % 12.3 %
Tot. Dens. = 1.700E-02 kg/m**3 Dens. Pert. = -.34% Wave = .00% of mean
Eastward Wind (Mean, Perturbed, Total) _ 14.1 -.9 13.2 m/s
Northward Wind (Mean, Perturbed, Total) = -4.4 1.2 -3.3 m/s
Time (tel. to TO) = 1000.0 sec. ( .011 sols) Ls = 97.0 Dust = .30
Height _ 5.00 km ( 5.65 km) Scale Hgt H(p) = 10.54 H(rho) = 11.90 km
Latitude = 23.48 degrees Longitude = 48.97 W ( 311.03 E) degrees
28

Sun Latitude = 25.00 deg. Mars Orbital Radius = 1.649 AU
Sun Longitude = 112.83 deg. Local Time = 16.26 Mars hours
Temperature = 216.3 K Pressure = 4.777E+02 N/m**2
Density (Low, Avg., High) = 1 142E-02 1.169E-02 1.195E-02 kg/m**3
Departure, COSPAR NH Mean = 15.4 % 18.1% 20.7 %
Tot. Dens. = 1 203E-02 kg/m**3 Dens. Pert. = 2.93% Wave = .00% of mean
Eastward Wind (Mean, Perturbed, Total) = 6.6 -2.5 4.1 m/s
Northward Wind (Mean, Perturbed, Total) = -3.2 -1.9 -5.1 m/s
Time (rel. to TO)
Height - i0.00 km ( 9.70 km)
Latitude = 23.98 degrees
Sun Latitude = 25.00 deg.
Sun Longitude = 114.86 deg.
Temperature = 20_.i K
Density (Low, Avg., High) =
Departure, COSPAR NH Mean =
Tot. Dens. = 7 371E-03 kg/m**3
1500.0 sec. ( .017 sols) Ls = 97.0 Dust = .30
Scale Hgt H(p) = 10.06 H(rho) = 11.32 km
Longitude _ 49.47 W ( 310.53 E) degrees
Mars Orbital Radius = 1.649 AU
Local Time = 16.36 Mars hours
Pressure = 2.973E+02 N/m**2
7 469E-03 7.673E-03 7.878E-03 kg/m**3
15.4 % 18.6 % 21.8 %
Dens. Pert. = -3.94% Wave = .00% of mean
Eastward Wind (Mean, Perturbed, Total) = -2.9 -2.6 -5.4 m/s
Northward Wind (Mean, Perturbed, Total) = 1.6 1.4 3.0 m/s
...........................................................................
Time (rel. to TO) = 2000.0 sec. ( .023 sols) Ls = 97.0 Dust = .30
Height = 15.00 km ( 14.63 km)
Latitude = 24.48 degrees
Sun Latitude = 25.00 deg.
Sun Longitude = 116.89 deg.
Temperature = 194.2 K
Density (Low, Avg., High) =
Departure, COSPAR NH Mean =
Tot.Dens. = 4 848E-03 kg/m**3
Eastward Wind (Mean, Perturbed, Total)
Northward Wind (Mean, Perturbed, Total) =
Scale Hgt H(p) = 9.55 H(rho) = 10.69 km
Longitude _ 49.97 W ( 310.03 E) degrees
Mars Orbital Radius = 1.649 AU
Local Time = 16.46 Mars hours
Pressure = 1.810E+02 N/m**2
4 783E-03 4.932E-03 5.082E-03 kg/m**3
14.7 % 18.3 % 21.9 %
Dens. Pert. = -1.70% Wave z .00% of mean
-27.0 .0 -27.0 m/s
9.0 -.6 8.3 m/s
Time (rel. to TO) =
Height = 20.00 km ( 19.57 km)
Latitude = 24.98 degrees
Sun Latitude = 25.00 deg.
Sun Longitude = 118.91 deg.
Temperature _ 183.8 K
Density (Low, Avg., High) =
Departure, COSPAR NH Mean =
Tot. Dens. = 3 153E-03 kg/m**3
Eastward Wind (Mean, Perturbed, Total)
Northward Wind (Mean, Perturbed, Total) =
2500.0 sec. ( .028 sols) Ls = 97.0 Dust _ .30
Scale Hgt H(p) = 9.02 H(rho) = 10.17 km
Longitude = 50.47 W ( 309.53 E) degrees
Mars Orbital Radius = 1.649 AU
Local Time = 16.56 Mars hours
Pressure = 1.074E+02 N/m**2
2 984E-03 3.090E-03 3.197E-03 kg/m**3
13.5 % 17.5 % 21.6 %
Dens. Pert. _ 2.01% Wave = .00% of mean
-30.5 -4.3 -34.8 m/s
ii.0 .3 11.4 m/s
Time (rel. to T0)
Height = 25.00 km ( 24.51 km)
Latitude = 25.48 degrees
Sun Latitude = 25.00 deg.
Sun Longitude = 120.94 deg.
Temperature = 172.9 K
Density (Low, Avg., High) =
Departure, COSPAR NH Mean =
Tot. Dens. = 1 770E-03 kg/m**3
Eastward Wind (Mean, Perturbed, Total) z
Northward Wind (Mean, Perturbed, Total) =
3000.0 sec. ( .034 sols) Ls = 97.0 Dust = .30
Scale Hgt H(p) = 8.50 H(rho) = 9.56 km
Longitude = 50.97 W ( 309.03 E) degrees
Mars Orbital Radius = 1.649 AU
Local Time = 16.66 Mars hours
Pressure = 6.184E+01 N/m**2
1 818E-03 1.892E-03 1.966E-03 kg/m**3
12.2 % 16.8 % 21.4 %
Dens. Pert. - -6.43% Wave = .00% of mean
-40.7 -.3 -41.0 m/s
6.1 8.1 14.2 m/s
Time (rel. to TO) =
Height - 30.00 km ( 29.46 km)
Latitude = 25.98 degrees
Sun Latitude = 25.00 deg.
Sun Longitude = 122.97 deg.
Temperature - 162.3 K
Density (Low, Avg., High) =
Departure, COSPAR NH Mean =
Tot. Dens. = 1 146E-03 kg/m**3
Eastward Wind
3500.0 sec. ( .039 sols) Ls = 97.0 Dust = .30
Scale Hgt H(p) _ 8.02 H(rho) = 8.82 km
Longitude _ 51.47 W ( 308.53 E) degrees
Mars Orbital Radius = 1.649 AU
Local Time = 16.77 Mars hours
Pressure - 3.445E+01 N/m**2
1 073E-03 1.123E-03 1.173E-03 kg/m**3
9.5 % 14.6 % 19.7 %
Dens. Pert. = 2.05% Wave = .00% of mean
(Mean, Perturbed, Total) = -55.4 -.3 -55.7 m/s
29

Northward Wind (Mean, Perturbed, Total) = 3.6 -6.2 -2.6 m/s
Time (rel. to TO)
Height - 35.00 km ( 34.40 km)
Latitude = 26.48 degrees
Sun Latitude - 25.00 deg.
Sun Longitude = 125.00 deg.
Temperature = 153.5 K
Density (Low, Avg., High) =
Departure, COSPAR NH Mean =
4000.0 sec. ( .045 sols) Ls = 97.0 Dust = .30
Scale Hgt H(p) = 7.64 H(rho) = 8.42 km
Longitude - 51.97 W ( 308.03 E) degrees
Mars Orbital Radius = 1.649 AU
Local Time = 16.87 Mars hours
Pressure = 1.854E+01 N/m**2
6. 067E-04 6. 389E-04 6.711E-04 kg/m** 3
4.2 % 9.8 % 15.3 %
Tot. Dens. = 6.254E-04 kg/m**3 Dens. Pert. = -2.11% Wave = .00% of mean
Eastward Wind (Mean, Perturbed, Total) = -65.8 -1.2 -67.0 m/s
Northward Wind (Mean, Perturbed, Total) = -6.8 3.6 -3.2 m/s
Time (tel. to TO) =
Height = 40.00 km ( 39.35 km)
Latitude = 26.98 degrees
Sun Latitude = 25.00 deg.
Sun Longitude = 127.02 deg.
Temperature = 144.5 K
Density (Low, Avg., High) =
Departure, COSPAR NH Mean =
4500.0 sec. ( .051 sols) Ls = 97.0 Dust = .30
Scale Hgt H(p) = 7.30 H(rho) = 7.86 km
Longitude = 52.47 W ( 307.53 E) degrees
Mars Orbital Radius = 1.649 AU
Local Time = 16.97 Mars hours
Pressure = 9.678E+00 N/m**2
3.342E-04 3. 545E-04 3.747E-04 kg/m**3
-1.7 % 4.3 % 10.2 %
Tot. Dens. = 3.800E-04 kg/m**3 Dens. Pert. - 7.21% Wave = .00% of mean
Eastward Wind (Mean, Perturbed, Total) = -75.6 8.3 -67.3 m/s
Northward Wind (Mean, Perturbed, Total) = -6.6 -7.6 -14.1 m/s
...........................................................................
Time (rel. to TO) = 5000.0 sec. ( .056 sols) Ls = 97.0 Dust = .30
Height = 45.00 km ( 44.30 km)
Latitude = 27.48 degrees
Sun Latitude = 25.00 deg.
Sun Longitude = 129.05 deg.
Temperature = 137.7 K
Density (Low, Avg., High) =
Departure, COSPAR NH Mean =
Tot. Dens. = 1.786E-04 kg/m**3
Eastward Wind (Mean, Perturbed, Total) =
Northward Wind (Mean, Perturbed, Total) =
Scale Hgt H(p) = 7.03 H(rho) = 7.37 km
Longitude = 52.97 W ( 307.03 E) degrees
Mars Orbital Radius = 1.649 AU
Local Time = 17.07 Mars hours
Pressure = 4.903E+00 N/m**2
1.763E-04 i. 885E-04 2. 008E-04 kg/m**3-9.1% -2.8 % 3.5 %
Dens. Pert. = -5.28% Wave = .00% of mean
-80.2 -5.0 -85.2 m/s
-17.3 -1.7 -19.0 m/s
Time (rel. to TO) =
Height = 50.00 km ( 49.26 km)
Latitude = 27.98 degrees
Sun Latitude = 25.00 deg.
Sun Longitude = 131.08 deg.
Temperature = 133.1 K
Density (Low, Avg., High) =
Departure, COSPAR NH Mean =
Tot. Dens. = 9.062E-05 k g/m**3
5500.0 sec. ( .062 sols) Ls = 97.0 Dust = .30
Scale Hgt H(p) = 6.92 H(rho) = 6.85 km
Longitude = 53.47 W ( 306.53 E) degrees
Mars Orbital Radius = 1.649 AU
Local Time = 17.17 Mars hours
Pressure = 2.420E+00 N/m**2
8. 915E-05 9. 625E-05 1.034E-04 kg/m**3
-17.4 % -10.9 % -4.3 %
Dens. Pert. = -5.85% Wave = .00% of mean
Eastward Wind (Mean, Perturbed, Total) = -106.7 5.5 -101.2 m/s
Northward Wind (Mean, Perturbed, Total) = -8.1 6.5 -1.5 m/s
...........................................................................
Time (rel. to TO) = 6000.0 sec. ( .068 sols) Ls = 97.0 Dust = .30
Height = 55.00 km ( 54.22 km)
Latitude = 28.48 degrees
Sun Latitude = 25.00 deg.
Sun Longitude = 133.11 deg.
Temperature = 134.1 K
Density (Low, Avg., High) =
Departure, COSPAR NH Mean =
Tot. Dens. = 4.460E-05 kg/m**3
Scale Hgt H(p) = 6.76 H(rho) = 6.36 km
Longitude = 53.97 W ( 306.03 E) degrees
Mars Orbital Radius = 1.649 AU
Local Time = 17.28 Mars hours
Pressure = 1.180E+00 N/m**2
4.272E-05 4.662E-05 5.052E-05 kg/m**3
-27.8 % -21.2 % -14.7 %
Dens. Pert. = -4.33% Wave = .00% of mean
Eastward Wind (Mean, Perturbed, Total) = -93.0 -14.7 -107.7 m/s
Northward Wind (Mean, Perturbed, Total) = 14.7 -6.0 8.6 m/s
.............. -- ............................................................
Time (tel. to TO) = 6500.0 sec. ( .073 sols) Ls = 97.0 Dust = .30
Height = 60.00 km ( 59.20 km) Scale Hgt H(p) = 7.01 H(rho) = 6.75 km
Latitude = 28.98 degrees Longitude = 54.47 W ( 305.53 E) degrees
Sun Latitude = 25.00 deg. Mars Orbital Radius = 1.649 AU
Sun Longitude = 135.13 deg. Local Time = 17.38 Mars hours
3O

Temperature = 140.5 K Pressure = 5.658E-01 N/m**2
Density (Low, Avg., High) = 1.932E-05 2°134E-05 2.337E-05 kg/m**3
Departure, COSPAR NH Mean = -39.3 % -32.9 % -26.5 %
Tot. Dens. = 1.953E-05 kg/m**3 Dens. Pert. _ -8.48% Wave = .00% of mean
Eastward Wind (Mean, Perturbed, Total) _ -27.2 -3.9 -31.1 m/s
Northward Wind (Mean, Perturbed, Total) = 21.1 -14.5 6.5 m/s
Time (rel. to T0) =
Height = 65.00 km ( 64.18 km)
Latitude _ 29.48 degrees
Sun Latitude = 25.00 deg.
Sun Longitude = 137.16 deg.
Temperature = 144.3 K
Density (Low, Avg., High) =
Departure, COSPAR NH Mean =
7000.0 sec. ( .079 sols) Ls = 97.0 Dust = .30
Scale Hgt H(p) = 7.10 H(rho) = 7.24 km
Longitude _ 54.97 W ( 305._3 E) degrees
Mars Orbital Radius = 1.649 AU
Local Time = 17.48 Mars hours
Pressure = 2.781E-01 N/m**2
9.122E-06 1.022E-05 1.132E-05 kg/m**3
-45.7 % -39.2 % -32.6 %
Tot. Dens. = 1.029E-05 kg/m**3 Dens. Pert. = .67% Wave = .00% of mean
Eastward Wind (Mean, Perturbed, Total) = 24.3 -.i 24.1 m/s
Northward Wind (Mean, Perturbed, Total) = 9.2 -12.0 -2.8 m/s
...........................................................................
Time (rel. to TO) = 7500.0 sec. ( .084 sols) Ls = 97.0 Dust = .30
Height = 70.00 km ( 69.16 km)
Latitude = 29.98 degrees
Sun Latitude = 25.00 deg.
Sun Longitude = 139.19 deg.
Temperature = 142.1K
Density (Low, Avg., High) =
Departure, COSPAR NH Mean =
Tot. Dens. = 5.212E-06 kg/m**3 Dens. Pert.
Eastward Wind (Mean, Perturbed, Total) =
Northward Wind (Mean, Perturbed, Total) =
Scale Hgt H(p) = 6.99 H(rho) = 7.35 km
Longitude = 55.47 W ( 304.53 E) degrees
Mars Orbital Radius = 1.649 AU
Local Time = 17.58 Mars hours
Pressure = 1.377E-01 N/m**2
4.510E-06 5.137E-06 5.764E-06 kg/m**3
-48.3 % -41.2 % -34.0 %
1.45% Wave = .00% of mean
28.3 .5 28.8 m/s
7.0 9.3 16.3 m/s
Time (rel. to T0) =
Height = 75.00 km ( 74.11 km)
Latitude = 30.48 degrees
Sun Latitude = 25.00 deg.
Sun Longitude = 141.22 deg.
Temperature = 136.8 K
Density (Low, Avg., High) =
Departure, COSPAR NH Mean =
8000.0 sec. ( .090 sols) Ls = 97.0 Dust = .30
Scale Hgt H(p) = 7.24 H(rho) = 7.26 km
Longitude _ 55.97 W ( 304.03 E) degrees
Mars Orbital Radius = 1.649 AU
Local Time = 17.68 Mars hours
Pressure = 6.742E-02 N/m**2
2.246E-06 2.607E-06 2.969E-06 kg/m**3
-49.8 % -41.7 % -33.6 %
Tot. Dens. _ 2.530E-06 kg/m**3 Dens. Pert. = -2.96% Wave = .00% of mean
Eastward Wind (Mean, Perturbed, Total) = 8.6 -41.7 -33.1 m/s
Northward Wind (Mean, Perturbed, Total) = -14.8 -8.3 -23.1 m/s
Time (rel. to TO) =
Height = 80.00 km ( 79.06 km)
Latitude = 30.98 degrees
Sun Latitude = 25.00 deg.
Sun Longitude = 143.25 deg.
Temperature = 130.5 K
Density (Low, Avg., High) =
Departure, COSPAR NH Mean =
8500.0 sec. ( .096 sols) Ls = 97.0 Dust = .30
Scale Hgt H(p) = 7.00 H(rho) = 7.16 km
Longitude _ 56.47 W ( 303.53 E) degrees
Mars Orbital Radius = 1.649 AU
Local Time = 17.79 Mars hours
Pressure = 3.396E-02 N/m**2
I.I08E-06 1.314E-06 1.521E-06 kg/m**3
-51.6 % -42.6 % -33.6 %
Tot. Dens. = 1.309E-06 kg/m**3 Dens. Pert. = -.42% Wave = .00% of mean
Eastward Wind (Mean, Perturbed, Total) = 7.1 -61.4 -54.3 m/s
Northward Wind (Mean, Perturbed, Total) = -6.1 6.9 .8 m/s...........................................................................
Time (rel. to TO) = 9000.0 sec. ( .I01 sols) Ls = 97.0 Dust = .30
Height = 85.00 km ( 84.00 km)
Latitude = 31.48 degrees
Sun Latitude = 25.00 deg.
Sun Longitude = 145.27 deg.
Exospheric Temp. = 206.0 K
Solar Zenith Angle = 75.9 deg
Temperature = 127.2 K
Density (Low, Avg., High) =
Departure, COSPAR NH Mean =
Tot. Dens. = 7.052E-07 kg/m**3 Dens. Pert. =
Eastward Wind (Mean, Perturbed, Total) =
Scale Hgt H(p) = 6.83 H(rho) _ 7.01 km
Longitude = 56.97 W ( 303.03 E) degrees
Mars Orbital Radius = 1.649 AU
Local Time = 17.89 Mars hours
Tbase = 160.4 K Zbase = 120.2 km
F1 peak = 133.1 km Mol.Wgt. = 41.50
Pressure = 1.672E-02 N/m**2
5.390E-07 6.562E-07 7.735E-07 kg/m**3
-53.9 % -43.9 % -33.9 %
7.46% Wave = .00% of mean
9.5 -30.1 -20.6 m/s
31

NorthwardWind (Mean,Perturbed, Total) = -9.4 -7.0 -16.5 m/s...........................................................................
Time (rel. to TO) - 9500.0 sec. ( .107 sols) Ls = 97.1 Dust = .30
Height = 90.00 km ( 88.95 km)
Latitude = 31.98 degrees
Sun Latitude _ 25.00 deg.
Sun Longitude = 147.30 deg.
Exospheric Temp. = 205.6 K
Solar Zenith Angle = 76.9 deg
Temperature = 126.0 K
Density (Low, Avg., High)
Departure, COSPAR NH Mean =
Scale Hgt H(p) = 6.93 H(rho) = 6.90 km
Longitude = 57.47 W ( 302.53 E) degrees
Mars Orbital Radius = 1.649 AU
Local Time = 17.99 Mars hours
Tbase = 160.1 K Zbase = 120.3 km
F1 peak = 133.8 km Mol.Wgt. = 41.83
Pressure = 8.106E-03 N/m**2
2.579E-07 3.236E-07 3.892E-07 kg/m**3
-57.1 % -46.2 % -35.2 %
Tot. Dens. = 2.988E-07 kg/m**3 Dens. Pert. = -7.66% Wave = .00% of mean
Eastward Wind (Mean, Perturbed, Total) _ 9.1 3.6 12.7 m/s
Northward Wind (Mean, Perturbed, Total) = -14.8 -23.4 -38.2 m/s
Time (rel. to TO) -
Height = 95.00 km ( 93.90 km)
Latitude _ 32.48 degrees
Sun Latitude = 25.00 deg.
Sun Longitude = 149.33 deg.
Exospheric Temp, = 205.2 K
Solar Zenith Angle = 77.9 deg
Temperature - 126.0 K
Density (Low, Avg., High)
Departure, COSPAR NH Mean =
Tot.Dens. = 1.199E-07 kg/m**3
i0000.0 sec. ( .113 sols) Ls = 97.1 Dust = .30
Scale Hgt H(p) = 6.76 H(rho) = 6.83 km
Longitude _ 57.97 W ( 302.03 E) degrees
Mars Orbital Radius = 1.649 AU
Local Time = 18.09 Mars hours
Tbase = 159.9 K Zbase = 120.4 km
F1 peak = 134.5 km Mol.Wgt. = 41.58
Pressure _ 3.982E-03 N/m**2
1.216E-07 1.581E-07 1.945E-07 kg/m**3
-60.6 % -48.8 % -37.1%
Dens. Pert. _ -24.16% Wave = .00% of mean
Eastward Wind (Mean, Perturbed, Total) = 6.2 4.9 11.1 m/s
Northward Wind (Mean, Perturbed, Total) = -22.3 -38.7 -61.1 m/s
Time (rel. to TO) = 10500.0 sec. ( .118 sols) Ls = 97.1 Dust = .30
Height - I00.00 km ( 98.84 km)
Latitude = 32.98 degrees
Sun Latitude = 25.00 deg.
Sun Longitude = 151.36 deg.
Exospheric Temp. = 204.8 K
Solar Zenith Angle = 78.9 deg
Temperature = 126.7 K
Density (Low, Avg., High) =
Departure, COSPAR NH Mean =
Tot. Dens. - 6.038E-08 kg/m**3
Scale Hgt H(p) = 7.09 H(rho) = 6.87 km
Longitude = 58.47 W ( 301.53 E) degrees
Mars Orbital Radius = 1.649 AU
Local Time = 18.19 Mars hours
Tbase = 159.6 K Zbase = 120.5 km
F1 peak = 135.3 km Mol.Wgt. = 42.08
Pressure = 1.925E-03 N/m**2
5.678E-08 7.689E-08 9.700E-08 kg/m**3
-64.3 % -51.6 % -39.0 %
Dens. Pert. = -21.48% Wave = .00% of mean
Eastward Wind (Mean, Perturbed, Total) = .9 -11.6 -10.7 m/s
Northward Wind (Mean, Perturbed, Total) = -30.2 -13.9 -44.1 m/s
...........................................................................
Time (rel. to TO) = 11000.0 sec. ( .124 sols) Ls = 97.1 Dust = .30
Height _ 105.00 km ( 103.79 km)
Latitude _ 33.48 degrees
Sun Latitude = 25.00 deg.
Sun Longitude = 153.38 deg.
Exospheric Temp. = 204.4 K
Solar Zenith Angle = 79.9 deg
Temperature = 128.3 K
Density (Low, Avg., High) =
Departure, COSPAR NH Mean -
Scale Hgt H(p) = 6.99 H(rho) = 6.75 km
Longitude - 58.97 W ( 301.03 E) degrees
Mars Orbital Radius = 1.649 AU
Local Time = 18.29 Mars hours
Tbase = 159.3 K Zbase = 120.6 km
F1 peak = 136.2 km Mol.Wgt. = 41.60
Pressure = 9.645E-04 N/m**2
2.644E-08 3.761E-08 4.877E-08 kg/m**3
-67.0 % -53,1 % -39.1 %
Tot.Dens. = 2.563E-08 kg/m**3 Dens. Pert. = -31.84% Wave = .00% of mean
Eastward Wind (Mean, Perturbed, Total) = -6.8 -38.7 -45.6 m/s
Northward Wind (Mean, Perturbed, Total) = -36.0 3.0 -33.0 m/s
...........................................................................
Time (rel. to TO) = 11500.0 sec. ( .130 sols) Ls = 97.1 Dust = .30
Height _ 110.00 km ( 108.74 km)
Latitude = 33.98 degrees
Sun Latitude = 25.00 deg.
Sun Longitude = 155.41 deg.
Exospheric Temp. - 203.9 K
Solar Zenith Angle = 80.9 deg
Temperature s 132.7 K
Density (Low, Avg., High) =
Scale Hgt H(p) = 7.49 H(rho) = 6.72 km
Longitude = 59.47 W ( 300.53 E) degrees
Mars Orbital Radius = 1.649 AU
Local Time = 18.40 Mars hours
Tbase = 158.9 K Zbase = 120.7 km
F1 Peak = 137.0 km Mol.Wgt. = 41.99
Pressure = 4.779E-04 N/m**2
1.273E-08 1.818E-08 2.364E-08 kg/m**3
32

Departure, COSPAR NH Mean = -69.3 % -56.1% -42.9 %
Tot. Dens. = 1.875E-08 kg/m**3 Dens. Pert. = 3.11% Wave = .00% of mean
Eastward Wind (Mean, Perturbed, Total) = -14.5 5.1 -9.4 m/s
Northward Wind (Mean, Perturbed, Total) = -38.2 -26.2 -64.4 m/s
...........................................................................
Time (rel. to TO) = 12000.0 sec. ( .135 sols) Ls = 97.1 Dust = .30
Height = 115.00 km ( 113.69 km)
Latitude = 34.48 degrees
Sun Latitude = 25.00 deg.
Sun Longitude = 157.44 deg.
Exospheric Temp. = 203.5 K
Solar Zenith Angle = 81.8 deg
Temperature = 142.1 K
Density (Low, Avg., High) =
Departure, COSPAR NH Mean =
Tot. Dens. = 8.655E-09 kg/m**3
Scale Hgt H(p) = 8.18 H(rho) = 7.07 km
Longitude = 59.97 W ( 300.03 E) degrees
Mars Orbital Radius = 1.649 AU
Local Time = 18.50 Mars hours
Tbase = 158.7 K Zbase = 120.7 km
F1 peak = 138.0 km Mol.Wgt. = 41.76
Pressure = 2.477E-04 N/m**2
6.128E-09 8.754E-09 1.138E-08 kg/m**3
-72.1% -60.2 % -48.3 %
Dens. Pert. = -1.13% Wave = .00% of mean
Eastward Wind (Mean, Perturbed, Total) = -19.8 -25.9 -45.7 m/s
Northward Wind (Mean, Perturbed, Total) = -38.7 -50.3 -89.0 m/s
...........................................................................
Time (rel. to TO) = 12500.0 sec. ( .141 sols) Ls = 97.1 Dust = .30
Height = 120.00 km ( 118.64 km)
Latitude = 34.98 degrees
Sun Latitude = 25.00 deg.
Sun Longitude = 159.47 deg.
Exospheric Temp. = 203.0 K
Solar Zenith Angle = 82.8 deg
Temperature = 155.8 K
Density (Low, Avg., High) =
Departure, COSPAR NH Mean =
Scale Hgt H(p) = 9.02 H(rho) = 7.64 km
Longitude = 60.47 W ( 299.53 E) degrees
Mars Orbital Radius = 1.648 AU
Local Time = 18.60 Mars hours
Tbase = 158.4 K Zbase = 120.8 km
F1 peak = 139.0 km Mol.Wgt. = 41.70
Pressure _ 1.357E-04 N/m**2
3.058E-09 4.369E-09 5.680E-09 kg/m**3
-74.3 % -63.3 % -52.3 %
Tot.Dens. = 3.028E-09 kg/m**3 Dens. Pert. = -30.68% Wave = .00% of mean
Eastward Wind (Mean, Perturbed, Total) = -21.3 -14.8 -36.0 m/s
Northward Wind (Mean, Perturbed, Total) = -40.7 -22.6 -63.4 m/s
...........................................................................
Time (rel. to TO) = 13000.0 sec. ( .146 sols) Ls = 97.1 Dust = .30
Height = 125.00 km ( 123.59 km)
Latitude = 35.48 degrees
Sun Latitude = 25.00 deg.
Sun Longitude = 161.50 deg.
Exospheric Temp. = 202.5 K
Solar Zenith Angle = 83.7 deg
Temperature = 171.0 K
Density (Low, Avg., High) =
Departure, COSPAR NH Mean =
Scale Hgt H(p) = 9.88 H(rho) = 8.44 km
Longitude = 60.97 W ( 299.03 E) degrees
Mars Orbital Radius = 1.648 AU
Local Time = 18.70 Mars hours
Tbase = 158.1 K Zbase = 120.9 km
F1 peak = 140.1 km Mol.Wgt. = 41.54
Pressure = 7.856E-05 N/m**2
1.618E-09 2.296E-09 2.974E-09 kg/m**3
-75.6 % -65.4 % -55.1%
Tot.Dens. = 2.607E-09 kg/m**3 Dens. Pert. = 13.53% Wave = .00% of mean
Eastward Wind (Mean, Perturbed, Total) = -19.0 -22.1 -41.0 m/s
Northward Wind (Mean, Perturbed, Total) = -43.7 -3.0 -46.7 m/s
...........................................................................
Time (rel. to TO) = 13500.0 sec. ( .152 sols) Ls = 97.1 Dust = .30
Height _ 130.00 km ( 128.54 km)
Latitude = 35.98 degrees
Sun Latitude = 25.00 deg.
Sun Longitude = 163.52 deg.
Exospheric Temp. = 202.0 K
Solar Zenith Angle = 84.5 deg
Temperature = 185.3 K
Density (Low, Avg., High) =
Departure, COSPAR NH Mean =
Tot. Dens. = 1.374E-09 kg/m**3
Scale Hgt H(p) = 10.73 H(rho) = 9.31 km
Longitude = 61.47 W ( 298.53 E) degrees
Mars Orbital Radius = 1.648 AU
Local Time = 18.80 Mars hours
Tbase = 157.8 K Zbase = 121.0 km
F1 peak = 141.3 km Mol.Wgt. = 41.51
Pressure = 4.776E-05 N/m**2
9.290E-I0 1.287E-09 1.645E-09 kg/m**3
-75.3 % -65.8 % -56.2 %
Dens. Pert. = 6.75% Wave = .00% of mean
Eastward Wind (Mean, Perturbed, Total) = -14.5 -15.7 -30.2 m/s
Northward Wind (Mean, Perturbed, Total) = -48.2 1.8 -46.4 m/s
...........................................................................
Time (rel. to TO) = 14000.0 sec. ( .158 sols) Ls = 97.1 Dust = .30
Height = 135.00 km ( 133.50 km) Scale Hgt H(p) = 11.41H(rho) = i0.01 km
Latitude = 36.48 degrees Longitude = 61.97 W ( 298.03 E) degrees
Sun Latitude = 25.00 deg. Mars Orbital Radius = 1.648 AU
Sun Longitude = 165.55 deg. Local Time = 18.91 Mars hours
Exospheric Temp. = 201.5 K Tbase = 157.5 K Zbase = 121.0 km
33

Solar Zenith Angle = 85.4 deg F1 peak = 142.5 km Mol.Wgt. = 41.29
Temperature - 195.9 K Pressure = 3.024E-05 N/m**2
Density (Low, Avg., High) = 5.784E-I0 7.672E-I0 9.554E-I0 kg/m**3
Departure, COSPAR NH Mean = -69.8 % -59.9 % -50.1%
Tot. Dens. - 7.760E-I0 kg/m**3 Dens. Pert. = 1.15% Wave = .00% of mean
Eastward Wind (Mean, Perturbed, Total) = -9.0 -35.8 -44.8 m/s
Northward Wind (Mean, Perturbed, Total) = -55.6 4.6 -51.0 m/s
Time (rel. to TO) -
Height _ 140.00 km ( 138.45 km)
Latitude - 36.98 degrees
Sun Latitude = 25.00 deg.
Sun Longitude = 167.58 deg.
Exospheric Temp. = 201.0 K
Solar Zenith Angle = 86.2 deg
Temperature = 202.4 K
Density (Low, Avg., High) =
Departure, COSPAR NH Mean =
Tot. Dens. = 5.023E-10 kg/m**3
Eastward Wind (Mean, Perturbed, Total) =
Northward Wind (Mean, Perturbed, Total) =
14500.0 sec. ( .163 sols) Ls = 97.1 Dust = .30
Scale Hgt H(p) = 11.78 H(rho) = 10.69 km
Longitude = 62.47 W ( 297.53 E) degrees
Mars Orbital Radius = 1.648 AU
Local Time = 19.01 Mars hours
Tbase = 157.3 K Zbase = 121.1 km
F1 peak = 144.0 km Mol.Wgt. = 40.76
Pressure = 1.964E-05 N/m**2
3.760E-10 4.767E-10 5.765E-10 kg/m**3
-65.5 % -56.3 % -47.1%
Dens. Pert. = 5.37% Wave = .00% of mean
-3.4 7.9 4.5 m/s
-61.9 -30.1 -92.0 m/s
Time (rel. to T0) =
Height = 145.00 km ( 143.40 km)
Latitude = 37.48 degrees
Sun Latitude = 25.00 deg.
Sun Longitude = 169.61 deg.
Exospheric Temp. = 200.5 K
Solar Zenith Angle = 87.1 deg
Temperature = 205.2 K
Density (Low, Avg., High)
Departure, COSPAR NH Mean =
Tot. Dens. = 2.956E-I0 kg/m**3
Eastward Wind (Mean, Perturbed, Total) =
Northward Wind (Mean, Perturbed, Total) =
15000.0 sec. ( .169 sols) Ls = 97.1 Dust = .30
Scale Hgt H(p) = 12.10 H(rho) = 11.14 km
Longitude = 62.97 W ( 297.03 E) degrees
Mars Orbital Radius = 1.648 AU
Local Time = 19.11 Mars hours
Tbase = 157.0 K Zbase = 121.2 km
F1 peak = 145.6 km Mol.Wgt. = 40.47
Pressure = 1.287E-05 N/m**2
2.485E-I0 3.062E-I0 3.630E-I0 kg/m**3
-64.8 % -56.6 % -48.6 %
Dens. Pert. = -3.47% Wave = .00% of mean
1.8 25.3 27.0 m/s
-70.2 -8.4 -78.5 m/s
Time (rel. to TO) -
Height _ 150.00 km ( 148.43 km)
Latitude = 37.98 degrees
Sun Latitude = 25.00 deg.
Sun Longitude = 171.63 deg.
Exospheric Temp. = 200.0 K
Solar Zenith Angle = 87.9 deg
Temperature = 204.7 K
Density (Low, Avg., High) =
Departure, COSPAR NH Mean =
Tot. Dens. = 1.989E-I0 kg/m**3
Eastward Wind (Mean, Perturbed, Total) =
Northward Wind (Mean, Perturbed, Total) =
15500.0 sec. ( .175 sols) Ls = 97.1 Dust = .30
Scale Hgt H(p) = 12.34 H(rho) = 11.45 km
Longitude = 63.47 W ( 296.53 E) degrees
Mars Orbital Radius = 1.648 AU
Local Time = 19.21 Mars hours
Tbase = 156.8 K Zbase = 121.3 km
F1 peak = 147.3 km Mol.Wgt. = 39.99
Pressure - 8.488E-06 N/m**2
1.642E-I0 1.999E-I0 2.353E-I0 kg/m**3
-65.3 % -57.7 % -50.3 %
Dens. Pert. = -.52% Wave = .00% of mean
7.6 .7 8.3 m/s
-75.7 -1.6 -77.4 m/s
Time (rel. to TO) =
Height = 155.00 km ( 153.45 km)
Latitude = 38.48 degrees
Sun Latitude = 25.00 deg.
Sun Longitude = 173.66 deg.
Exospheric Temp. = 199.4 K
Solar Zenith Angle = 88.6 deg
Temperature = 202.8 K
Density (Low, Avg., High) =
Departure, COSPAR NH Mean =
Tot. Dens. = 1.295E-I0 kg/m**3
16000.0 sec. ( .180 sols) Ls = 97.1 Dust = .30
Scale Hgt H(p) = 12.43 H(rho) = 11.59 km
Lodgitude = 63.97 W ( 296.03 E) degrees
Mars Orbital Radius = 1.648 AU
Local Time = 19.31 _ars hours
Tbase = 156.5 K Zbase = 121.3 km
F1 peak = 149.3 km Mol.Wgt. = 39.44
Pressure = 5.607E-06 N/m**2
1.071E-10 1.313E-I0 1.560E-I0 kg/m**3
-68.2 % -61.0 % -53.7 %
Dens. Pert. = -1.39% Wave = .00% of mean
Eastward Wind (Mean, Perturbed, Total) = 12.0 -2.1 9.9 m/s
Northward Wind (Mean, Perturbed, Total) = -82.6 -2.0 -84.7 m/s
........................................................................ _--
Time (tel. to TO) = 16500.0 sec. ( .186 sols) Ls = 97.1 Dust = .30
Height = 160.00 km ( 158.48 km) Scale Hgt H(p) = 12.56 H(rho) = 11.73 km
Latitude = 38.98 degrees Longitude = 64.47 W ( 295.53 E) degrees
34
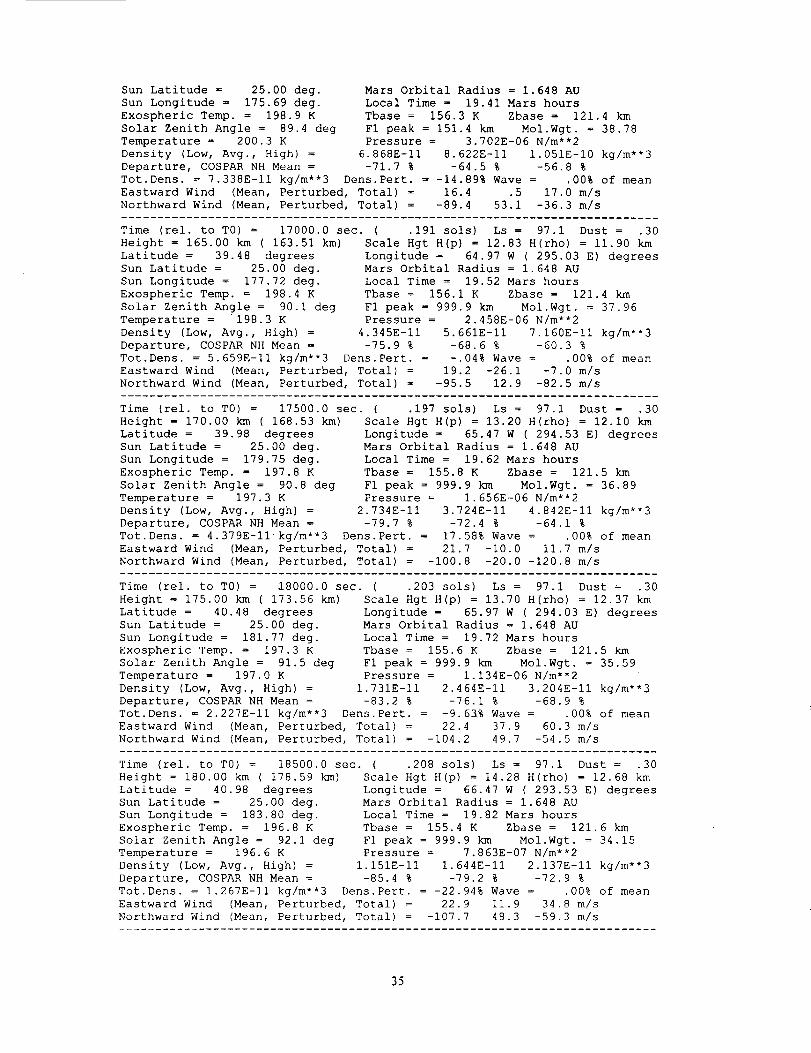
SunLatitude = 25.00 deg.SunLongitude = 175.69 deg.
Exospheric Temp. = 198.9 K
Solar Zenith Angle = 89.4 deg
Temperature = 200.3 K
Density (Low, Avg., High) =
Departure, COSPAR NH Mean =
Tot. Dens. = 7.338E-II kg/m**3
Mars Orbital Radius = 1.648 AU
Local Time = 19.41 Mars hours
Tbase = 156.3 K Zbase = 121.4 km
F1 peak = 151.4 km Mol.Wgt. = 38.78
Pressure = 3.702E-06 N/m**2
6.868E-II 8.622E-II 1.051E-10 kg/m**3
-71.7 % -64.5 % -56.8 %
Dens. Pert. = -14.89% Wave = .00% of mean
Eastward Wind (Mean, Perturbed, Total) = 16.4 .5 17.0 m/s
Northward Wind (Mean, Perturbed, Total) = -89.4 53.1 -36.3 m/s
...........................................................................
Time (rel. to TO) = 17000.0 sec. ( .191 sols) Ls _ 97.1 Dust = .30
Height = 165.00 km ( 163.51 km)
Latitude = 39.48 degrees
Sun Latitude = 25.00 deg.
Sun Longitude = 177.72 deg.
Exospheric Temp. = 198.4 K
Solar Zenith Angle = 90.1 deg
Temperature = 198.3 K
Density (Low, Avg., High) =
Departure, COSPAR NH Mean =
Scale Hgt H(p) = 12.83 H(rho) = 11.90 km
Longitude = 64.97 W ( 295.03 E) degrees
Mars Orbital Radius = 1.648 AU
Local Time = 19.52 Mars hours
Tbase = 156.1 K Zbase = 121.4 km
F1 peak = 999.9 km Mol.Wgt. = 37.96
Pressure = 2.458E-06 N/m**2
4.345E-II 5.661E-II 7.160E-II kg/m**3
-75.9 % -68.6 % -60.3 %
Tot. Dens. = 5.659E-II kg/m**3 Dens. Pert. = -.04% Wave = .00% of mean
Eastward Wind (Mean, Perturbed, Total) = 19.2 -26.1 -7.0 m/s
Northward Wind (Mean, Perturbed, Total) _ -95.5 12.9 -82.5 m/s
...........................................................................
Time (rel. to TO) _ 17500.0 sec. ( .197 sols) Ls = 97.1 Dust = .30
Height = 170.00 km ( 168.53 km)
Latitude = 39.98 degrees
Sun Latitude = 25.00 deg.
Sun Longitude = 179.75 deg.
Exospheric Temp. = 197.8 K
Solar Zenith Angle = 90.8 deg
Temperature = 197.3 K
Density (Low, Avg., High) =
Departure, COSPAR NH Mean =
Scale Hgt H(p) = 13.20 H(rho) = 12.10 km
Longitude = 65.47 W ( 294.53 E) degrees
Mars Orbital Radius = 1.648 AU
Local Time = 19.62 Mars hours
Tbase = 155.8 K Zbase = 121.5 km
F1 peak = 999.9 km Mol.Wgt. = 36.89
Pressure = 1.656E-06 N/m**2
2.734E-II 3.724E-II 4.842E-II kg/m**3
-79.7 % -72.4 % -64.1 %
Tot. Dens. = 4.379E-II kg/m**3 Dens. Pert. _ 17.58% Wave = .00% of mean
Eastward Wind (Mean, Perturbed, Total) = 21.7 -10.0 11.7 m/s
Northward Wind (Mean, Perturbed, Total) = -100.8 -20.0 -120.8 m/s
...........................................................................
Time (rel. to T0) = 18000.0 sec. ( .203 sols) Ls = 97.1 Dust = .30
Height = 175.00 km ( 173.56 km)
Latitude = 40.48 degrees
Sun Latitude = 25.00 deg.
Sun Longitude = 181.77 deg.
Exospheric Temp. = 197.3 K
Solar Zenith Angle = 91.5 deg
Temperature = 197.0 K
Density (Low, Avg., High) =
Departure, COSPAR NH Mean =
Tot. Dens. = 2.227E-II kg/m**3
Eastward Wind (Mean, Perturbed, Total) = 22.4
Northward Wind (Mean, Perturbed, Total) = -104.2
Scale Hgt H(p) = 13.70 H(rho) = 12.37 km
Longitude = 65.97 W ( 294.03 E) degrees
Mars Orbital Radius = 1.648 AU
Local Time = 19.72 Mars hours
Tbase = 155.6 K Zbase = 121.5 km
F1 peak = 999.9 km Mol.Wgt. = 35.59
Pressure = 1.134E-06 N/m**2
1.731E-II 2.464E-II 3.204E-II kg/m**3
-83.2 % -76.1% -68.9 %
Dens. Pert. = -9.65% Wave = .00% of mean
37.9 60.3 m/s
49.7 -54.5 m/s
Time (rel. to TO) =
Height = 180.00 km ( 178.59 km)
Latitude = 40.98 degrees
Sun Latitude = 25.00 deg.
Sun Longitude = 183.80 deg.
Exospheric Temp. = 196.8 K
Solar Zenith Angle = 92.1 deg
Temperature = 196.6 K
Density (Low, Avg., High) =
Departure, COSPAR NH Mean =
Tot. Dens. = 1.267E-II kg/m**3
Eastward Wind (Mean, Perturbed, Total) = 22.9
Northward Wind (Mean, Perturbed, Total) = -107.7
18500.0 sec. ( .208 sols) Ls = 97.1 Dust = .30
Scale Hgt H(p) = 14.28 H(rho) = 12.68 km
Longitude = 66.47 W ( 293.53 E) degrees
Mars Orbital Radius = 1.648 AU
Local Time = 19.82 Mars hours
Tbase = 155.4 K Zbase = 121.6 km
F1 peak = 999.9 km Mol.Wgt. = 34.15
Pressure = 7.863E-07 N/m**2
1.151E-f1 1.644E-II 2.137E-II kg/m**3
-85.4 % -79.2 % -72.9 %
Dens. Pert. = -22.94% Wave = .00% of mean
11.9 34.8 m/s
48.3 -59.3 m/s
35

Time (rel. to TO) =
Height z 185.00 km ( 183.62 km)
Latitude - 41.48 degrees
Sun Latitude = 25.00 deg.
Sun Longitude = 185.83 deg.
Exospheric Temp. = 196.2 K
Solar Zenith Angle = 92.7 deg
Temperature - 196.1 K
Density (Low, Avg., High) =
Departure, COSPAR NH Mean =
19000.0 sec. ( .214 sols) Ls _ 97.1 Dust = .30
Scale Hgt H(p) = 14.97 H(rho) = 13.06 km
Longitude = 66.97 W ( 293.03 E) degrees
Mars Orbital Radius = 1.648 AU
Local Time = 19.92 Mars hours
Tbase = 155.2 K Zbase = 121.6 km
F1 peak = 999.9 km Mol.Wgt. = 32.60
Pressure = 5.535E-07 N/m**2
7.748E-12 1.107E-If 1.439E-II kg/m**3
-87.3 % -81.9 % -76.5 %
Tot. Dens. = 6.672E-12 kg/m**3 Dens. Pert. = -39.73% Wave = .00% of mean
Eastward Wind (Mean, Perturbed, Total) = 23.3 -27.4 -4.1 m/s
Northward Wind (Mean, Perturbed, Total) = -iii.i 8.6 -102.5 m/s
...........................................................................
Time (rel. to TO) _ 19500.0 sec. ( .220 sols) Ls = 97.1 Dust = .30
Height = 190.00 km ( 188.65 km)
Latitude - 41.98 degrees
Sun Latitude = 25.00 deg.
Sun Longitude = 187.86 deg.
Exospheric Temp. = 195.7 K
Solar Zenith Angle = 93.3 deg
Temperature = 195.6 K
Density (Low, Avg., High) =
Departure, COSPAR NH Mean
Tot. Dens. - 6.191E-12 kg/m**3
Scale Hgt H(p) = 15.77 H(rho) = 13.51 km
Longitude _ 67.47 W ( 292.53 E) degrees
Mars Orbital Radius = 1.648 AU
Local Time = 20.03 Mars hours
Tbase = 155.1 K Zbase = 121.7 km
F1 peak = 999.9 km Mol.Wgt. = 30.95
Pressure z 3.958E-07 N/m**2
5.275E-12 7.535E-12 9.796E-12 kg/m**3
-88.9 % -84.1% -79.3 %
Dens. Pert. = -17.85% Wave = .00% of mean
Eastward Wind (Mean, Perturbed, Total) = 23.5 -22.1 1.4 m/s
Northward Wind (Mean, Perturbed, Total) = -114.6 -7.3 -122.0 m/s
...........................................................................
Time (rel. to T0) = 20000.0 sec. ( .225 sols) Ls = 97.1 Dust = .30
Height = 195.00 km ( 193.68 km)
Latitude = 42.48 degrees
Sun Latitude'= 24.99 deg.
Sun Longitude = 189.88 deg.
Exospheric Temp. _ 195.2 K
Solar Zenith Angle = 93.9 deg
Temperature - 195.1 K
Density (Low, Avg., High) =
Departure, COSPAR NH Mean
Tot. Dens. = 4.450E-12 kg/m**3
Scale Hgt H(p) = 16.68 H(rho) = 14.04 km
Longitude = 67.97 W ( 292.03 E) degrees
Mars Orbital Radius = 1.648 AU
Local Time = 20.13 Mars hours
Tbase = 154.9 K Zbase = 121.7 km
F1 peak = 999.9 km Mol.Wgt. = 29.27
Pressure = 2.877E-07 N/m**2
3.635E-12 5.193E-12 6.751E-12 kg/m**3
-90.2 % -86.0 % -81.8 %
Dens. Pert. = -14.32% Wave = .00% of mean
Eastward Wind (Mean, Perturbed, Total) = 23.5 6.6 30.1 m/s
Northward Wind (Mean, Perturbed, Total) = -118.2 -10.9 -129.1 m/s
36

Appendix D
Summary of Files Provided with Mars-GRAM 2000
Mars-GRAM 2000 Version 1 directory on the FTP server contains the
following files:
marsgram.hst -
marsfix.txt -
marsgram.f -
dumytraj.f -
marssubs.f -
setup.f
ARCHGTS.DAT -
COSPAR.DAT -
input.std
listmg2k.txt -
headers.txt -
READMEI.txt -
README2.txt -
README3.txt -
xycodes.txt -
makebin.f
history file summarizing various versions and changes
history of minor code changes since first posting of Version 1
source code for the "stand alone" version main program
source code for the dummy trajectory version main program
subroutines used by both marsgram and dumytraj versions
setup subroutines used by both marsgram and dumytraj versions
data file for low resolution Ames GCM topographic heights
data file for the COSPAR reference model atmosphere
commented test input file for reference case
list output file for reference case
list of plotable output files and file header definitions
this general program introduction file
discussion of the dumytraj.f dummy trajectory program
discussion of the MGCM and MTGCM input data files
list of x-y plot codes (also given below)
program to read ASCII version MGCM and MTGCM data files
and write out binary version (for faster reading on user
machine)
sfc05xxy.txt - MGCM boundary layer data at 5m height for dust optical
depths 0.3, 1.0, and 3.0 (xx = 03, i0, 30), version
number y
sfc30xxy.txt - MGCM boundary layer data at 30m height for 3 dust optical
depths xx, version number y
tpdloxxyotxt - MGCM 0-80 km temperature, pressure, and density data for
3 dust optical depths xx
uvloxxy.txt - MGCM 0-80 km EW wind and NS wind data for 3 dust optical
depths xx, version number y
tpdhixxy.t×t - MTGCM 80-170 km temperature, pressure, and density data for
3 dust optical depths xx, version number y
uvhixxy.txt - MTGCM 80-170 km EW wind and NS wind data for 3 dust optical
depths xx, version number y
zfhgtsy.txt - Height ZF of 1.26 nbar level for all dust optical depths,
version number y
Plotable output files can be generated with data given versus
several selected parameters. Generation of LIST file output and
plotable output files is controlled by the value of iup on input.
For Mars-GRAM 2000, a number of plotable output files are generated,
each containing several parameters suitable for plotting. These
plotable files have headers to help identify parameters in the files.
File names and definitions of headers are given in the file headers.txt.
Plotable x and y parameters and their code values are as follows:
Values of x-code and y-code for Mars-GRAM plotable output files
Code Parameter
Height (above reference ellipsoid, km)
Height (above local terrain, km)
Latitude (degrees)
Longitude (deg.), West positive if LonEW=0. East positive if LonEW=l
Time from start (Earth seconds)
Time from start (Martian Sols)
37

7 Areocentric Longitude of Sun, Ls (degrees)
8 Local Solar Time (Mars hours = 1/24 Sols)
9 Pressure (mb)
To compile marsgram and dumytraj under UNIX, to produce executable
files marsgram.x and dumytraj.x, you can use the commands:
f77 -o marsgram, x marsgram.f marssubs.f setup.f
and
f77 -o dumytraj.x dumytraj.f marssubs.f setup.f
To compile marsgram and dumytraj under PC-DOS (for example, with
Microsoft FORTRAN Powerstation), to produce executable files
marsgram.exe and dumytraj.exe, you can use the commands:
f132 marsgram, f marssubs.f setup.f
and
f132 dumytraj.f marssubs.f setup.f
38
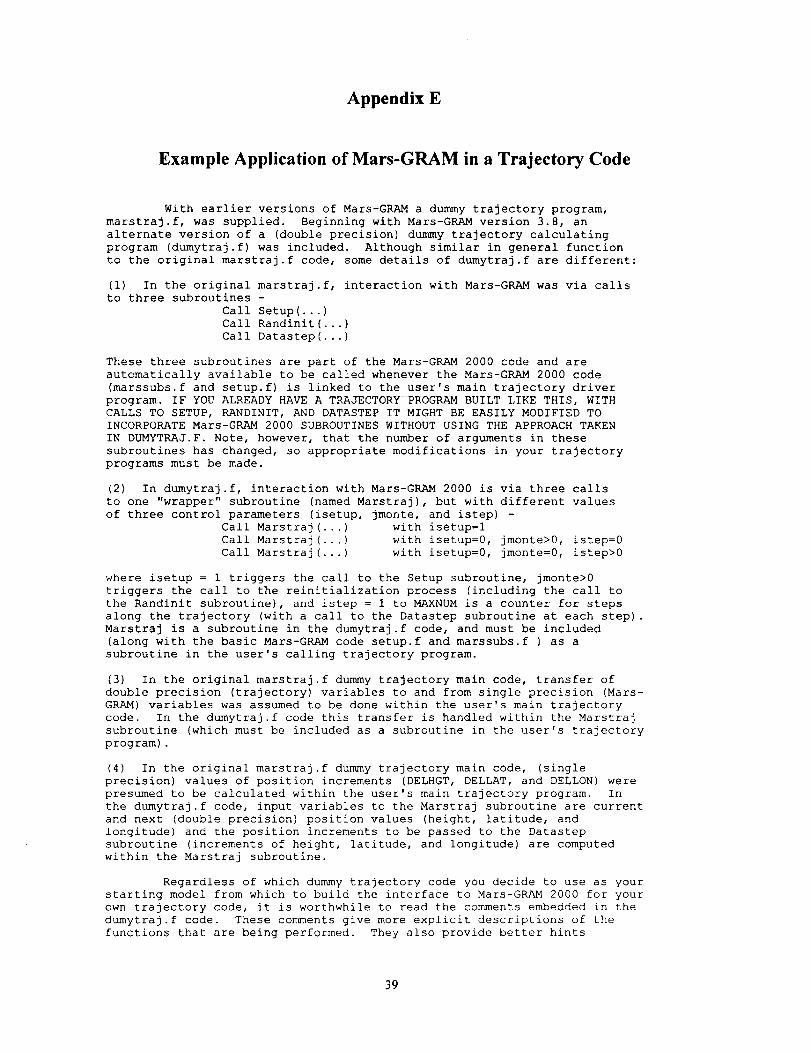
Appendix E
Example Application of Mars-GRAM in a Trajectory Code
With earlier versions of Mars-GRAM a dummy trajectory program,
marstraj.f, was supplied. Beginning with Mars-GRAM version 3.8, an
alternate version of a (double precision) dummy trajectory calculating
program (dumytraj.f) was included. Although similar in general function
to the original marstraj.f code, some details of dumytraj.f are different:
(i) In the original marstraj.f, interaction with Mars-GRAM was via calls
to three subroutines -
Call Setup(...)
Call Randinit(...)
Call Datastep(...)
These three subroutines are part of the Mars-GRAM 2000 code and are
automatically available to be called whenever the Mars-GRAM 2000 code
(marssubs.f and setup.f) is linked to the user's main trajectory driver
program. IF YOU ALREADY HAVE A TRAJECTORY PROGRAM BUILT LIKE THIS, WITH
CALLS TO SETUP, RANDINIT, AND DATASTEP IT MIGHT BE EASILY MODIFIED TO
INCORPORATE Mars-GRAM 2000 SUBROUTINES WITHOUT USING THE APPROACH TAKEN
IN DUMYTRAJ.F. Note, however, that the number of arguments in these
subroutines has changed, so appropriate modifications in your trajectory
programs must be made.
(2) In dumytraj.f, interaction with Mars-GRAM 2000 is via three calls
to one "wrapper" subroutine (named Marstraj), but with different values
of three control parameters (isetup, jmonte, and istep) -
Call Marstraj ...) with isetup=l
Call Marstraj ...) with isetup=0, jmonte>0, istep=0
Call Marstraj ...) with isetup=0, jmonte=0, istep>0
where isetup = 1 triggers the call to the Setup subroutine, jmonte>0
triggers the call to the reinitialization process (including the call to
the Randinit subroutine), and istep = i to MAXNUM is a counter for steps
along the trajectory (with a call to the Datastep subroutine at each step).
Marstraj is a subroutine in the dumytraj.f code, and must be included
(along with the basic Mars-GRAM code setup.f and marssubs.f ) as a
subroutine in the user's calling trajectory program.
(3) In the original marstraj.f dummy trajectory main code, transfer of
double precision (trajectory) variables to and from single precision (Mars-
GRAM) variables was assumed to be done within the user's main trajectory
code. In the dumytraj.f code this transfer is handled within the Marstraj
subroutine (which must be included as a subroutine in the user's trajectory
program).
(4) In the original marstraj.f dummy trajectory main code, (single
precision) values of position increments (DELHGT, DELLAT, and DELLON) were
presumed to be calculated within the user's main trajectory program. In
the dumytraj.f code, input variables to the Marstraj subroutine are current
and next (double precision) position values (height, latitude, and
longitude) and the position increments to be passed to the Datastep
subroutine (increments of height, latitude, and longitude) are computed
within the Marstraj subroutine.
Regardless of which dummy trajectory code you decide to use as your
starting model from which to build the interface to Mars-GRAM 2000 for your
own trajectory code, it is worthwhile to read the comments embedded in the
dumytraj.f code. These comments give more explicit descriptions of the
functions that are being performed. They also provide better hints
39

about what to do if you are using predictor-corrector (or other) trajectory
approaches that require mid-point corrections along trajectory steps and/or
the use of density variations that occur within each trajectory step.
Another feature of dumytraj.f is that it allows high precision
Mars ephemeris values for sun latitude, longitude, and Ls angle to be
passed from the trajectory program for use by Mars-GRAM 2000 subroutines.
40

Appendix F
Details of MGCM and MTGCM Data Files
ASCII format MGCM and MTGCM data files are provided, each having values for
amplitudes and phases of diurnal (24-hour period) and semi-diurnal (12-hour
period) components. Generically, the amplitudes and phases are:
A0 = Diurnal mean value of the given parameter
A1 = Amplitude of the diurnal tide component
phil = Phase (local time in hours) of the diurnal component
A2 = Amplitude of the semi-diurnal tide component
phi2 = phase (local time in hours) of the semi-diurnal component
Tidal values for each parameter are computed from the relation
Tide=AO+Al*Cos((pi/12)*(time-phil))+A2*Cos((pi/6)*(time-phi2))
where time is the local solar time in hours.
For temperature and wind components, the data files give amplitudes in
the same units as those of the parameter (K for temperature or m/s for wind).
For pressure and density, the data files give amplitudes in units of percent
of the mean value (A0). A0 values for pressure are N/m**2. A0 values for
density are kg/m**3.
For each of three values of dust optical depth, two MGCM boundary layer
data files are provided (in ASCII format):
sfc05xxy.txt - MGCM boundary layer data at 5m height for dust optical
depths 0.3, 1.0, and 3.0 (xx = 03, 10, 30), version number y
sfc30xxy.txt - MGCM boundary layer data at 30m height for 3 dust optical
depths xx, version number y
Each record of these files contains Ls value, latitude, longitude, and tidal
coefficients (A0, AI, phil, A2, phi2) for temperature, and for EW wind and
NS wind components.
For each of the same three dust opticaldepths, two ASCII format files
of MGCM 0 to 80 km data are provided:
tpdloxxy.txt - MGCM 0 to 80 km temperature, pressure, and density data for
3 dust optical depths xx, version number y
uvloxxy.txt - MGCM 0 to 80 km EW wind and NS wind data for 3 dust optical
depths xx, version number y
Each record of the tpdloxx.txt files contains Ls value, height, latitude,
and tidal coefficients for temperature and pressure. Only the A0 coefficient
is given for density. Tidal variations in density are computed from those
for pressure and temperature by the perfect gas law relation. Each record
of the uvloxx.txt files contains Ls value, height, latitude, and tidal
coefficients for the Eastward and Northward wind components.
For each of the same three dust optical depths, two ASCII format files
of MTGCM 80 to 170 km data are provided:
tpdhixxy.txt - MTGCM 80 to 170 km temperature, pressure, and density data for
3 dust optical depths xx, version number y
uvhixxy.txt - MTGCM 80 to 170 km EW wind and NS wind data for 3 dust optical
depths xx, version number y
Each record of the tpdhixx.txt files contains Ls value, height, latitude,
and tidal coefficients for temperature, pressure, and density. Because of
41

height variations in molecular weight, tidal coefficients are retained for
all three of these thermodynamic components. Each record of the uvhixx.txt
files contains Ls value, height, latitude, and tidal coefficients for the
Eastward and Northward wind components.
A single file, zfhgtsy.txt, provides tidal coefficient information
for altitude ZF, the height of the 1.26 nbar level, for all dust optical
depths, version number y. Each record of this file contains dust optical
depth, Ls, latitude, and tidal coefficient values.
Source code (makebin.f) is also provided for a program to read the ASCII
format MGCM and MTGCM data files and write them out in binary format. After
this ASCII-to-binary conversion is once completed, subsequent reading of the
binary format files significantly shortens the time required to initialize
Mars-GRAM 2000 on each run.
42


REPORT DOCUMENTATION PAGE Fo,_ ApprovedOMB No. 0704-0188
Public reporting burden for this ¢o/isctlon of Information is estimated to average 1 hour per respoe,se, ir_uding the time for revtewlng klstruct_ns, Narchlng existing data sources,gathering and rnaintainklg the data needed, and completing and reviewing Ihe coflection of lnfon'naUon. Send comments regarding this burden esUmets or any other aspect of thiscollec_on of informaSon, including imggertlons for reducing _ burden, to Washington Headquarters Services. Directorate for Information Opetatioeb and Reports. 1215 JeffersonDavis Highway. Suite 1204, Arington. VA 22202-4302, and to the Office of Management and BtMget. Paperwork Reduction Project {0704-0188). Washington. DC 20503
1. AGENCY USE ONLY (Leave Blank) 2. REPORT DATE 3. REPORT TYPE AND DATES COVERED
May 2000 Technical Memorandum4. TITLE AND SUBTITLE 5. FUNDING NUMBERS
Mars Global Reference Atmospheric Model 2000 Version(Mars-GRAM 2000): Users Guide
6. AUTHORS
e.G. Justus* and B.F. James
7. PERFORMINGORGANIZATIONNAMES(S)ANDADDRESS0ES)
George C. Marshall Space Flight Center
Marshall Space Flight Center, AL 35812
9. SPONSORING/MONFrORINGAGENCYNAME(S)ANDADDRESS(ES)
National Aeronautics and Space Administration
Washington, DC 20546-0001
NAS8--60000
8. PERFORMING ORGANIZATIONREPORT NUMBER
M-980
10. SPONSORING/MONITORINGAGENCY REPORT NUMBER
NASA/TM--2000-210279
11. SUPPLEMENTARY NOTES
Prepared by Environments Group, Engineering Systems Department, Engineering Directorate
*Computer Sciences Corporation1211. DISTRIBUTION/AVAILABILITY STATEMENT 12b. DISTRIBUTION CODE
Unclassified-Unlimited
Subject Category 18Nonstandard Distribution
13. ABSTRACT (Maximum 200 words)
This report presents Mars Global Reference Atmospheric Model 2000 Version (Mars-GRAM 2000) and its
new features. All parameterizations for temperature, pressure, density, and winds versus height, latitude,longitude, time of day, and Ls have been replaced by input data tables from NASA Ames Mars GeneralCirculation Model (MGCM) for the surface through 80-km altitude and the University of Arizona MarsThermospheric General Circulation Model (MTGCM) for 80 to 170 km. A modified Stewart thermosphericmodel is still used for higher altitudes and for dependence on solar activity. "Climate factors" to tune for
agreement with GeM data are no longer needed. Adjustment of exospheric temperature is still an option.Consistent with observations from Mars Global Surveyor, a new longitude-dependent wave model isincluded with user input to specify waves having 1 to 3 wavelengths around the planet. A simplified
perturbation model has been substituted for the earlier one. An input switch allows users to select either Eastor West longitude positive. This memorandum includes instructions on obtaining Mars-GRAM source codeand data files and for running the program. It also provides sample input and output and an example forincorporating Mars-GRAM as an atmospheric subroutine in a trajectory code.
14. SUBJECT TERMS
Mars Global Reference Atmospheric Model, Mars-GRAM, Atmospherici Density, Atmospheric Temperature, Atmospheric Models, Winds
17. SECURITY CLASSIFICATION 18. SECURITY CLASSIFICATION 19. SECURITY CLASSIFICATIONOF REPORT OF THIS PAGE OF ABSTRACT
Unclassified Unclassified Unclassified
NSN 7540-01-280-5500
15. NUMBER OF PAGES
4818. PRICE CODE
A0320.uMrrATIONOFABSTRACT
Unlimited
Standard Form 298 {Rev_ 2-89)Prescribedby ANSI Sld 239-18298-102