marquette university financial overview€¦ · viability of its financial position by increasing...
TRANSCRIPT

FINANCIAL OVERVIEWSEPTEMBER 2015
MARQUETTE UNIVERSITY

2015 Highlights• External Audit Results
• Unmodified opinion of the financial statements by KPMG, our external auditors• No material weaknesses or significant internal control deficiencies• The results of the 403 (b) retirement plan audit successfully met the requirements of the DOL• Coleman & Williams, LTD, our external auditors for the plan, had no audit adjustments or findings
• Financial Results• Maintained our positive A2 credit rating with Moody’s• Cash Investments increased to $99 million or $13 million more than the previous fiscal year• Debt decreased from $235 million to $204 million primarily due to a $21 million pledge prepayment• Endowment ended the year at $545 million with a fund return of 2.7%• The university finished the year with a $11.5 million Net Operating Income
• Financial Achievements• Permanently budgeted an Innovation Fund of $2 million ($1 million each in operating and capital)• Created a $9 million contingency fund• Acquired 9 acres of land on Michigan; demolished 5 buildings; completed the Jesuit Residence• Began the Master Plan Process

Financial Profile
External Benchmark 2008 2010 2012
Moody’s Credit Rating of A2 A2 A2 A2
• Strengths: faith based comprehensive institution, strong philanthropic support, conservative debt profile and balanced operating performance
• Weaknesses: strong competition from low cost public universities, limited revenue diversity, competitive challenges in a regional market, and continuing decline in freshman matriculation rates

Financial Profile Continued
• Strengths: stable and conservative debt management
• Weaknesses: Resource sufficiency (endowment size and operating results are below average)
Internal Benchmark FY12 FY13 FY14 FY15
Composite Financial Index 2.65 2.80 4.26 TBD
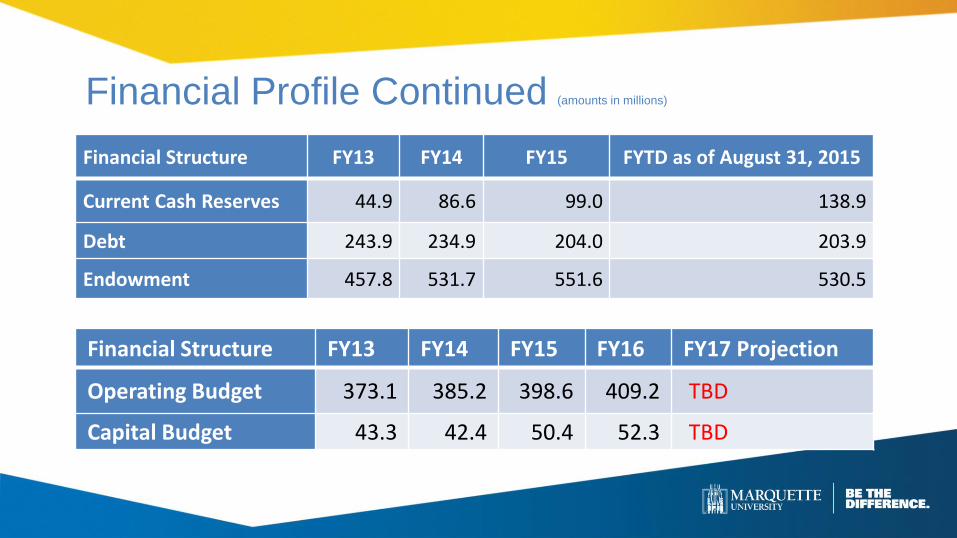
Financial Profile Continued (amounts in millions)
Financial Structure FY13 FY14 FY15 FYTD as of August 31, 2015
Current Cash Reserves 44.9 86.6 99.0 138.9
Debt 243.9 234.9 204.0 203.9
Endowment 457.8 531.7 551.6 530.5
Financial Structure FY13 FY14 FY15 FY16 FY17 Projection
Operating Budget 373.1 385.2 398.6 409.2 TBD
Capital Budget 43.3 42.4 50.4 52.3 TBD

Financial Management• Operating Budget
• Balanced budget philosophy• Principal operational revenues: net tuition revenue, room &board, auxiliaries, gifts, investment/endowment
income• Principal operational expenses: compensation, discretionary and non-discretionary
• Capital Budget• Balanced budget philosophy• Debt payments, books and periodicals, technology, renewal• Funded (gifts, grants, debt) and Unfunded (depreciation)
• Key Cost Drivers in higher education• Labor (24/7 operation)• Capital Assets (71 buildings, equipment)• Technology• Regulatory environment
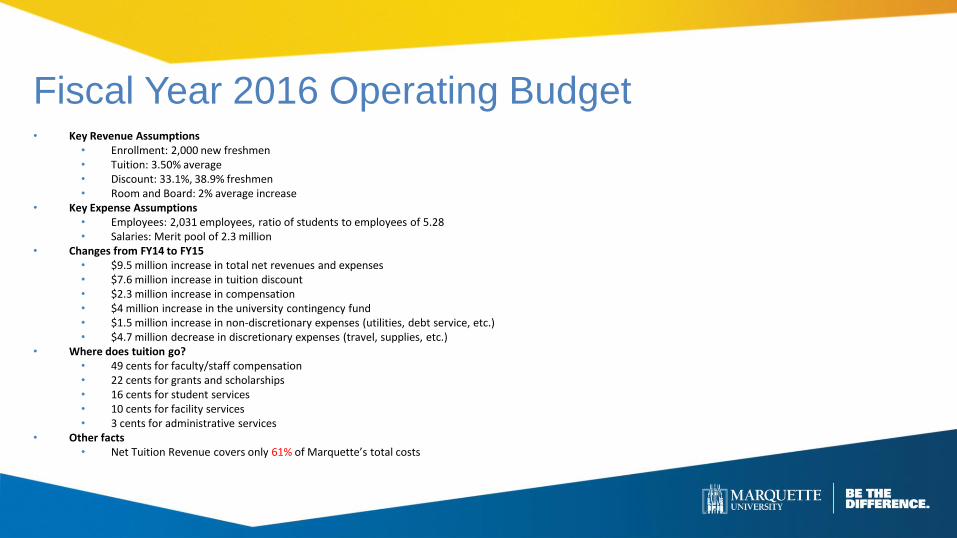
Fiscal Year 2016 Operating Budget• Key Revenue Assumptions
• Enrollment: 2,000 new freshmen• Tuition: 3.50% average • Discount: 33.1%, 38.9% freshmen• Room and Board: 2% average increase
• Key Expense Assumptions• Employees: 2,031 employees, ratio of students to employees of 5.28• Salaries: Merit pool of 2.3 million
• Changes from FY14 to FY15• $9.5 million increase in total net revenues and expenses• $7.6 million increase in tuition discount • $2.3 million increase in compensation• $4 million increase in the university contingency fund• $1.5 million increase in non-discretionary expenses (utilities, debt service, etc.)• $4.7 million decrease in discretionary expenses (travel, supplies, etc.)
• Where does tuition go?• 49 cents for faculty/staff compensation• 22 cents for grants and scholarships• 16 cents for student services• 10 cents for facility services• 3 cents for administrative services
• Other facts• Net Tuition Revenue covers only 61% of Marquette’s total costs

FY15 to FY16 Operating Budget
Net Tuition & Fees $243,955 Compensation $245,915
Room & Board 42,835 Other Operating
Grants 40,375 Expenditures $106,850
Contributions 17,400 Interest 9,630
Investment Income 250 Depreciation 27,720
Endowment Income 15,360 Contingency 8,000
Other Income 39,490 Provost Contingency Fund 1,000
Total $399,665 Opportunity Fund 550
Total $399,665
Net Tuition & Fees $249,640 Compensation $250,830
Room & Board 45,310 Other Operating
Grants 40,210 Expenditures 109,350
Contributions 17,400 Interest 9,220
Investment Income 265 Depreciation 28,220
Endowment Income 15,820 Contingency and SIP 10,000
Other Income 40,525 Opportunity Fund 550
Total $409,170 Provost Contingency Fund 1,000
Total $409,170
Proposed Fiscal Year 2016
Revenues Expenditures
Fiscal Year 2015
Revenues Expenditures
61.0%10.7%
10.1%
4.4%
0.1%
3.8%
9.9%
61.0%11.1%
9.8%
4.2%
0.1%
3.9%9.9%
61.3%
26.7%
2.3%
6.9%
2.5%0.2%
0.1%
61.5%
26.7%
2.4%
7.0%2.0%
0.3%
0.1%

Capital Budget

Fiscal Challenges• Economic Impact Issues
• Parents and students (accessibility, affordability, debt burdens)• Donor giving and alumni support (gifts)• Decreasing governmental financial support (research and student aid) and increasing government oversight (compliance,
regulations, restrictions)
• Strategic Issues• Develop comprehensive vision, goals and plan• Clarity of fundraising priorities• Size of endowment• Academic program quality and research (graduate education, start-up funds)
• Revenue Challenges• Enrollment• Decreasing tuition margin and increasing unfunded discount• Decreased investment and endowment income• Decreasing government grants and annual contributions
• Expense Challenges• Compensation levels / Health care costs • Building renewal and technology• Operational budgets

Financial GoalsWith the commencement of a major strategic planning effort, the university has an opportunity to improve the viability of its financial position by increasing cash reserves and providing permanent funding sources for the strategic planning initiatives. To do so, the university adopted two specific 5-7 year financial goals and strategies beginning in FY14:
• Financial Viability – focus on increasing available financial resources relative to other private Catholic colleges and universities
• Increase its cash reserves to provide adequate resources for strategic purposes:• Capital improvements
• Fund land acquisitions
• Fund quasi-endowment
• Fund the Strategic Plan – create a pool of resources that will be available to permanently fund the strategic priorities of the university through the following strategies:
• Diversifying and increasing revenue streams
• Reallocation of resources
• Developing new programmatic initiatives
